
A Methodological Approach to Use Contextual Factors for Epidemiological Studies on Chronic Exposure to Air Pollution and COVID-19 in Italy

 , , ,
, , ,  , and
, and
Abstract
:1. Introduction
2. Materials and Methods
2.1. Variables Selection
2.2. Statistical Analysis
3. Results
4. Discussion
5. Conclusions
Supplementary Materials
Author Contributions
Funding
Institutional Review Board Statement
Informed Consent Statement
Data Availability Statement
Acknowledgments
Conflicts of Interest
Appendix A
References
- Health Effects Institute. State of Global Air 2020. A Special Report on Global Exposure to Air Pollution and Its Health Impacts; Health Effects Institute: Boston, MA, USA, 2020. [Google Scholar]
- Global burden of 87 risk factors in 204 countries and territories, 1990-2019: A systematic analysis for the Global Burden of Disease Study 2019. Lancet 2020, 396, 1223–1249. [CrossRef]
- Thurston, G.D.; Kipen, H.; Annesi-Maesano, I.; Balmes, J.; Brook, R.D.; Cromar, K.; De Matteis, S.; Forastiere, F.; Forsberg, B.; Frampton, M.W.; et al. A joint ERS/ATS policy statement: What constitutes an adverse health effect of air pollution? An analytical framework. Eur. Respir. J. 2017, 49, 1600419. [Google Scholar] [CrossRef] [PubMed] [Green Version]
- Schraufnagel, D.E.; Balmes, J.R.; Cowl, C.T.; De Matteis, S.; Jung, S.H.; Mortimer, K.; Perez-Padilla, R.; Rice, M.B.; Riojas-Rodriguez, H.; Sood, A.; et al. Air Pollution and Noncommunicable Diseases: A Review by the Forum of International Respiratory Societies’ Environmental Committee, Part 1: The Damaging Effects of Air Pollution. Chest 2019, 155, 409–416. [Google Scholar] [CrossRef] [PubMed] [Green Version]
- Update of the WHO Global Air Quality Guidelines: Systematic Reviews. Available online: https://www.sciencedirect.com/journal/environment-international/special-issue/10MTC4W8FXJ (accessed on 14 January 2022).
- World Health Organization. WHO Global Air Quality Guidelines: Particulate Matter (PM2.5 and PM10), Ozone, Nitrogen Dioxide, Sulfur Dioxide and Carbon Monoxide. World Health Organization. 2021. Available online: https://apps.who.int/iris/handle/10665/345329 (accessed on 14 January 2022).
- Chen, J.; Hoek, G. Long-term exposure to PM and all-cause and cause-specific mortality: A systematic review and meta-analysis. Env. Int. 2020, 143, 105974. [Google Scholar] [CrossRef]
- Huangfu, P.; Atkinson, R. Long-term exposure to NO2 and O3 and all-cause and respiratory mortality: A systematic review and meta-analysis. Environ. Int. 2020, 144, 105998. [Google Scholar] [CrossRef] [PubMed]
- Guan, W.J.; Liang, W.H.; Zhao, Y.; Liang, H.R.; Chen, Z.S.; Li, Y.M.; Liu, X.Q.; Chen, R.C.; Tang, C.L.; Wang, T.; et al. Comorbidity and its impact on 1590 patients with COVID-19 in China: A nationwide analysis. Eur. Respir. J. 2020, 55, 2000547. [Google Scholar] [CrossRef] [PubMed] [Green Version]
- Andersen, Z.J.; Hoffmann, B.; Morawska, L.; Adams, M.; Furman, E.; Yorgancioglu, A.; Greenbaum, D.; Neira, M.; Brunekreef, B.; Forastiere, F.; et al. Air pollution and COVID-19: Clearing the air and charting a post-pandemic course: A joint workshop report of ERS, ISEE, HEI and WHO. Eur. Respir. J. 2021, 58, 2101063. [Google Scholar] [CrossRef] [PubMed]
- Yang, J.; Zheng, Y.; Gou, X.; Pu, K.; Chen, Z.; Guo, Q.; Ji, R.; Wang, H.; Wang, Y.; Zhou, Y. Prevalence of comorbidities and its effects in patients infected with SARS-CoV2: A systematic review and meta-analysis. Int. J. Infect. Dis. 2020, 94, 91–95. [Google Scholar] [CrossRef] [PubMed]
- Wu, Z.; McGoogan, J.M. Characteristics of and Important Lessons from the Coronavirus 9 Disease 2019 (COVID-19) Outbreak in China: Summary of a Report of 72,314 Cases From 10 the Chinese Center for Disease Control and Prevention. JAMA 2020, 323, 1239–1242. [Google Scholar] [CrossRef] [PubMed]
- Ciencewicki, J.; Jaspers, I. Air pollution and respiratory viral infection. Inhal. Toxicol. 2007, 19, 1135–1146. [Google Scholar] [CrossRef] [PubMed]
- Bourdrel, T.; Annesi-Maesano, I.; Alahmad, B.; Maesano, C.N.; Bind, M.A. The impact of outdoor air pollution on COVID-19: A review of evidence from in vitro, animal, and human studies. Eur. Respir. Rev. 2021, 30, 200242. [Google Scholar] [CrossRef] [PubMed]
- Cole, M.; Ozgen, C.; Strobl, E. Air Pollution Exposure and Covid-19 in Dutch Municipalities. Env. Resour. Econ. 2020, 76, 581–610. [Google Scholar] [CrossRef] [PubMed]
- Konstantinoudis, G.; Padellini, T.; Bennett, J.; Davies, B.; Ezzati, M.; Blangiardo, M. Long-term exposure to air-pollution and COVID-19 mortality in England: A hierarchical spatial analysis. Env. Int. 2021, 146, 106316. [Google Scholar] [CrossRef] [PubMed]
- Liang, D.; Shi, L.; Zhao, J.; Liu, P.; Sarnat, J.A.; Gao, S.; Schwartz, J.; Liu, Y.; Ebelt, S.T.; Scovronick, N.; et al. Urban Air Pollution May Enhance COVID-19 Case-Fatality and Mortality Rates in the United States. Innovation 2020, 1, 100047. [Google Scholar] [CrossRef]
- Travaglio, M.; Yu, Y.; Popovic, R.; Selley, L.; Leal, N.S.; Martins, L.M. Links between air pollution and COVID-19 in England. Env. Pollut. 2021, 268, 115859. [Google Scholar] [CrossRef] [PubMed]
- Air Pollution And COVID-19. Including Elements of Air Pollution in Rural Areas, Indoor Air Pollution, Vulnerability and Resilience Aspects of Our Society Against Respiratory Disease, Social Inequality Stemming from Air Pollution. Available online: https://www.europarl.europa.eu/ReData/etudes/STUD/2021/658216/IPOL_STU(2021)658216_EN.pdf (accessed on 14 January 2022).
- Methodological Considerations for Epidemiological Studies of Air Pollution and the SARS and COVID-19 Coronavirus Outbreaks. Available online: https://ehp.niehs.nih.gov/doi/pdf/10.1289/EHP7411 (accessed on 10 January 2022).
- Wendee, N. Air of Uncertainty: Can We Study Pollution and COVID-19 in the Midst of a Pandemic? Env. Health Perspect. 2020, 128, 114005. [Google Scholar] [CrossRef]
- Kaiser, H. Directional statistical decisions. Psychol. Rev. 1960, 67, 160–167. [Google Scholar] [CrossRef] [PubMed]
- Stafoggia, M.; Cattani, G.; Ancona, C.; Ranzi, A. La valutazione dell’esposizione della popolazione italiana all’inquinamento atmosferico nel periodo 2016-2019 per lo studio della relazione tra inquinamento atmosferico e COVID-19. Epidemiol. Prev. 2020, 44, 161–168. [Google Scholar] [CrossRef] [PubMed]
- R Core Team. R: A Language and Environment for Statistical Computing. R Foundation for Statistical Computing, Vienna, Austria. 2013. Available online: http://www.R-project.org/ (accessed on 10 January 2022).
- Farr, W. Report on the Mortality from Cholera in England, 1848–1849; HMSO: London, UK, 1852. [Google Scholar]
- Austin, P.C. Assessing the performance of the generalized propensity score for estimating the effect of quantitative or continuous exposures on binary outcomes. Stat Med. 2018, 37, 1874–1894. [Google Scholar] [CrossRef] [PubMed] [Green Version]


| Variables | Label | Mean | SD | Min | p5 | p25 | p50 | p75 | p95 | Max |
|---|---|---|---|---|---|---|---|---|---|---|
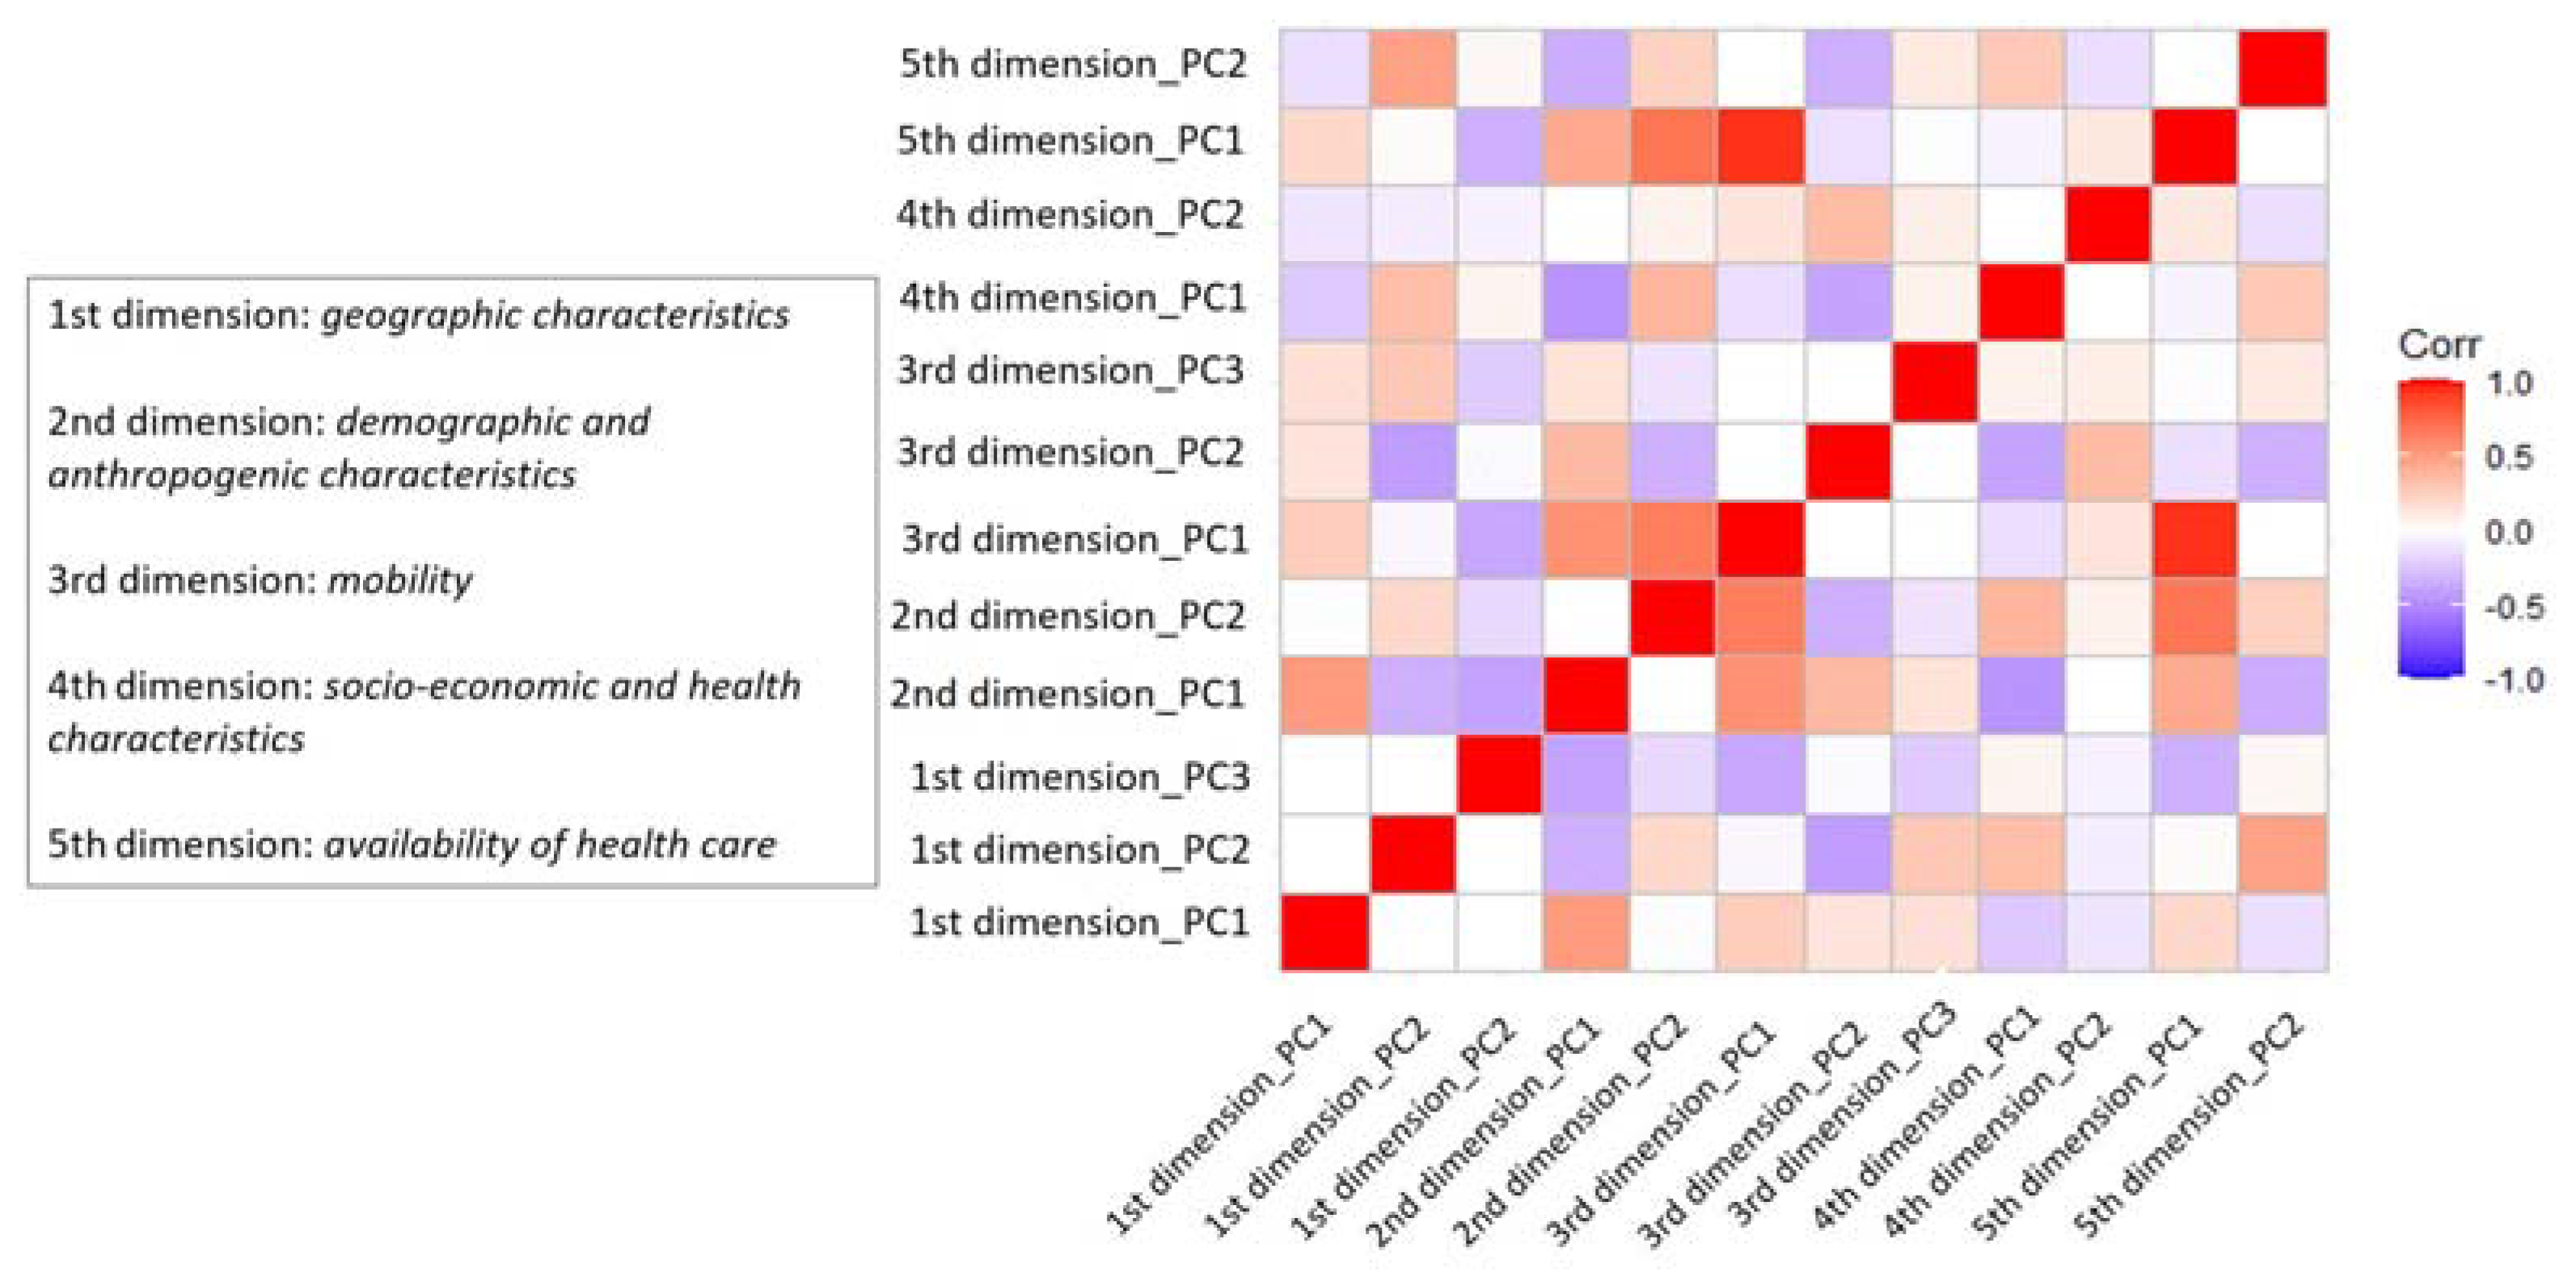
| 1st dimension: geographic characteristics | ||||||||||
| Area (km2) as of 1 January 2020 | area | 38.2 | 50.8 | 0.12 | 4.37 | 11.5 | 22.4 | 44.6 | 125.7 | 1287.4 |
| Altitude (m above sea level) | elevation | 355 | 296 | 0 | 12 | 114 | 289 | 520 | 920 | 2035 |
| 2nd dimension: demographic and anthropogenic characteristics | ||||||||||
| Resident population as of 31 December 2019 (number) | population_2019 | 7622 | 42,801 | 30 | 284 | 1005 | 2459 | 6317 | 25,090 | 2,837,332 |
| Population density ratio (population over area) | pop_density | 303.7 | 649.7 | 0.80 | 12.6 | 43.5 | 105.5 | 281.5 | 1189 | 12,178 |
| Population density (cell 1 km2) | pop_maximun | 1888 | 2444 | 12 | 165 | 509 | 1079 | 2,316 | 6429 | 35,271 |
| Percentage of population over-65 years as of 31 December 2019 (%) | over 65 | 25.5 | 5.40 | 8.64 | 17.7 | 21.9 | 24.9 | 28.3 | 34.8 | 62.3 |
| Impervious Surface Areas (cell 1 km2) | ISA | 58.6 | 42.7 | 0 | 0 | 0 | 79 | 100 | 100 | 101 |
| Value of the night brightness index (cell 1 km2) | LAN | 23.1 | 41.9 | 0 | 2.22 | 7.28 | 15.2 | 28.5 | 63.6 | 1013 |
| Percentage of urban coverage (cell 1 km2) | pcturb | 41.2 | 27.6 | 0 | 0 | 22.2 | 37.6 | 59.7 | 94.4 | 100 |
| Length of the roads (cell 1 km2) | l_roads | 12,332 | 5551 | 1673 | 5426 | 8382 | 11,337 | 15,134 | 22,477 | 51,711 |
| 3rd dimension: mobility | ||||||||||
| Attraction index (mean 2014–2015) * | attraction_index | 23.2 | 12.2 | 0 | 6.69 | 13.8 | 21.4 | 30.7 | 45.7 | 83.1 |
| Self-containment index (mean 2014–2015) ** | self_cont_index | 34.7 | 13.3 | 2.48 | 15.5 | 25.3 | 33.2 | 42.5 | 59.7 | 89.1 |
| Extra-municipal movements *** | mov_extra | 1439 | 2633 | 1 | 79 | 267 | 638 | 1654 | 5,127 | 90,063 |
| Intra-municipal movements **** | mov_intra | 2214 | 18,293 | 0 | 24 | 163 | 483 | 1382 | 6793 | 1,284,994 |
| Total movements: number of individuals who move for work or study | mov_tot | 3653 | 20,008 | 5 | 118 | 457 | 1181 | 3126 | 11,836 | 1,340,818 |
| 4th dimension: socio-economic and health characteristics | ||||||||||
| Household income (average 2014–2015 in €) ***** | income | 13,000 | 3124 | 3796 | 8037 | 10,285 | 13,453 | 15,245 | 17,612 | 29,985 |
| Entrepreneurship rate (2014–2015 average): number of companies per 100,000 res. | entrepr_rate | 62.6 | 24.2 | 9.64 | 33.3 | 47.8 | 59.5 | 73.1 | 99.6 | 407.4 |
| Cardiovascular diseases hospitalization rate (annual average 2013–2018 per 100 residents) | rate_R_cir | 1.18 | 0.31 | 0.17 | 0.80 | 0.97 | 1.12 | 1.31 | 1.76 | 4.37 |
| Respiratory diseases hospitalization rate (annual average 2013–2018 per 100 residents) | rate_R_res | 0.69 | 0.18 | 0 | 0.45 | 0.58 | 0.67 | 0.78 | 1.00 | 2.82 |
| All causes hospitalization rate (annual average 2013–2018 per 100 residents) | rate-R_tot | 4.95 | 0.67 | 1.06 | 4.03 | 4.51 | 4.88 | 5.29 | 6.14 | 12.3 |
| Cardiovascular diseases mortality rate (annual average 2013–2017 per 100 residents) | rate_M_cir | 0.46 | 0.22 | 0 | 0.20 | 0.31 | 0.42 | 0.55 | 0.85 | 2.37 |
| Respiratory diseases mortality rate (annual average 2013–2017 per 100 residents) | rate_M_res | 0.09 | 0.06 | 0 | 0.02 | 0.05 | 0.08 | 0.11 | 0.20 | 1.06 |
| All causes mortality rate (annual average 2013–2017 per 100 residents) | rate_M_tot | 1.19 | 0.43 | 0 | 0.66 | 0.89 | 1.12 | 1.38 | 1.97 | 5.62 |
| 5th dimension: availability of health care | ||||||||||
| Minimum distance between the municipality (centroid) and a health facility (meters) | dist_healthcare_facility | 9403 | 5987 | 65 | 1753 | 5,228 | 8428 | 12,635 | 20,122 | 152,024 |
| Minimum distance between the municipality (centroid) and an emergency room (meters) | dist_er | 10,751 | 6382 | 57 | 2470 | 6274 | 9733 | 14,050 | 22,206 | 151,546 |
| Number workers in healthcare residences | workers_heacareres | 217 | 566 | 2 | 13 | 34 | 71 | 172 | 736 | 5940 |
| Air Pollution levels | ||||||||||
| Population weighted exposure of PM2.5 (annual mean 2016–2019 µg/m3) | pm25_2016_2019_pop | 14.6 | 4.98 | 6.11 | 8.48 | 10.5 | 12.9 | 19.1 | 23.4 | 27.4 |
| Population weighted exposure of PM10 (annual mean 2016–2019 µg/m3) | pm10_2016_2019_pop | 21.1 | 6.46 | 6.62 | 11.8 | 16.0 | 20.1 | 26.1 | 32.6 | 37.5 |
| Population weighted exposure of NO2 (annual mean 2016–2019 µg m3) | no2_2016_2019_pop | 14.5 | 6.74 | 4.23 | 6.38 | 8.73 | 13.0 | 19.3 | 26.1 | 46.3 |
| Variable | Label | Number of Municipalities | % |
|---|---|---|---|
| 1st dimension: geographic characteristics | |||
| Coastal municipality | coastal | 642 | 8.12 |
| Island municipality | island | 34 | 0.43 |
| Coastal area * | coastal_area | 1165 | 14.7 |
| Degree of urbanization: | |||
| Cities or “densely populated areas” | urbanizzaztio_1 | 255 | 3.23 |
| Small towns and suburbs or “intermediate population density areas” | 2607 | 33.0 | |
| Rural areas or “sparsely populated areas” | 5041 | 63.8 | |
| 3rd dimension: mobility | |||
| Number of airports within 30 km from the municipality boundaries | airports_30 km | ||
| 1 | 2891 | 36.6 | |
| 2 or more | 386 | 4.88 | |
| Number of railway stations in the municipality | n_railway_station | ||
| 1 | 1296 | 16.4 | |
| 2–3 | 387 | 4.89 | |
| 4–5 | 57 | 0.72 | |
| 6 or more | 29 | 0.33 | |
| 5th dimension: socio-economic and health characteristics | |||
| Socio economic position (SEP) ** | SEP_cat | ||
| Low | 1550 | 19.6 | |
| Middle-low | 1582 | 20.0 | |
| Middle | 1610 | 20.4 | |
| Middle-high | 1592 | 20.1 | |
| High | 1569 | 19.9 | |
| 6th dimension: availability of health care *** | |||
| Number of teaching hospitals | num_polyclinics | ||
| 1 | 27 | 0.34 | |
| 2–3 | 12 | 0.45 | |
| 3 or more | 6 | 0.12 | |
| Number of general hospitals | num_hosp | ||
| 1 | 518 | 6.55 | |
| 2–3 | 22 | 0.28 | |
| 3 or more | 7 | 0.09 | |
| Number of public or private foundations | num_ircss | ||
| 1 | 38 | 0.48 | |
| 2–3 | 5 | 0.07 | |
| 3 or more | 3 | 0.03 | |
| Number of accredited private nursing homes | num_nh | ||
| 1 | 220 | 2.78 | |
| 2–3 | 48 | 0.61 | |
| 3 or more | 17 | 0.19 | |
| Number of acute care beds | nbeds_acute_ord | ||
| 1–10 | 19 | 0.24 | |
| 10–50 | 127 | 1.61 | |
| 51–150 | 235 | 2.97 | |
| 150 or more | 269 | 3.40 | |
| Number of long-term hospital beds | nbeds_lstay_ord | ||
| 1–10 | 99 | 1.25 | |
| 10–50 | 183 | 2.32 | |
| 51–150 | 31 | 0.39 | |
| 150 or more | 5 | 0.06 | |
| Number of rehabilitation beds | nbeds_rehab_ord | ||
| 1–10 | 61 | 0.77 | |
| 10–50 | 214 | 2.71 | |
| 51–150 | 114 | 1.44 | |
| 150 or more | 30 | 0.38 | |
| Number of intensive care beds | nbeds_ICU_ord | ||
| 1–10 | 254 | 3.21 | |
| 10–50 | 83 | 1.05 | |
| 51–150 | 14 | 0.18 | |
| 150 or more | 3 | 0.04 | |
| Number of emergency department | n_ps | ||
| 1 | 219 | 2.77 | |
| 2–3 | 7 | 0.09 | |
| 3 or more | 4 | 0.05 | |
| Number of family counseling | n_fam_counseling | ||
| 1 | 436 | 5.52 | |
| 2–3 | 123 | 1.56 | |
| 3 or more | 30 | 0.38 | |
| Number of nursing residences | n_healthcare_residences | ||
| At least 1 | 481 | 6.09 |
| PCA Dimension | PM2.5 | PM10 | NO2 |
|---|---|---|---|
| Geographic characteristic | |||
| First component | 0.48 | 0.62 | 0.50 |
| Second component | −0.80 | −0.79 | −0.77 |
| Third component | 0.05 | 0.01 | −0.11 |
| Demographic and anthropogenic characteristics | |||
| First component | 0.42 | 0.51 | 0.58 |
| Second component | −0.35 | −0.36 | −0.33 |
| Mobility | |||
| First component | 0.37 | 0.43 | 0.51 |
| Second component | 0.47 | 0.46 | 0.58 |
| Third component | −0.20 | −0.15 | −0.20 |
| Socio-economic and health status of the population | |||
| First component | −0.44 | −0.46 | −0.53 |
| Second component | 0.29 | 0.17 | 0.36 |
| Availability of health care | |||
| First component | 0.45 | 0.45 | 0.57 |
| Second component | −0.47 | −0.45 | −0.57 |
Publisher’s Note: MDPI stays neutral with regard to jurisdictional claims in published maps and institutional affiliations. |
© 2022 by the authors. Licensee MDPI, Basel, Switzerland. This article is an open access article distributed under the terms and conditions of the Creative Commons Attribution (CC BY) license (https://creativecommons.org/licenses/by/4.0/).
Share and Cite
Bauleo, L.; Giannini, S.; Ranzi, A.; Nobile, F.; Stafoggia, M.; Ancona, C.; Iavarone, I.; the EpiCovAir Study Group. A Methodological Approach to Use Contextual Factors for Epidemiological Studies on Chronic Exposure to Air Pollution and COVID-19 in Italy. Int. J. Environ. Res. Public Health 2022, 19, 2859. https://doi.org/10.3390/ijerph19052859
Bauleo L, Giannini S, Ranzi A, Nobile F, Stafoggia M, Ancona C, Iavarone I, the EpiCovAir Study Group. A Methodological Approach to Use Contextual Factors for Epidemiological Studies on Chronic Exposure to Air Pollution and COVID-19 in Italy. International Journal of Environmental Research and Public Health. 2022; 19(5):2859. https://doi.org/10.3390/ijerph19052859
Chicago/Turabian StyleBauleo, Lisa, Simone Giannini, Andrea Ranzi, Federica Nobile, Massimo Stafoggia, Carla Ancona, Ivano Iavarone, and the EpiCovAir Study Group. 2022. "A Methodological Approach to Use Contextual Factors for Epidemiological Studies on Chronic Exposure to Air Pollution and COVID-19 in Italy" International Journal of Environmental Research and Public Health 19, no. 5: 2859. https://doi.org/10.3390/ijerph19052859
APA StyleBauleo, L., Giannini, S., Ranzi, A., Nobile, F., Stafoggia, M., Ancona, C., Iavarone, I., & the EpiCovAir Study Group. (2022). A Methodological Approach to Use Contextual Factors for Epidemiological Studies on Chronic Exposure to Air Pollution and COVID-19 in Italy. International Journal of Environmental Research and Public Health, 19(5), 2859. https://doi.org/10.3390/ijerph19052859