Article

Adsorption Properties and Mechanism of Attapulgite to Graphene Oxide in Aqueous Solution

1
School of Civil Engineering, Shaoxing University, Shaoxing 312000, China
2
School of Civil Engineering, College of Transportation Engineering, Nanjing Tech University, Nanjing 210009, China
3
Department of Civil and Environmental Engineering, National University of Singapore, Singapore 117576, Singapore
*
Author to whom correspondence should be addressed.
Int. J. Environ. Res. Public Health 2022, 19(5), 2793; https://doi.org/10.3390/ijerph19052793
Submission received: 26 January 2022 / Revised: 23 February 2022 / Accepted: 25 February 2022 / Published: 27 February 2022
(This article belongs to the Special Issue Water Pollution: Human Health and Ecological Risks)

Abstract

:
In order to remove toxic graphene oxide (GO) from aqueous solution, attapulgite (ATP) was used as adsorbent to recycle it by adsorption. In this paper, the effects of different pH, adsorbent mass, GO concentration, time and temperature on the adsorption of GO by attapulgite were studied, and the adsorption performance and mechanism were further explored by XRD, AFM, XPS, FTIR, TEM and SEM tests. The results show that when T = 303 K, pH = 3, and the GO concentration is 100 mg/L in 50 mL of aqueous solution, the removal rate of GO by 40 mg of attapulgite reaches 92.83%, and the partition coefficient Kd reaches 16.31. The adsorption kinetics results showed that the adsorption equilibrium was reached at 2160 min, and the adsorption process could be described by the pseudo-second-order adsorption equation, indicating that the adsorption process was accompanied by chemical adsorption and physical adsorption. The isotherm and thermodynamic parameters show that the adsorption of GO by attapulgite is more consistent with the Langmuir isotherm model, and the reaction is a spontaneous endothermic process. The analysis shows that attapulgite is a good material for removing GO, which can provide a reference for the removal of GO in an aqueous environment.

1. Introduction

Graphene oxide (GO) is an oxygen-containing graphene derivative. The oxygen-containing groups on the surface of GO easily form composite materials with ions, polymers and other materials, so it has been widely used in the fields of physics, chemistry, biology and materials science [1]. The presence of polar oxygen-containing functional groups on the surface of GO makes it hydrophilic, while the presence of various functional groups such as carboxyl, hydroxyl, and epoxy groups makes its affinity for pollutants in water continuously strengthened, thus it can be used for wastewater treatment [2]. For the wastewater treatment by GO, many scholars have studied it. For example, GO can be used to remove As(III) and cephalexin in aqueous solution. In addition, it can also adsorb metal ions, such as Cr(VI), U(VI), Pb(II), Co(II), etc. [3,4,5,6,7,8].
GO has a strong capacity for wastewater treatment, and often coexists with one or more toxic substances in the aqueous environment, which may lead to more complex forms and toxic effects of composite pollutants, and increase the risk to ecosystems [9]. Adsorbed GO with AS(III) is easily oxidized, which impairs important detoxification pathways in algal cells, thereby exacerbating the toxicity of As(III) to algae [10]. In addition, GO is also toxic to living organisms. Ultra-trace amounts of GO can cause the disappearance of more than 90% of dopamine neurons in zebrafish larvae and the increase of Lewy bodies, which can further lead to Parkinson’s disease-like symptoms and metabolic disorders in zebrafish larvae [11]. The presence of GO increases the accumulation of reactive oxygen species in Drosophila, damages the gut, affects its absorption of nutrients, and ultimately leads to weight loss, slower crawling, stunted growth, and shortened lifespan in Drosophila [12]. The six generations of nematodes were studied in the GO environment, and it was found that due to GO, the development of nematode neurons was defective, the function was easily damaged, and the apoptosis and antioxidant responses were increased [13]. For mammals, GO enters various tissues and organs such as the blood, the gastrointestinal tract, heart, kidney, lung, etc., causing damage to these tissues and organs, resulting in various inflammations, acute allergies and even death [14]. Due to the unique size and morphology of GO, it easily passes through the cell membrane, leading to the destruction of biomolecules such as nucleic acids, lipids and proteins, which in turn leads to DNA damage and induces genotoxicity [15]. Therefore, in view of the popularity of GO and the possibility of leakage, the research on GO adsorption is urgently needed.
By choosing suitable adsorbents, the adsorption process can be a promising technique for GO removal. For example, using goethite or kaolinite as adsorbents can effectively remove graphene oxide from aqueous solutions [16]. As a good adsorbent, clay minerals are widely used to remove heavy metals, antibiotics, dyes, etc. from the aqueous environment [17,18,19]. The adsorption properties of soil benefit from the large surface area, which improves adsorption by promoting ion exchange [20]. Attapulgite is a natural magnesium-aluminosilicate clay that is widely found in all parts of the world. Its main chemical composition is SiO2 [21]. Attapulgite not only has good surface area and high surface activity, but studies have shown that GO and attapulgite can be modified and reconstituted by ultrasonic and magnetic stirring methods, and have good adsorption effects on aniline, emulsified oil, propranolol, and Pb(II), U(VI), and plasma [22,23,24,25,26]. However, there are few studies on attapulgite as an adsorbent for the removal of GO in aqueous environments.
In this paper, attapulgite was used as an adsorbent to remove GO in aqueous solution, and the adsorption effect of different pH, temperature, GO concentration, adsorbent mass and different time was studied. At the same time, X-ray diffractometer (XRD), Fourier transform infrared spectroscopy (FTIR), scanning electron microscopy (SEM), Atomic Force Microscopy (AFM), High Resolution Transmission Electron Microscopy (TEM) and X-ray photoelectron spectroscopy (XPS) were used to analyze the microstructure and characterization on the adsorbed precipitates to study and discuss the possible adsorption mechanism. The adsorption process is relatively simple, which is expected to promote the application of attapulgite in GO removal.

2. Materials and Methods

2.1. Materials

The adsorbate GO used in this experiment was derived from graphene oxide aqueous solution (2 mg/mL), purchased from Suzhou Suzhou Carbon Technology Co., Ltd., Suzhou, China, which is shown in Table 1. Among them, oxidized graphene has a specific surface area of 420 cm2/g, and the diameter of the sheet is 5 μm. Attapulgite from China, Jiangsu Province, (Changzhou Dingbang Mine Co., Ltd., Changzhou, China) The specific surface area of the uneven bar is 400 m2/g, the hole volume is 0.071 cm3/g, the average pore size is 0.51 nm, the glue quality is 55 mL/15 g, and the expandable is 4 mL/g. Its main chemical composition is shown in Table 2.

2.2. Characterization

The crystal structure of attapulgite was investigated by X-ray diffraction with CuKα radiation by XRD(Empyrean, Malvern, UK). The functional groups were identified by FTIR(IR Prestigae-21, Shimadzu , TKY, Japan) with a scanning range of 400~4000 cm−1. SEM(JSM-6360 LV, JEOL, YKY, Japan), AFM(Dimension Icon, BRUKER, Billerica, MA, USA), TEM(JEM-2100F, JEOL, TKY, Japan) and XPS(Thermo ESCALAB 250XI, Thermo Fisher Scientific, Waltham, MA, USA) were used to measure the morphology and structure before and after adsorption.

2.3. Adsorption Test

50 mL of graphene oxide aqueous solution prepared by an appropriate amount of GO and deionized water was poured into a glass bottle. A negligible volume of NaOH was added to adjust the pH of the aqueous solution, and then a pH meter (FE28, METTLER TOLEDO, Columbus, OH, USA) was used to measure and adjust the pH value to between 3 and 10.
On the basis of referring to previous studies, the amount of adsorbent (10 mg, 20 mg, 30 mg, 40 mg, 50 mg, 60 mg), the initial concentration of GO (40 mg/L, 60 mg/L, 80 mg/L, 100 mg/L, 120 mg/L), and the adsorption effect was studied under pH value (pH3-pH10), temperature (293 K, 303 K, 313 K) and time (0–2880 min) [27]. According to the experimental design, the corresponding mass of attapulgite was added to the graphene oxide aqueous solution.
The glass bottle was then put into a constant temperature shaker and vibrated for 3 h at 240 rpm. After vibration, according to the previous test experience, the glass bottle was put into a thermostat at the set temperature for 24 h curing [28].
After curing, 1 mL of the middle layer supernatant was taken with a pipette gun and diluted to 25 mL with deionized water. After that, the residual GO concentration was measured with an ultraviolet-visible spectrophotometer (UV75N, Shanghai Yoke, Shanghai, China) at a wavelength of 210 nm. According to the initial GO concentration C0 (mg/L) and the equilibrium concentration Ce (mg/L), the adsorbed amount Qe (mg/g), the adsorption rate R, and the partition coefficient Kd (g/L) were calculated. The calculation formulas are as follows [29]:
Q e = ( C 0 - C e ) × V m
R = C 0 - C e C 0 × 100 %  
K d = Q e C e  
where m (mg) represents the mass of attapulgite, and V (mL) represents the volume of the solution. To ensure the accuracy and repeatability of the collected data, all experiments were repeated three times, and the average value of the three experiments was used for subsequent data analysis; error bars were added to the graph to visually understand the degree of dispersion of the experimental data [30].
In order to further study the adsorption behavior, a pseudo-first-order kinetic model and a pseudo-second-order kinetic model are used to fit the adsorption kinetic data. The expression formulas are as follows [31]:
Pseudo-first-order kinetic model:
Q t = Q e [ 1 exp ( k 1 t ) ]  
Pseudo-second-order kinetic model:
Q t = Q e 2 k 2 t 1 + Q e k 2 t
where, Qe represents the adsorption amount at equilibrium, mg/g; Qt represents the adsorption amount at time t, mg/g; k1 and k2 are constants, g/(mg·min); t represents the adsorption time, min.
In order to further understand the adsorption mode of attapulgite to GO, the adsorption data were fitted by the Langmuir adsorption isotherm model and the Freundlich adsorption isotherm model, as shown below [32]:
Langmuir adsorption isotherm model:
Q e = K L Q m a x C e 1 + K L C e  
Freundlich adsorption isotherm model:
Q e = K F C e 1 n
where, Qe represents the equilibrium adsorption capacity, mg/g; Ce represents the equilibrium concentration, mg/L; Qmax represents the maximum adsorption capacity, mg/g; and KL , KF and n are constants.
According to the adsorption isotherms at different temperatures, thermodynamic parameters such as standard free energy (∆G0), enthalpy change (∆H0) and entropy change (∆S0) can be calculated by formulas (8)–(10), which are helpful to understand the relationship between the change of temperature and the adsorption process [33].
I n K d = Δ S 0 R Δ H 0 R T
Δ G 0 = R T I n K d  
K d = Q e C e  

3. Results and Discussion

3.1. Morphology Analysis

3.1.1. SEM and TEM Analysis

The morphology of the samples before and after adsorption can be observed by SEM and TEM [34], and the results are shown in Figure 1. It can be observed from Figure 1a that attapulgite exhibits agglomeration, which is mainly due to the van der Waals force and hydrogen bonding between attapulgite rod-like crystals [35]. From Figure 1b, it can be seen that attapulgite presents a needle-rod shape, and each rod crystal is closely arranged. From Figure 1c,d, it can be observed that the surface of GO is relatively smooth, showing a gossamer shape and obvious lamellae folding, which is consistent with the research results of Hoor et al. [36]. Figure 1e,f are the images of attapulgite after adsorption of GO. It can be seen from the figures that the needle-shaped attapulgite surface is attached with tulle-like GO, which indicates that GO is adsorbed on the surface of attapulgite. In addition to the study of the microscopic morphology, it is also necessary to further explore the internal structural changes of the samples.

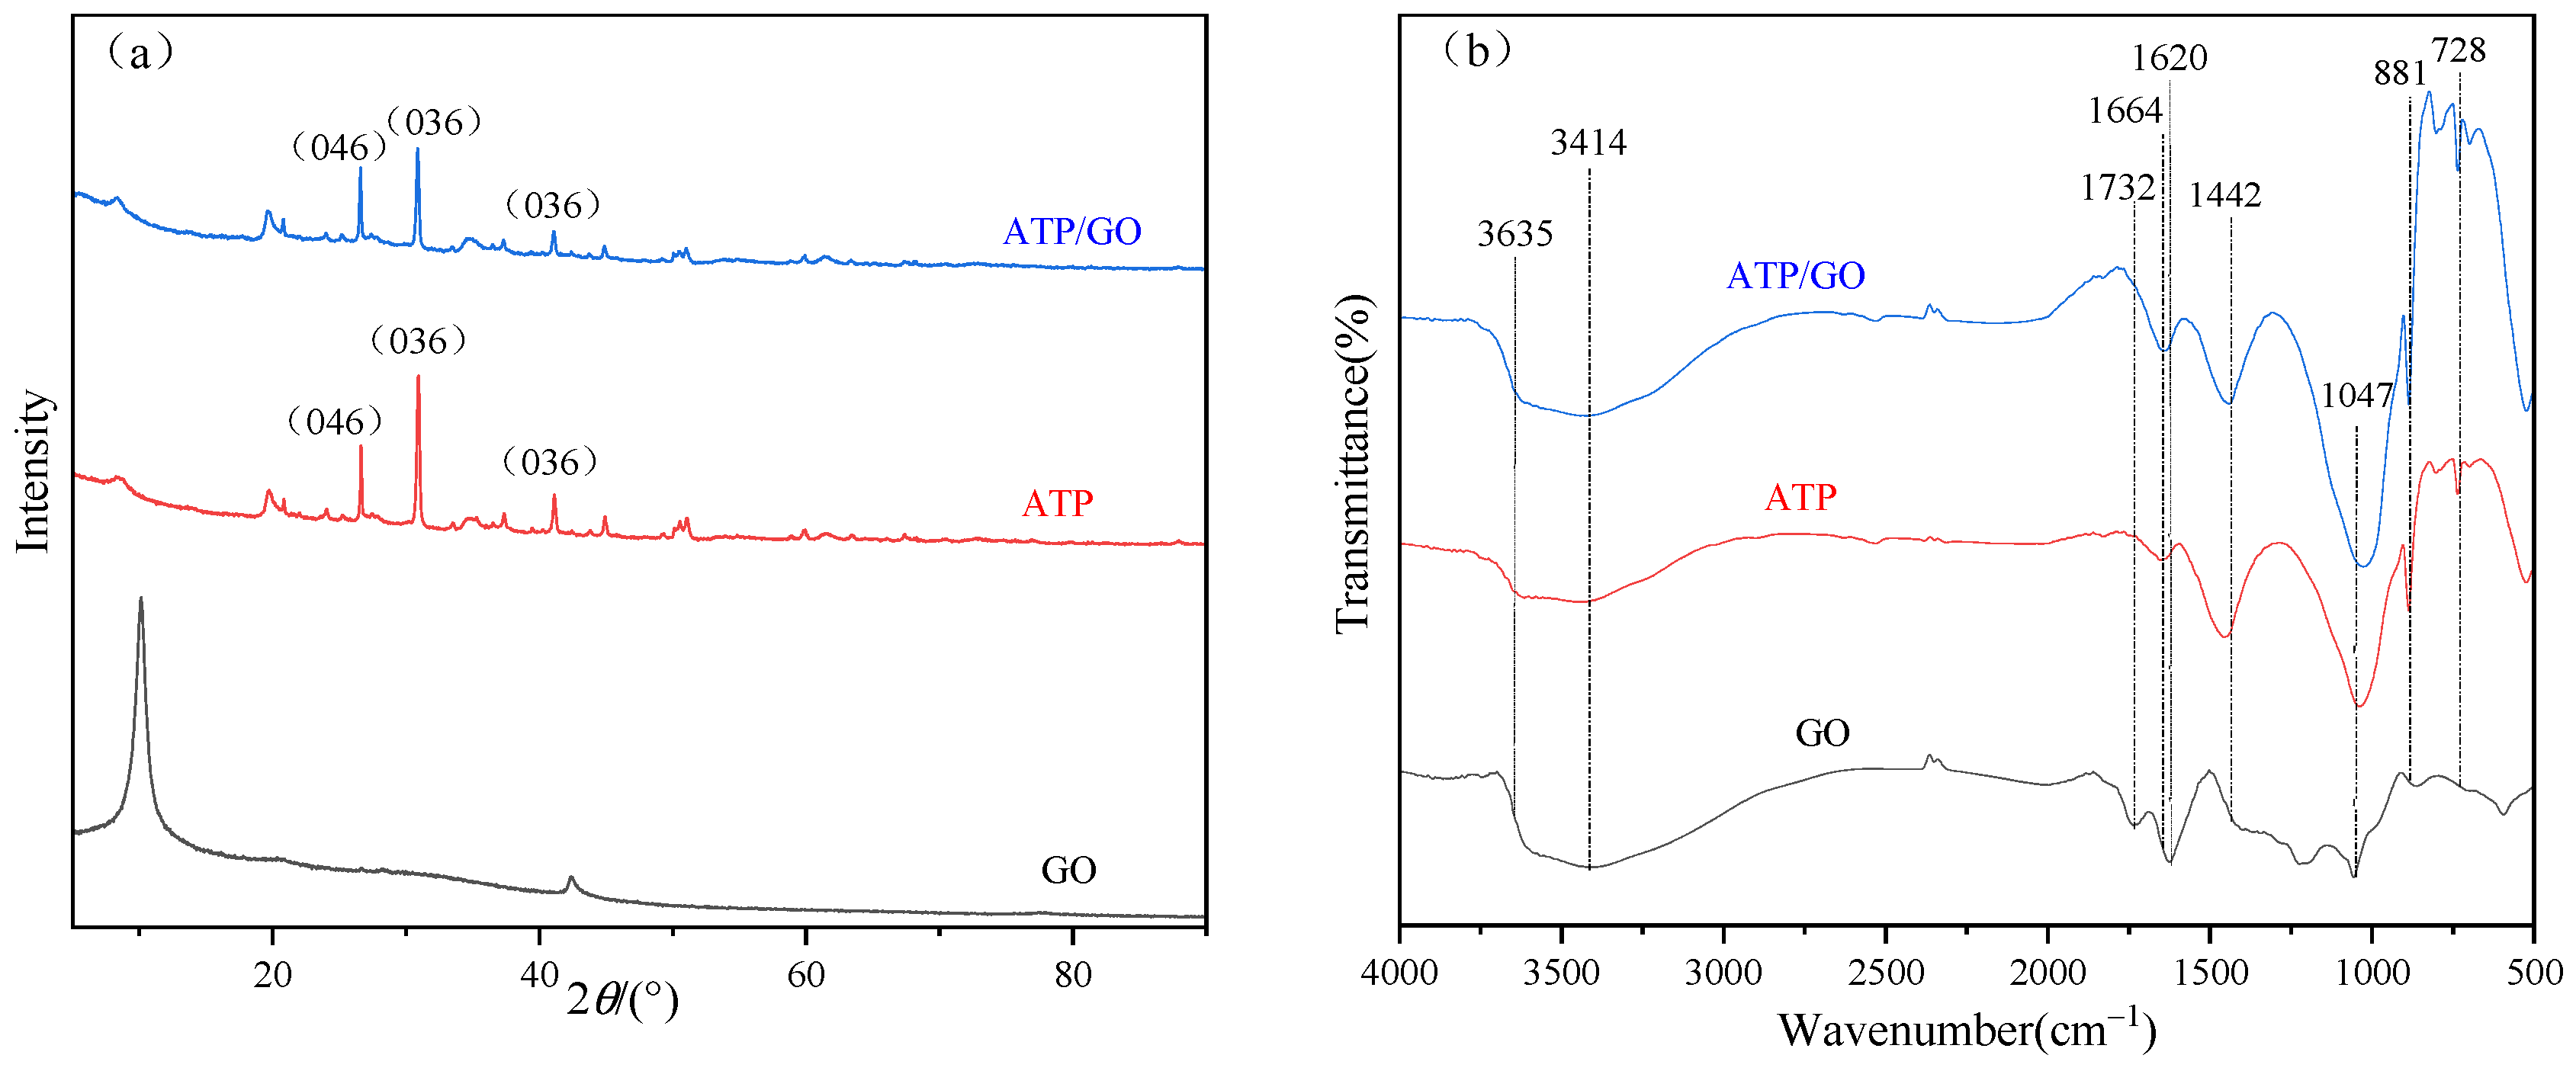
3.1.2. XRD and FTIR Analysis

In order to further reveal the crystal structure of the sample, XRD can be used to study the substances before and after adsorption n [37], and the results are shown in Figure 2a. It can be clearly observed that GO has a strong diffraction peak near 2 θ = 10° [38]. For ATP/GO, the characteristic peak of GO is significantly weakened. By referring to the ICSD standard on the PDF card, 26.62° is marked as SiO2 (046), and 30.94° and 41.12° are marked as CaMg(CO3)2 (036). Comparing ATP with ATP/GO, it was found that the intensity of the strong diffraction peak CaMg(CO3)2 (036) became weaker, and the change of the diffraction peak indicated that GO was not simply deposited on the surface of attapulgite.
In addition to XRD, the changes of functional groups before and after the adsorption of GO were analyzed by FTIR [39]. Figure 2b shows the FTIR spectra of GO, ATP and ATP/GO before and after adsorption. Observing GO, the corresponding broad peaks at 3635 cm−1 and 3414 cm−1 indicate the stretching vibration of O-H and adsorbed H2O, 1732 cm−1 is the stretching vibration of C=O, 1620 cm−1 is the stretching vibration of C=C, 1047 cm−1 is the stretching vibration absorption peak of C-O [40,41,42,43]. The functional groups of attapulgite are different from those of GO. There are -OH stretching vibration peaks at 3635 cm−1 and 3414 cm−1, the bending vibration peaks of adsorbed water in the attapulgite structure at 1664 cm−1 and 1460 cm−1, and Si-O bonds at 881 cm−1 and 728 cm−1 [44,45]. Comparing the spectra of GO, ATP and ATP/GO, the image of ATP/GO is similar to that of ATP, and the characteristic peak of oxygen-containing peak of GO gradually weakens or disappears. For example, the peak at 1732 cm−1 disappears, and the peak at 1620 cm−1 moves to the direction of long wave, indicating that the functional groups of attapulgite are involved in the adsorption of GO [46].

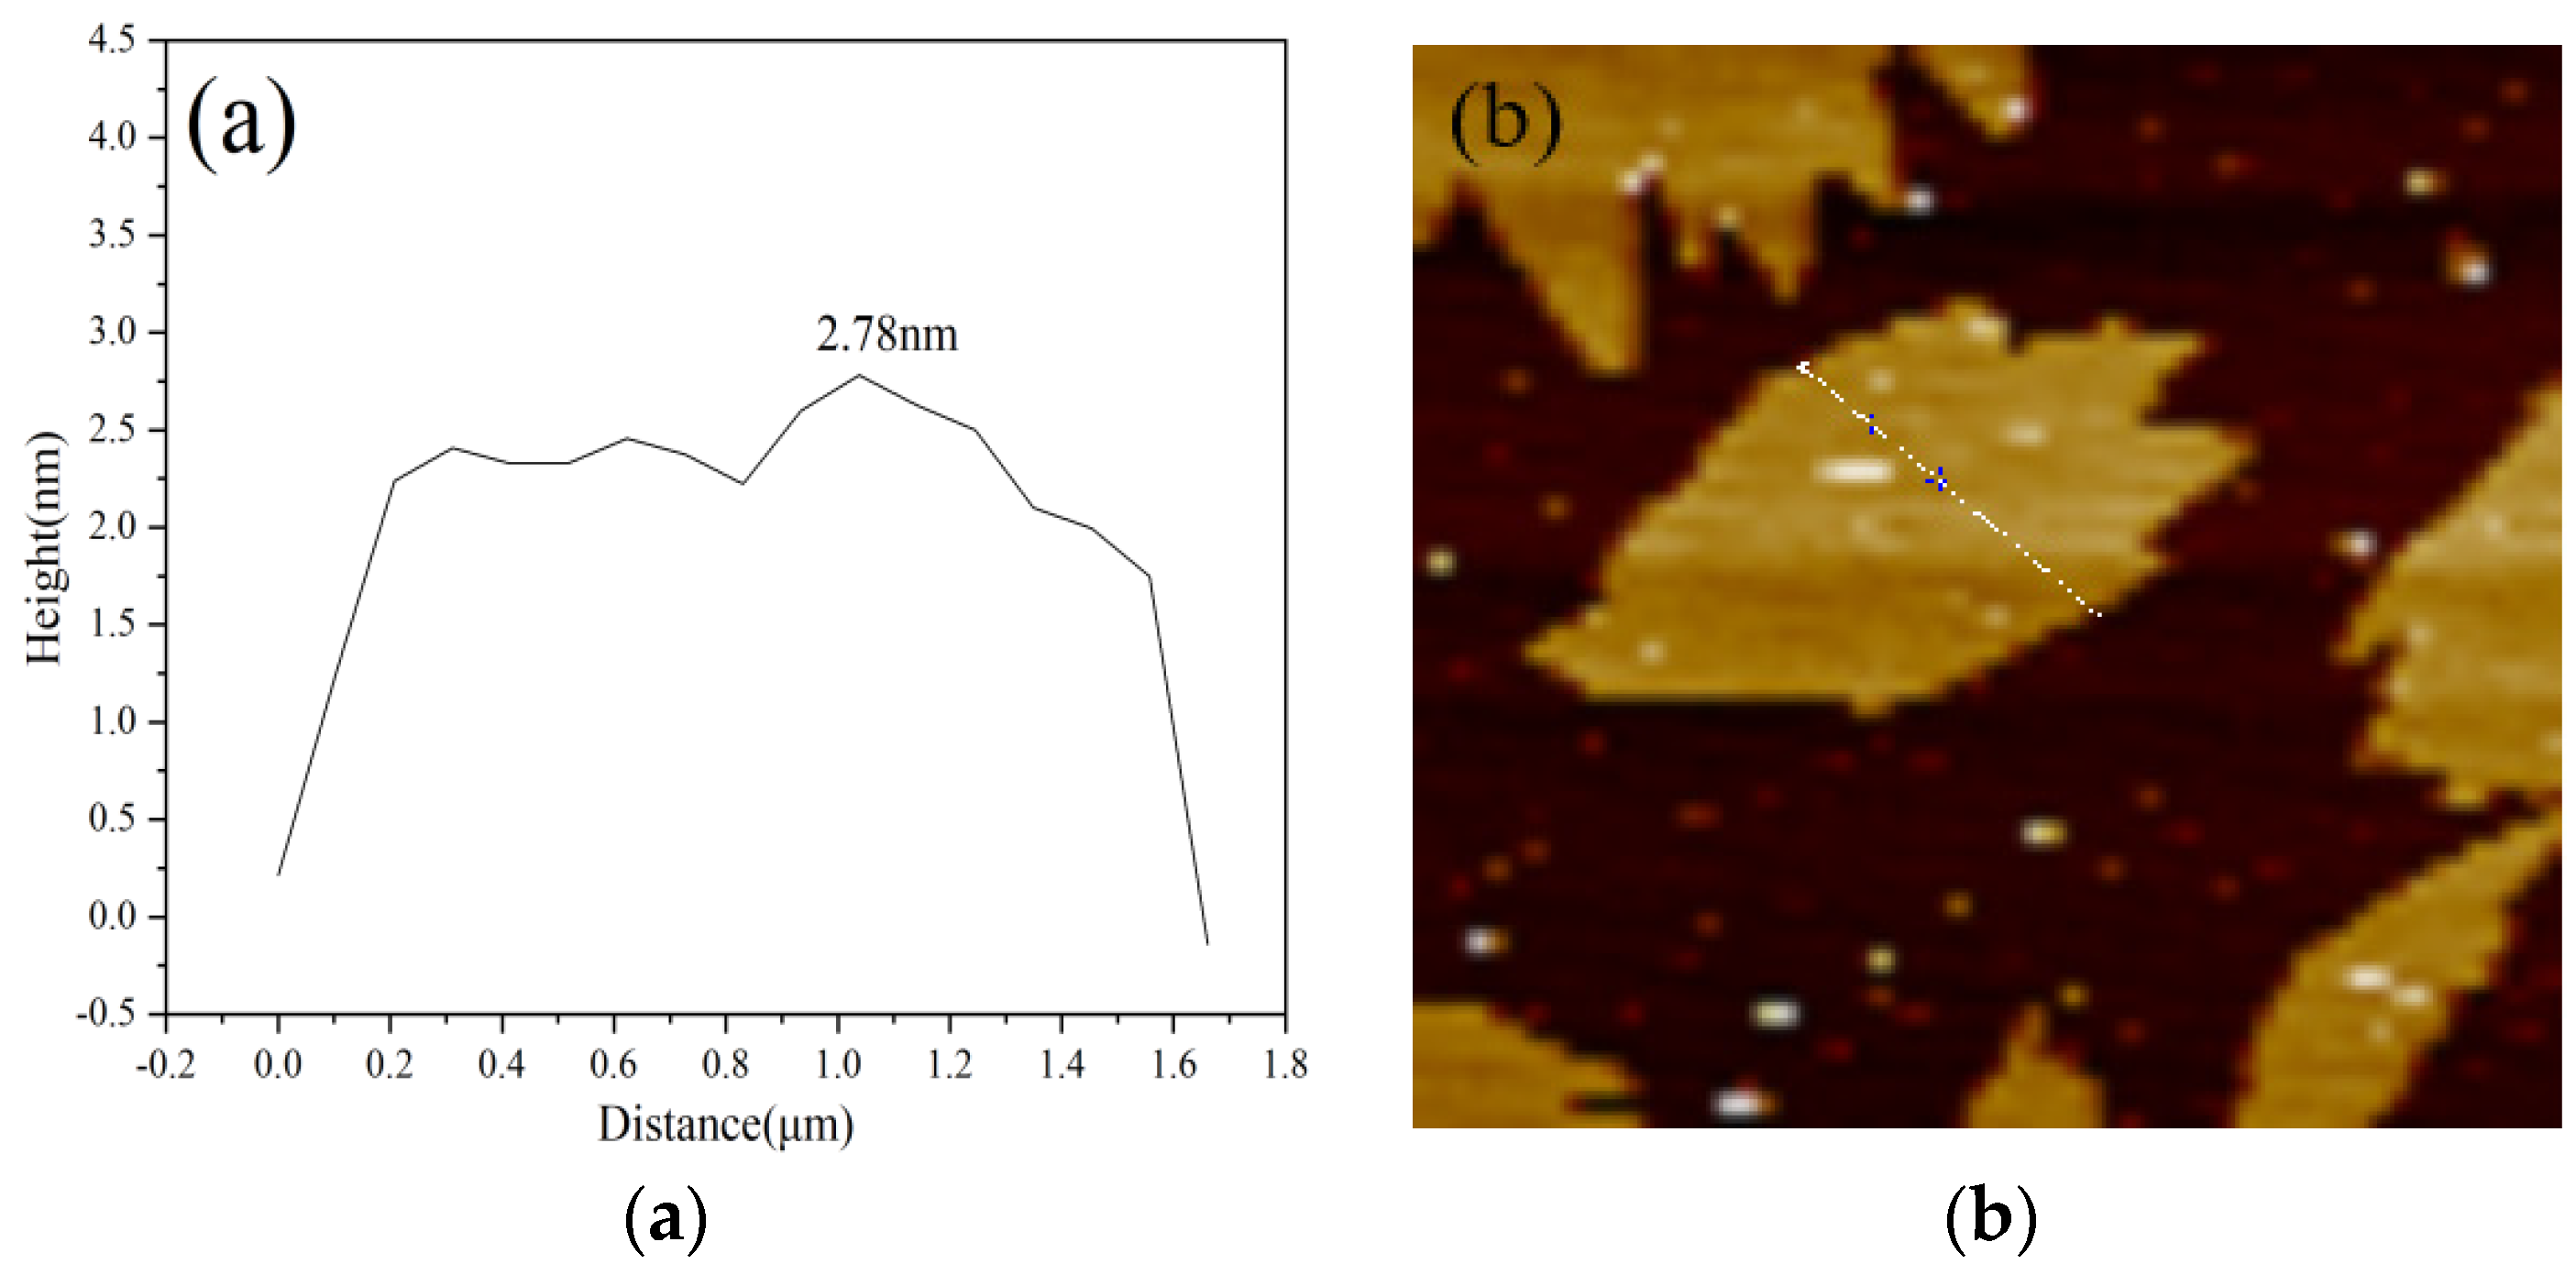
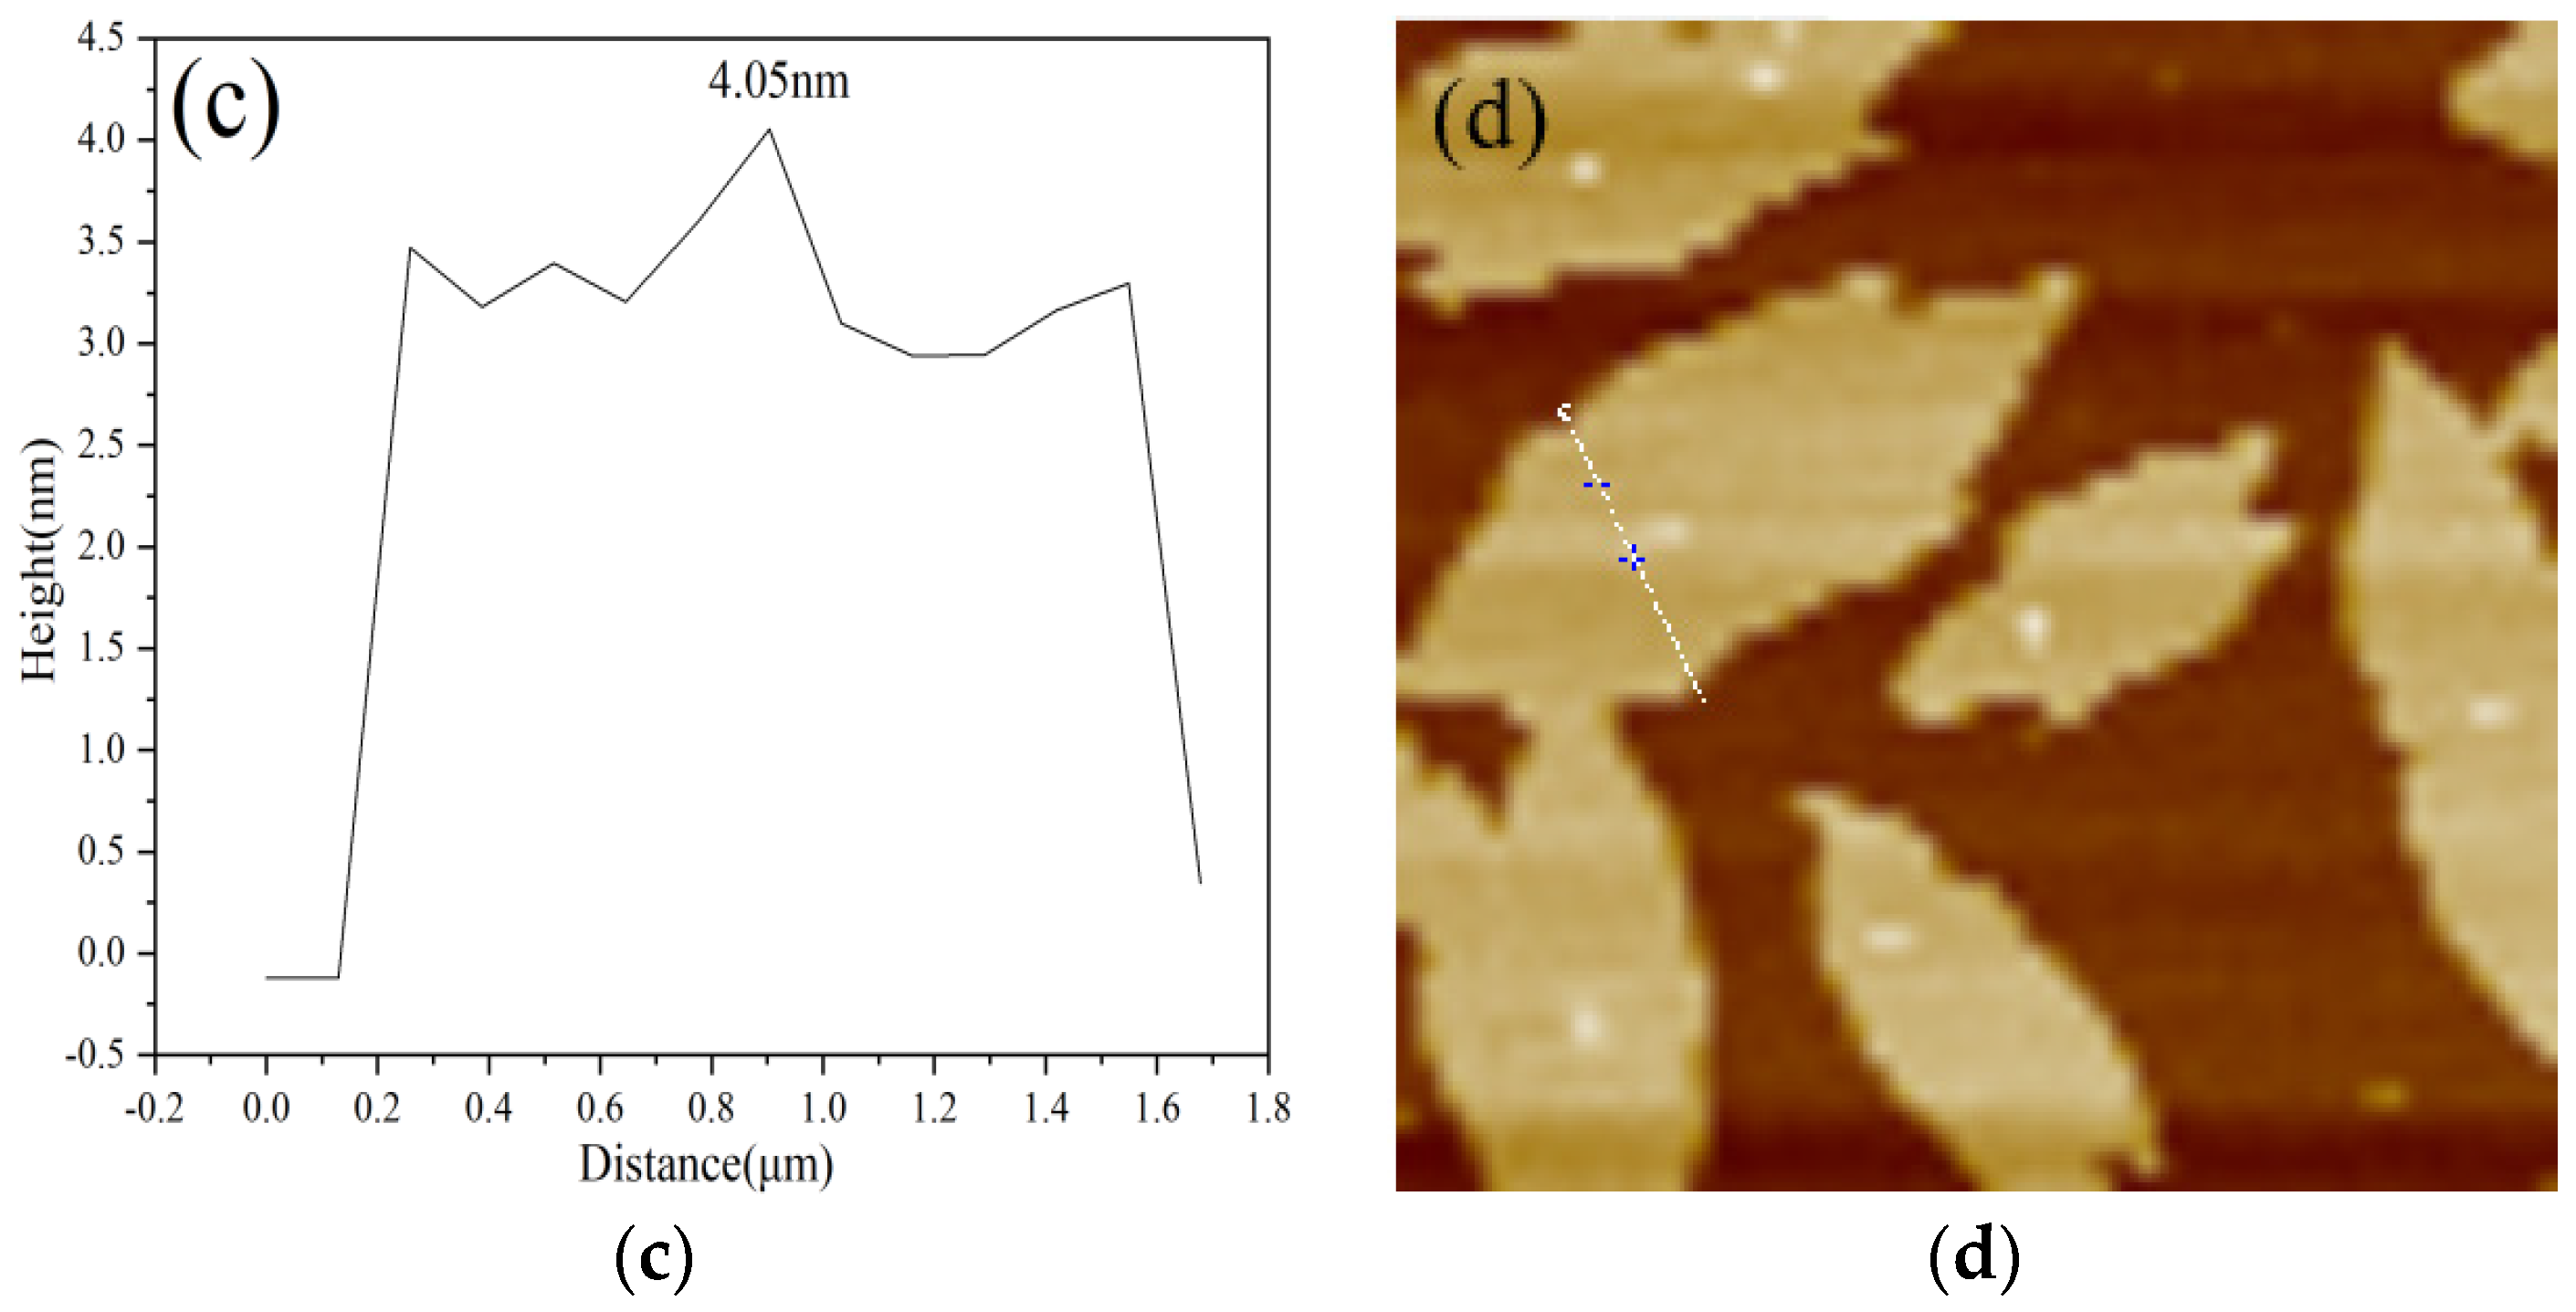
3.1.3. XPS and AFM Analysis
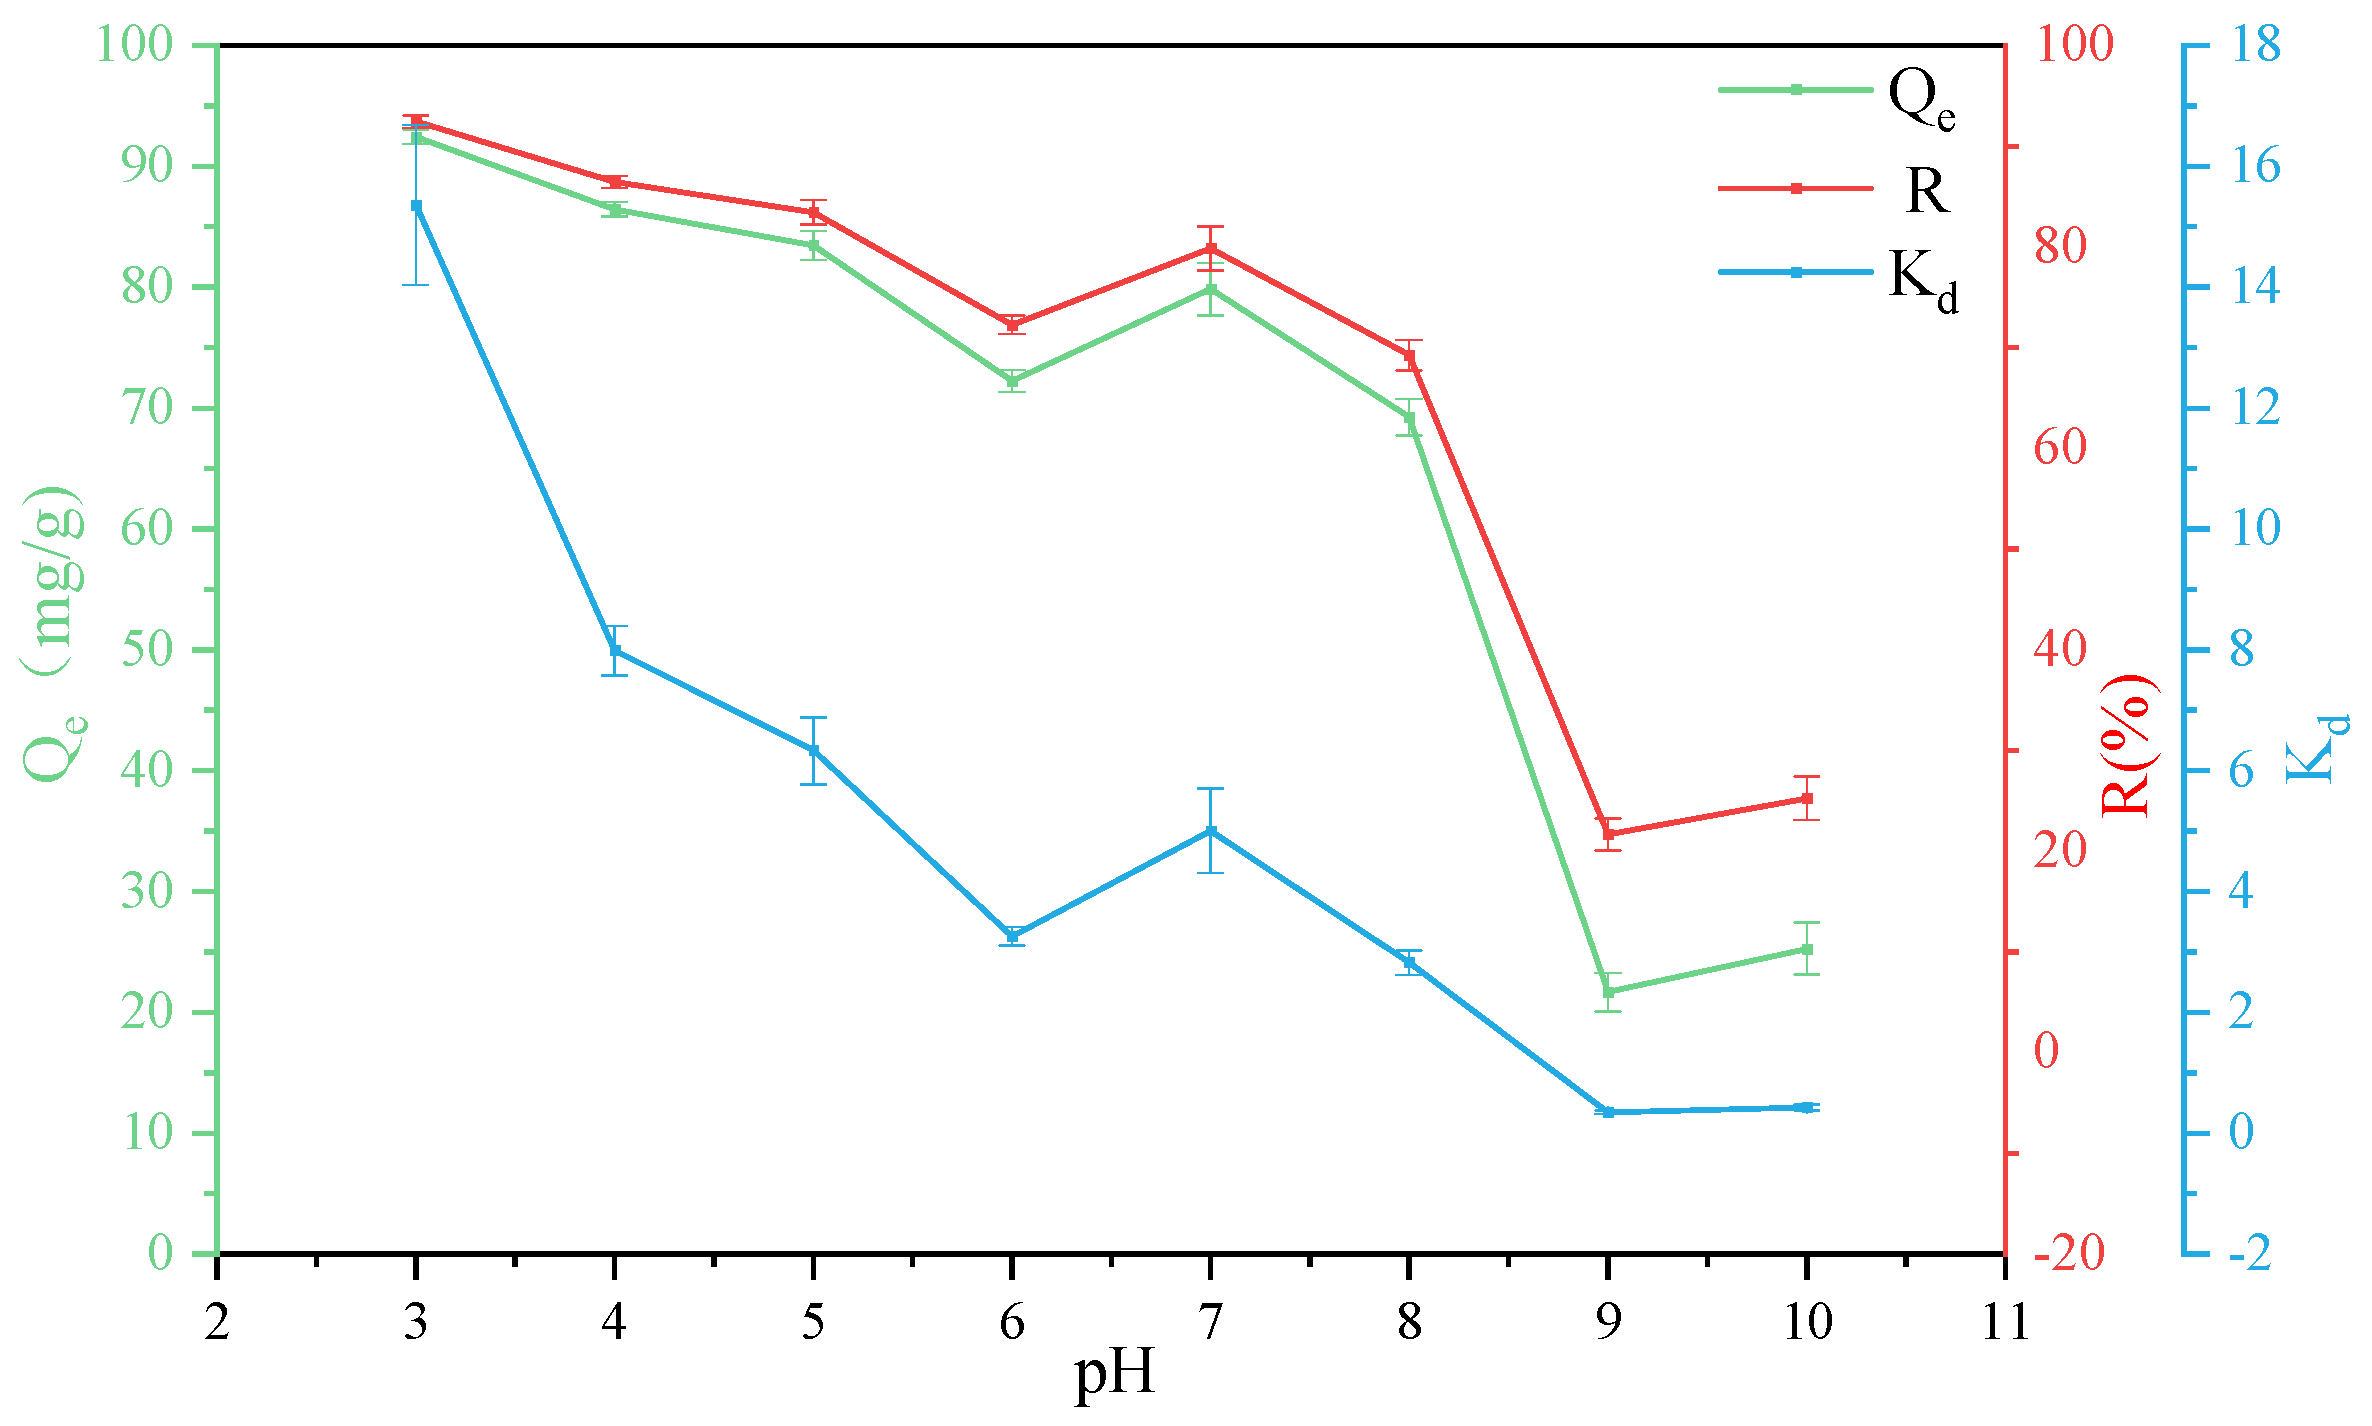
In order to further explore the adsorption mechanism of GO by attapulgite, XPS can be used to analyze the chemical structure of the material surface to understand the binding energy involved in the interaction between attapulgite and GO [47]. The XPS results of GO and ATP/GO are shown in Figure 3a. It can be observed that there are O1s and C1s in the XPS spectra of GO and ATP/GO. Compared with GO, energy peaks such as Mg1s, Ca2p and Si2p also appears in the energy spectrum of ATP/GO, and the C1s energy peak shows a significant decrease.
Therefore, XPS analysis of GO and ATP/GO can focus on the changes of C1s peaks before and after adsorption. The deconvolution of GO on C1s spectra is mainly divided into three components, approximately 284.8 eV, 286.8 eV and 289.7 eV, corresponding to C-C, C-O and O-C=O, respectively [48]. However, after adsorption, the intensity and position of C1s peak changes, as shown in Figure 3b,c. The peak surface area ratio of C-O decreases from 40.7% to 23.3%, that of O-C=O increases from 15.7% to 33.1%, and the peak position of O-C=O changes from 289.7 eV to 287.9 eV, which shows that the interaction between attapulgite and GO is completed by C-O and O-C=O.
AFM has atomic-level resolution, which can clearly characterize the changes in morphology and size of samples before and after adsorption [49]. The AFM test results of GO and ATP/GO are shown in Figure 4b,d. Further analysis of the lamellar thickness are shown in Figure 4a,c, and the maximum thicknesses of GO and ATP/GO are 2.78 nm and 4.05 nm, respectively. The thickness of ATP/GO is significantly higher than that of GO, indicating that GO is adsorbed on the surface of attapulgite, which is consistent with the TEM results. Based on the above analysis, it shows that attapulgite can effectively remove GO through the aggregation of GO on the surface of attapulgite.

3.2. Effect of PH

The change of pH will affect the charge on the surface of the adsorbent, which in turn affects the adsorption effect [50]. In order to study the adsorption ability of attapulgite to GO at different pH, quantitative analysis of GO adsorption amount Qe, adsorption rate R, and partition coefficient Kd was carried out when T = 303 K, the adsorbent mass was 40 mg, and GO concentration was 80 mg/L in 50 mL of the aqueous solution. The calculation results are shown in Figure 5. It can be seen that 92% of GO was adsorbed by attapulgite at pH = 3. The reasons for the better adsorption effect can be mainly divided into the following aspects: on the one hand, GO has a strong self-aggregation force under acidic conditions, and large-scale visible aggregation usually occurs [51]; on the other hand, MgO and CaO in attapulgite will partially dissolve at lower pH to form Mg2+ and Ca2+ [52]. The existence of Mg2+ and Ca2+ cations contributes to the compression of the double electric layer and can also penetrate the double electric layer, so as to be directly adsorbed by oxygen-containing functional groups. At the same time, the cations can also interact with large π bonds which ultimately promotes the coagulation of GO [53]. When 3 < pH < 7 and 7 < pH < 10, the adsorption rate decreases continuously, mainly due to the increase of pH, which promotes the deprotonation of the carboxyl group on the GO group, increases the hydrophilicity, and inhibits the binding and accumulation between cations and GO [54]. In addition, due to the large amount of negative charges on the surface of attapulgite and GO, the electrostatic interaction between them is weakened, resulting in a low adsorption capacity of attapulgite to GO [55]. Therefore, lower pH is helpful for the adsorption of GO by attapulgite, and the best adsorption effect occurs when pH = 3.

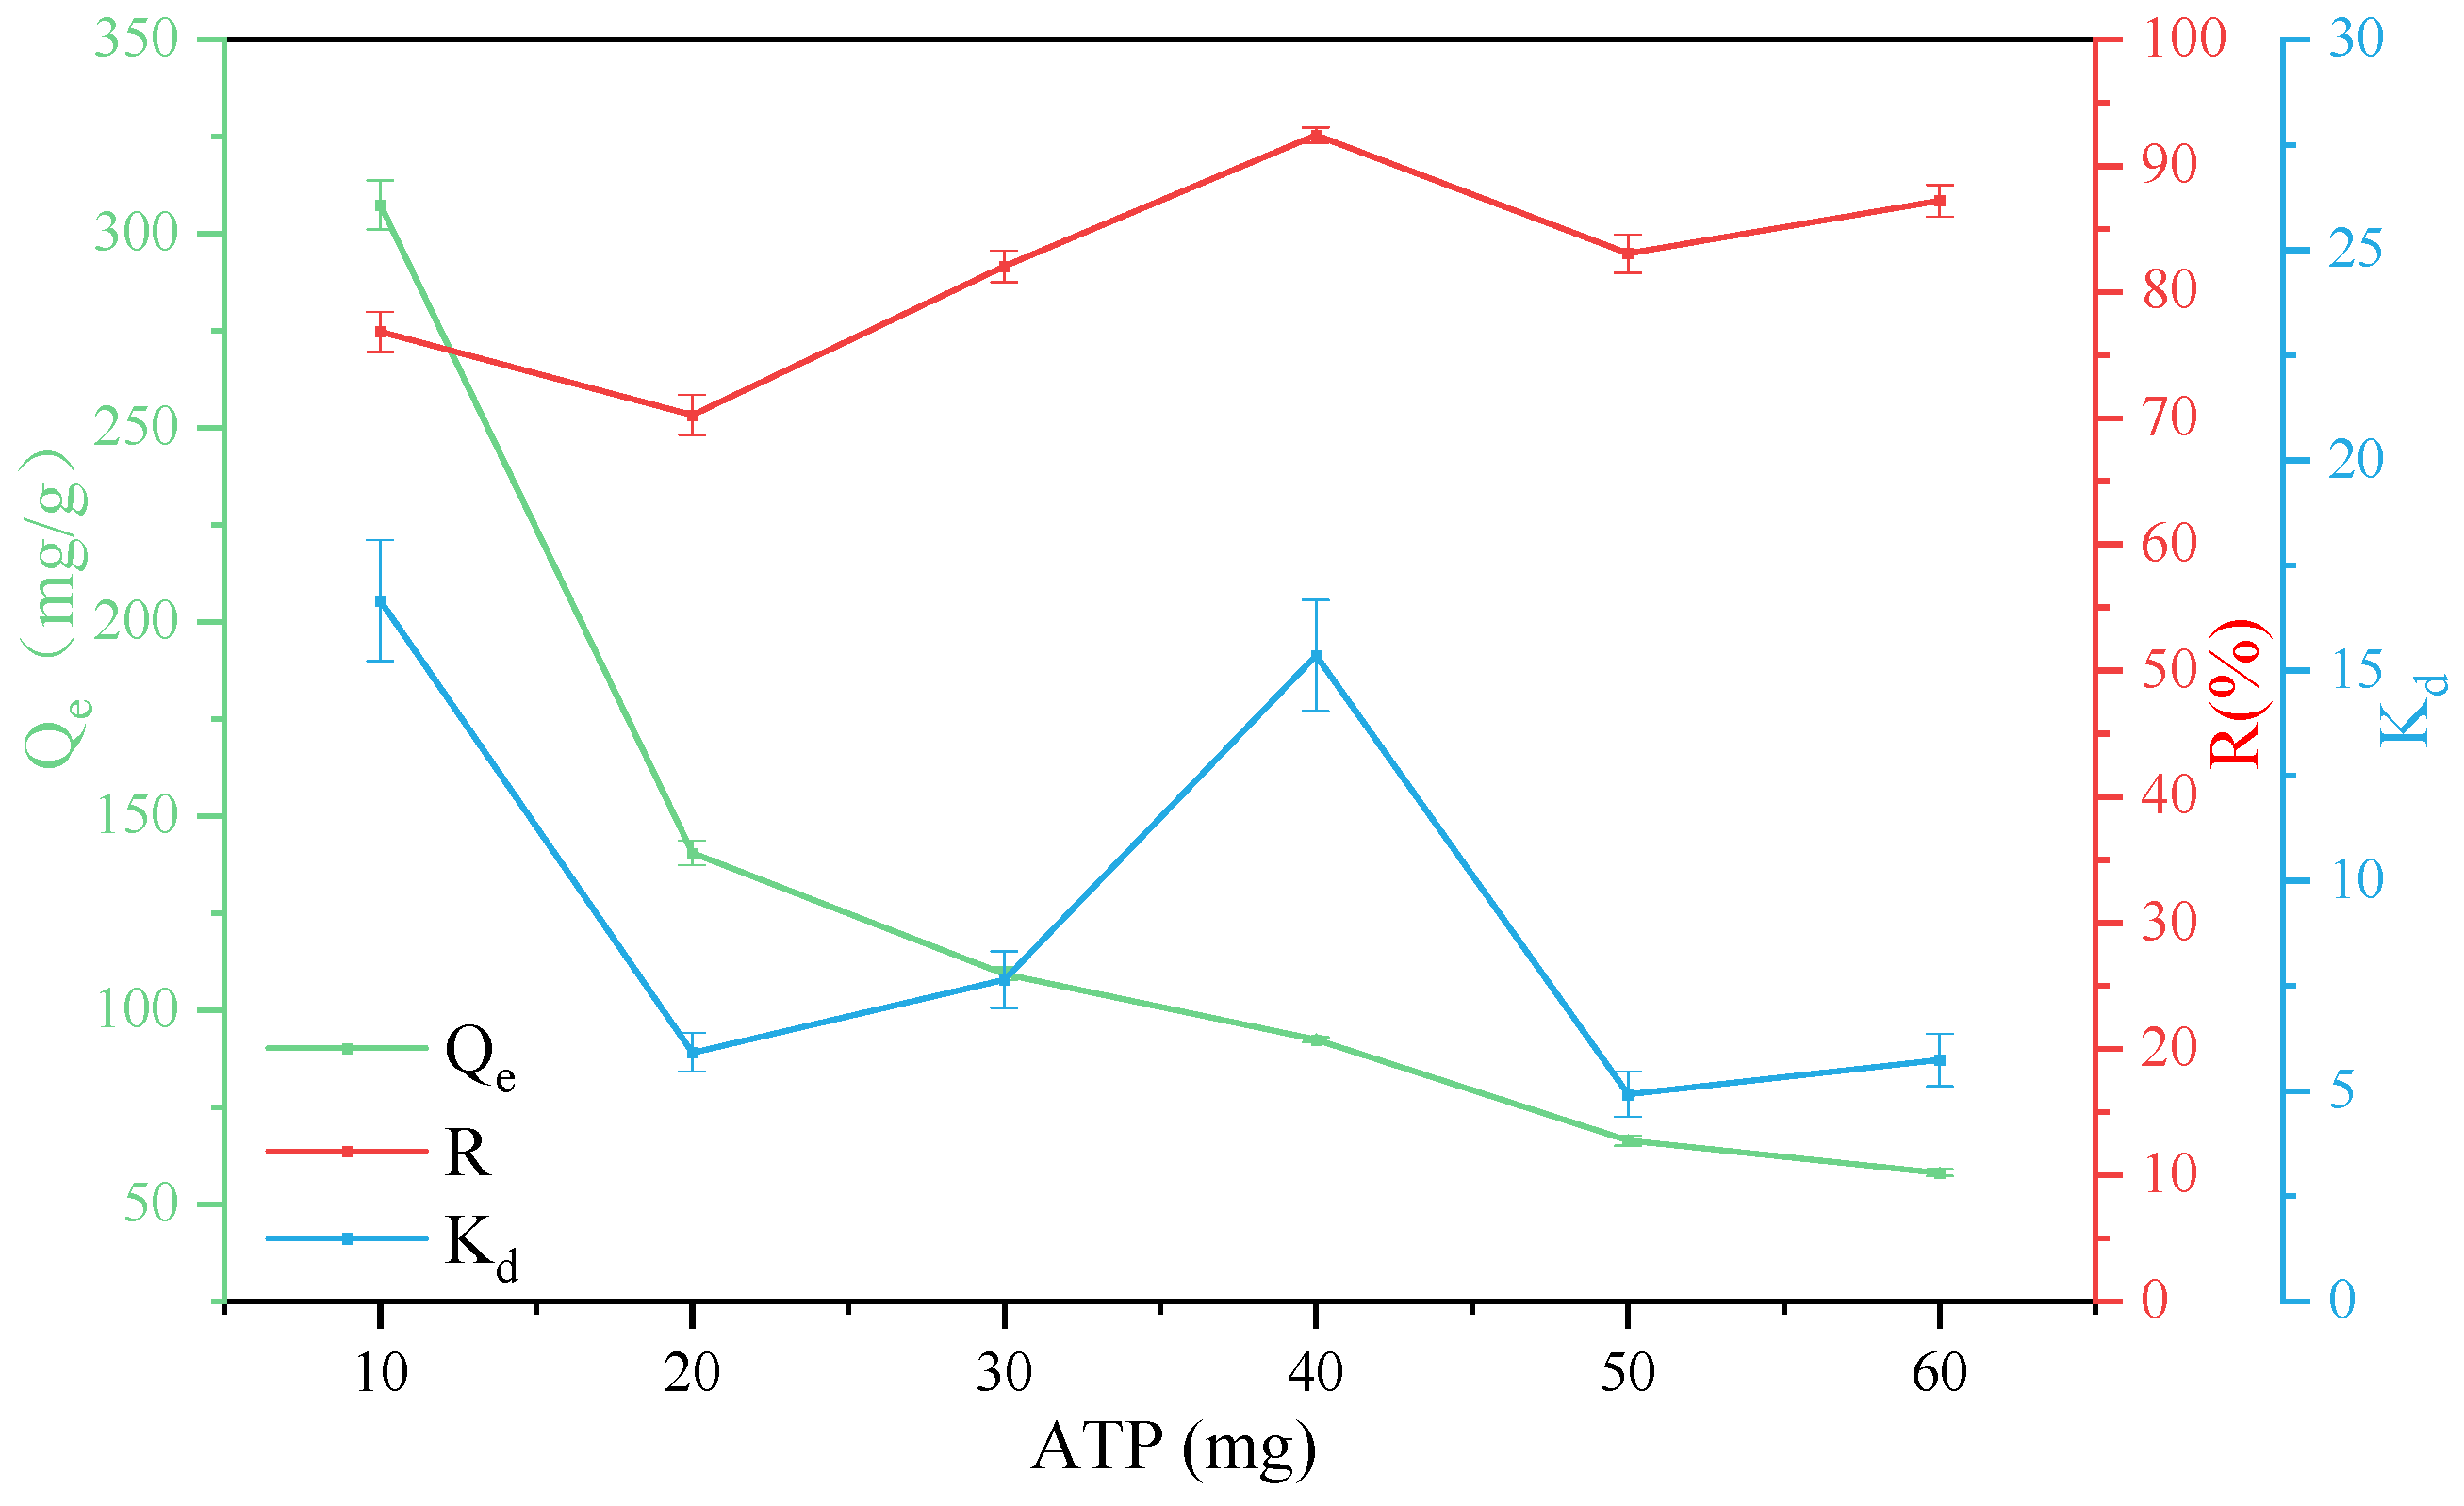
3.3. Effect of Adsorbent Mass

The adsorbent mass also affects the adsorption. Under the conditions of T = 303 K, pH = 3, GO concentration was 80 mg/L, and attapulgite mass was 10 mg, 20 mg, 30 mg, 40 mg, 50 mg and 60 mg, the effects on adsorption capacity, removal rate and partition coefficient were investigated, and the results are shown in Figure 6. With the increase of the attapulgite mass, the removal rate generally shows an upward trend, which is because the number of effective adsorption sites of the adsorbent increases with the increase of the adsorbent mass, thereby improving the adsorption rate and the partition coefficient. However, with the increase of the attapulgite mass, the number of particles per unit volume increases, which is prone to collision and agglomeration, resulting in a decrease in the number of effective active adsorption sites of adsorbent per unit mass, a decrease in the specific surface area of the adsorbent, finally leading to a decrease in the adsorption effect [56]. It can be observed from the figure that attapulgite has the best adsorption effect and relatively low cost when the mass is controlled at 40 mg. Therefore, the attapulgite mass was selected as 40 mg in subsequent studies.

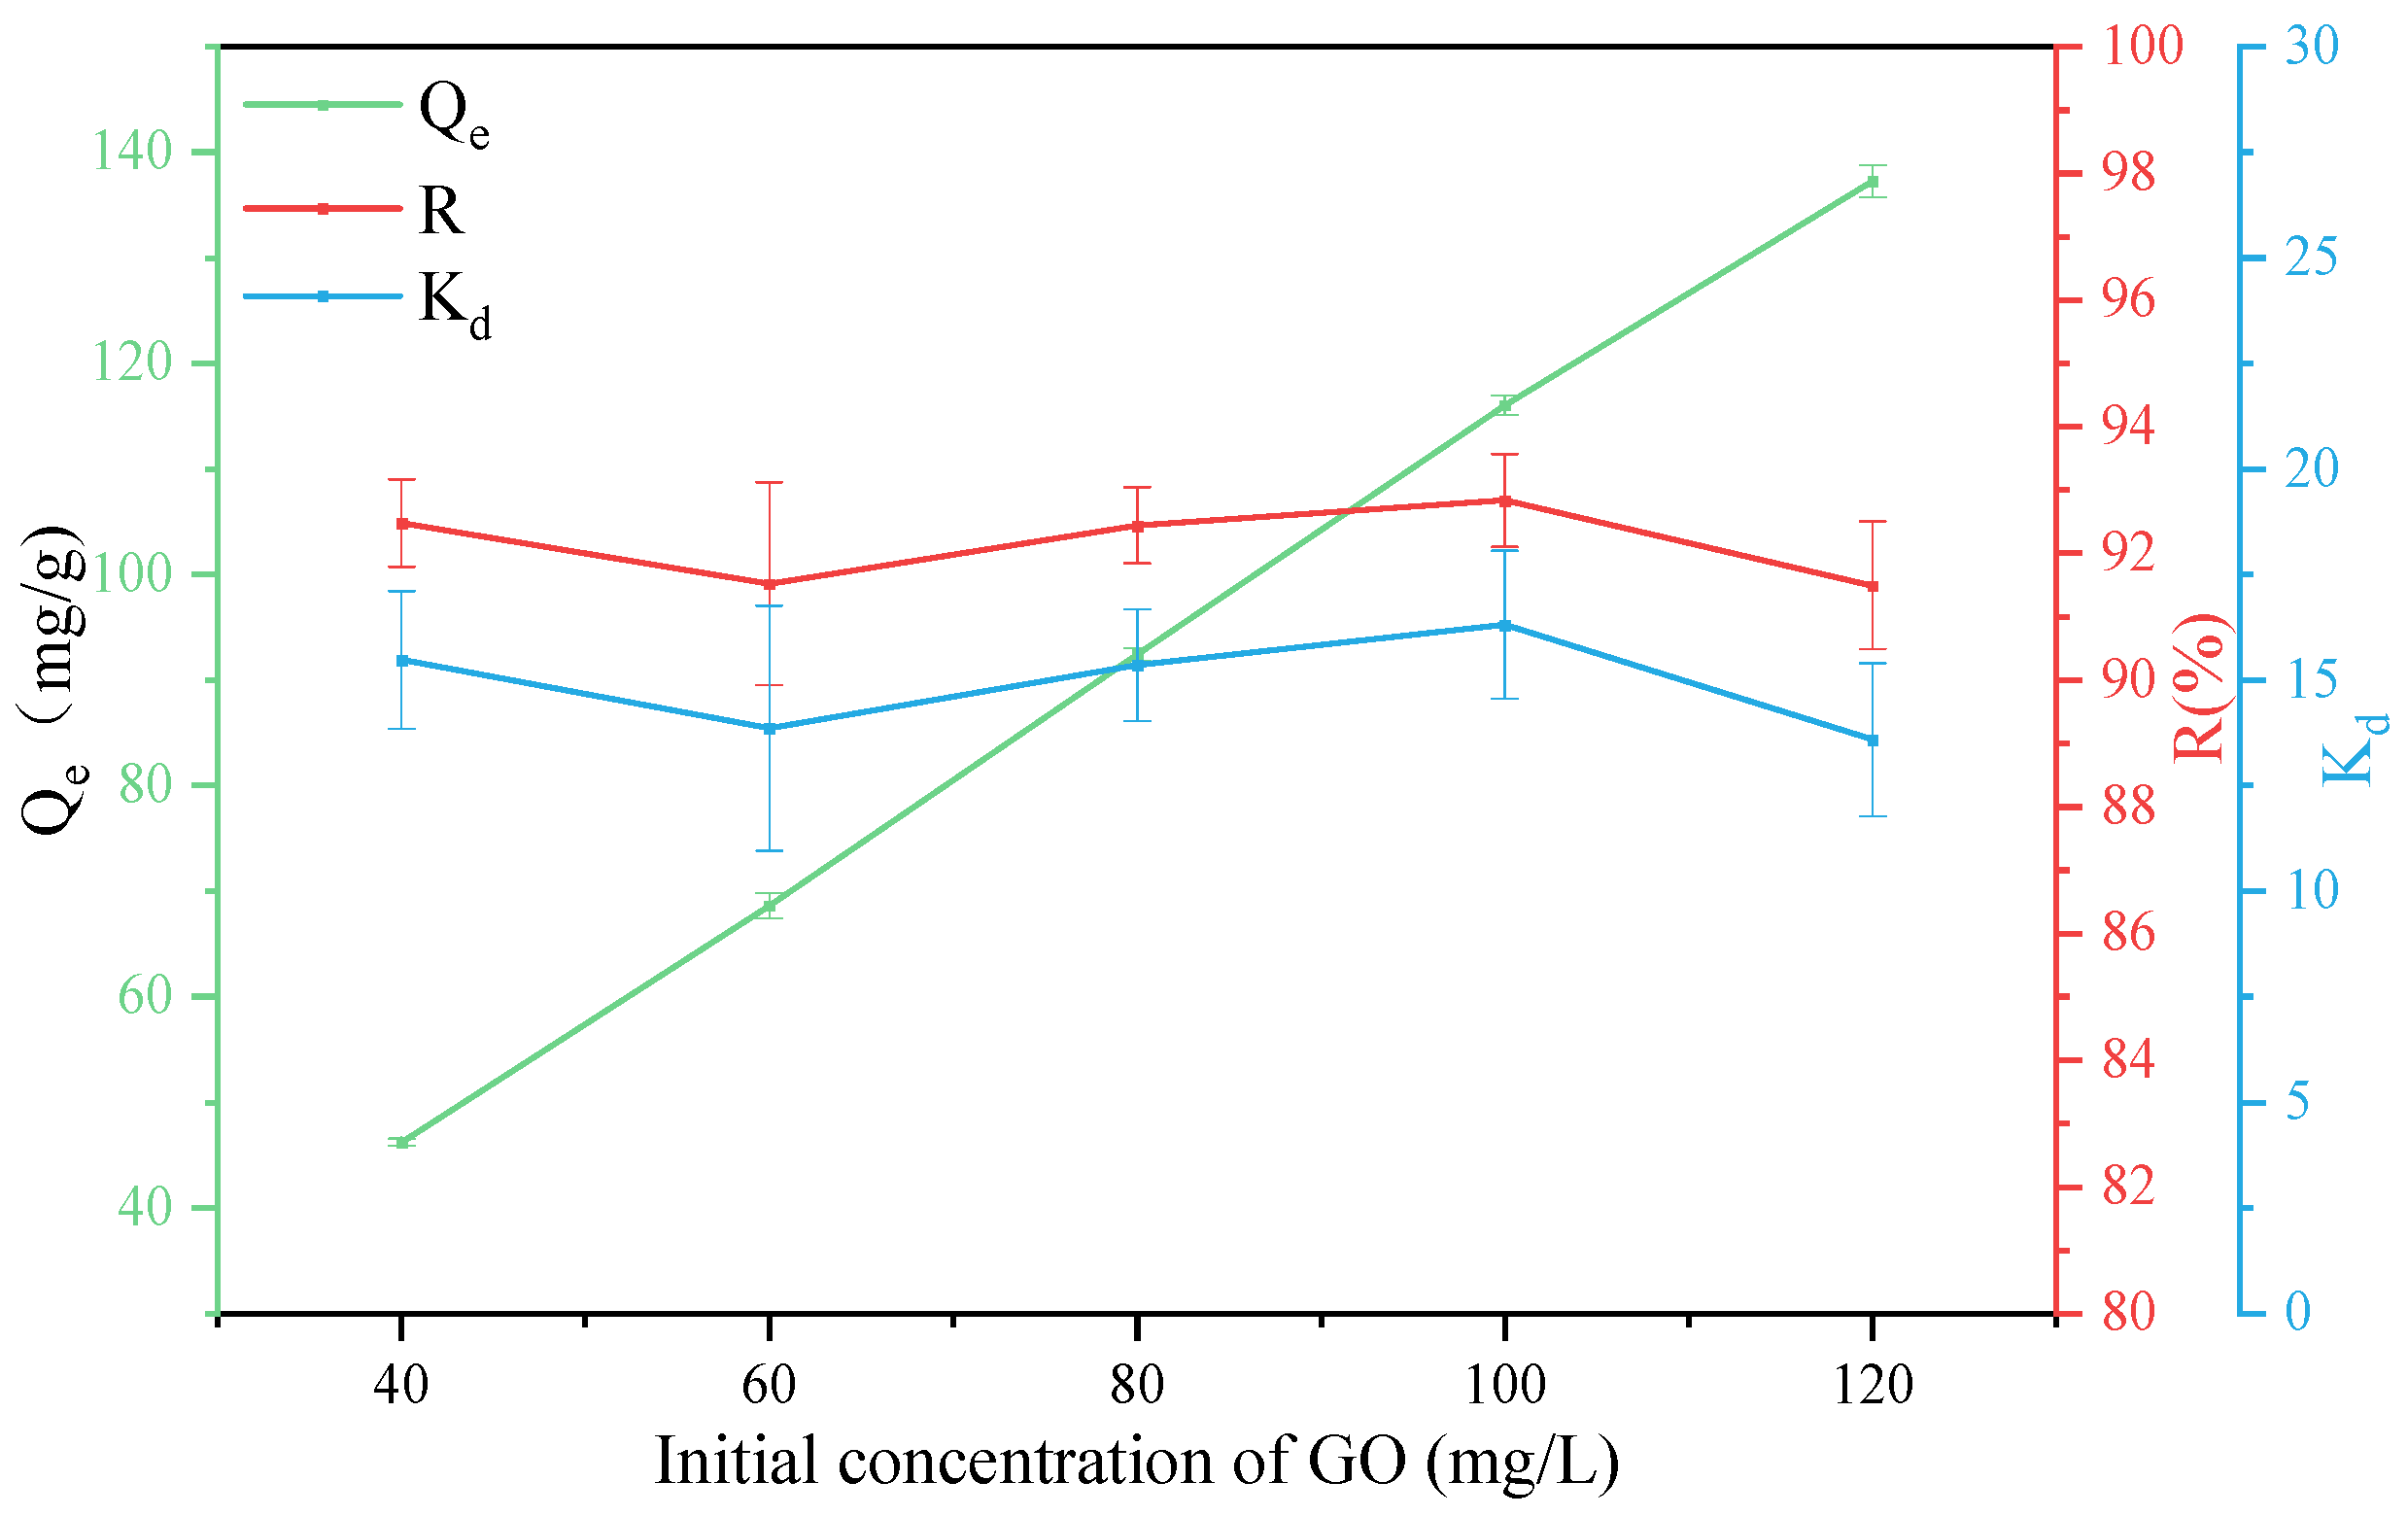
3.4. Effect of GO Concentration

In order to explore the effect of GO concentration on the adsorption, under the conditions of T = 303 K, pH = 3, and an attapulgite mass of 40 mg, adsorption tests were carried out on GO solutions with concentration of 40 mg/L, 60 mg/L, 80 mg/L, 100 mg/L and 120 mg/L, respectively, and the test results are shown in Figure 7. It can be seen that with the increase of GO concentration, the adsorption effect increases first and then decreases, which may be because when the GO concentration is low, there are a large number of active adsorption sites on the surface of attapulgite that do not fully function, resulting in a relatively low adsorption rate. When the GO concentration is 100 mg/L, the adsorption rate R and the partition coefficient Kd reaches the maximum, which is 92.83% and 16.31, respectively. While the GO concentration continues to increase, although the adsorption amount increases, the adsorption rate decreases, which may be because the increase in GO concentration inhibits the electrostatic interaction between attapulgite and GO.

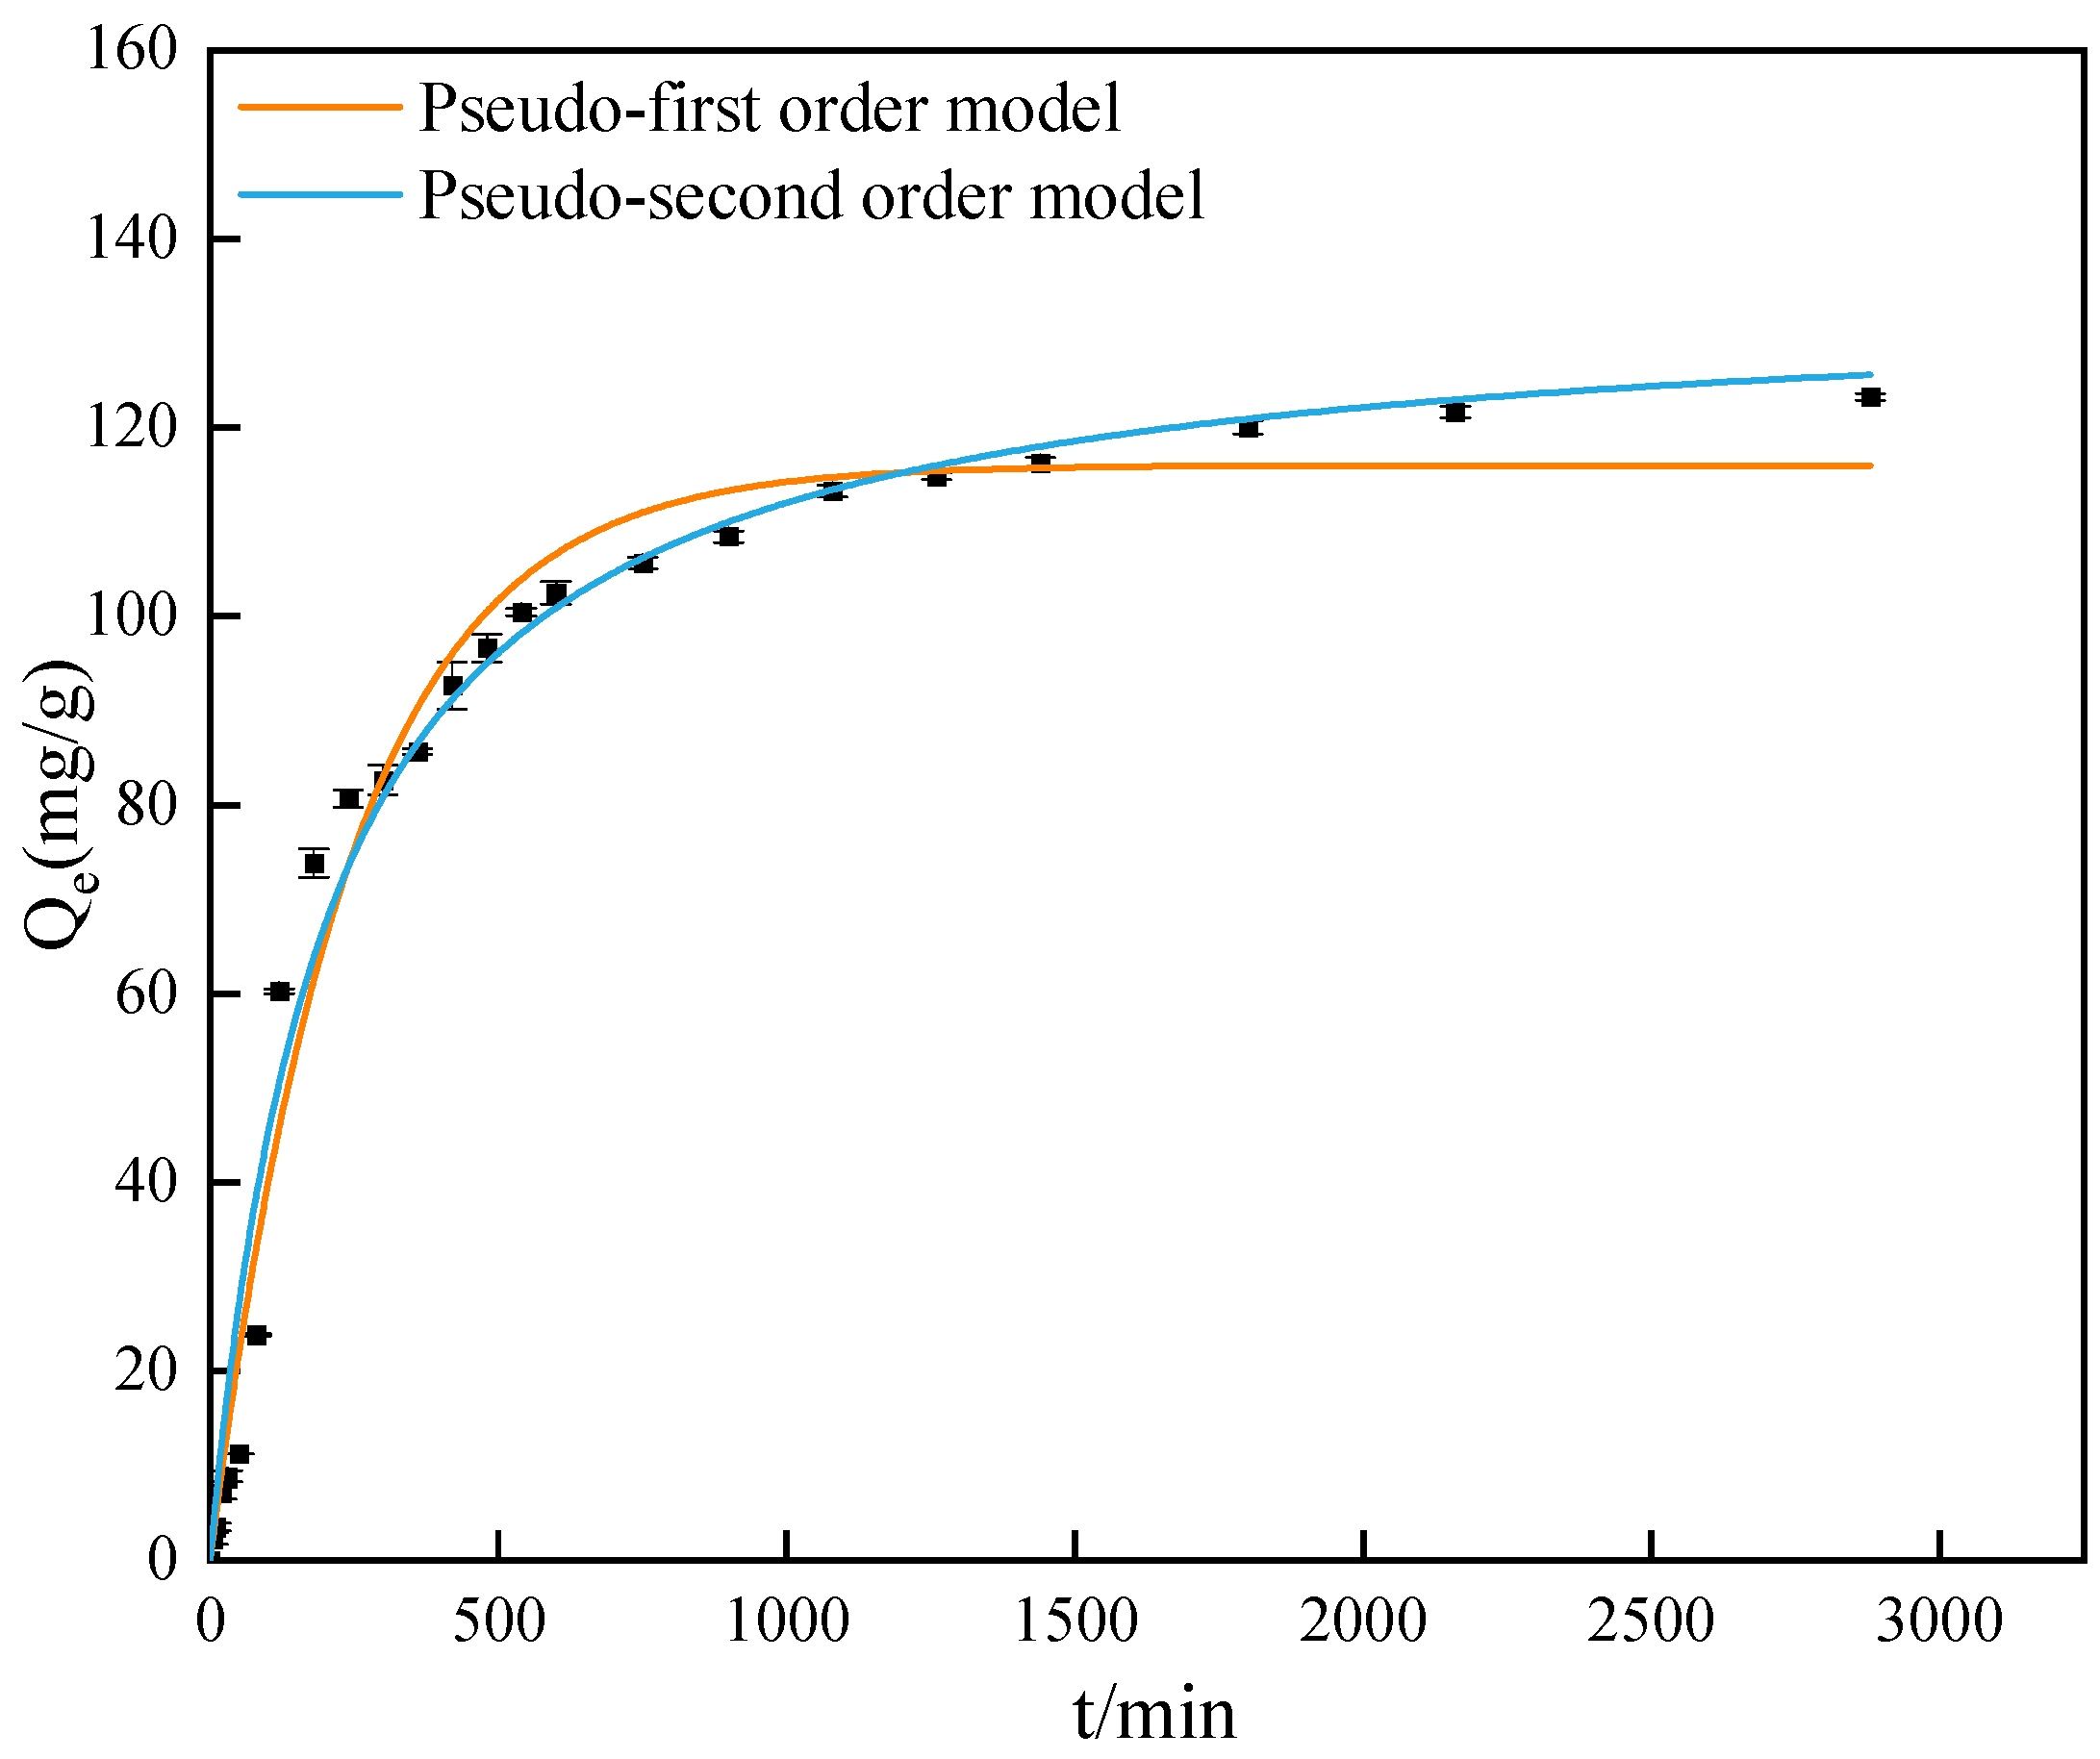
3.5. Adsorption Kinetics

The adsorption time also affects the adsorption. The adsorption capacity and adsorption time were studied under the conditions when T = 303 K, pH = 3, GO concentration was 100 mg/L, and the attapulgite mass was 40 mg. The results are shown in Figure 8. It can be seen that the adsorption capacity of attapulgite to GO increases with time and reaches the adsorption equilibrium at 2160 min. In the initial stage of adsorption, the adsorption amount of GO shows a sharp upward trend with the increase of time, and when the time is 480 min, the adsorption amount increases gradually, which is mainly due to the adsorption amount of GO by attapulgite gradually reaching saturation with the passage of adsorption time.
The results are shown in Figure 8 and Table 3. The equilibrium adsorption capacity fitted by the pseudo-first-order kinetic model is 113.664 mg/g, R2 is 0.980, and that fitted by the pseudo-second-order kinetic model is 130.634 mg/g, R2 is 0.983. The fitting results of the pseudo-second-order kinetic model are closer to the experimental data, and the correlation coefficient R2 is relatively higher than that of the pseudo-first-order kinetic model. Therefore, the pseudo-second-order kinetic model is more in line with the kinetic process of GO adsorption by attapulgite, and the adsorption of GO by attapulgite is accompanied by physical adsorption at the same time as the chemical adsorption [57].

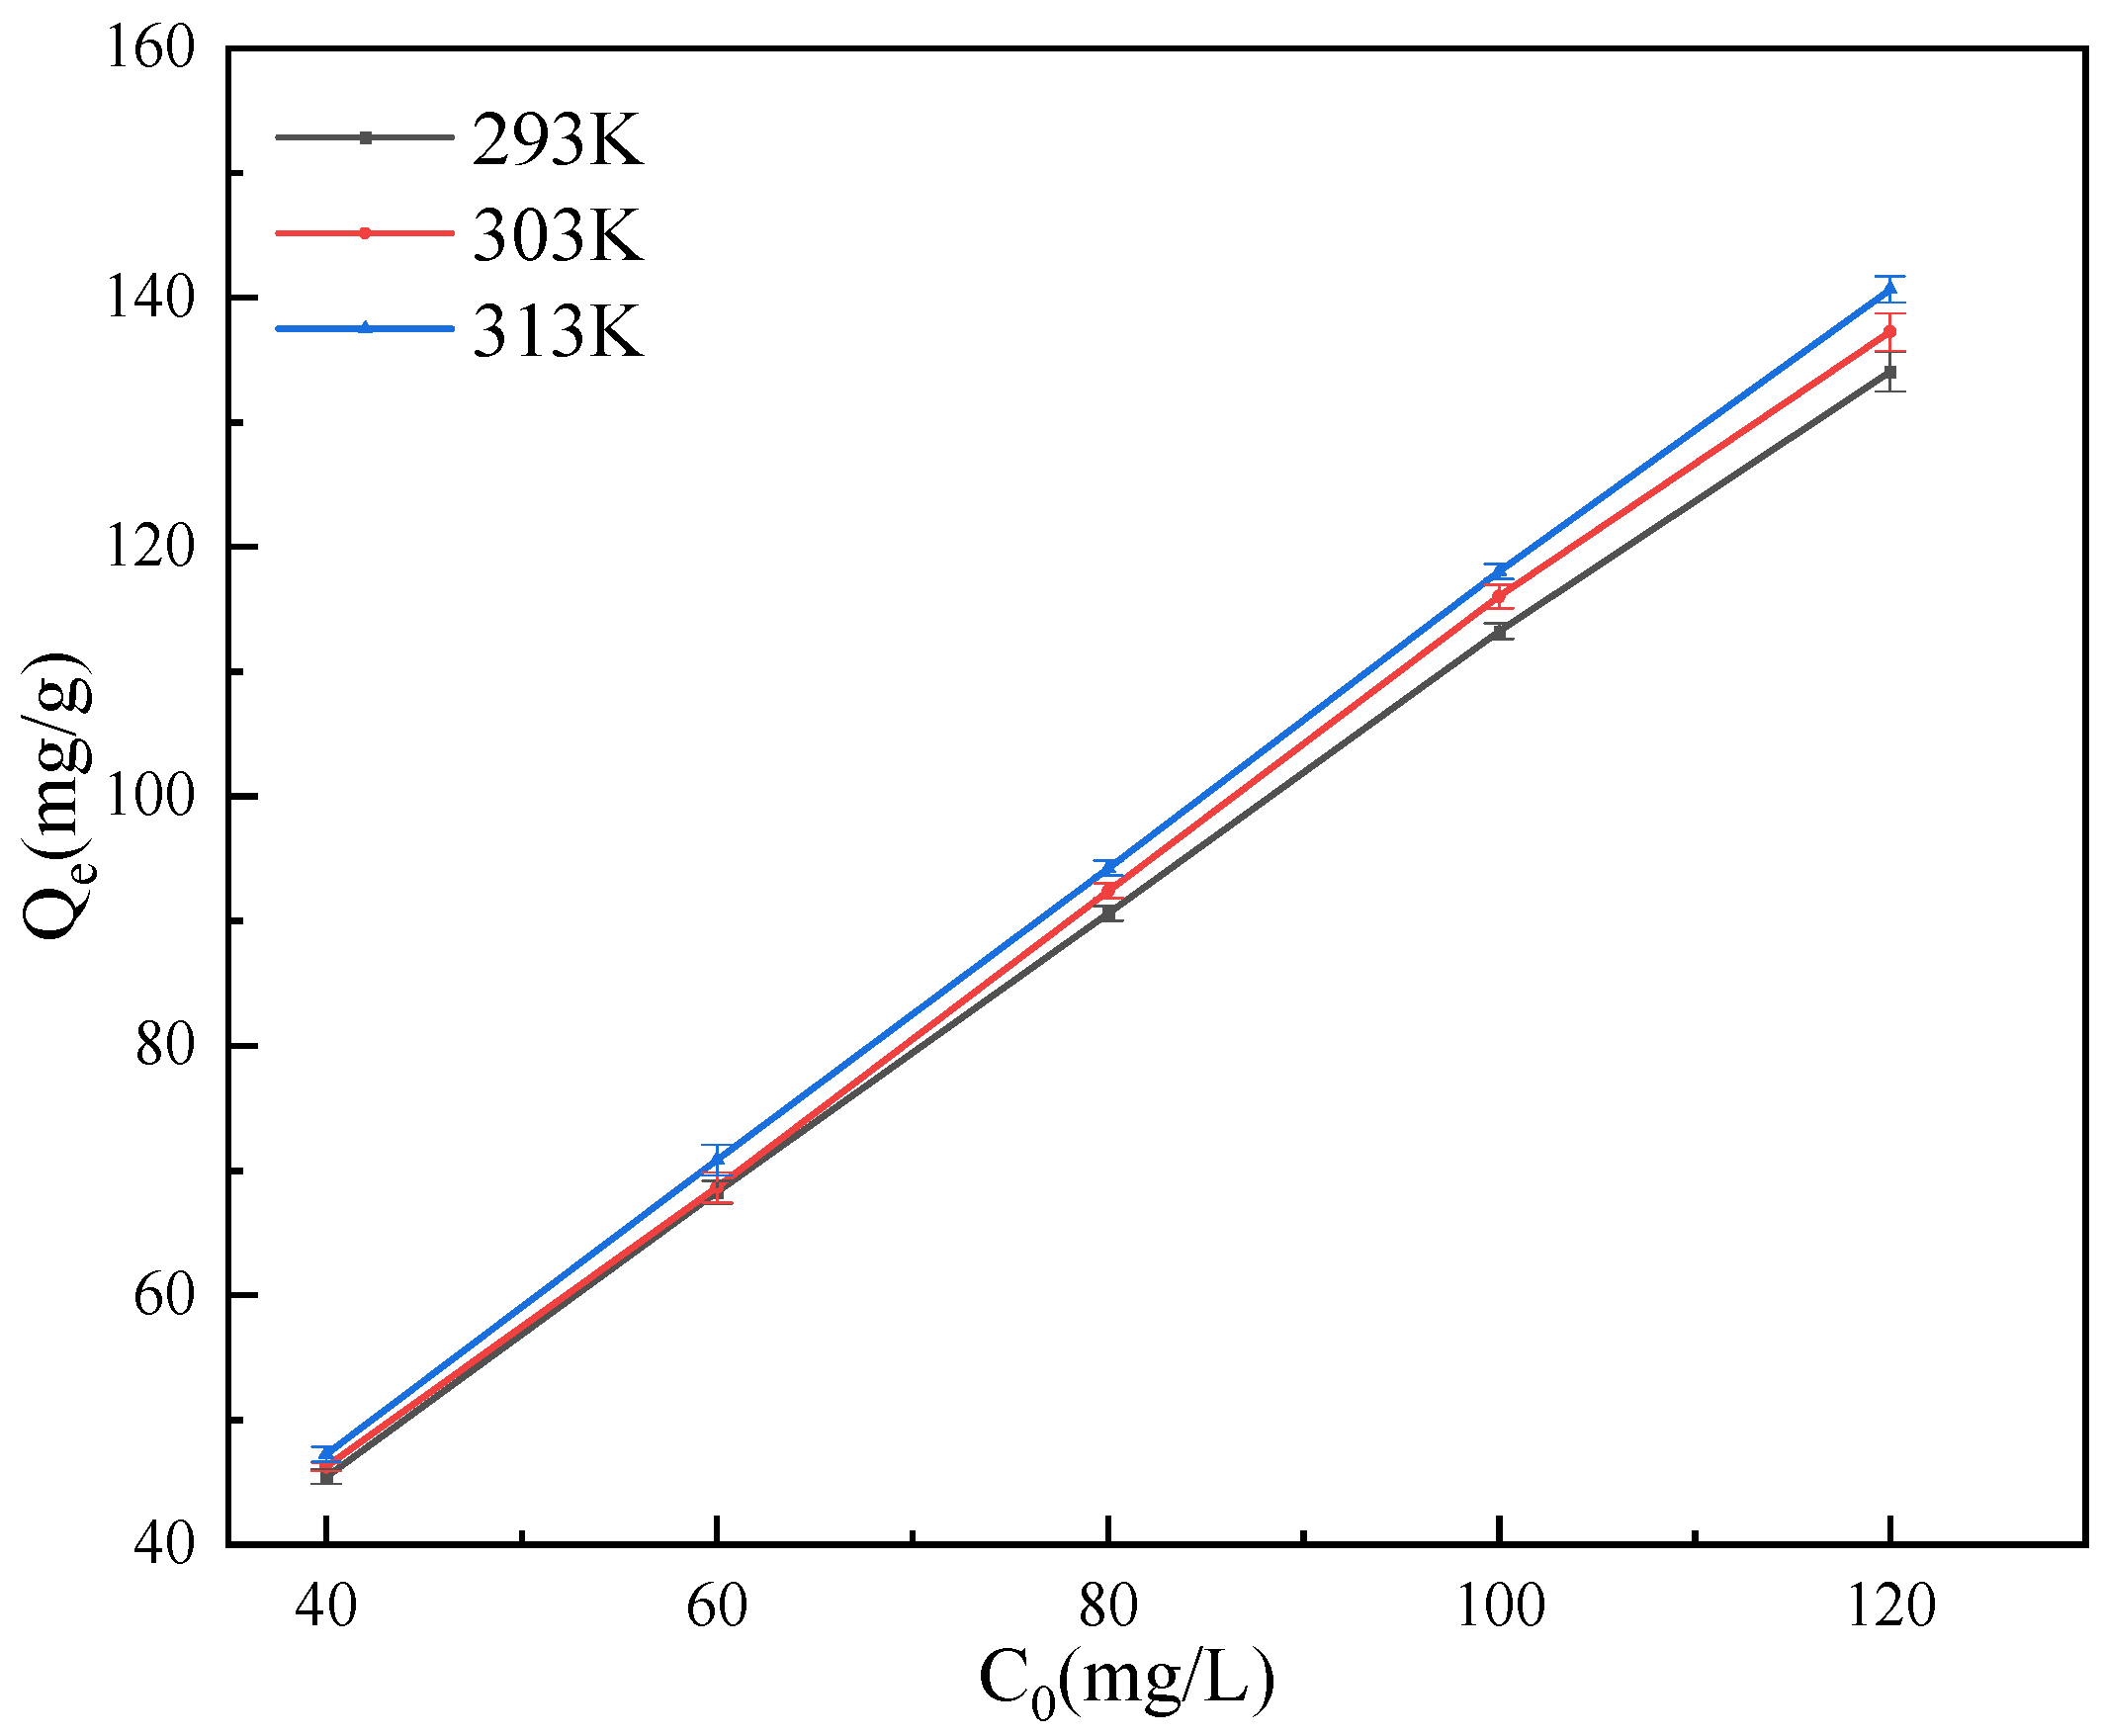
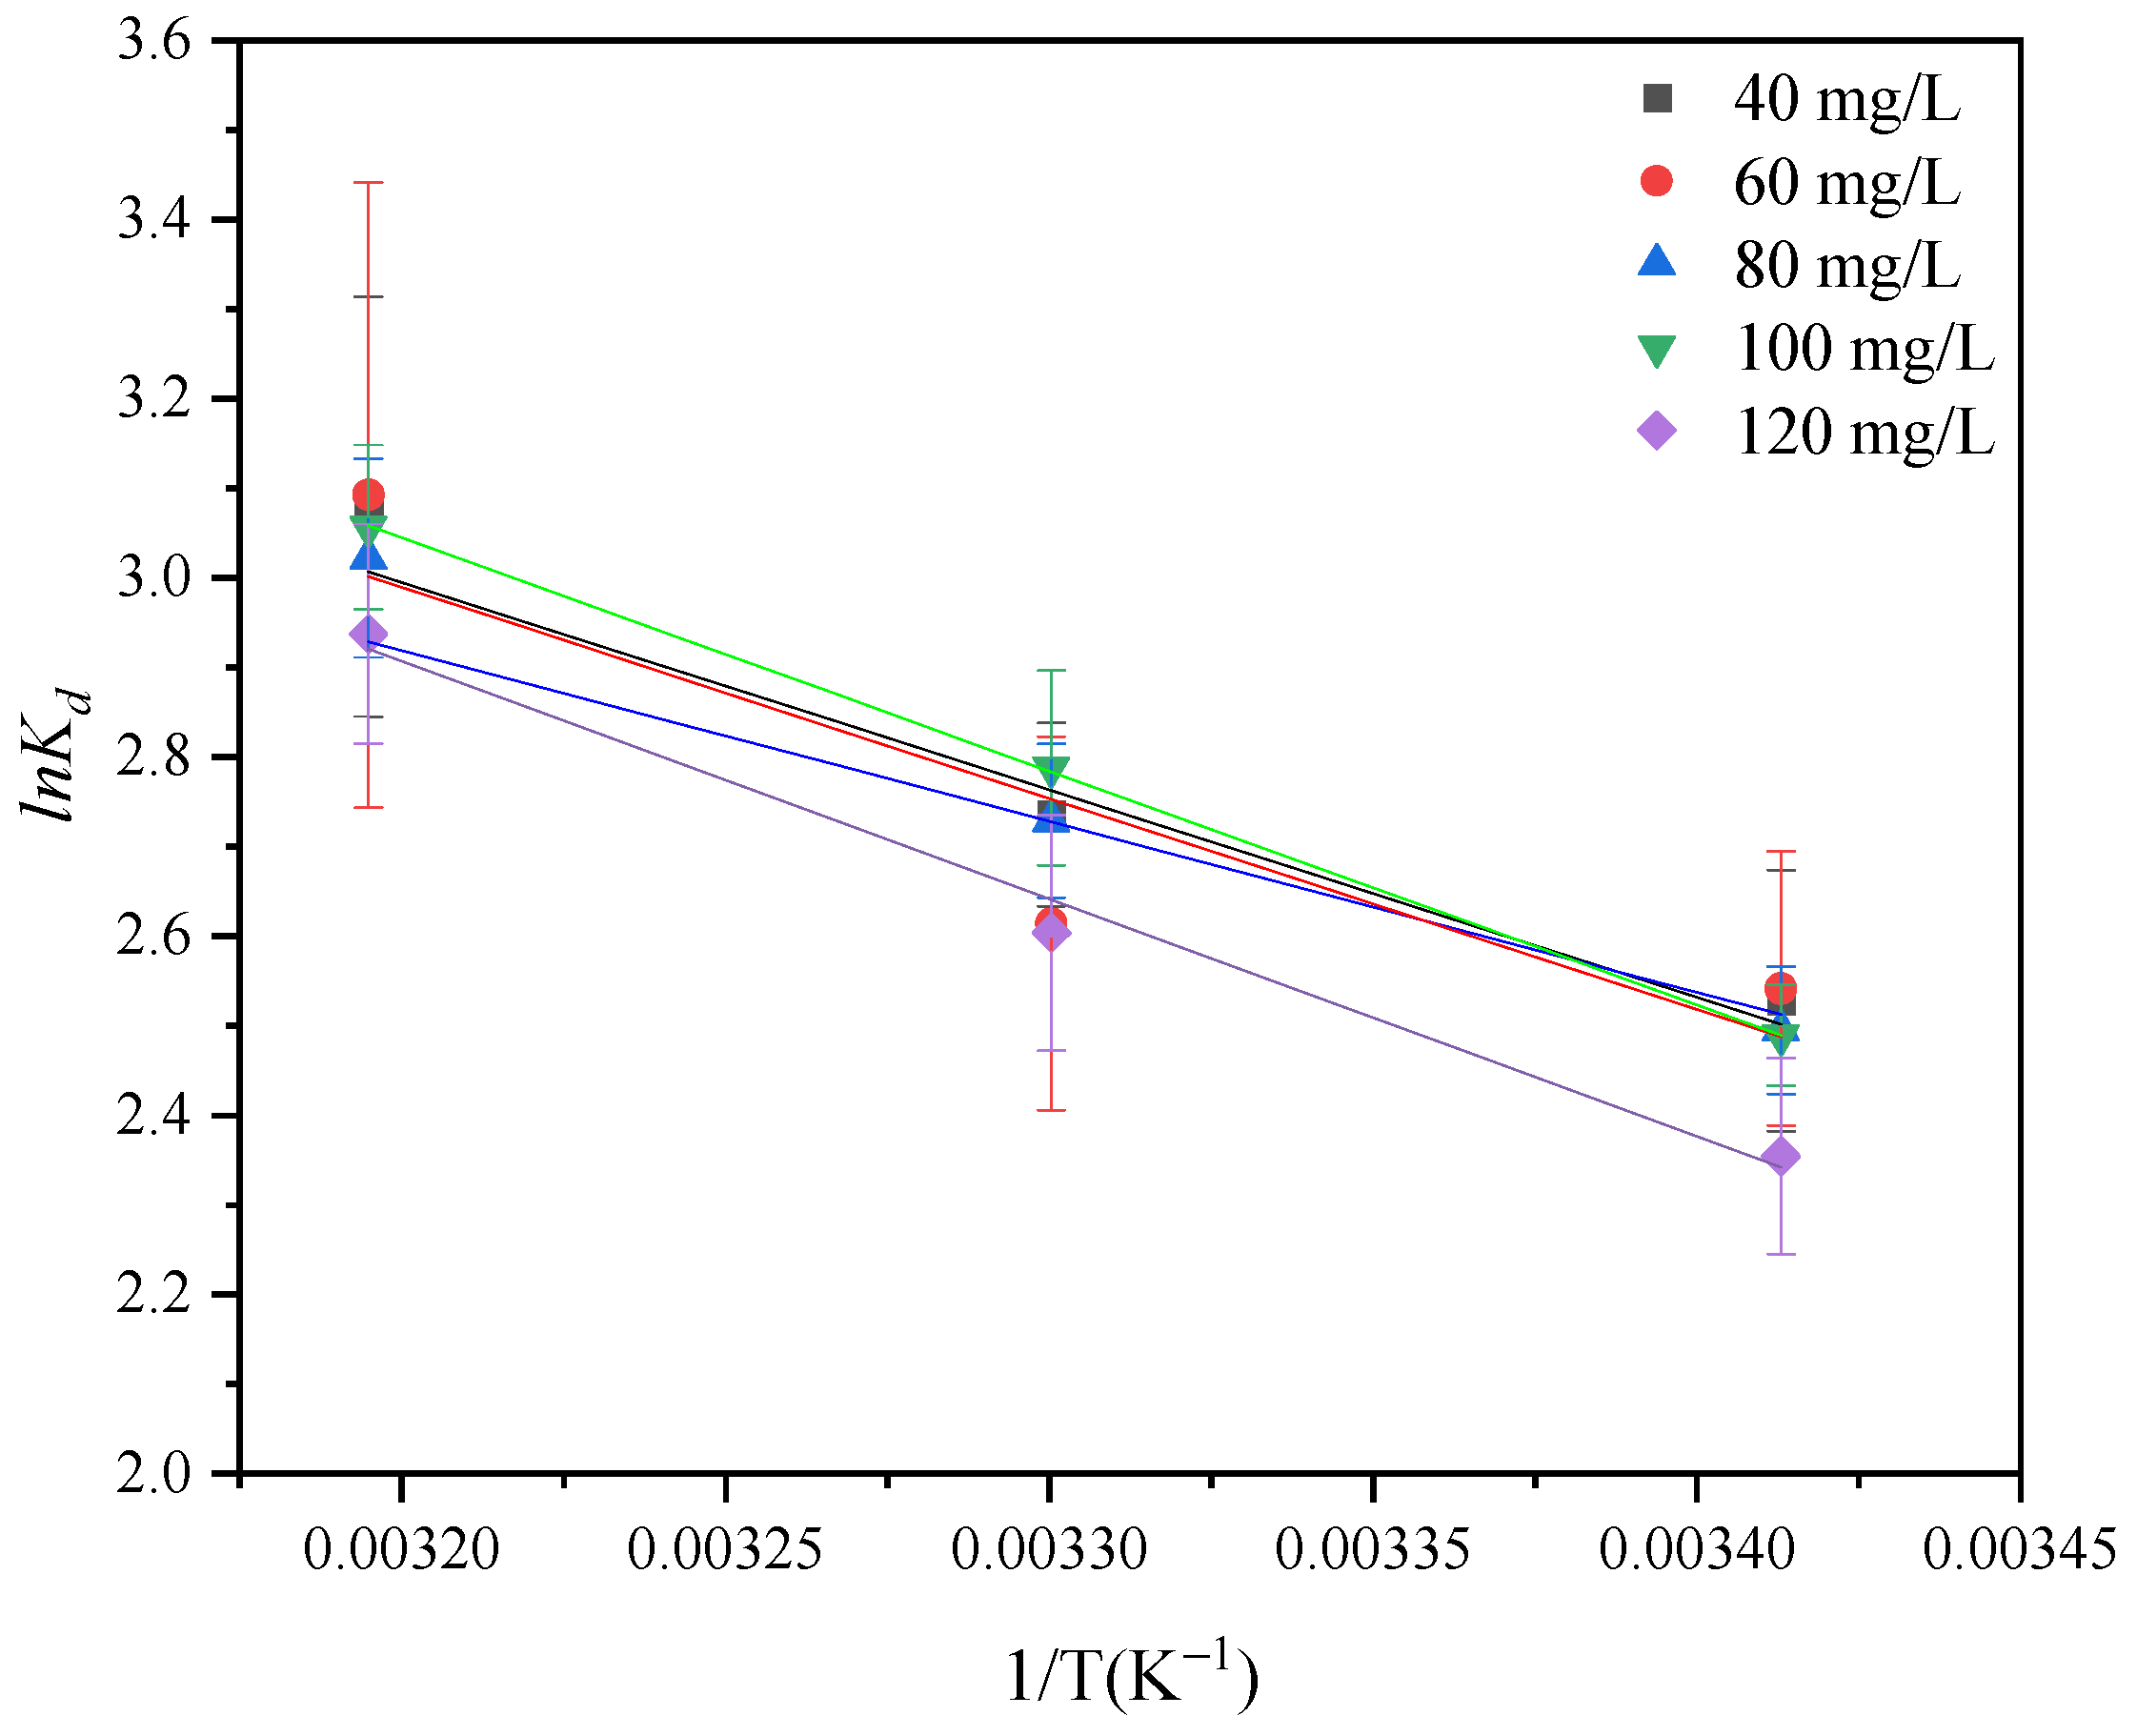
3.6. Adsorption Isotherm and Thermodynamic Analysis

The study of adsorption isotherms helps to understand the relationship between adsorbate and adsorbent [58]. In order to further explore the relationship between them, at three different temperatures of 293 K, 303 K and 313 K, adsorption tests were conducted on GO solutions with concentrations of 40 mg/L, 60 mg/L, 80 mg/L, 100 mg/L, and 120 mg/L, when pH = 3, the attapulgite mass was 40 mg. The test results are shown in Figure 9. It can be seen that with the increase of GO concentration, the adsorption capacity of GO by attapulgite is also increasing and increases with the increase of temperature, indicating that the increase of temperature helps to improve the adsorption effect.
In order to further explore the adsorption morphology of GO on the surface of attapulgite, Langmuir and Freundlich adsorption isotherm equations were used to fit the adsorption process of GO on attapulgite. The fitting results are shown in Figure 10 and Table 4. It can be seen from Table 4 that the correlation coefficient R2 of the fitting results of the Langmuir equation is higher than that of Freundlich equation, indicating that Langmuir equation can more accurately describe the adsorption process of GO by attapulgite, and the adsorption process is based on a uniform monolayer adsorption [59]. In the fitting results of the Langmuir equation, the maximum adsorption capacity Qmax increases with the increase in temperature, indicating that the increase of temperature promotes the progress of the adsorption reaction.
In order to analyze the effect of temperature change during the adsorption of GO by attapulgite, the fitting calculation of thermodynamic parameters was performed on the test results. Table 5 and Figure 11 show the thermodynamic fitting curves and calculating parameters. Under the conditions of temperature at 293 K, 303 K, and 313 K, the standard free energy (∆G0) of GO adsorption by attapulgite at different GO concentrations are all negative, indicating that the adsorption process is spontaneous. With the same concentration, the absolute value of standard free energy (∆G0) increases with the increase of temperature, indicating that the increase of temperature is conductive to adsorption. The enthalpy change ∆H0 is positive at different GO concentrations, indicating that the adsorption process is an endothermic reaction, which is consistent with the isotherm fitting results.
In conclusion, the adsorption of GO on attapulgite may be caused by the combined action of multiple factors. From the point of view of electrical properties, both attapulgite and GO are charged, and the electrostatic interaction between them can cause the coagulation of GO [60]. Attapulgite contains Mg2+ and Ca2+, and the presence of these metal ions also plays a role in the coagulation of GO [61]. Meanwhile, in the coexistence environment of attapulgite and GO, the -OH on the surface of ATP can be complexed with -COOH on the surface of GO [62].

4. Conclusions

In this paper, the adsorption effect of GO by attapulgite was tested under different conditions, and various characterization methods were used to systematically study its adsorption performance and mechanism.
  • By studying the relationship between pH, adsorbent mass, GO concentration, time and temperature on the adsorption effect, it was found that when T = 303 K, pH = 3, the attapulgite mass is 40 mg, and the GO concentration is 100 mg/L, the adsorption effect is the best, and the removal rate can reach 92.83%. The adsorption effect will increase with the increase of adsorption time. When the adsorption time is 480 min, the increase of adsorption amount tends to be gentle, and the adsorption equilibrium is reached at 2160 min. At the same time, the adsorption capacity of GO by attapulgite increases with the increase of temperature. The higher the concentration is, the more obvious the effect of temperature on the adsorption of GO is.
  • By means of SEM, TEM, XRD, AFM, FTIR and XPS, the materials characterization of GO and ATP/GO was conducted. It was found that GO aggregates on the surface of attapulgite, which is not simple accumulation, but is accompanied by the vibration deformation and interaction of functional groups. Further study of XPS spectra shows that the interaction between GO and attapulgite is mainly completed by C-O and O-C=O.
  • The results of adsorption kinetic studies show that the adsorption of GO by attapulgite is more in line with a pseudo-second-order kinetic equation, and the adsorption process is accompanied by physical adsorption along with chemical adsorption. The results of the isotherm study show that the adsorption of GO by attapulgite is more consistent with the Langmuir isotherm model. Based on the calculation of thermodynamic parameters, the adsorption of GO by attapulgite is an endothermic process.
In summary, attapulgite has a strong adsorption capacity to GO in an aqueous solution, which is helpful for understanding the adsorption behavior of minerals to GO in an aqueous solution by providing a reference for reducing the risk of GO in the aqueous environment. Comparing the adsorption of attapulgite in GO with other materials will help to deepen the understanding of the adsorption of GO by materials.
The results of other studies are summarized in Table 6 [63,64,65]. Due to factors such as insufficient theoretical knowledge and the limitations of experimental conditions, the study can also explore the adsorption properties of GO on different types of clay minerals.

Author Contributions

Conceptualization, N.L.; formal analysis, J.F. and H.K.; investigation, P.J. and C.L.; writing—original draft preparation, N.L.; writing—review and editing, W.W. All authors have read and agreed to the published version of the manuscript.

Funding

This research was funded by the National Natural Science Foundation of China (41772311, 52179107), China Scholarship Council (201607910002), and the Research Fund of Zhejiang Provincial Department of Housing and Urban-Rural Development (2017K179, 2016K130).

Institutional Review Board Statement

Not applicable.

Informed Consent Statement

Not applicable.

Data Availability Statement

Not applicable.

Conflicts of Interest

The authors declare that they have no conflict of interest.

References

  1. Huang, X.M.; Liu, L.Z.; Zhou, S.; Zhao, J.J. Physical properties and device applications of graphene oxide. Front. Phys. 2020, 15, 1–70. [Google Scholar] [CrossRef] [Green Version]
  2. Velusamy, S.; Roy, A.; Sundaram, S.; Mallick, T.K. A Review on Heavy Metal Ions and Containing Dyes Removal Through Graphene Oxide-Based Adsorption Strategies for Textile Wastewater Treatment. Chem. Rec. 2021, 21, 1570–1610. [Google Scholar] [CrossRef]
  3. Reynosa-Martinez, A.C.; Tovar, G.N.; Gallegos, W.R.; Rodriguez-Melendez, H.; Torres-Cadena, R.; Mondragon-Solorzano, G.; Barroso-Flores, J.; Alvarez-Lemus, M.A.; Montalvo, V.G.; Lopez-Honorato, E. Effect of the degree of oxidation of graphene oxide on As(III) adsorption. J. Hazard. Mater. 2020, 384, 121440. [Google Scholar] [CrossRef] [PubMed] [Green Version]
  4. Wernke, G.; Shimabuku-Biadola, Q.L.; dos Santos, T.R.T.; Silva, M.F.; Fagundes-Klen, M.R.; Bergamasco, R. Adsorption of cephalexin in aqueous media by graphene oxide: Kinetics, isotherm, and thermodynamics. Environ. Sci. Pollut. Res. 2020, 27, 4725–4736. [Google Scholar] [CrossRef] [PubMed]
  5. Mondal, N.K.; Chakraborty, S. Adsorption of Cr(VI) from aqueous solution on graphene oxide (GO) prepared from graphite: Equilibrium, kinetic and thermodynamic studies. Appl. Water Sci. 2020, 10, 1–10. [Google Scholar] [CrossRef] [Green Version]
  6. Liu, X.; Sun, J.; Xu, X.T.; Alsaedi, A.; Hayat, T.; Li, J.X. Adsorption and desorption of U(VI) on different-size graphene oxide. Chem. Eng. J. 2019, 360, 941–950. [Google Scholar] [CrossRef]
  7. Zhang, J.F.; Xie, X.D.; Meng, X.G.; Li, Y.; Zhu, W.H. The critical role of oxidative debris in the adsorption and desorption of Pb(II) to graphene oxides under alkaline groundwater conditions. Sci. Total Environ. 2020, 704, 135254. [Google Scholar] [CrossRef]
  8. Lingamdinne, L.P.; Koduru, J.R.; Roh, H.; Choi, Y.L.; Chang, Y.Y.; Yang, J.K. Adsorption removal of Co(II) from waste-water using graphene oxide. Hydrometallurgy 2016, 165, 90–96. [Google Scholar] [CrossRef]
  9. Chowdhury, I.; Duch, M.C.; Mansukhani, N.D.; Hersam, M.C.; Bouchard, D. Colloidal Properties and Stability of Graphene Oxide Nanomaterials in the Aquatic Environment. Environ. Sci. Technol. 2013, 47, 6288–6296. [Google Scholar] [CrossRef]
  10. Cao, X.; Ma, C.; Zhao, J.; Musante, C.; White, J.C.; Wang, Z.; Xing, B. Interaction of graphene oxide with co-existing arsenite and arsenate: Adsorption, transformation and combined toxicity. Environ. Int. 2019, 131, 104992. [Google Scholar] [CrossRef]
  11. Ren, C.X.; Hu, X.G.; Li, X.Y.; Zhou, Q.X. Ultra-trace graphene oxide in a water environment triggers Parkinson’s disease-like symptoms and metabolic disturbance in zebrafish larvae. Biomaterials 2016, 93, 83–94. [Google Scholar] [CrossRef] [PubMed]
  12. Guo, Q.; Yang, Y.; Zhao, L.; Chen, J.; Duan, G.; Yang, Z.; Zhou, R. Graphene oxide toxicity in W1118 flies. Sci. Total Environ. 2022, 805, 150302. [Google Scholar] [CrossRef] [PubMed]
  13. Jin, L.; Dou, T.-T.; Chen, J.-Y.; Duan, M.-X.; Zhen, Q.; Wu, H.-Z.; Zhao, Y.-L. Sublethal toxicity of graphene oxide in Caenorhabditis elegans under multi-generational exposure. Ecotoxicol. Environ. Saf. 2022, 229, 113064. [Google Scholar] [CrossRef] [PubMed]
  14. Lin, Y.F.; Zhang, Y.; Li, J.; Kong, H.T.; Yan, Q.L.; Zhang, J.C.; Li, W.; Ren, N.; Cui, Y.Z.; Zhang, T.; et al. Blood exposure to graphene oxide may cause anaphylactic death in non-human primates. Nano Today 2020, 35, 100922. [Google Scholar] [CrossRef]
  15. Ou, L.L.; Lv, X.J.; Wu, Z.X.; Xia, W.B.; Huang, Y.D.; Chen, L.Y.; Sun, W.J.; Qi, Y.; Yang, M.; Qi, L. Oxygen content-related DNA damage of graphene oxide on human retinal pigment epithelium cells. J. Mater. Sci. Mater. Med. 2021, 32, 1–9. [Google Scholar] [CrossRef]
  16. Liu, X.; Sun, J.; Xu, X.; Sheng, G.; Sun, Y.; Huang, Y.; Alsaedi, A.; Hayat, T.; Li, J. Is the interaction between graphene oxide and minerals reversible? Environ. Pollut. 2019, 249, 785–793. [Google Scholar] [CrossRef] [PubMed]
  17. Huang, B.; Yuan, Z.J.; Li, D.Q.; Zheng, M.G.; Nie, X.D.; Liao, Y.S. Effects of soil particle size on the adsorption, distribution, and migration behaviors of heavy metal(loid)s in soil: A review. Environ. Sci. Processes Impacts 2020, 22, 1596–1615. [Google Scholar] [CrossRef]
  18. Conde-Cid, M.; Fernandez-Calvino, D.; Nunez-Delgado, A.; Fernandez-Sanjurjo, M.J.; Arias-Estevez, M.; Alvarez-Rodriguez, E. Estimation of adsorption/desorption Freundlich’s affinity coefficients for oxytetracycline and chlortetracycline from soil properties: Experimental data and pedotransfer functions. Ecotoxicol. Environ. Saf. 2020, 196, 110584. [Google Scholar] [CrossRef]
  19. Jedidi, A.; Kraiem, A.; Dardouri, S.; Marcoux, M.; Sghaier, J. Adsorption of Dye on a Tunisian Unsaturated Layered Soil: Physical and Numerical Modeling. Eurasian Soil Sci. 2020, 53, 1132–1141. [Google Scholar] [CrossRef]
  20. Otunola, B.O.; Ololade, O.O. A review on the application of clay minerals as heavy metal adsorbents for remediation purposes. Environ. Technol. Innov. 2020, 18, 100692. [Google Scholar] [CrossRef]
  21. Yan, Z.; Liu, Q.; Liang, L.; Ouyang, J. Surface hydroxyls mediated CO2 methanation at ambient pressure over attapulgite-loaded Ni-TiO2 composite catalysts with high activity and reuse ability. J. CO2 Util. 2021, 47, 101489. [Google Scholar] [CrossRef]
  22. Deng, Q.L.; Chen, C.; Lei, Q.; Liang, J.H.; Zhang, T.H.; Jiang, J.L. Adsorption of aniline from aqueous solution using graphene oxide-modified attapulgite composites. RSC Adv. 2018, 8, 23382–23389. [Google Scholar] [CrossRef] [Green Version]
  23. Liu, J.; Liu, J.; Zhong, J.P.; Shen, J.L.; Ren, S.L. Preparation of Graphene Oxide/Attapulgite Composites and Their Demulsification Performance for Oil-in-Water Emulsion. Energ. Fuel 2021, 35, 5172–5180. [Google Scholar] [CrossRef]
  24. Deng, Y.H.; Li, Y.N.; Nie, W.J.; Gao, X.; Zhang, L.; Yang, P.L.; Tan, X.C. Fast Removal of Propranolol from Water by Attapulgite/Graphene Oxide Magnetic Ternary Composites. Materials 2019, 12, 924. [Google Scholar] [CrossRef] [PubMed] [Green Version]
  25. Wei, B.G.; Cheng, X.B.; Wang, G.; Li, H.; Song, X.S.; Dai, L. Graphene Oxide Adsorption Enhanced by Attapulgite to Remove Pb (II) from Aqueous Solution. Appl. Sci. 2019, 9, 1390. [Google Scholar] [CrossRef] [Green Version]
  26. Liu, X.; Xu, X.T.; Sun, J.; Alsaedi, A.; Hayat, T.; Li, J.X.; Wang, X.K. Insight into the impact of interaction between attapulgite and graphene oxide on the adsorption of U(VI). Chem. Eng. J. 2018, 343, 217–224. [Google Scholar] [CrossRef]
  27. Abba, M.U.; Che Man, H.; Azis, S.; Idris, A.I.; Hazwan Hamzah, M.; Abdulsalam, M. Synthesis of nano-magnetite from industrial mill chips for the application of boron removal: Characterization and adsorption efficacy. Int. J. Environ. Res. Public Health 2021, 18, 1400. [Google Scholar] [CrossRef]
  28. Piaskowski, K.; Zarzycki, P.K. Carbon-based nanomaterials as promising material for wastewater treatment processes. Int. J. Environ. Res. Public Health 2020, 17, 5862. [Google Scholar] [CrossRef]
  29. Liu, J.; Zhang, J.; Xing, L.; Wang, D.; Wang, L.; Xiao, H.; Ke, J. Magnetic Fe3O4/attapulgite hybrids for Cd (II) adsorption: Performance, mechanism and recovery. J. Hazard. Mater. 2021, 412, 125237. [Google Scholar] [CrossRef]
  30. Huang, R.L.; Lin, Q.T.; Zhong, Q.F.; Zhang, X.F.; Wen, X.Q.; Luo, H.Y. Removal of Cd(II) and Pb(II) from aqueous solution by modified attapulgite clay. Arab. J. Chem. 2020, 13, 4994–5008. [Google Scholar] [CrossRef]
  31. Simonin, J.-P. On the comparison of pseudo-first order and pseudo-second order rate laws in the modeling of adsorption kinetics. Chem. Eng. J. 2016, 300, 254–263. [Google Scholar] [CrossRef] [Green Version]
  32. Neolaka, Y.A.B.; Lawa, Y.; Naat, J.N.; Riwu, A.A.P.; Iqbal, M.; Darmokoesoemo, H.; Kusuma, H.S. The adsorption of Cr(VI) from water samples using graphene oxide-magnetic (GO-Fe3O4) synthesized from natural cellulose-based graphite (kusambi wood or Schleichera oleosa): Study of kinetics, isotherms and thermodynamics. J. Mater. Res. Technol. 2020, 9, 6544–6556. [Google Scholar] [CrossRef]
  33. Fernandes, E.P.; Silva, T.S.; Carvalho, C.M.; Selvasembian, R.; Chaukura, N.; Oliveira, L.M.; Meneghetti, S.M.P.; Meili, L. Efficient adsorption of dyes by γ-alumina synthesized from aluminum wastes: Kinetics, isotherms, thermodynamics and toxicity assessment. J. Environ. Chem. Eng. 2021, 9, 106198. [Google Scholar] [CrossRef]
  34. Abou Taleb, M.F.; Abou El Fadl, F.I.; Albalwi, H. Adsorption of Toxic dye in wastewater onto Magnetic NVP/CS Nanocomposite hydrogels synthesized using gamma radiation. Sep. Purif. Technol. 2021, 266, 118551. [Google Scholar] [CrossRef]
  35. Cui, M.K.; Mu, P.; Shen, Y.Q.; Zhu, G.R.; Luo, L.; Li, J. Three-dimensional attapulgite with sandwich-like architecture used for multifunctional water remediation. Sep. Purif. Technol. 2020, 235, 116210. [Google Scholar] [CrossRef]
  36. Hoor, Y.Q.; Au, P.I.; Mubarak, N.M.; Khalid, M.; Jagadish, P.; Walvekar, R.; Abdullah, E.C. Surface force arising from Adsorbed graphene oxide in kaolinite suspensions. Colloid Surf. A 2020, 592, 124592. [Google Scholar] [CrossRef]
  37. Wang, M.; Guo, Y.; Fu, X.; Cui, H.; Sun, T.; Tang, Y.; Liu, Q. Facile synthesis of novel Zn3 (OH) 2V2O7· 2H2O nanocables with excellent adsorption properties. Mater. Lett. 2021, 283, 128710. [Google Scholar] [CrossRef]
  38. Yang, Z.; Liu, X.; Liu, X.; Wu, J.; Zhu, X.; Bai, Z.; Yu, Z. Biointerfaces, S.B. Preparation of β-cyclodextrin/graphene oxide and its adsorption properties for methylene blue. Colloid Surf. B Biointerfaces 2021, 200, 111605. [Google Scholar] [CrossRef]
  39. Li, Q.; Zhao, S.; Wang, Y. Mechanism of Oxytetracycline Removal by Coconut Shell Biochar Loaded with Nano-Zero-Valent Iron. Int. J. Env. Res. Pub. Heal. 2021, 18, 13107. [Google Scholar] [CrossRef]
  40. Khalil, W.F.; El-Sayyad, G.S.; El Rouby, W.M.A.; Sadek, M.A.; Farghali, A.A.; El-Batal, A.I. Graphene oxide-based nanocomposites (GO-chitosan and GO-EDTA) for outstanding antimicrobial potential against some Candida species and pathogenic bacteria. Int. J. Biol. Macromol. 2020, 164, 1370–1383. [Google Scholar] [CrossRef]
  41. Boukhoubza, I.; Khenfouch, M.; Achehboune, M.; Leontie, L.; Galca, A.C.; Enculescu, M.; Carlescu, A.; Guerboub, M.; Mothudi, B.M.; Jorio, A.; et al. Graphene Oxide Concentration Effect on the Optoelectronic Properties of ZnO/GO Nanocomposites. Nanomaterials 2020, 10, 1532. [Google Scholar] [CrossRef] [PubMed]
  42. Ma, Y.J.; Ye, Y.P.; Wan, H.Q.; Chen, L.; Zhou, H.D.; Chen, J.M. Chemical modification of graphene oxide to reinforce the corrosion protection performance of UV-curable polyurethane acrylate coating. Prog. Org. Coat. 2020, 141, 105547. [Google Scholar] [CrossRef]
  43. Wu, Q.; He, J.Q.; Wang, F.; Yang, X.; Zhu, J.F. Comparative study on effects of covalent-covalent, covalent-ionic and ionicionic bonding of carbon fibers with polyether amine/GO on the interfacial adhesion of epoxy composites. Appl. Surf. Sci. 2020, 532, 147359. [Google Scholar] [CrossRef]
  44. Meng, F.Y.; Song, M.; Chen, Y.Y.; Wei, Y.X.; Song, B.; Cao, Q.Q. Promoting adsorption of organic pollutants via tailoring surface physicochemical properties of biomass-derived carbon-attapulgite. Environ. Sci. Pollut. Res. 2021, 28, 11106–11118. [Google Scholar] [CrossRef] [PubMed]
  45. Song, S.; Liu, Z.; Zhang, J.; Jiao, C.Z.; Ding, L.; Yang, S.R. Synthesis and Adsorption Properties of Novel Bacterial Cellulose/Graphene Oxide/Attapulgite Materials for Cu and Pb Ions in Aqueous Solutions. Materials 2020, 13, 3703. [Google Scholar] [CrossRef]
  46. Wang, C.Y.; Zeng, W.J.; Jiang, T.T.; Chen, X.; Zhang, X.L. Incorporating attapulgite nanorods into graphene oxide nanofiltration membranes for efficient dyes wastewater treatment. Sep. Purif. Technol. 2019, 214, 21–30. [Google Scholar] [CrossRef]
  47. Wang, R.-s.; Li, Y.; Shuai, X.-x.; Liang, R.-h.; Chen, J.; Liu, C.M. Pectin/activated carbon-based porous microsphere for Pb2+ adsorption: Characterization and adsorption behaviour. Polymers 2021, 13, 2453. [Google Scholar] [CrossRef]
  48. Al-Gaashani, R.; Najjar, A.; Zakaria, Y.; Mansour, S.; Atieh, M.A. XPS and structural studies of high quality graphene oxide and reduced graphene oxide prepared by different chemical oxidation methods. Ceram. Int. 2019, 45, 14439–14448. [Google Scholar] [CrossRef]
  49. Chimonyo, W.; Fletcher, B.; Peng, Y.J.M.E. Adsorption and morphology of oxidized starches on graphite. Miner. Eng. 2021, 168, 106936. [Google Scholar] [CrossRef]
  50. Belhaj, A.F.; Elraies, K.A.; Mahmood, S.M.; Zulkifli, N.N.; Akbari, S.; Hussien, O.S. The effect of surfactant concentration, salinity, temperature, and pH on surfactant adsorption for chemical enhanced oil recovery: A review. J. Pet. Explor. Prod. Technol. 2020, 10, 125–137. [Google Scholar] [CrossRef] [Green Version]
  51. Shih, C.J.; Lin, S.C.; Sharma, R.; Strano, M.S.; Blankschtein, D. Understanding the pH-Dependent Behavior of Graphene Oxide Aqueous Solutions: A Comparative Experimental and Molecular Dynamics Simulation Study. Langmuir 2012, 28, 235–241. [Google Scholar] [CrossRef] [PubMed]
  52. Jiang, P.; Zhou, L.; Wang, W.; Li, N.; Zhang, F. Performance and mechanisms of fly ash for graphene oxide removal from aqueous solution. Environ. Sci. Pollut. Res. 2022, 29, 3773–3783. [Google Scholar] [CrossRef] [PubMed]
  53. Tang, H.; Zhang, S.Y.; Huang, T.L.; Cui, F.Y.; Xing, B.S. Effects of pH and electrolytes on the sheet-to-sheet aggregation mode of graphene oxide in aqueous solutions. Environ. Sci.-Nano 2020, 7, 984–995. [Google Scholar] [CrossRef]
  54. Zhao, L.; Yang, S.-T.; Feng, S.; Ma, Q.; Peng, X.; Wu, D. Preparation and application of carboxylated graphene oxide sponge in dye removal. Int. J. Env. Res. Public Health 2017, 14, 1301. [Google Scholar] [CrossRef] [Green Version]
  55. Nan, F.; Liu, C.B.; Pu, J.B. Anticorrosive performance of waterborne epoxy coatings containing attapulgite/graphene nanocomposites. Surf. Topogr. Metrol. Prop. 2019, 7, 024002. [Google Scholar] [CrossRef]
  56. Benjelloun, M.; Miyah, Y.; Evrendilek, G.A.; Zerrouq, F.; Lairini, S. Recent Advances in Adsorption Kinetic Models: Their Application to Dye Types. Arab. J. Chem. 2021, 14, 103031. [Google Scholar] [CrossRef]
  57. Salis, A.; Meloni, D.; Ligas, S.; Casula, M.F.; Monduzzi, M.; Solinas, V.; Dumitriu, E. Physical and chemical adsorption of Mucor javanicus lipase on SBA-15 mesoporous silica. Synthesis, structural characterization, and activity performance. Langmuir 2005, 21, 5511–5516. [Google Scholar] [CrossRef] [PubMed]
  58. Sharma, S.; Sharma, G.; Kumar, A.; AlGarni, T.S.; Naushad, M.; ALOthman, Z.A.; Stadler, F.J. Adsorption of cationic dyes onto carrageenan and itaconic acid-based superabsorbent hydrogel: Synthesis, characterization and isotherm analysis. J. Hazard. Mater. 2022, 421, 126729. [Google Scholar] [CrossRef] [PubMed]
  59. Wang, Z.J.; Jia, Y.N.; Song, W.K.; Li, X.Q.; Xu, K.; Wang, Z. Optimization of boron adsorption from desalinated seawater onto UiO-66-NH2/GO composite adsorbent using response surface methodology. J. Clean. Prod. 2021, 300, 126974. [Google Scholar] [CrossRef]
  60. Han, Y.; Wang, L.; Guo, X.; Jiao, T.; Ding, H. Enhanced adsorption efficiency of graphene oxide by electrostatic field for Hg (II) removal from water. J. Mol. Liq. 2021, 341, 117410. [Google Scholar] [CrossRef]
  61. Kong, Q.; Preis, S.; Li, L.; Luo, P.; Wei, C.; Li, Z.; Hu, Y.; Wei, C. Relations between metal ion characteristics and adsorption performance of graphene oxide: A comprehensive experimental and theoretical study. Sep. Purif. Technol. 2020, 232, 115956. [Google Scholar] [CrossRef]
  62. Kumar, V.; Bahadur, N.; Sachdev, D.; Gupta, S.; Reddy, G.; Pasricha, R. Restructural confirmation and photocatalytic applications of graphene oxide–gold composites synthesized by Langmuir–Blodgett method. Carbon 2014, 80, 290–304. [Google Scholar] [CrossRef]
  63. Kang, H.; Gu, J.; Liu, G.; Li, B.; Wang, W. Performance and mechanism of layered double hydroxide to remove graphene oxide in aqueous solution. Nat. Environ. Pollut. Technol. 2021, 20, 55–62. [Google Scholar] [CrossRef]
  64. Lv, B.; Yu, W.; Luo, J.; Qian, B.; Asefa, M.B.; Li, N. Study on the Adsorption Mechanism of Graphene Oxide by Calcareous Sand in South China Sea. Adsorpt. Sci. Technol. 2021, 2021, 227570. [Google Scholar] [CrossRef]
  65. Zhou, J.; Yao, L.; Wang, Y.; Zhao, W.; Gu, J. Study on the adsorption properties of iron tailings for GO. Coatings 2021, 11, 768. [Google Scholar] [CrossRef]
Figure 1. SEM (a) and TEM (b) of ATP, SEM (c) and TEM (d) of GO, SEM (e) and TEM (f) of ATP/GO.
Ijerph 19 02793 g001
Figure 2. XRD (a) and FTIR (b) image of GO, ATP, ATP/GO.
Ijerph 19 02793 g002
Figure 3. XPS spectra (a) of GO and ATP/GO, High C1s deconvolution of GO (b) and ATP/GO (c).
Ijerph 19 02793 g003
Figure 4. AFM image and the corresponding height profiles of GO (a,b)and ATP/GO (c,d).
Ijerph 19 02793 g004aIjerph 19 02793 g004b
Figure 5. Removal of GO on ATP as a function of pH value.
Ijerph 19 02793 g005
Figure 6. Removal of GO on ATP as a function of ATP contents.
Ijerph 19 02793 g006
Figure 7. Removal of GO on ATP as a function of GO contents.
Ijerph 19 02793 g007
Figure 8. Graph of adsorption capacity over time and Fitting curve of Pseudo-first-order model and Pseudo-second-order model.
Ijerph 19 02793 g008
Figure 9. Isotherms of GO adsorption on attapulgite.
Ijerph 19 02793 g009
Figure 10. Isothermal equation fitting curve.
Ijerph 19 02793 g010
Figure 11. Relationship between lnKd and 1/T.
Ijerph 19 02793 g011
Table 1. Main element composition of graphene oxide (mass fraction).
ElementCOHS
Content/%41.7051.492.412.00
Table 2. Main chemical composition of attapulgite (mass fraction).
Chemical
Composition
SiO2MgOCaOAl2O3
Content/%58.0511.031.189.55
Table 3. Pseudo-first- and second-order dynamic model fitting parameters.
pHTemperature(K)Pseudo-First-Order ModelPseudo-Second-Order Model
Qe
(mg/g)
k1
g/(mg·min)
R2Qe
(mg/g)
k2
g/(mg·min)
R2
3303 k113.6640.0040.980130.6343.758 × 10−50.983
Table 4. Adsorption isotherm equation fitting parameters.
C0
(mg/L)
pHTemperature(K)LangmuirFreundlich
Qmax (mg/g)KL (L/mg)R2KF (mg/g)nR2
1003313311.9440.0630.99323.9991.1380.987
303302.8520.0420.98418.4151.1560.978
293258.3960.0370.99614.9381.1610.986
Table 5. Thermodynamic Fitting Parameters.
C0 (mg/L)ΔG0/(kJ·mol−1)ΔH0/(kJ·mol−1)ΔS0/(J·mol−1·K−1)
293 K303 K313 K
40−6.159−6.892−8.01419.24886.499
60−6.192−6.586−8.04815.88375.100
80−6.079−6.875−7.86419.59887.571
100−6.064−7.024−7.95521.68194.696
120−5.736−6.559−7.64422.05694.746
Table 6. Adsorbate Adsorption of GO Comparison.
AdsorbentLayered Double HydroxideCalcareous SandIron TailingsAttapulgite
Adsorbent dosage (mg)5, 10, 15, 20, 2530, 40, 50, 60, 7030, 40, 50, 60, 7010, 20, 30, 40, 50, 60
GO initial concentration (mg/L)20, 40, 60, 80, 100, 12080, 100, 120, 140, 16040, 60, 80, 10040, 60, 80, 100, 120, 140, 160
pH effectAlkaline environment inhibits adsorptionAlkaline environment inhibits adsorptionpH = 7 is the bestpH = 3 is the best
Optimal removal rate92%91.5%85.92%92.83%
Equilibrium time (min)360 min300 min1680 min2160 min
References [63][64][65]This study
Publisher’s Note: MDPI stays neutral with regard to jurisdictional claims in published maps and institutional affiliations.

