
Exploring Perceived and Objective Measures of the Neighborhood Environment and Associations with Physical Activity among Adults: A Review and a Meta-Analytic Structural Equation Model


Abstract
:1. Introduction
2. Methods
2.1. Literature Analysis and Inclusion Criteria
- Participants: Healthy persons between the age of 18–65 years. When the age range was more extensive, including adolescents or the elderly, the study was included if the mean (or median) age fall in the chosen range. Studies on obese people and pregnant women were excluded.
- Articles: Peer-reviewed in English articles.
- Outcomes: Subjective physical activities. All types of physical activities excluding gardening, climbing stairs, passive exercise, and dog walking.
- Environment: outdoor spaces. Excluded indoor space (e.g., work, home, gym). The same physical characteristics of the environment must have been investigated using (at least) one objective measure and (at least) one perceived (self-report) measure. As objective measures, we included measures based on the Geographical Information System (GIS), Google Street View, mathematical formula, or national archives/instrument. The systematic social observation was excluded.
- Environmental characteristics: physical features (e.g., trees along the streets, PA facilities, bike lines, residential density). Environmental characteristics that humans could not change (e.g., weather conditions such as atmospheric precipitation or temperature) were excluded. Socio-economic (e.g., household income of neighborhood) and social (e.g., crime) variables were also excluded. As perceived measured, we included only measures comparable with objective measures, i.e., the presence of a continuous bike line, number of PA facilities, the distance between intersections and route selection.
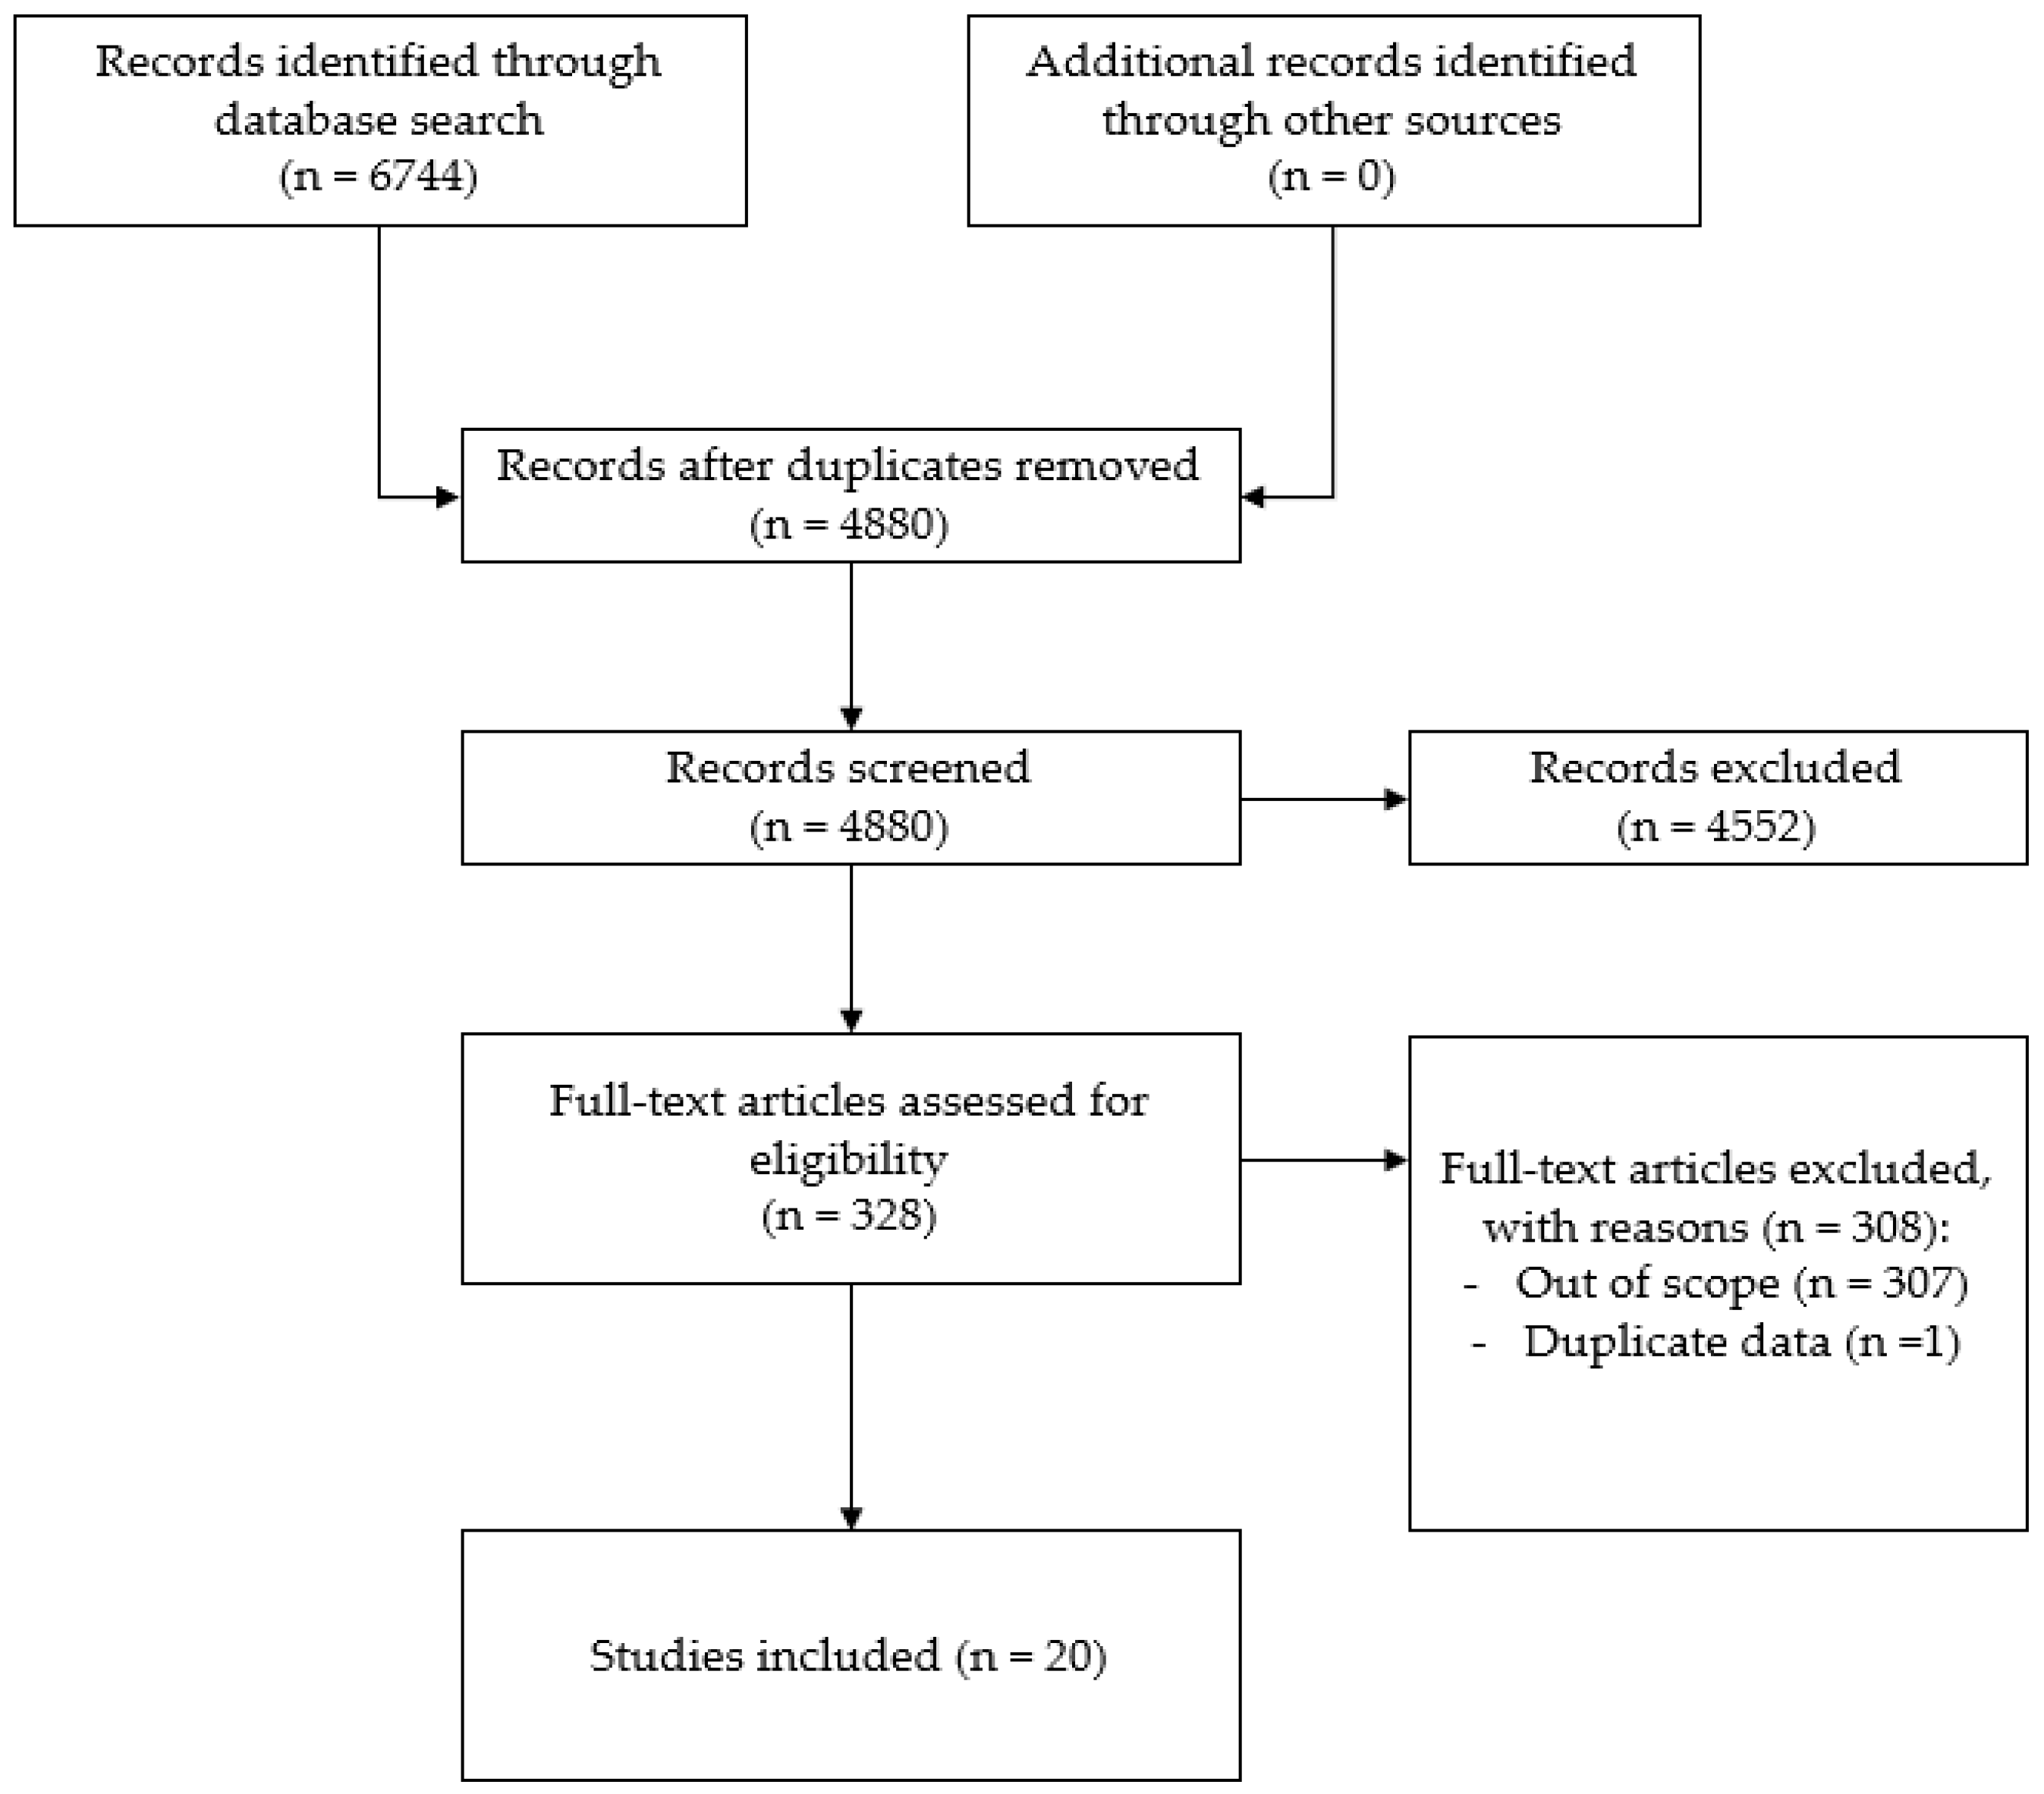
2.2. Study Selection
2.3. Data Analysis
3. Results
3.1. Meta-Analysis
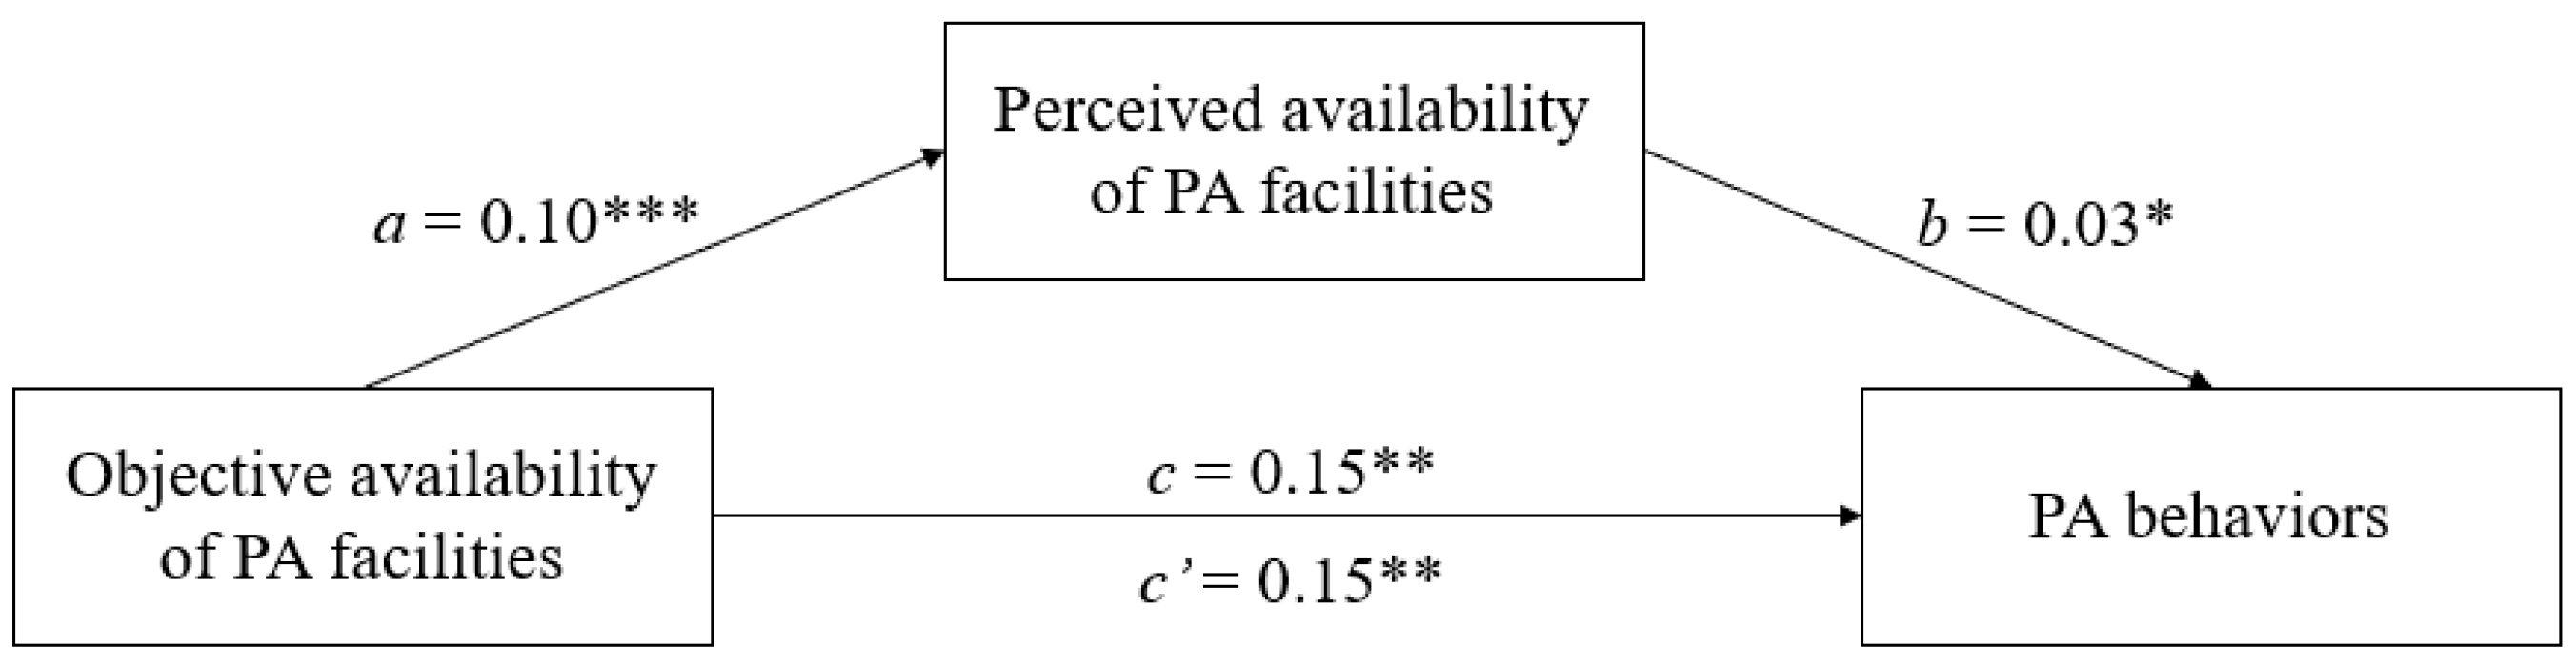
3.2. TSSEM
4. Discussion
5. Conclusions
Author Contributions
Funding
Institutional Review Board Statement
Informed Consent Statement
Data Availability Statement
Conflicts of Interest
References
- Kohl, H.W.; Craig, C.L.; Lambert, E.V.; Inoue, S.; Alkandari, J.R.; Leetongin, G.; Kahlmeier, S. The Pandemic of Physical Inactivity: Global Action for Public Health. Lancet 2012, 380, 294–305. [Google Scholar] [CrossRef] [Green Version]
- WHO. WHO Guidelines on Physical Activity and Sedentary Behavior. Available online: https://www.who.int/teams/maternal-newborn-child-adolescent-health-and-ageing/maternal-health/about/health-promotion (accessed on 4 January 2021).
- Teychenne, M.; White, R.L.; Richards, J.; Schuch, F.B.; Rosenbaum, S.; Bennie, J.A. Do We Need Physical Activity Guidelines for Mental Health: What Does the Evidence Tell Us? Ment. Health Phys. Act. 2020, 18, 100315. [Google Scholar] [CrossRef]
- Bull, F.C.; Al-Ansari, S.S.; Biddle, S.; Borodulin, K.; Buman, M.P.; Cardon, G.; Carty, C.; Chaput, J.-P.; Chastin, S.; Chou, R.; et al. World Health Organization 2020 Guidelines on Physical Activity and Sedentary Behaviour. Br. J. Sports Med. 2020, 54, 1451–1462. [Google Scholar] [CrossRef] [PubMed]
- Ekelund, U.; Tarp, J.; Fagerland, M.W.; Johannessen, J.S.; Hansen, B.H.; Jefferis, B.J.; Whincup, P.H.; Diaz, K.M.; Hooker, S.; Howard, V.J.; et al. Joint Associations of Accelerometer-Measured Physical Activity and Sedentary Time with All-Cause Mortality: A Harmonised Meta-Analysis in More than 44,000 Middle-Aged and Older Individuals. Br. J. Sports Med. 2020, 54, 1499–1506. [Google Scholar] [CrossRef] [PubMed]
- Friedenreich, C.M.; Ryder-Burbidge, C.; McNeil, J. Physical Activity, Obesity and Sedentary Behavior in Cancer Etiology: Epidemiologic Evidence and Biologic Mechanisms. Mol. Oncol. 2021, 15, 790–800. [Google Scholar] [CrossRef]
- Li, J.; Siegrist, J. Physical Activity and Risk of Cardiovascular Disease—A Meta-Analysis of Prospective Cohort Studies. Int. J. Environ. Res. Public. Health 2012, 9, 391–407. [Google Scholar] [CrossRef]
- Mills, K.T.; Stefanescu, A.; He, J. The Global Epidemiology of Hypertension. Nat. Rev. Nephrol. 2020, 16, 223–237. [Google Scholar] [CrossRef]
- Hamasaki, H. Daily Physical Activity and Type 2 Diabetes: A Review. World J. Diabetes 2016, 7, 243–251. [Google Scholar] [CrossRef]
- Althoff, T.; Sosič, R.; Hicks, J.L.; King, A.C.; Delp, S.L.; Leskovec, J. Large-Scale Physical Activity Data Reveal Worldwide Activity Inequality. Nature 2017, 547, 336–339. [Google Scholar] [CrossRef]
- WHO. Global Reccommendations on Physical Activity for Health; WHO: Geneva, Switzerland, 2010. [Google Scholar]
- Guthold, R.; Stevens, G.A.; Riley, L.M.; Bull, F.C. Worldwide Trends in Insufficient Physical Activity from 2001 to 2016: A Pooled Analysis of 358 Population-Based Surveys with 1·9 Million Participants. Lancet Glob. Health 2018, 6, e1077–e1086. [Google Scholar] [CrossRef] [Green Version]
- Hallal, P.C.; Andersen, L.B.; Bull, F.C.; Guthold, R.; Haskell, W.; Ekelund, U. Global Physical Activity Levels: Surveillance Progress, Pitfalls, and Prospects. Lancet 2012, 380, 247–257. [Google Scholar] [CrossRef]
- Sallis, J.F.; Bull, F.; Guthold, R.; Heath, G.W.; Inoue, S.; Kelly, P.; Oyeyemi, A.L.; Perez, L.G.; Richards, J.; Hallal, P.C. Progress in Physical Activity over the Olympic Quadrennium. Lancet 2016, 388, 1325–1336. [Google Scholar] [CrossRef]
- WHO. Comparative Quantification of Health Risks: Global and Regional Burden of Disease Attributable to Selected Major Risks Factors; Organisation Mondiale de la Santé: Geneva, Switzerland, 2004. [Google Scholar]
- Fletcher, G.F.; Landolfo, C.; Niebauer, J.; Ozemek, C.; Arena, R.; Lavie, C.J. Promoting Physical Activity and Exercise. J. Am. Coll. Cardiol. 2018, 72, 1622–1639. [Google Scholar] [CrossRef] [PubMed]
- Bauman, A.E.; Reis, R.S.; Sallis, J.F.; Wells, J.C.; Loos, R.J.; Martin, B.W. Correlates of Physical Activity: Why Are Some People Physically Active and Others Not? Lancet 2012, 380, 258–271. [Google Scholar] [CrossRef]
- King, A.C.; Stokols, D.; Talen, E.; Brassington, G.S.; Killingsworth, R. Theoretical Approaches to the Promotion of Physical Activity. Am. J. Prev. Med. 2002, 23, 15–25. [Google Scholar] [CrossRef]
- Bronfenbrenner, U.; Ceci, S.J. Nature-Nuture Reconceptualized in Developmental Perspective: A Bioecological Model. Psychol. Rev. 1994, 101, 568–586. [Google Scholar] [CrossRef]
- Golden, S.D.; Earp, J.A.L. Social Ecological Approaches to Individuals and Their Contexts: Twenty Years of Health Education & Behavior Health Promotion Interventions. Health Educ. Behav. 2012, 39, 364–372. [Google Scholar] [CrossRef]
- Sallis, J.F.; Owen, N.; Fisher, E.B. Ecological Models of Health Behavior. In Health Behavior and Health Education Theory, Research, and Practice; Glanz, K., Rimer, B.K., Viswanath, K., Eds.; John Wiley & Sons: Hoboken, NJ, USA, 2008; pp. 465–484. [Google Scholar]
- Choi, J.; Lee, M.; Lee, J.; Kang, D.; Choi, J.-Y. Correlates Associated with Participation in Physical Activity among Adults: A Systematic Review of Reviews and Update. BMC Public Health 2017, 17, 356. [Google Scholar] [CrossRef]
- Knittle, K.; Nurmi, J.; Crutzen, R.; Hankonen, N.; Beattie, M.; Dombrowski, S.U. How Can Interventions Increase Motivation for Physical Activity? A Systematic Review and Meta-Analysis. Health Psychol. Rev. 2018, 12, 211–230. [Google Scholar] [CrossRef]
- Teixeira, P.J.; Carraça, E.V.; Markland, D.; Silva, M.N.; Ryan, R.M. Exercise, Physical Activity, and Self-Determination Theory: A Systematic Review. Int. J. Behav. Nutr. Phys. Act. 2012, 9, 78. [Google Scholar] [CrossRef] [Green Version]
- Calogiuri, G.; Chroni, S. The Impact of the Natural Environment on the Promotion of Active Living: An Integrative Systematic Review. BMC Public Health 2014, 14, 873. [Google Scholar] [CrossRef] [PubMed] [Green Version]
- Kaczynski, A.T.; Henderson, K.A. Environmental Correlates of Physical Activity: A Review of Evidence about Parks and Recreation. Leis. Sci. 2007, 29, 315–354. [Google Scholar] [CrossRef]
- Van Cauwenberg, J.; Nathan, A.; Barnett, A.; Barnett, D.W.; Cerin, E. Relationships Between Neighbourhood Physical Environmental Attributes and Older Adults’ Leisure-Time Physical Activity: A Systematic Review and Meta-Analysis. Sports Med. 2018, 48, 1635–1660. [Google Scholar] [CrossRef] [PubMed]
- Zhang, R.; Wulff, H.; Duan, Y.; Wagner, P. Associations between the Physical Environment and Park-Based Physical Activity: A Systematic Review. J. Sport Health Sci. 2019, 8, 412–421. [Google Scholar] [CrossRef]
- Saelens, B.E.; Handy, S.L. Built Environment Correlates of Walking: A Review. Med. Sci. Sports Exerc. 2008, 40, S550–S566. [Google Scholar] [CrossRef] [PubMed] [Green Version]
- Bourke, M.; Hilland, T.A.; Craike, M. An Exploratory Analysis of the Interactions between Social Norms and the Built Environment on Cycling for Recreation and Transport. BMC Public Health 2018, 18, 1162. [Google Scholar] [CrossRef]
- Christian, H.; Knuiman, M.; Bull, F.; Timperio, A.; Foster, S.; Divitini, M.; Middleton, N.; Giles-Corti, B. A New Urban Planning Code’s Impact on Walking: The Residential Environments Project. Am. J. Public Health 2013, 103, 1219–1228. [Google Scholar] [CrossRef]
- Ball, K.; Jeffery, R.W.; Crawford, D.A.; Roberts, R.J.; Salmon, J.; Timperio, A.F. Mismatch between Perceived and Objective Measures of Physical Activity Environments. Prev. Med. 2008, 47, 294–298. [Google Scholar] [CrossRef]
- Borena, Y.G.; Shidaram, H.S.; Abdulkadir, Y.I. Association of Sport and Recreational Facilities with Adult Residents’ Participation in Leisure Time Physical Activities in Addis Ababa, Ethiopia. Sport Soc. 2020, 23, 1163–1185. [Google Scholar] [CrossRef]
- Carraça, E.V.; Mackenbach, J.D.; Lakerveld, J.; Rutter, H.; Oppert, J.-M.; De Bourdeaudhuij, I.; Compernolle, S.; Roda, C.; Bardos, H.; Teixeira, P.J. Lack of Interest in Physical Activity—Individual and Environmental Attributes in Adults across Europe: The SPOTLIGHT Project. Prev. Med. 2018, 111, 41–48. [Google Scholar] [CrossRef]
- Coughenour, C.; de la Fuente-Mella, H.; Paz, A. Analysis of Self-Reported Walking for Transit in a Sprawling Urban Metropolitan Area in the Western U.S. Sustainability 2019, 11, 852. [Google Scholar] [CrossRef] [Green Version]
- Owen, N.; Humpel, N.; Leslie, E.; Bauman, A.; Sallis, J.F. Understanding Environmental Influences on Walking. Am. J. Prev. Med. 2004, 27, 67–76. [Google Scholar] [CrossRef] [PubMed]
- McAlexander, K.M.; Mama, S.K.; Medina, A.V.; O’Connor, D.P.; Lee, R.E. Concordance and Correlates of Direct and Indirect Built Environment Measurement among Minority Women. Am. J. Health Promot. 2012, 26, 239–244. [Google Scholar] [CrossRef] [Green Version]
- Gebel, K.; Bauman, A.; Owen, N. Correlates of Non-Concordance between Perceived and Objective Measures of Walkability. Ann. Behav. Med. 2009, 37, 228–238. [Google Scholar] [CrossRef] [PubMed]
- Kremers, S.P.; de Bruijn, G.-J.; Visscher, T.L.; van Mechelen, W.; de Vries, N.K.; Brug, J. Environmental Influences on Energy Balance-Related Behaviors: A Dual-Process View. Int. J. Behav. Nutr. Phys. Act. 2006, 3, 9. [Google Scholar] [CrossRef] [PubMed] [Green Version]
- Schipperijn, J.; Stigsdotter, U.K.; Randrup, T.B.; Troelsen, J. Influences on the Use of Urban Green Space—A Case Study in Odense, Denmark. Urban For. Urban Green. 2010, 9, 25–32. [Google Scholar] [CrossRef]
- Barnett, D.W.; Barnett, A.; Nathan, A.; Van Cauwenberg, J.; Cerin, E. Built Environmental Correlates of Older Adults’ Total Physical Activity and Walking: A Systematic Review and Meta-Analysis. Int. J. Behav. Nutr. Phys. Act. 2017, 14, 103. [Google Scholar] [CrossRef] [Green Version]
- Kirtland, K.A.; Porter, D.E.; Addy, C.L.; Neet, M.J.; Williams, J.E.; Sharpe, P.A.; Neff, L.J.; Kimsey, C.D.; Ainsworth, B.E. Environmental Measures of Physical Activity Supports: Perception versus Reality. Am. J. Prev. Med. 2003, 24, 323–331. [Google Scholar] [CrossRef]
- McGinn, A.P.; Evenson, K.R.; Herring, A.H.; Huston, S.L. The Relationship between Leisure, Walking, and Transportation Activity with the Natural Environment. Health Place 2007, 13, 588–602. [Google Scholar] [CrossRef]
- Troped, P.J.; Saunders, R.P.; Pate, R.R.; Reininger, B.; Ureda, J.R.; Thompson, S.J. Associations between Self-Reported and Objective Physical Environmental Factors and Use of a Community Rail-Trail. Prev. Med. 2001, 32, 191–200. [Google Scholar] [CrossRef]
- Orstad, S.L.; McDonough, M.H.; Klenosky, D.B.; Mattson, M.; Troped, P.J. The Observed and Perceived Neighborhood Environment and Physical Activity among Urban-Dwelling Adults: The Moderating Role of Depressive Symptoms. Soc. Sci. Med. 2017, 190, 57–66. [Google Scholar] [CrossRef] [PubMed]
- Nasar, J.L. Assessing Perceptions of Environments for Active Living. Am. J. Prev. Med. 2008, 34, 357–363. [Google Scholar] [CrossRef] [PubMed]
- Hoekman, R.; Breedveld, K.; Kraaykamp, G. Sport Participation and the Social and Physical Environment: Explaining Differences between Urban and Rural Areas in the Netherlands. Leis. Stud. 2017, 36, 357–370. [Google Scholar] [CrossRef] [Green Version]
- Bonett, D.G. Transforming Odds Ratios into Correlations for Meta-Analytic Research. Am. Psychol. 2007, 62, 254–255. [Google Scholar] [CrossRef] [Green Version]
- Cochran, W.G. The Combination of Estimates from Different Experiments. Biometrics 1954, 10, 101. [Google Scholar] [CrossRef]
- Higgins, J.P.T.; Thompson, S.G.; Deeks, J.J.; Altman, D.G. Measuring Inconsistency in Meta-Analyses. BMJ 2003, 327, 557–560. [Google Scholar] [CrossRef] [PubMed] [Green Version]
- Duval, S.; Tweedie, R. Trim and Fill: A Simple Funnel-Plot–Based Method of Testing and Adjusting for Publication Bias in Meta-Analysis. Biometrics 2000, 56, 455–463. [Google Scholar] [CrossRef]
- Borenstein, M.; Hedges, L.V.; Rothstein, H.R.; Higgins, J.P.T. (Eds.) Introduction to Meta-Analysis; John Wiley & Sons: Chichester, UK, 2009. [Google Scholar]
- Cheung, M.W.L.; Chan, W. A Two-Stage Approach to Synthesizing Covariance Matrices in Meta-Analytic Structural Equation Modeling. Struct. Equ. Model. Multidiscip. J. 2009, 16, 28–53. [Google Scholar] [CrossRef]
- Cheung, M.W.-L.; Chan, W. Meta-Analytic Structural Equation Modeling: A Two-Stage Approach. Psychol. Methods 2005, 10, 40–64. [Google Scholar] [CrossRef] [Green Version]
- Cheung, M.W.-L. MetaSEM: An R Package for Meta-Analysis Using Structural Equation Modeling. Front. Psychol. 2015, 5, 1521. [Google Scholar] [CrossRef] [Green Version]
- Cheung, M.W.-L.; Cheung, S.F. Random-Effects Models for Meta-Analytic Structural Equation Modeling: Review, Issues, and Illustrations. Res. Synth. Methods 2016, 7, 140–155. [Google Scholar] [CrossRef] [PubMed]
- Cheung, M.W.-L. Fixed- and Random-Effects Meta-Analytic Structural Equation Modeling: Examples and Analyses in R. Behav. Res. Methods 2014, 46, 29–40. [Google Scholar] [CrossRef] [PubMed]
- Baron, R.M.; Kenny, D.A. The Moderator–Mediator Variable Distinction in Social Psychological Research: Conceptual, Strategic, and Statistical Considerations. J. Pers. Soc. Psychol. 1986, 51, 1173–1182. [Google Scholar] [CrossRef]
- Cerin, E.; Leslie, E.; Toit, L.; Owen, N.; Frank, L. Destinations That Matter: Associations with Walking for Transport. Health Place 2007, 13, 713–724. [Google Scholar] [CrossRef] [PubMed]
- Duncan, M.J.; Winkler, E.; Sugiyama, T.; Cerin, E.; duToit, L.; Leslie, E.; Owen, N. Relationships of Land Use Mix with Walking for Transport: Do Land Uses and Geographical Scale Matter? J. Urban Health 2010, 87, 782–795. [Google Scholar] [CrossRef] [Green Version]
- Kondo, K.; Lee, J.S.; Kawakubo, K.; Kataoka, Y.; Asami, Y.; Mori, K.; Umezaki, M.; Yamauchi, T.; Takagi, H.; Sunagawa, H.; et al. Association between Daily Physical Activity and Neighborhood Environments. Environ. Health Prev. Med. 2009, 14, 196–206. [Google Scholar] [CrossRef] [Green Version]
- Su, M.; Tan, Y.; Liu, Q.; Ren, Y.; Kawachi, I.; Li, L.; Lv, J. Association between Perceived Urban Built Environment Attributes and Leisure-Time Physical Activity among Adults in Hangzhou, China. Prev. Med. 2014, 66, 60–64. [Google Scholar] [CrossRef] [Green Version]
- Mackenbach, J.D.; Matias de Pinho, M.G.; Faber, E.; den Braver, N.; de Groot, R.; Charreire, H.; Oppert, J.-M.; Bardos, H.; Rutter, H.; Compernolle, S.; et al. Exploring the Cross-Sectional Association between Outdoor Recreational Facilities and Leisure-Time Physical Activity: The Role of Usage and Residential Self-Selection. Int. J. Behav. Nutr. Phys. Act. 2018, 15, 55. [Google Scholar] [CrossRef]
- Hoehner, C.M.; Brennan Ramirez, L.K.; Elliott, M.B.; Handy, S.L.; Brownson, R.C. Perceived and Objective Environmental Measures and Physical Activity among Urban Adults. Am. J. Prev. Med. 2005, 28, 105–116. [Google Scholar] [CrossRef]
- Lee, C.; Moudon, A.V. Neighbourhood Design and Physical Activity. Build. Res. Inf. 2008, 36, 395–411. [Google Scholar] [CrossRef]
- Cutumisu, N.; Spence, J.C. Sport Fields as Potential Catalysts for Physical Activity in the Neighbourhood. Int. J. Environ. Res. Public. Health 2012, 9, 294–314. [Google Scholar] [CrossRef] [PubMed] [Green Version]
- Sugiyama, T.; Howard, N.J.; Paquet, C.; Coffee, N.T.; Taylor, A.W.; Daniel, M. Do Relationships Between Environmental Attributes and Recreational Walking Vary According to Area-Level Socioeconomic Status? J. Urban Health 2015, 92, 253–264. [Google Scholar] [CrossRef] [Green Version]
- McGinn, A.P.; Evenson, K.R.; Herring, A.H.; Huston, S.L.; Rodriguez, D.A. Exploring Associations between Physical Activity and Perceived and Objective Measures of the Built Environment. J. Urban Health 2007, 84, 162–184. [Google Scholar] [CrossRef] [Green Version]
- Rodríguez, D.A.; Aytur, S.; Forsyth, A.; Oakes, J.M.; Clifton, K.J. Relation of Modifiable Neighborhood Attributes to Walking. Prev. Med. 2008, 47, 260–264. [Google Scholar] [CrossRef] [PubMed] [Green Version]
- Dadvand, P.; Bartoll, X.; Basagaña, X.; Dalmau-Bueno, A.; Martinez, D.; Ambros, A.; Cirach, M.; Triguero-Mas, M.; Gascon, M.; Borrell, C.; et al. Green Spaces and General Health: Roles of Mental Health Status, Social Support, and Physical Activity. Environ. Int. 2016, 91, 161–167. [Google Scholar] [CrossRef] [PubMed] [Green Version]
- De Jong, K.; Albin, M.; Skärbäck, E.; Grahn, P.; Björk, J. Perceived Green Qualities Were Associated with Neighborhood Satisfaction, Physical Activity, and General Health: Results from a Cross-Sectional Study in Suburban and Rural Scania, Southern Sweden. Health Place 2012, 18, 1374–1380. [Google Scholar] [CrossRef] [PubMed]
- Handy, S.L.; Boarnet, M.G.; Ewing, R.; Killingsworth, R.E. How the Built Environment Affects Physical Activity: Views from Urban Planning. Am. J. Prev. Med. 2002, 23, 64–73. [Google Scholar] [CrossRef]
- Ding, D.; Sallis, J.F.; Kerr, J.; Lee, S.; Rosenberg, D.E. Neighborhood Environment and Physical Activity Among Youth: A Review. Am. J. Prev. Med. 2011, 41, 442–455. [Google Scholar] [CrossRef]


| Article | Country | n | Neighborhood Definition | Physical Activity (PA) | ||
|---|---|---|---|---|---|---|
| Subjective | Objective | Type of PA | Measure of PA | |||
| Ball et al., 2008 | Australia | 1540 | 2 km from home | 2 km from home | (1) PA, (2) walking | yes-no |
| Borena et al., 2019 | Ethiopia | 384 | n.a. | administrative district | PAw | day/week |
| Bourke et al., 2018 | Australia | 228 | 15 min | suburb | cycling | yes-no |
| Carraca et al., 2018 | 5 EU countries * | 5205 | n.a. | administrative boundaries | PA | min/week |
| Christian et al., 2013 | Australia | 1047 | <20 min walk | 1.6 km | walking | min/week |
| Coughenour et al., 2019 | USA | 144 | n.a. | census block groups | walking | min/week |
| Cutumisu and Spence, 2012 | Canada | 2879 | 10–15 min walk | 1.5 km | (1) PA, (2) walking | MET-min |
| Dadvand et al., 2016 | Spain | 3461 | 10 min walk | <300 m | PA | low-high |
| de Jong et al., 2012 | Sweden | 24847 | 5–10 min walk | <300 m | PA | min/week |
| Duncan et al., 2010 | Australia | 2506 | from 1 to 30 min (1–5) | census district | walking | min/day |
| Hoehner et al., 2005 | USA | 856 | <5 min | <400 m | (1) PA, (2) active travel | min/week |
| Kondo et al., 2009 | Japan | 156 | n.a. | 500 m | (1) walking, (2) cycling | min/day |
| Lee and Moudon, 2008 | USA | 608 | n.a. | 1 km | (1) PAw, (2) walking | yes-no |
| Mackenbach et al., 2018 | 5 EU countries * | 5199 | n.a. | n.d. | (1) PA, (2) PAw, (3) walking | min/week |
| McAlexanderet al., 2012 | USA | 409 | n.a. | 800 m | PA | MET-min |
| McGinn et al., 2007a | USA | 1482 | 20 min walk or 1 mile | 1 mile | (1) PAw, (2) walking, (3) active travel | day/week |
| McGinn et al., 2007b | USA | 1482 | 20 min walk or 1 mile | 1 mile | (1) PAw, (2) walking, (3) active travel | day/week |
| Rodriguez et al., 2008 | USA | 887 | 20 min walk or 1 mile | 400 m | walking | min/week |
| Su et al., 2014 | China | 1343 | 10–15 min walk | 1–1.5 km | (1) PAw, (2) walking | MET-min |
| Sugiyama et al., 2015 | Australia | 1412 | 10–15 min walk | 1 km | walking | frequency/week (3 levels) |
| Aesthetics | Bike Facilities | Greenness | Land Use Mix | PA Facilities | Pedestrian Facilities | Residential Density | Retail Floor-Area Ratio | Safe for Traffic | Street Connectivity | |
|---|---|---|---|---|---|---|---|---|---|---|
| Ball et al., 2008 | ü | |||||||||
| Borena et al., 2019 | ü | |||||||||
| Bourke et al., 2018 | ü | |||||||||
| Carraca et al., 2018 | ü | ü | ||||||||
| Christian et al., 2013 | ü | ü | ||||||||
| Coughenour et al., 2019 | ü | ü | ü | ü | ||||||
| Cutumisu and Spence, 2012 | ü | ü | ||||||||
| Dadvand etal., 2016 | ü | |||||||||
| de Jong et al., 2012 | ü | |||||||||
| Duncan et al., 2010 | ü | |||||||||
| Hoehner et al., 2005 | ü | ü | ü | ü | ü | ü | ü | |||
| Kondo et al., 2009 | ü | ü | ü | ü | ü | |||||
| Lee and Moudon, 2008 | ü | |||||||||
| Mackenbach et al., 2018 | ü | |||||||||
| McAlexanderet al., 2012 | ü | ü | ü | |||||||
| McGinn et al., 2007a | ü | ü | ||||||||
| McGinn et al., 2007b | ü | |||||||||
| Rodriguez et al., 2008 | ü | |||||||||
| Su et al., 2014 | ü | ü | ü | ü | ü | ü | ü | |||
| Sugiyama et al., 2015 | ü |
| Objective Measure | Subjective Measure | |
|---|---|---|
| Borena et al., 2019 | Availability (number and type) of PA facilities | Number of recreational facilities |
| Cutumisu and Spence, 2012 | PA facilities in 1500 m | Presence of recreational facilities |
| Hoehner et al., 2005 | Number of recreational facilities | Number of recreational facilities within 5 min walking |
| Mackenbach et al., 2018 | Percentage of street segments in a neighborhood with facilities present | Presence of open recreation areas (park, playing field) |
| McAlexander et al., 2012 | Total number of accessible PA resources | Number of PA resource accessibility |
| X | M | Y | |
|---|---|---|---|
| X | 1 | ||
| M | 0.104 (0.013) *** | 1 | |
| Y | 0.044 (0.011) *** | 0.149 (0.056) ** | 1 |
Publisher’s Note: MDPI stays neutral with regard to jurisdictional claims in published maps and institutional affiliations. |
© 2022 by the authors. Licensee MDPI, Basel, Switzerland. This article is an open access article distributed under the terms and conditions of the Creative Commons Attribution (CC BY) license (https://creativecommons.org/licenses/by/4.0/).
Share and Cite
Menardo, E.; De Dominicis, S.; Pasini, M. Exploring Perceived and Objective Measures of the Neighborhood Environment and Associations with Physical Activity among Adults: A Review and a Meta-Analytic Structural Equation Model. Int. J. Environ. Res. Public Health 2022, 19, 2575. https://doi.org/10.3390/ijerph19052575
Menardo E, De Dominicis S, Pasini M. Exploring Perceived and Objective Measures of the Neighborhood Environment and Associations with Physical Activity among Adults: A Review and a Meta-Analytic Structural Equation Model. International Journal of Environmental Research and Public Health. 2022; 19(5):2575. https://doi.org/10.3390/ijerph19052575
Chicago/Turabian StyleMenardo, Elisa, Stefano De Dominicis, and Margherita Pasini. 2022. "Exploring Perceived and Objective Measures of the Neighborhood Environment and Associations with Physical Activity among Adults: A Review and a Meta-Analytic Structural Equation Model" International Journal of Environmental Research and Public Health 19, no. 5: 2575. https://doi.org/10.3390/ijerph19052575
APA StyleMenardo, E., De Dominicis, S., & Pasini, M. (2022). Exploring Perceived and Objective Measures of the Neighborhood Environment and Associations with Physical Activity among Adults: A Review and a Meta-Analytic Structural Equation Model. International Journal of Environmental Research and Public Health, 19(5), 2575. https://doi.org/10.3390/ijerph19052575