
The Association between Gender and Physical Activity Was Partially Mediated by Social Network Size during COVID-19

Abstract
:1. Introduction
2. Materials and Methods
2.1. Study Design
2.2. Sample
2.3. Study Procedures
2.4. Measures
2.4.1. Independent Variable
2.4.2. Dependent Variables
Past-Week Physical Activity
Past-Year Physical Activity
2.4.3. Mediator Variables
Social Network Size and Frequency of Contact
Number of Facebook Friends
2.4.4. Control Variables
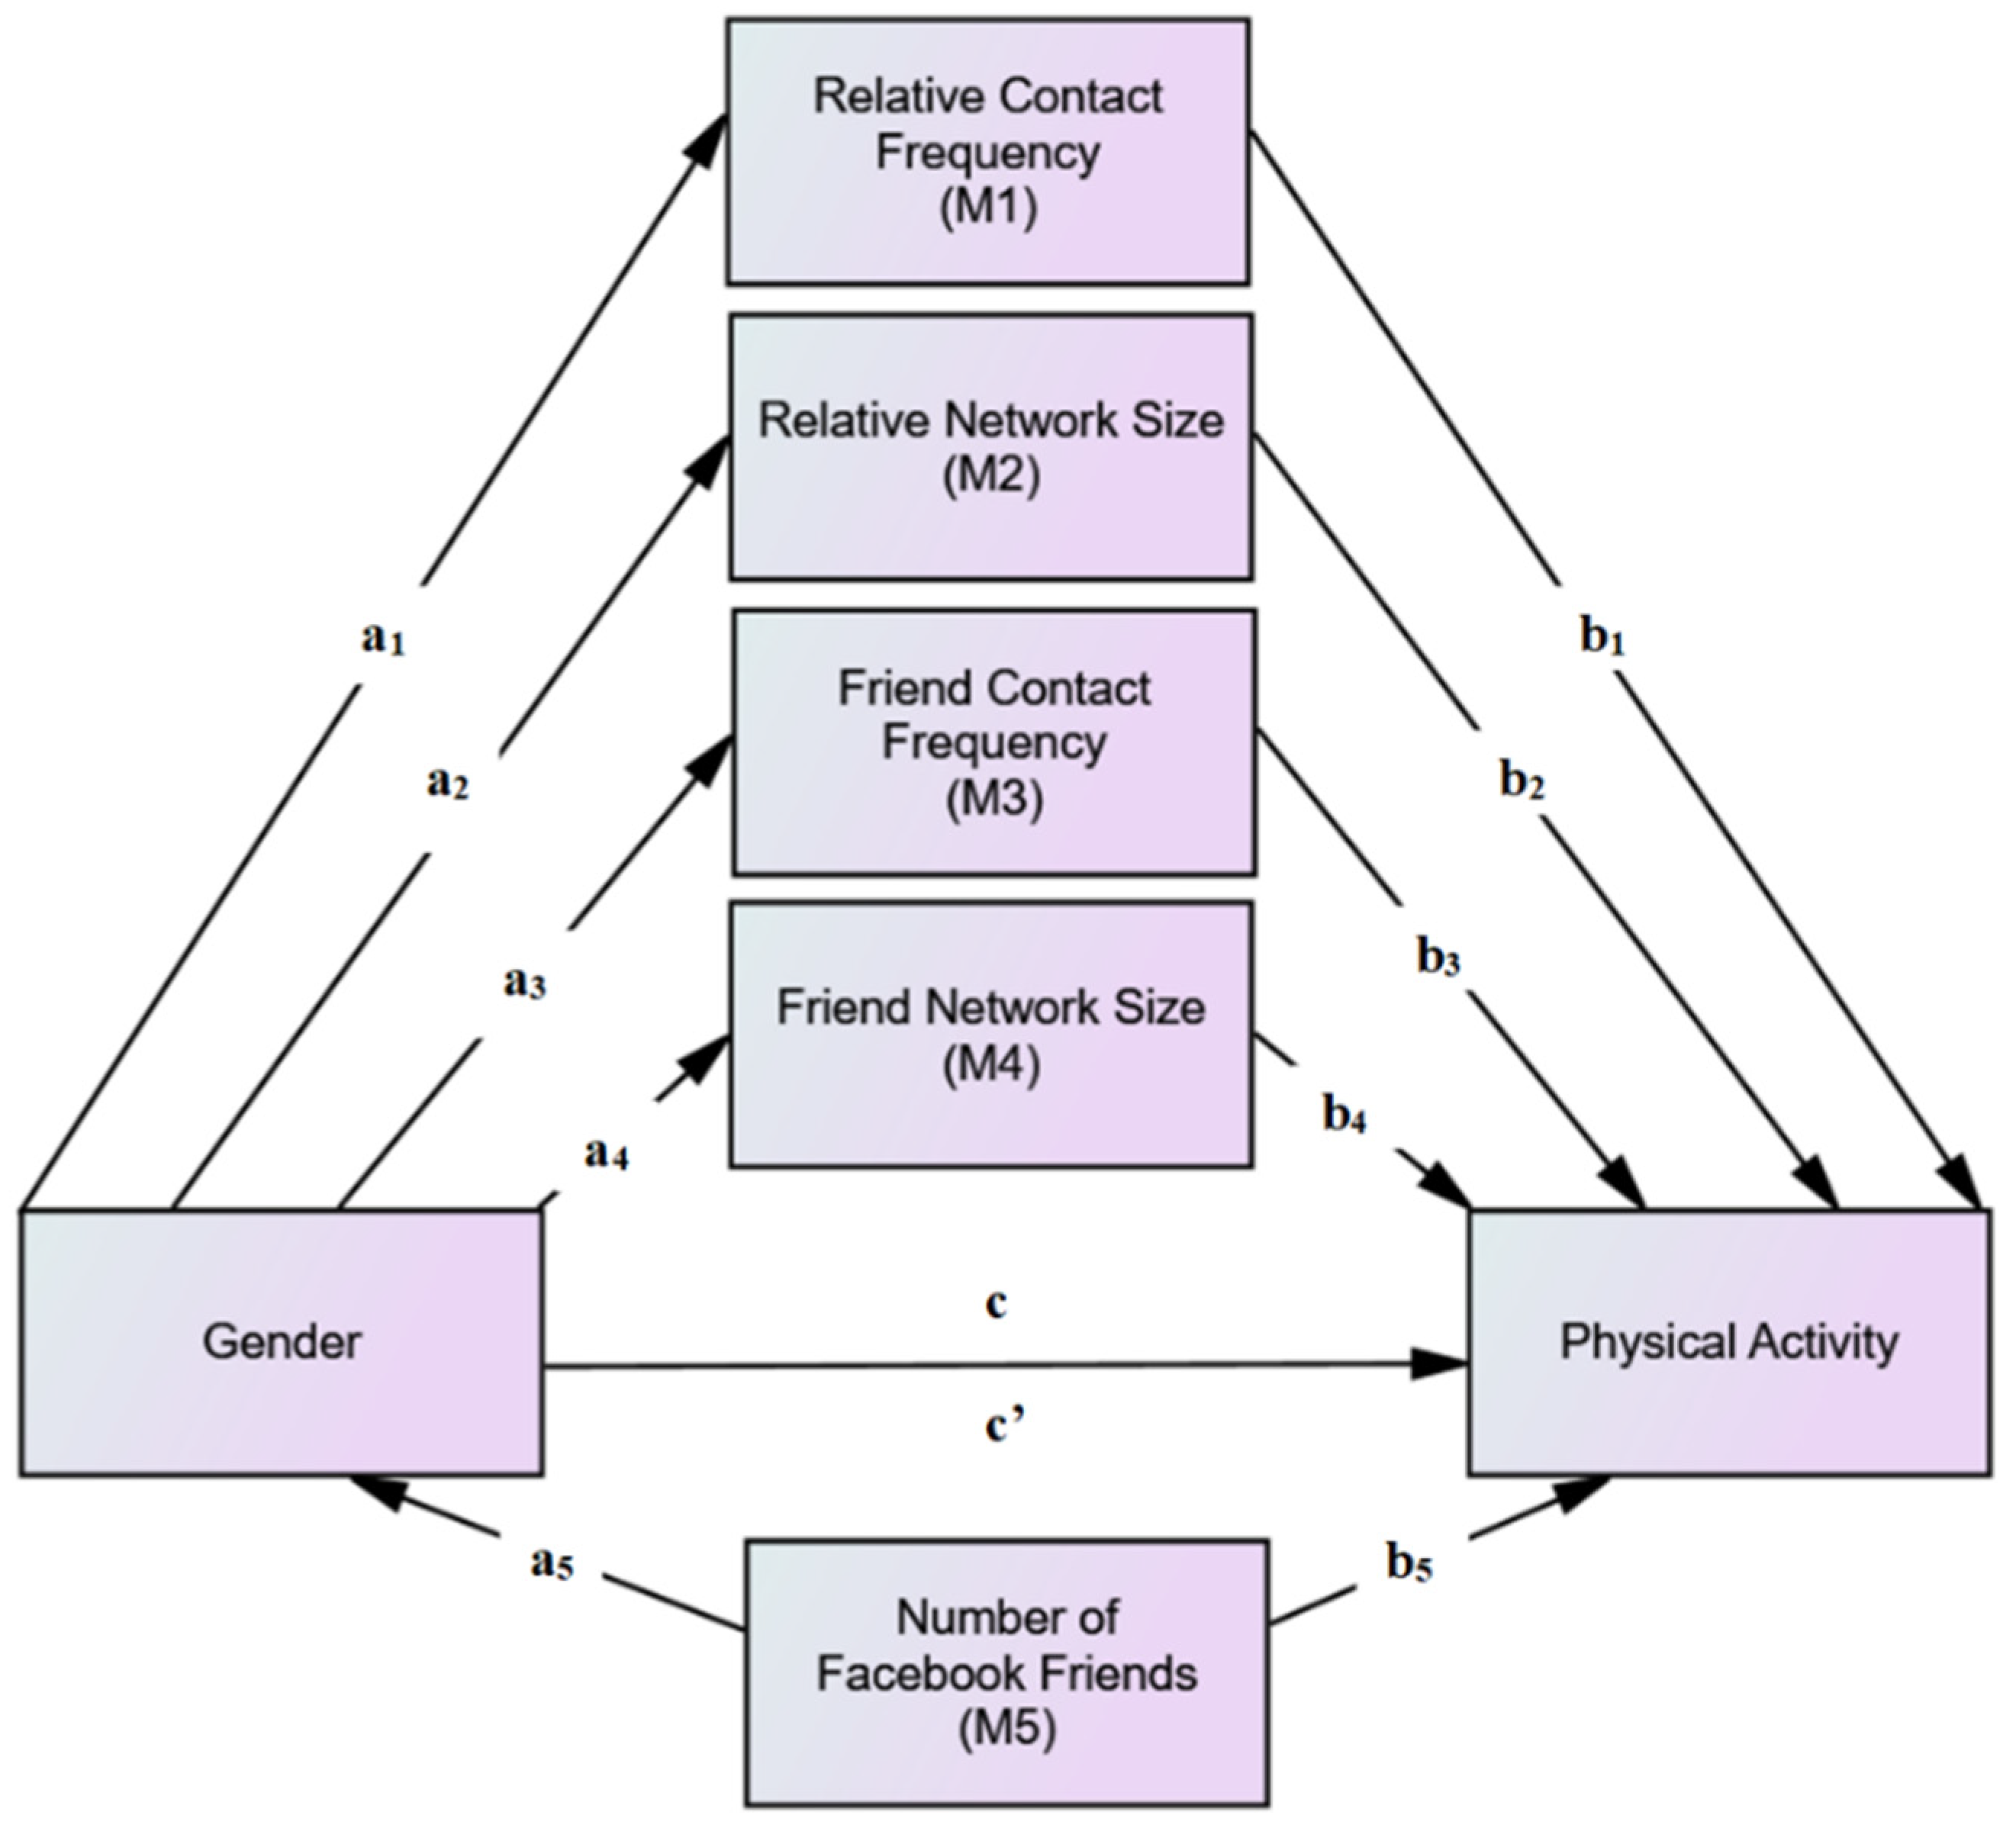
2.5. Data Analysis
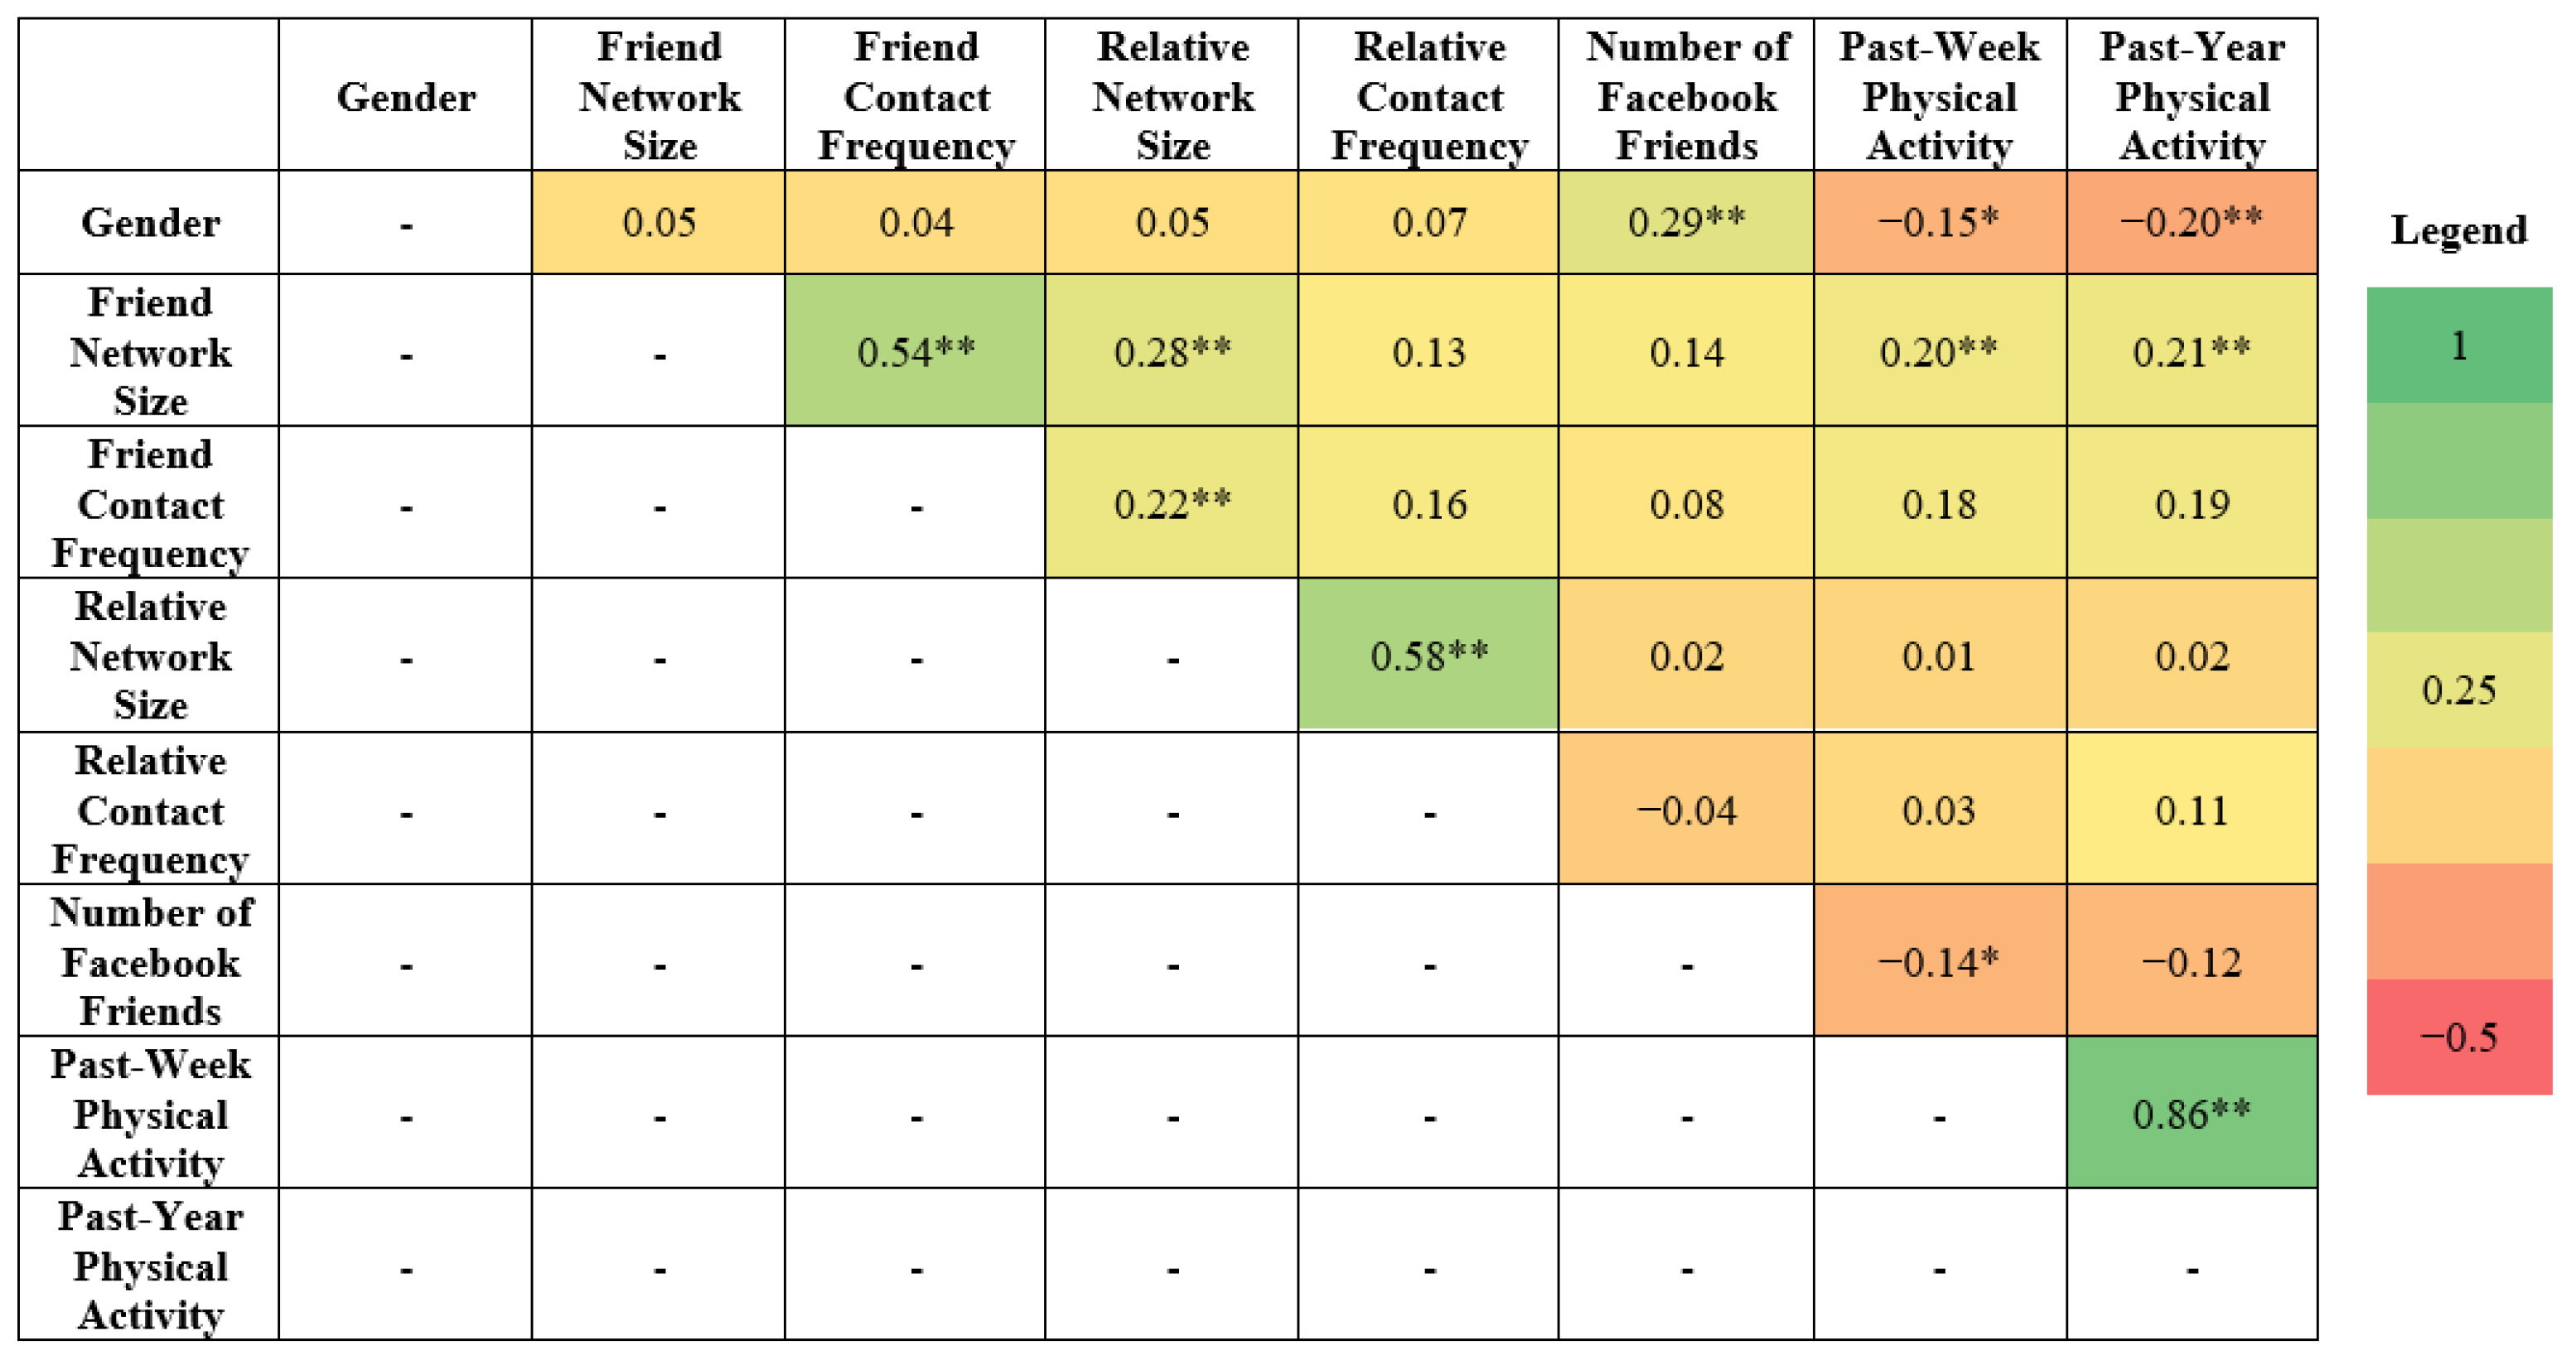
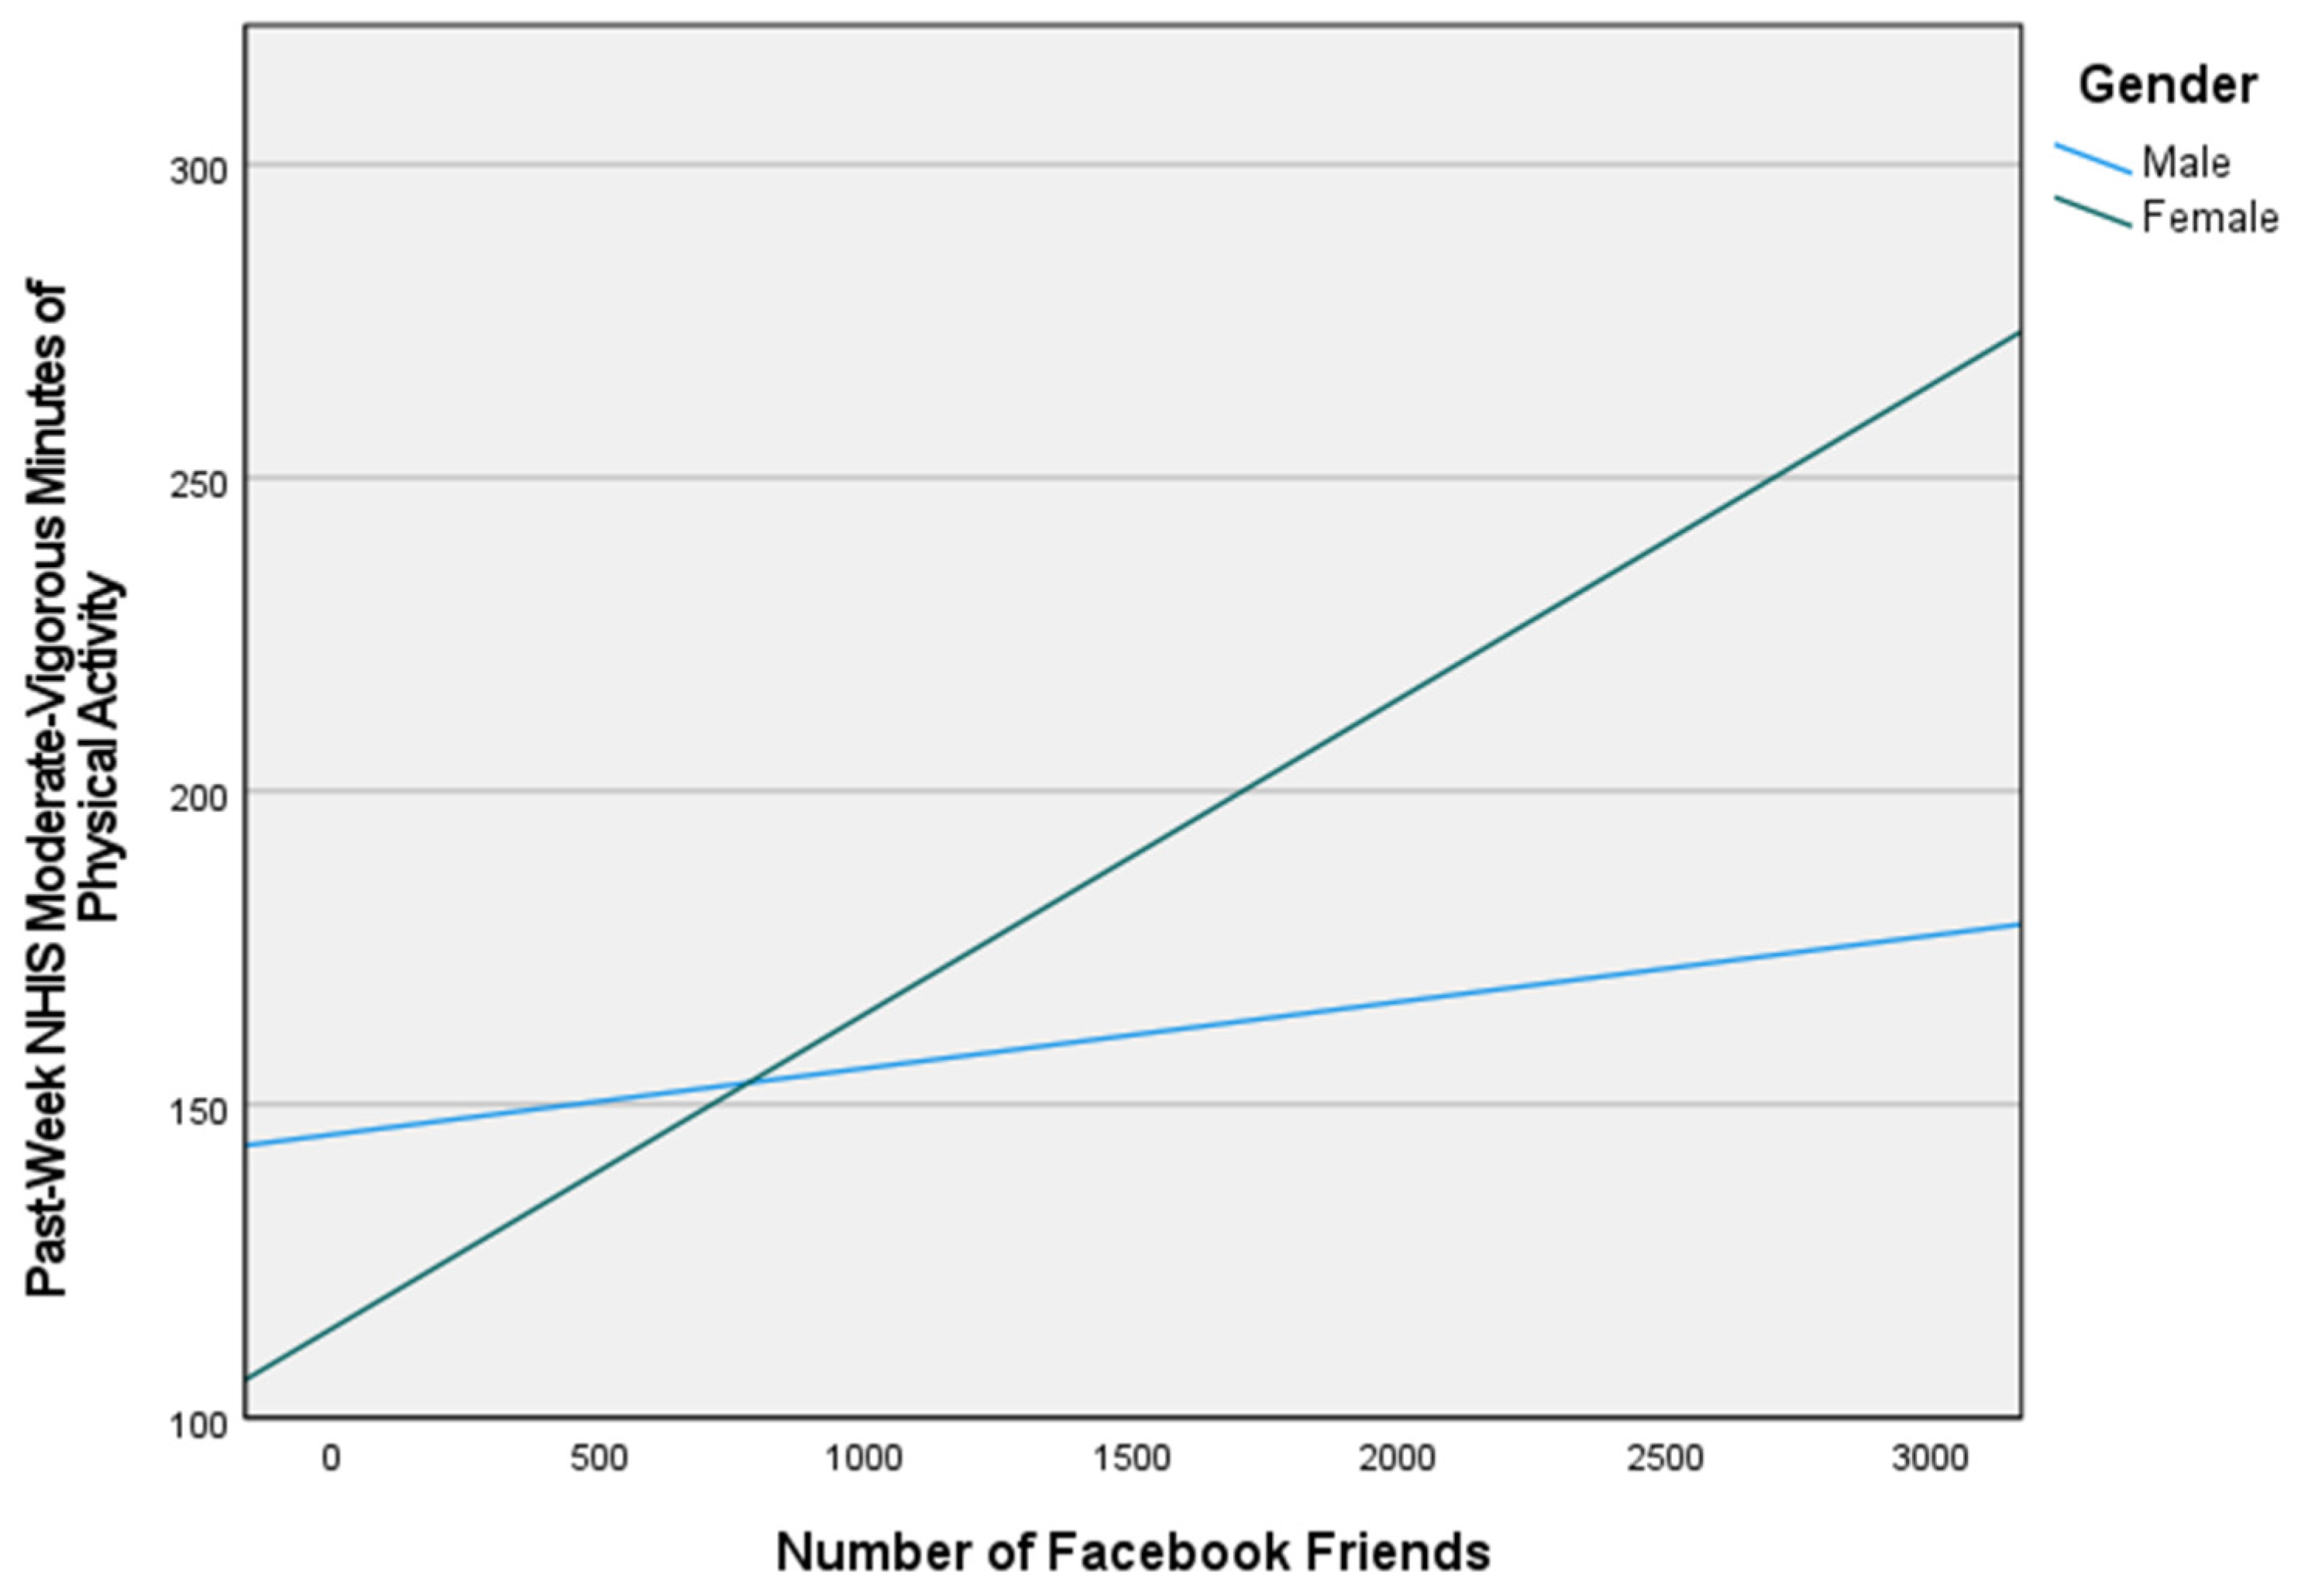
3. Results
Study Characteristics
4. Discussion
5. Implications
Limitations
6. Conclusions
Supplementary Materials
Author Contributions
Funding
Institutional Review Board Statement
Informed Consent Statement
Data Availability Statement
Conflicts of Interest
Abbreviations
| CDC | Centers for Disease Control and Prevention |
| CI | Confidence Interval |
| CT-PAQ | Chasan-Taber Physical Activity Questionnaire |
| HIT | Human Intelligence Task |
| ID | Identification |
| MTurk | Mechanical Turk |
| NHIS | National Interview Survey |
| SD | Standard Deviation |
| SNAP | Social Networks for Activity Promotion |
| SNI | Berkman–Syme Social Network Index |
| US | United States |
References
- Piercy, K.L.; Troiano, R.P.; Ballard, R.M.; Carlson, S.A.; Fulton, J.E.; Galuska, D.A.; George, S.M.; Olson, R.D. The Physical Activity Guidelines for Americans. JAMA 2018, 320, 2020–2028. [Google Scholar] [CrossRef] [PubMed]
- Armstrong, S.; Wong, C.A.; Perrin, E.; Page, S.; Sibley, L.; Skinner, A. Association of Physical Activity With Income, Race/Ethnicity, and Sex Among Adolescents and Young Adults in the United States: Findings From the National Health and Nutrition Examination Survey, 2007–2016. JAMA Pediatr. 2018, 172, 732–740. [Google Scholar] [CrossRef]
- Sallis, J.; Bull, F.; Guthold, R.; Heath, G.W.; Inoue, S.; Kelly, P.; Oyeyemi, A.L.; Perez, L.G.; Richards, J.; Hallal, P.C. Progress in physical activity over the Olympic quadrennium. Lancet 2016, 388, 1325–1336. [Google Scholar] [CrossRef]
- Guthold, R.; Stevens, G.A.; Riley, L.M.; Bull, F.C. Worldwide trends in insufficient physical activity from 2001 to 2016: A pooled analysis of 358 population-based surveys with 1·9 million participants. Lancet Glob. Health 2018, 6, e1077–e1086. [Google Scholar] [CrossRef] [Green Version]
- Nienhuis, C.P.; Lesser, I.A. The Impact of COVID-19 on Women’s Physical Activity Behavior and Mental Well-Being. Int. J. Environ. Res. Public Health 2020, 17, 9036. [Google Scholar] [CrossRef]
- Qin, F.; Song, Y.; Nassis, G.P.; Zhao, L.; Dong, Y.; Zhao, C.; Feng, Y.; Zhao, J. Physical Activity, Screen Time, and Emotional Well-Being during the 2019 Novel Coronavirus Outbreak in China. Int. J. Environ. Res. Public Health 2020, 17, 5170. [Google Scholar] [CrossRef] [PubMed]
- Forsyth, J.J.; Makay, L.; Riley, V. Perceptions of Physical Activity Changes Due to COVID-19 Restrictions Among Women in the United Kingdom. Women Sport Phys. Act. J. 2021, 29, 117–126. [Google Scholar] [CrossRef]
- Pieh, C.; Budimir, S.; Probst, T. The effect of age, gender, income, work, and physical activity on mental health during coronavirus disease (COVID-19) lockdown in Austria. J. Psychosom. Res. 2020, 136, 110186. [Google Scholar] [CrossRef]
- Maugeri, G.; Castrogiovanni, P.; Battaglia, G.; Pippi, R.; D’Agata, V.; Palma, A.; Di Rosa, M.; Musumeci, G. The impact of physical activity on psychological health during Covid-19 pandemic in Italy. Heliyon 2020, 6, e04315. [Google Scholar] [CrossRef]
- Aune, D.; Norat, T.; Leitzmann, M.; Tonstad, S.; Vatten, L.J. Physical activity and the risk of type 2 diabetes: A systematic review and dose-response meta-analysis. Eur. J. Epidemiol. 2015, 30, 529–542. [Google Scholar] [CrossRef]
- Chomistek, A.K.; Cook, N.R.; Rimm, E.B.; Ridker, P.M.; Buring, J.E.; Lee, I.-M. Physical Activity and Incident Cardiovascular Disease in Women: Is the Relation Modified by Level of Global Cardiovascular Risk? J. Am. Heart Assoc. 2018, 7, e008234. [Google Scholar] [CrossRef] [Green Version]
- Moreno, J.P.; Johnston, C.A. Barriers to Physical Activity in Women. Am. J. Lifestyle Med. 2014, 8, 164–166. [Google Scholar] [CrossRef]
- Edwards, E.S.; Sackett, S.C. Psychosocial Variables Related to Why Women are Less Active than Men and Related Health Implications. Clin. Med. Insights Womens Health 2016, 9, 47–56. [Google Scholar] [CrossRef] [Green Version]
- Rovniak, L.S.; Sallis, J.F.; Kraschnewski, J.L.; Sciamanna, C.N.; Kiser, E.J.; Ray, C.A.; Chinchilli, V.M.; Ding, D.; Matthews, S.A.; Bopp, M.; et al. Engineering online and in-person social networks to sustain physical activity: Application of a conceptual model. BMC Public Health 2013, 13, 1–15. [Google Scholar] [CrossRef] [Green Version]
- Scarapicchia, T.M.F.; Amireault, S.; Faulkner, G.; Sabiston, C.M. Social support and physical activity participation among healthy adults: A systematic review of prospective studies. Int. Rev. Sport Exerc. Psychol. 2017, 10, 50–83. [Google Scholar] [CrossRef]
- Haq, A.u.; Chand, S. Exploratory Study of the Pattern and Motives of Facebook Usage among University Students. J. Stat. 2014, 21, 118–127. [Google Scholar]
- McDonald, S.; Mair, C.A. Social Capital Across the Life Course: Age and Gendered Patterns of Network Resources1. Sociol. Forum 2010, 25, 335–359. [Google Scholar] [CrossRef]
- McLaughlin, D.; Vagenas, D.; Pachana, N.A.; Begum, N.; Dobson, A. Gender Differences in Social Network Size and Satisfaction in Adults in Their 70s. J. Health Psychol. 2010, 15, 671–679. [Google Scholar] [CrossRef]
- McAndrew, F.T.; Jeong, H.S. Who does what on Facebook? Age, sex, and relationship status as predictors of Facebook use. Comput. Hum. Behav. 2012, 28, 2359–2365. [Google Scholar] [CrossRef]
- Thompson, S.H.; Lougheed, E. Frazzled by Facebook? An Exploratory Study of Gender Differences in Social Network Communication among Undergraduate Men and Women. Coll. Stud. J. 2012, 46, 88–98. [Google Scholar]
- Berkman, L.F.; Syme, S.L. Social networks, host resistance, and mortality: A nine-year follow-up study of Alameda County residents. Am. J. Epidemiol. 1979, 109, 186–204. [Google Scholar] [CrossRef] [PubMed]
- CDC National Health Interview Survey. Available online: https://www.cdc.gov/nchs/nhis/index.htm (accessed on 15 August 2020).
- Chasan-Taber, L.; Erickson, J.B.; McBride, J.W.; Nasca, P.C.; Chasan-Taber, S.; Freedson, P.S. Reproducibility of a Self-administered Lifetime Physical Activity Questionnaire among Female College Alumnae. Am. J. Epidemiol. 2002, 155, 282–291. [Google Scholar] [CrossRef] [PubMed]
- Chasan-Taber, L.; Erickson, J.B.; Nasca, P.C.; Chasan-Taber, S.; Freedson, P.S. Validity and reproducibility of a physical activity questionnaire in women. Med. Sci. Sports Exerc. 2002, 34, 987–992. [Google Scholar] [CrossRef] [PubMed]
- Kiernan, M.; Moore, S.D.; Schoffman, D.E.; Lee, K.; King, A.C.; Taylor, C.B.; Kiernan, N.E.; Perri, M.G. Social support for healthy behaviors: Scale psychometrics and prediction of weight loss among women in a behavioral program. Obesity 2012, 20, 756–764. [Google Scholar] [CrossRef] [Green Version]
- CDC BRFSS Prevalence & Trends Data: Home|DPH|CDC. Available online: https://www.cdc.gov/brfss/brfssprevalence/index.html (accessed on 2 September 2020).
- Litman, L.; Robinson, J.; Rosenzweig, C. The relationship between motivation, monetary compensation, and data quality among US- and India-based workers on Mechanical Turk. Behav. Res. Methods 2015, 47, 519–528. [Google Scholar] [CrossRef]
- Mortensen, K.; Hughes, T.L. Comparing Amazon’s Mechanical Turk Platform to Conventional Data Collection Methods in the Health and Medical Research Literature. J. Gen. Intern. Med. 2018, 33, 533–538. [Google Scholar] [CrossRef] [Green Version]
- Shapiro, D.N.; Chandler, J.; Mueller, P.A. Using Mechanical Turk to Study Clinical Populations. Clin. Psychol. Sci. 2013, 1, 213–220. [Google Scholar] [CrossRef]
- Harris, P.A.; Taylor, R.; Thielke, R.; Payne, J.; Gonzalez, N.; Conde, J.G. Research electronic data capture (REDCap)—A metadata-driven methodology and workflow process for providing translational research informatics support. J. Biomed. Inform. 2009, 42, 377–381. [Google Scholar] [CrossRef] [Green Version]
- Sheehan, K.B. Crowdsourcing research: Data collection with Amazon’s Mechanical Turk. Commun. Monogr. 2018, 85, 140–156. [Google Scholar] [CrossRef]
- Sun, F.; Norman, I.J.; While, A.E. Physical activity in older people: A systematic review. BMC Public Health 2013, 13, 449. [Google Scholar] [CrossRef] [Green Version]
- Cohen, S. Social relationships and health. Am. Psychol. 2004, 59, 676–684. [Google Scholar] [CrossRef]
- Trudel-Fitzgerald, C.; Chen, Y.; Singh, A.; Okereke, O.I.; Kubzansky, L.D. Psychiatric, Psychological, and Social Determinants of Health in the Nurses’ Health Study Cohorts. Am. J. Public Health 2016, 106, 1644–1649. [Google Scholar] [CrossRef]
- Loucks, E.B.; Sullivan, L.M.; D’Agostino, R.B.; Larson, M.G.; Berkman, L.F.; Benjamin, E.J. Social networks and inflammatory markers in the Framingham Heart Study. J. Biosoc. Sci. 2006, 38, 835–842. [Google Scholar] [CrossRef]
- Iacobucci, D.; Posavac, S.S.; Kardes, F.R.; Schneider, M.J.; Popovich, D.L. Toward a more nuanced understanding of the statistical properties of a median split. J. Consum. Psychol. 2015, 25, 652–665. [Google Scholar] [CrossRef]
- Iacobucci, D.; Posavac, S.S.; Kardes, F.R.; Schneider, M.J.; Popovich, D.L. The median split: Robust, refined, and revived. J. Consum. Psychol. 2015, 25, 690–704. [Google Scholar] [CrossRef]
- Maier, C.; Laumer, S.; Eckhardt, A.; Weitzel, T. Giving too much social support: Social overload on social networking sites. Eur. J. Inf. Syst. 2015, 24, 447–464. [Google Scholar] [CrossRef]
- Nabi, R.L.; Prestin, A.; So, J. Facebook friends with (health) benefits? Exploring social network site use and perceptions of social support, stress, and well-being. Cyberpsychol. Behav. Soc. Netw. 2013, 16, 721–727. [Google Scholar] [CrossRef] [Green Version]
- Scholes, S.; Bann, D. Education-related disparities in reported physical activity during leisure-time, active transportation, and work among US adults: Repeated cross-sectional analysis from the National Health and Nutrition Examination Surveys, 2007 to 2016. BMC Public Health 2018, 18, 1–10. [Google Scholar] [CrossRef] [Green Version]
- CDC COVID Data Tracker. Available online: https://covid.cdc.gov/covid-data-tracker (accessed on 22 July 2021).
- IBM Corp. IBM SPSS Statistics for Windows, Version; IBM Corp: Armonk, NY, USA, 2020. [Google Scholar]
- Tabachnick, B.G.; Fidell, L.S. Using Multivariate Statistics, 6th ed.; Pearson: Boston, MA, USA, 2013; ISBN 0-321-05677-9. [Google Scholar]
- Preacher, K.J.; Hayes, A.F. Asymptotic and resampling strategies for assessing and comparing indirect effects in multiple mediator models. Behav. Res. Methods 2008, 40, 879–891. [Google Scholar] [CrossRef]
- Preacher, K.J.; Hayes, A.F. SPSS and SAS procedures for estimating indirect effects in simple mediation models. Behav. Res. Methods Instrum. Comput. 2004, 36, 717–731. [Google Scholar] [CrossRef] [Green Version]
- Shrout, P.E.; Bolger, N. Mediation in experimental and nonexperimental studies: New procedures and recommendations. Psychol. Methods 2002, 7, 422–445. [Google Scholar] [CrossRef]
- Mazman, S.G.; Usluel, Y.K. Gender Differences in Using Social Networks. Undefined 2011, 10, 133–139. [Google Scholar]
- Sheldon, P. Examining Gender Differences in Self-disclosure on Facebook Versus Face-to-Face. J. Soc. Media Soc. 2013, 1, 88–105. [Google Scholar]
- Denti, L.; Barbopuolos, I.; Nilsson, I.; Holmberg, L.; Thulin, M.; Wendeblad, M.; Andén, L.; Davidsson, E. Sweden’s largest Facebook study. Gothenbg. Res. Inst. 2012, 3, 1–38. [Google Scholar]
- AlMarzooqi, M.A. Physical Activity and Attitudes Toward Social Media Use of Active Individuals During the COVID-19 Pandemic in Saudi Arabia: Cross-Sectional Survey. Front. Psychol. 2021, 12, 707921. [Google Scholar] [CrossRef] [PubMed]
- Goodyear, V.A.; Boardley, I.; Chiou, S.-Y.; Fenton, S.A.M.; Makopoulou, K.; Stathi, A.; Wallis, G.A.; Veldhuijzen van Zanten, J.J.C.S.; Thompson, J.L. Social media use informing behaviours related to physical activity, diet and quality of life during COVID-19: A mixed methods study. BMC Public Health 2021, 21, 1333. [Google Scholar] [CrossRef]
- Rovniak, L.S.; Kong, L.; Hovell, M.F.; Ding, D.; Sallis, J.F.; Ray, C.A.; Kraschnewski, J.L.; Matthews, S.A.; Kiser, E.; Chinchilli, V.M.; et al. Engineering Online and In-person Social Networks for Physical Activity: A Randomized Trial. Ann. Behav. Med. Publ. Soc. Behav. Med. 2016, 50, 885–897. [Google Scholar] [CrossRef] [Green Version]
- Lavine, J.S.; Bjornstad, O.N.; Antia, R. Immunological characteristics govern the transition of COVID-19 to endemicity. Science 2021, 371, 741–745. [Google Scholar] [CrossRef] [PubMed]
- Vargas, I.; Howie, E.K.; Muench, A.; Perlis, M.L. Measuring the Effects of Social Isolation and Dissatisfaction on Depressive Symptoms during the COVID-19 Pandemic: The Moderating Role of Sleep and Physical Activity. Brain Sci. 2021, 11, 1449. [Google Scholar] [CrossRef] [PubMed]
- Lepri, B.; Staiano, J.; Shmueli, E.; Pianesi, F.; Pentland, A. The Role of Personality in Shaping Social Networks and Mediating Behavioral Change. User Model. User-Adapt. Interact. 2016, 26, 143–175. [Google Scholar] [CrossRef] [Green Version]
- Chen, C.; Finne, E.; Kopp, A.; Jekauc, D. Can Positive Affective Variables Mediate Intervention Effects on Physical Activity? A Systematic Review and Meta-Analysis. Front. Psychol. 2020, 11, 2907. [Google Scholar] [CrossRef]


| Variable | n (%) | |
|---|---|---|
| Gender a | Female | 129 (62.93) |
| Male | 76 (37.07) | |
| Ethnicity b | Not Hispanic or Latino | 198 (96.59) |
| Hispanic or Latino | 7 (3.41) | |
| Race c | American Indian or Alaskan Native | 2 (.98) |
| Asian | 14 (6.83) | |
| Black or African American | 14 (6.83) | |
| White | 175 (85.36) | |
| Education d | High school or GED | 25 (12.19) |
| Some college | 40 (19.51) | |
| 2-year college degree | 29 (14.15) | |
| 4-year college degree | 71 (34.63) | |
| Master’s degree | 31 (15.12) | |
| Doctoral degree | 9 (4.39) | |
| Marital status e | Single and never married | 66 (32.20) |
| Married | 96 (46.83) | |
| Divorced | 22 (10.73) | |
| Separated | 4 (1.95) | |
| Widowed | 2 (.98) | |
| Living with partner | 15 (7.32) | |
| Income f | Less than $30,000 | 46 (22.44) |
| $30,000–$49,999 | 53 (25.85) | |
| $50,000–$69,999 | 40 (19.51) | |
| $70,000–$89,999 | 25 (12.19) | |
| $90,000–$109,999 | 18 (8.78) | |
| $110,000–$149,999 | 16 (7.80) | |
| $150,000 or greater | 7 (3.41) | |
| Residence g | Single-family house | 154 (75.12) |
| Multi-family house | 3 (1.46) | |
| Apartment | 25 (12.20) | |
| Condominium | 4 (1.95) | |
| Townhouse | 10 (4.88) | |
| Duplex | 6 (2.93) | |
| Other | 3 (1.46) | |
| Health Status h | Excellent | 38 (18.54) |
| Very Good | 73 (35.61) | |
| Good | 61 (29.76) | |
| Fair | 30 (14.63) | |
| Poor | 3 (1.46) | |
| Mean (SD) | ||
| Age | 40.98 (12.89) | |
| Average number of Facebook friends | 255.81 (375.37) | |
| Average moderate-vigorous physical activity (NHIS) | 168.79 (220.23) | |
| Average moderate-vigorous physical activity per week over the past year (CT-PAQ) | 232.27 (350.64) | |
| Pathway | Indirect Effect | |||
|---|---|---|---|---|
| β | SE | Bootstrapped 95% CI | ||
| Lower | Upper | |||
| Gender—All Mediator Variables—Physical Activity | −24.88 | 12.70 | −50.29 | −4.07 |
| Gender—Friend Network Size—Physical Activity | −3.39 | 6.00 | −18.24 | 5.90 |
| Gender—Friend Contact Frequency—Physical Activity | −2.36 | 5.28 | −15.66 | 6.63 |
| Gender—Facebook Friends—Physical Activity | −19.13 | 9.71 | −40.45 | −2.09 |
Publisher’s Note: MDPI stays neutral with regard to jurisdictional claims in published maps and institutional affiliations. |
© 2022 by the authors. Licensee MDPI, Basel, Switzerland. This article is an open access article distributed under the terms and conditions of the Creative Commons Attribution (CC BY) license (https://creativecommons.org/licenses/by/4.0/).
Share and Cite
Kuzmik, A.; Liu, Y.; Cuffee, Y.; Kong, L.; Sciamanna, C.N.; Rovniak, L.S. The Association between Gender and Physical Activity Was Partially Mediated by Social Network Size during COVID-19. Int. J. Environ. Res. Public Health 2022, 19, 2495. https://doi.org/10.3390/ijerph19052495
Kuzmik A, Liu Y, Cuffee Y, Kong L, Sciamanna CN, Rovniak LS. The Association between Gender and Physical Activity Was Partially Mediated by Social Network Size during COVID-19. International Journal of Environmental Research and Public Health. 2022; 19(5):2495. https://doi.org/10.3390/ijerph19052495
Chicago/Turabian StyleKuzmik, Ashley, Yin Liu, Yendelela Cuffee, Lan Kong, Christopher N. Sciamanna, and Liza S. Rovniak. 2022. "The Association between Gender and Physical Activity Was Partially Mediated by Social Network Size during COVID-19" International Journal of Environmental Research and Public Health 19, no. 5: 2495. https://doi.org/10.3390/ijerph19052495
APA StyleKuzmik, A., Liu, Y., Cuffee, Y., Kong, L., Sciamanna, C. N., & Rovniak, L. S. (2022). The Association between Gender and Physical Activity Was Partially Mediated by Social Network Size during COVID-19. International Journal of Environmental Research and Public Health, 19(5), 2495. https://doi.org/10.3390/ijerph19052495