
Changes in Bone Mineral Density and Trabecular Bone Score over Time between Vegetarian and Non-Vegetarian Middle-Aged and Older Women: A Three-Year Retrospective Medical Record Review

 ,
,  ,
,
Abstract
:1. Introduction
2. Materials and Methods
2.1. Study Participants and Study Variables
2.2. Vegetarian and Non-Vegetarian Status
2.3. Measurements of BMD and BMD T-Score
2.4. Measurement of Trabecular Bone Score
2.5. Statistical Analysis
3. Results
4. Discussion
5. Conclusions
Author Contributions
Funding
Institutional Review Board Statement
Informed Consent Statement
Data Availability Statement
Conflicts of Interest
References
- Jonsson, B.; Kanis, J.; Dawson, A.; Oden, A.; Johnell, O. Effect and offset of effect of treatments for hip fracture on health outcomes. Osteoporos. Int. 1999, 10, 193–199. [Google Scholar] [CrossRef] [PubMed]
- Sezer, A.; Altan, L.; Ozdemir, O. Multiple comparison of age groups in bone mineral density under heteroscedasticity. BioMed Res. Int. 2015, 2015, 426847. [Google Scholar] [CrossRef] [PubMed]
- Kanis, J.A.; Pitt, F.A. Epidemiology of osteoporosis. Bone 1992, 13, S7–S15. [Google Scholar] [CrossRef]
- Johnston, C.B.; Dagar, M. Osteoporosis in older adults. Med. Clin. N. Am. 2020, 104, 873–884. [Google Scholar] [CrossRef]
- Lin, Y.C.; Pan, W.H. Bone mineral density in adults in Taiwan: Results of the Nutrition and Health Survey in Taiwan 2005–2008 (NAHSIT 2005–2008). Asia Pac. J. Clin. Nutr. 2011, 20, 283–291. [Google Scholar]
- Finkelstein, J.S.; Brockwell, S.E.; Mehta, V.; Greendale, G.A.; Sowers, M.R.; Ettinger, B.; Lo, J.C.; Johnston, J.M.; Cauley, J.A.; Danielson, M.E.; et al. Bone mineral density changes during the menopause transition in a multiethnic cohort of women. J. Clin. Endocrinol. Metab. 2008, 93, 861–868. [Google Scholar] [CrossRef]
- World Health Organization (WHO). Research on the Menopause; WHO Technical Report Series No.670; World Health Organization: Geneva, Switzerland, 1981; pp. 1–120. [Google Scholar]
- Shariati-Sarabi, Z.; Rezaie, H.E.; Milani, N.; Rezaie, F.E.; Rezaie, A.E. Evaluation of bone mineral density in perimenopausal period. Arch. Bone Jt. Surg. 2018, 6, 57–62. [Google Scholar]
- Fields, A.J.; Keaveny, T.M. Trabecular architecture and vertebral fragility in osteoporosis. Curr. Osteoporos. Rep. 2012, 10, 132–140. [Google Scholar] [CrossRef]
- Francis, R.M.; Sutcliffe, A.M.; Scane, A.C. Pathogenesis of osteoporosis. In Osteoporosis; Stevenson, J.C., Lindsay, R., Eds.; Chapman & Hall: London, UK, 1998; p. 29. [Google Scholar]
- Pothuaud, L.; Carceller, P.; Hans, D. Correlations between grey-level variations in 2D projection images (TBS) and 3D microarchitecture: Applications in the study of human trabecular bone microarchitecture. Bone 2008, 42, 775–787. [Google Scholar] [CrossRef]
- Hans, D.; Barthe, N.; Boutroy, S.; Pothuaud, L.; Winzenrieth, R.; Krieg, M.A. Correlations between trabecular bone score, measured using anteroposterior dual-energy X-ray absorptiometry acquisition, and 3-dimensional parameters of bone microarchitecture: An experimental study on human cadaver vertebrae. J. Clin. Densitom. 2011, 14, 302–312. [Google Scholar] [CrossRef]
- Roux, J.P.; Wegrzyn, J.; Boutroy, S.; Bouxsein, M.L.; Hans, D.; Chapurlat, R. The predictive value of trabecular bone score (TBS) on whole lumbar vertebrae mechanics: An ex vivo study. Osteoporos. Int. 2013, 24, 2455–2460. [Google Scholar] [CrossRef] [PubMed]
- Silva, B.C.; Leslie, W.D.; Resch, H.; Lamy, O.; Lesnyak, O.; Binkley, N.; McCloskey, E.V.; Kanis, J.A.; Bilezikian, J.P. Trabecular bone score: A noninvasive analytical method based upon the DXA image. J. Bone Miner. Res. 2014, 29, 518–530. [Google Scholar] [CrossRef] [PubMed]
- Krueger, D.; Fidler, E.; Libber, J.; Aubry-Rozier, B.; Hans, D.; Binkley, N. Spine trabecular bone score subsequent to bone mineral density improves fracture discrimination in women. J. Clin. Densitom. 2014, 17, 60–65. [Google Scholar] [CrossRef] [PubMed]
- McCloskey, E.V.; Odén, A.; Harvey, N.C.; Leslie, W.D.; Hans, D.; Johansson, H.; Barkmann, R.; Boutroy, S.; Brown, J.; Chapurlat, R.; et al. A meta-analysis of trabecular bone score in fracture risk prediction and its relationship to FRAX. J. Bone Miner. Res. 2016, 31, 940–948. [Google Scholar] [CrossRef]
- Koo, M.; Chuang, T.L.; Wang, Y.F. Research trends in trabecular bone score: A bibliometric review from 2008 to 2019. Tzu-Chi Med. J. 2021, 33, 307–313. [Google Scholar] [CrossRef]
- Kong, S.H.; Hong, N.; Kim, J.W.; Kim, D.Y.; Kim, J.H. Application of the trabecular bone score in clinical practice. J. Bone Metab. 2021, 28, 101–113. [Google Scholar] [CrossRef]
- Ho-Pham, L.T.; Nguyen, N.D.; Nguyen, T.V. Effect of vegetarian diets on bone mineral density: A Bayesian meta-analysis. Am. J. Clin. Nutr. 2009, 90, 943–950. [Google Scholar] [CrossRef]
- Tong, T.; Appleby, P.N.; Armstrong, M.; Fensom, G.K.; Knuppel, A.; Papier, K.; Perez-Cornago, A.; Travis, R.C.; Key, T.J. Vegetarian and vegan diets and risks of total and site-specific fractures: Results from the prospective EPIC-Oxford study. BMC Med. 2020, 18, 353. [Google Scholar] [CrossRef]
- Li, T.; Li, Y.; Wu, S. Comparison of human bone mineral densities in subjects on plant-based and omnivorous diets: A systematic review and meta-analysis. Arch. Osteoporos. 2021, 16, 95. [Google Scholar] [CrossRef]
- Galchenko, A.; Gapparova, K.; Sidorova, E. The influence of vegetarian and vegan diets on the state of bone mineral density in humans. Crit. Rev. Food Sci. Nutr. 2021. [Google Scholar] [CrossRef]
- Karavasiloglou, N.; Selinger, E.; Gojda, J.; Rohrmann, S.; Kühn, T. Differences in bone mineral density between adult vegetarians and nonvegetarians become marginal when accounting for differences in anthropometric factors. J. Nutr. 2020, 150, 1266–1271. [Google Scholar] [CrossRef] [PubMed]
- Chuang, T.L.; Lin, C.H.; Wang, Y.F. Effects of vegetarian diet on bone mineral density. Tzu Chi Med. J. 2020, 33, 128–134. [Google Scholar] [CrossRef] [PubMed]
- Rosenfeld, D.L.; Tomiyama, A.J. When vegetarians eat meat: Why vegetarians violate their diets and how they feel about doing so. Appetite 2019, 143, 104417. [Google Scholar] [CrossRef] [PubMed]
- Shen, T.Y.; Strong, C.; Yu, T. Age at menopause and mortality in Taiwan: A cohort analysis. Maturitas 2020, 136, 42–48. [Google Scholar] [CrossRef] [PubMed]
- Yang, T.S.; Chen, Y.R.; Chen, Y.J.; Chang, C.Y.; Ng, H.T. Osteoporosis: Prevalence in Taiwanese women. Osteoporos. Int. 2004, 15, 345–347. [Google Scholar] [CrossRef] [PubMed]
- Hendrickx, G.; Boudin, E.; Van Hul, W. A look behind the scenes: The risk and pathogenesis of primary osteoporosis. Nat. Rev. Rheumatol. 2015, 11, 462–474. [Google Scholar] [CrossRef] [PubMed]
- Zaidi, M.; Turner, C.H.; Canalis, E.; Pacifici, R.; Sun, L.; Iqbal, J.; Guo, X.E.; Silverman, S.; Epstein, S.; Rosen, C.J. Bone loss or lost bone: Rationale and recommendations for the diagnosis and treatment of early postmenopausal bone loss. Curr. Osteoporos. Rep. 2009, 7, 118–126. [Google Scholar] [CrossRef]
- van Santen, J.A.; Pereira, C.; Sanchez-Santos, M.T.; Cooper, C.; Arden, N.K. Dominant vs. non-dominant hip comparison in bone mineral density in young sporting athletes. Arch Osteoporos. 2019, 14, 54. [Google Scholar] [CrossRef] [Green Version]
- Recker, R.R.; Lappe, J.M.; Davies, K.M.; Kimmel, D.B. Change in bone mass immediately before menopause. J. Bone Miner. Res. 1992, 7, 857–862. [Google Scholar] [CrossRef]
- Riggs, B.L.; Wahner, H.W.; Melton, L.J., 3rd; Richelson, L.S.; Judd, H.L.; Offord, K.P. Rates of bone loss in the appendicular and axial skeletons of women. Evidence of substantial vertebral bone loss before menopause. J. Clin. Invest. 1986, 77, 1487–1491. [Google Scholar] [CrossRef]
- Slemenda, C.; Longcope, C.; Peacock, M.; Hui, S.; Johnston, C.C. Sex steroids, bone mass, and bone loss. A prospective study of pre-, peri-, and postmenopausal women. J. Clin. Invest. 1996, 97, 14–21. [Google Scholar] [CrossRef] [PubMed]
- Fujiwara, S.; Fukunaga, M.; Nakamura, T.; Chen, J.T.; Shiraki, M.; Hashimoto, T.; Yoh, K.; Mizunuma, H.; Tomomitsu, T.; Kasagi, F.; et al. Rates of change in spinal bone density among Japanese women. Calcif. Tissue Int. 1998, 63, 202–207. [Google Scholar] [CrossRef] [PubMed]
- Chapurlat, R.D.; Garnero, P.; Sornay-Rendu, E.; Arlot, M.E.; Claustrat, B.; Delmas, P.D. Longitudinal study of bone loss in pre- and perimenopausal women: Evidence for bone loss in perimenopausal women. Osteoporos. Int. 2000, 11, 493–498. [Google Scholar] [CrossRef]
- Shaw, C.; Tzen, K.; Chang, T. A prospective study of bone mineral density change in Taiwan. Calcif. Tissue Int. 1998, 62, 109–113. [Google Scholar] [CrossRef] [PubMed]
- Starrach, T.; Santl, A.; Seifert-Klauss, V.R. Perimenopausal bone loss is associated with ovulatory activity—Results of the pekno study (perimenopausal bone density and ovulation). Diagnostics 2022, 12, 305. [Google Scholar] [CrossRef]
- Oftadeh, R.; Perez-Viloria, M.; Villa-Camacho, J.C.; Vaziri, A.; Nazarian, A. Biomechanics and mechanobiology of trabecular bone: A review. J. Biomech. Eng. 2015, 137, 0108021–01080215. [Google Scholar] [CrossRef] [Green Version]
- Ott, S.M. Cortical or trabecular bone: What’s the difference? Am. J. Nephrol. 2018, 47, 373–375. [Google Scholar] [CrossRef]
- Riggs, B.L.; Melton, L.J. 3rd. The prevention and treatment of osteoporosis. N. Engl. J. Med. 1992, 327, 620–627. [Google Scholar] [CrossRef]
- Iguacel, I.; Miguel-Berges, M.L.; Gomez-Bruton, A.; Moreno, L.A.; Julian, C. Veganism, vegetarianism, bone mineral density, and fracture risk: A systematic review and meta-analysis. Nutr. Rev. 2019, 77, 1–18. [Google Scholar] [CrossRef]
- Tesar, R.; Notelovitz, M.; Shim, E.; Kauwell, G.; Brown, J. Axial and peripheral bone density and nutrient intakes of postmenopausal vegetarian and omnivorous women. Am. J. Clin. Nutr. 1992, 56, 699–704. [Google Scholar] [CrossRef]
- Marsh, A.G.; Sanchez, T.V.; Michelsen, O.; Chaffee, F.L.; Fagal, S.M. Vegetarian lifestyle and bone mineral density. Am. J. Clin. Nutr. 1988, 48, 837–841. [Google Scholar] [CrossRef] [PubMed]
- Wang, Y.F.; Chiu, J.S.; Chuang, M.H.; Chiu, J.E.; Lin, C.L. Bone mineral density of vegetarian and non-vegetarian adults in Taiwan. Asia Pac. J. Clin. Nutr. 2008, 17, 101–106. [Google Scholar] [PubMed]
- Chiu, J.F.; Lan, S.J.; Yang, C.Y.; Wang, P.W.; Yao, W.J.; Su, L.H.; Hsieh, C.C. Long-term vegetarian diet and bone mineral density in postmenopausal Taiwanese women. Calcif. Tissue Int. 1997, 60, 245–249. [Google Scholar] [CrossRef] [PubMed]
- Lau, E.M.; Kwok, T.; Woo, J.; Ho, S.C. Bone mineral density in Chinese elderly female vegetarians, vegans, lacto-vegetarians and omnivores. Eur. J. Clin. Nutr. 1998, 52, 60–64. [Google Scholar] [CrossRef] [Green Version]
- Craig, W.J. Nutrition concerns and health effects of vegetarian diets. Nutr. Clin. Pract. 2010, 25, 613–620. [Google Scholar] [CrossRef]
- Movassagh, E.Z.; Vatanparast, H. Current evidence on the association of dietary patterns and bone health: A scoping review. Adv. Nutr. 2017, 8, 1–16. [Google Scholar] [CrossRef]

| Variable | Age Group | |||||||||||
|---|---|---|---|---|---|---|---|---|---|---|---|---|
| All (n = 1049) | 40–55 Years (n = 458) | 56–64 Years (n = 344) | 65–90 Years (n = 247) | |||||||||
| T1 | T2 | p | T1 | T2 | p | T1 | T2 | p | T1 | T2 | p | |
| Vegetarian, n (%) | 629 (60.0) | 629 (60.0) | >0.999 | 224 (48.9) | 221 (48.3) | 0.788 | 237 (68.9) | 237 (68.9) | >0.999 | 168 (68.0) | 171 (69.2) | 0.749 |
| Age (years) | 56.2 (9.7) | 59.2 (9.7) | - | 47.0 (3.9) | 50.0 (3.9) | - | 58.6 (1.7) | 61.6 (1.7) | - | 69.8 (4.1) | 72.8 (4.1) | - |
| BMI (kg/m2) | 23.5 (3.3) | 23.9 (3.5) | <0.001 * | 23.3 (3.6) | 23.9 (3.7) | <0.001 * | 23.5 (3.1) | 23.9 (3.2) | <0.001 * | 23.8 (3.2) | 24.2 (3.4) | <0.001 * |
| SBP (mmHg) | 126.5 (20.7) | 126.1 (19.8) | 0.459 | 120.3 (19.5) | 119.9 (18.3) | 0.572 | 128.0 (19.8) | 127.5 (18.7) | 0.623 | 135.9 (20.3) | 135.6 (20.0) | 0.841 |
| DBP (mmHg) | 71.9 (11.0) | 71.4 (10.8) | 0.049 * | 71.7 (11.5) | 71.4 (11.5) | 0.511 | 72.0 (10.7) | 71.6 (10.6) | 0.400 | 72.4 (10.4) | 71.0 (9.4) | 0.032 * |
| HDL-C (mg/dL) | 53.3 (14.6) | 52.7 (14.6) | 0.016 * | 55.8 (15.4) | 55.2 (15.4) | 0.130 | 50.9 (13.0) | 50.0 (13.2) | 0.037 * | 52.0 (14.4) | 51.7 (14.3) | 0.570 |
| LDL-C (mg/dL) | 118.2 (31.5) | 114.8 (30.6) | <0.001 * | 112.7 (30.0) | 113.3 (29.5) | 0.541 | 124.8 (32.2) | 118.9 (32.0) | <0.001 * | 119.4 (31.6) | 111.7 (30.2) | <0.001 * |
| Fasting blood glucose (mg/dL) | 105.0 (21.7) | 102.9 (21.7) | <0.001 * | 100.4 (17.5) | 99.0 (19.3) | 0.003 * | 107.3 (25.0) | 105.1 (22.5) | 0.026 * | 110.3 (22.1) | 107.1 (23.8) | 0.006 * |
| Albumin (g/dL) | 4.3 (0.3) | 4.4 (0.2) | <0.001 * | 4.3 (0.3) | 4.4 (0.2) | 0.003 * | 4.3 (0.3) | 4.4 (0.2) | 0.091 | 4.3 (0.3) | 4.3 (0.2) | 0.064 |
| ALP (IU/L) | 79.4 (24.8) | 70.6 (20.3) | <0.001 * | 70.2 (21.8) | 66.3 (19.1) | <0.001 * | 87.7 (25.2) | 74.4 (20.6) | <0.001 * | 85.0 (23.7) | 73.0 (20.5) | <0.001 * |
| eGFR (mL/min/1.73 m2) | 117.5 (22.4) | 99.9 (22.8) | <0.001 * | 124.5 (20.8) | 105.1 (21.2) | <0.001 * | 115.8 (20.9) | 101.3 (23.6) | <0.001 * | 106.8 (23.0) | 88.5 (20.4) | <0.001 * |
| TCH (mg/dL) | 188.8 (35.8) | 186.6 (35.6) | 0.011 * | 183.8 (33.7) | 185.9 (34.1) | 0.107 | 194.6 (37.1) | 189.9 (37.9) | 0.001 * | 189.9 (36.5) | 183.3 (34.7) | 0.001 * |
| Triglycerides (mg/dL) | 104.6 (56.3) | 104.3 (61.7) | 0.828 | 93.3 (57.6) | 94.5 (66.2) | 0.558 | 114.6 (56.7) | 111.6 (59.6) | 0.245 | 111.4 (49.2) | 112.3 (52.7) | 0.760 |
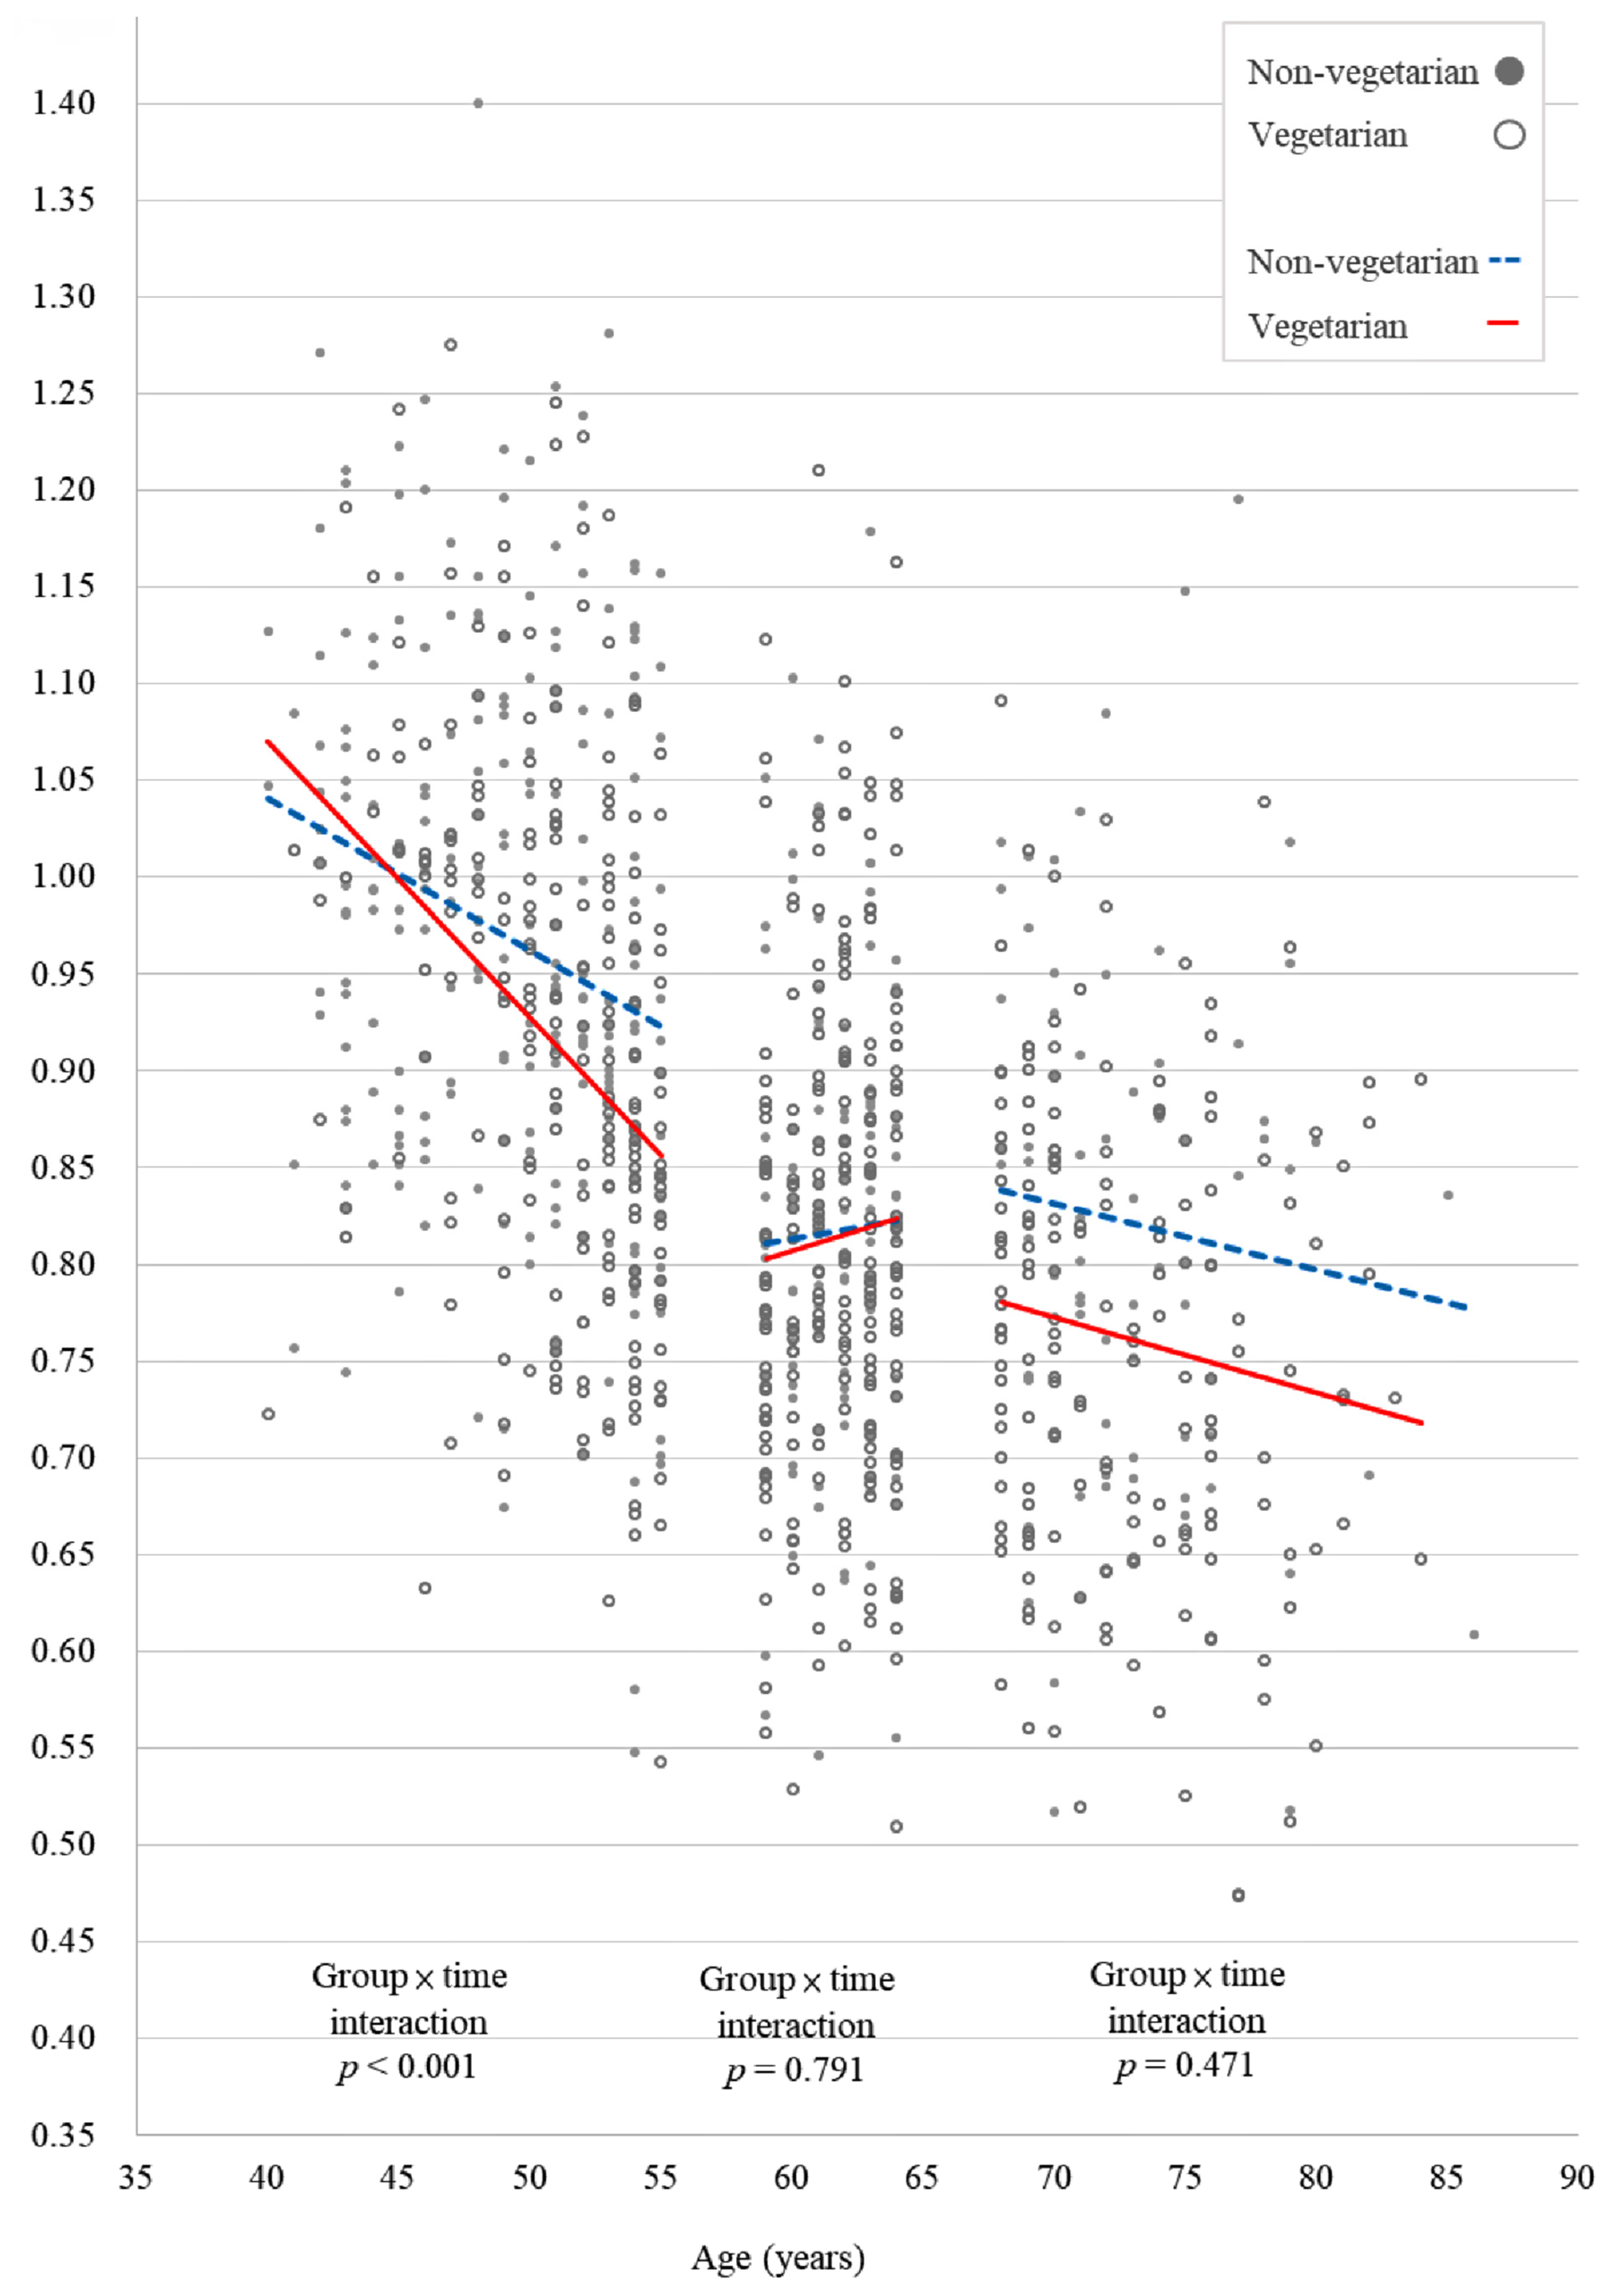
| Lumbar spine BMD (g/cm2) | 0.889 (0.150) | 0.863 (0.150) | <0.001 * | 0.982 (0.130) | 0.943 (0.141) | <0.001 * | 0.834 (0.118) | 0.815 (0.122) | <0.001 * | 0.795 (0.125) | 0.780 (0.128) | <0.001 * |
| Right hip femoral neck BMD (g/cm2) | 0.654 (0.114) | 0.626 (0.113) | <0.001 * | 0.715 (0.109) | 0.681 (0.110) | <0.001 * | 0.628 (0.092) | 0.603 (0.091) | <0.001 * | 0.579 (0.091) | 0.554 (0.092) | <0.001 * |
| Right hip total BMD (g/cm2) | 0.779 (0.124) | 0.795 (0.120) | <0.001 * | 0.831 (0.119) | 0.841 (0.119) | 0.001 * | 0.761 (0.108) | 0.778 (0.104) | <0.001 * | 0.707 (0.112) | 0.733 (0.108) | <0.001 * |
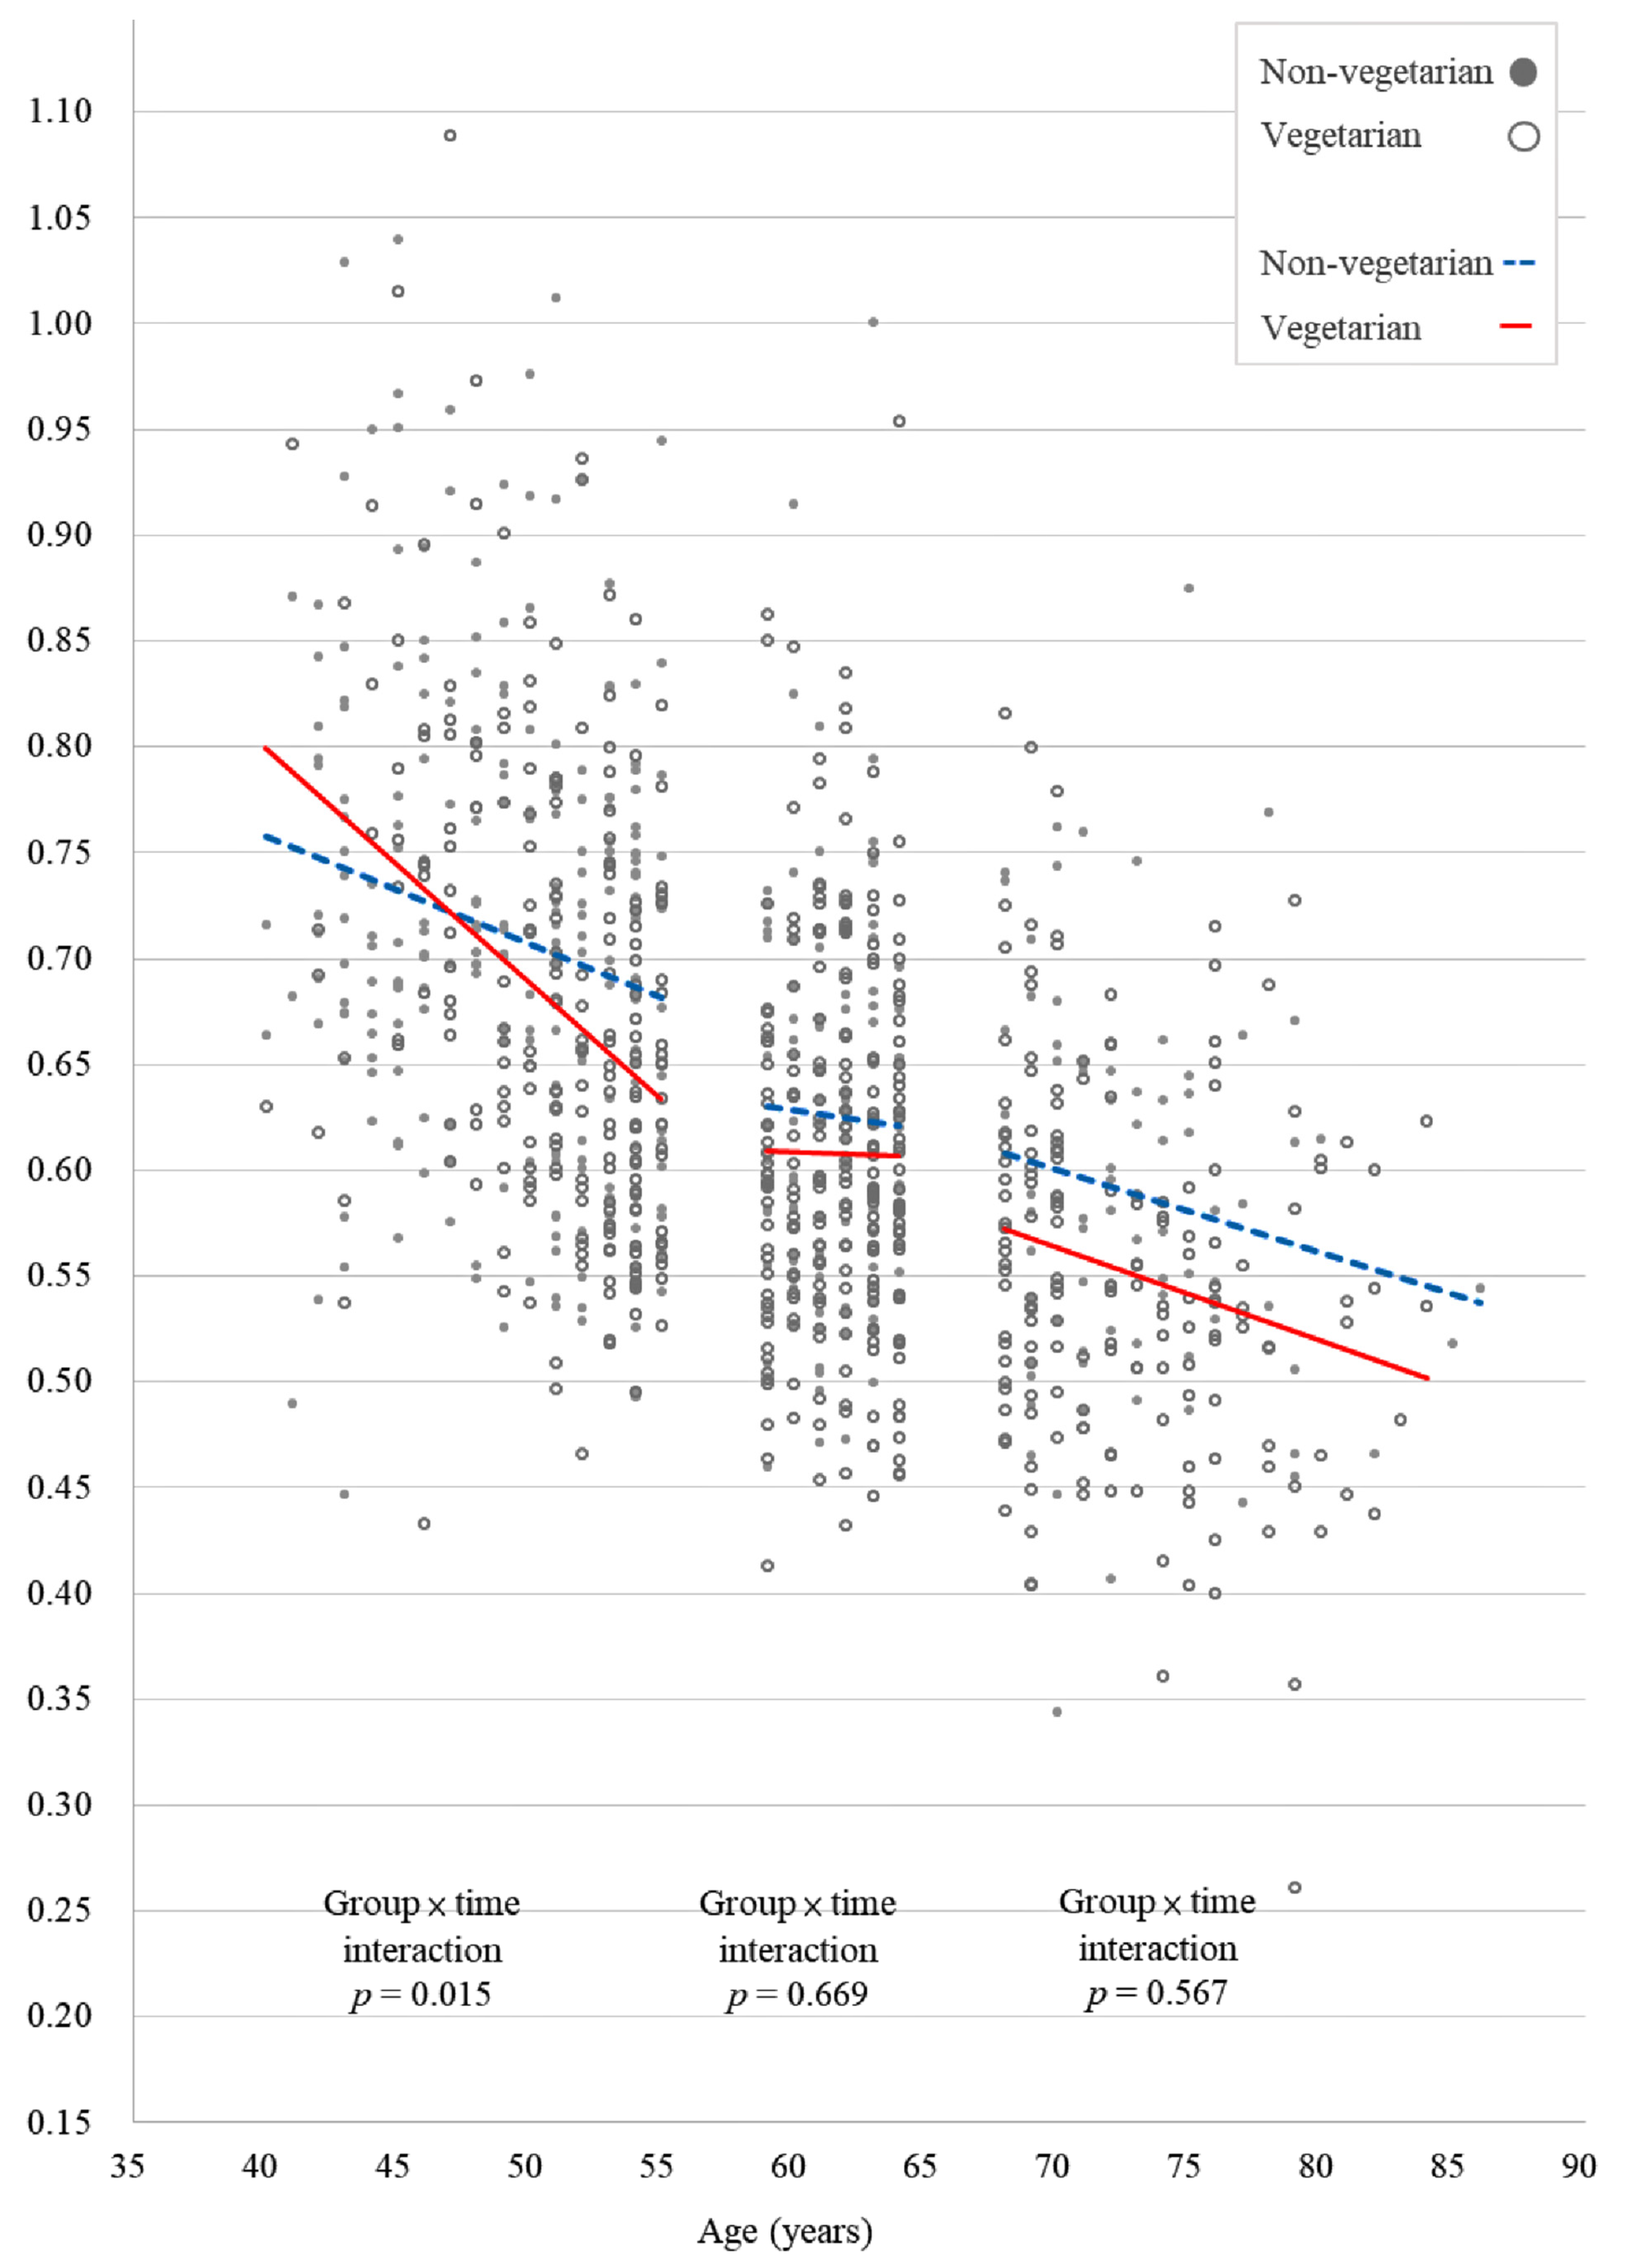
| Left hip neck femoral BMD (g/cm2) | 0.659 (0.115) | 0.637 (0.114) | <0.001 * | 0.721 (0.109) | 0.696 (0.111) | <0.001 * | 0.634 (0.091) | 0.614 (0.089) | <0.001 * | 0.581 (0.091) | 0.563 (0.091) | <0.001 * |
| Left hip total BMD (g/cm2) | 0.777 (0.123) | 0.756 (0.122) | <0.001 * | 0.829 (0.117) | 0.806 (0.118) | <0.001 * | 0.759 (0.106) | 0.737 (0.105) | <0.001 * | 0.705 (0.111) | 0.690 (0.110) | <0.001 * |
| TBS | 1.342 (0.104) | 1.311 (0.107) | <0.001 * | 1.415 (0.084) | 1.379 (0.093) | <0.001 * | 1.304 (0.077) | 1.275 (0.083) | <0.001 * | 1.260 (0.077) | 1.235 (0.082) | <0.001 * |
| Variable | Lumbar Spine BMD | Right Hip Femoral Neck BMD | Right Hip Total BMD | Left Hip Femoral Neck BMD | Left Hip Total BMD | Trabecular Bone Score | ||||||
|---|---|---|---|---|---|---|---|---|---|---|---|---|
| β | p | β | p | β | p | β | p | β | p | β | p | |
| Vegetarian × time | −0.018 | <0.001 * | −0.007 | 0.063 | −0.009 | 0.133 | −0.009 | 0.015 * | −0.010 | 0.099 | −0.002 | 0.705 |
| Vegetarian | −0.005 | 0.489 | −0.003 | 0.520 | −0.008 | 0.248 | −0.010 | 0.051 | −0.004 | 0.629 | 0.003 | 0.611 |
| Time | −0.015 | 0.004 * | −0.018 | <0.001 * | 0.015 | 0.006 * | −0.008 | 0.071 | −0.017 | 0.005 * | −0.017 | <0.001 * |
| Age | −0.008 | <0.001 * | −0.006 | <0.001 * | −0.003 | 0.009 * | −0.006 | <0.001 * | −0.005 | <0.001 * | −0.007 | <0.001 * |
| BMI | 0.010 | <0.001 * | 0.008 | <0.001 * | 0.012 | <0.001 * | 0.008 | <0.001 * | 0.013 | <0.001 * | - | - |
| HDL-C | - | - | - | - | - | - | - | - | 0.005 | 0.034 * | - | - |
| Glucose | - | - | - | - | 0.004 | 0.029 * | 0.004 | 0.034 * | - | - | - | - |
| ALB | - | - | −0.018 | <0.001 * | - | - | −0.017 | <0.001 * | −0.024 | 0.002 * | - | - |
| ALP | −0.008 | <0.001 * | −0.003 | 0.002 * | −0.005 | <0.001 * | −0.003 | 0.001 * | - | - | −0.006 | <0.001 * |
| eGFR | - | - | - | - | - | - | - | - | −0.004 | 0.004 * | - | - |
| TG | 0.001 | 0.012 * | - | - | 0.001 | 0.037 * | - | - | 0.002 | 0.003 * | - | - |
| Variable | Lumbar Spine BMD | Right Hip Femoral Neck BMD | Right Hip Total BMD | Left Hip Femoral Neck BMD | Left Hip Total BMD | Trabecular Bone Score | ||||||
|---|---|---|---|---|---|---|---|---|---|---|---|---|
| β | p | β | p | β | p | β | p | β | p | β | p | |
| Vegetarian × time | −0.002 | 0.791 | 0.001 | 0.766 | −0.003 | 0.724 | −0.002 | 0.669 | 0.010 | 0.169 | 0.003 | 0.743 |
| Vegetarian | −0.004 | 0.524 | 0.003 | 0.496 | 0.004 | 0.648 | −0.002 | 0.670 | −0.007 | 0.380 | −0.002 | 0.815 |
| Time | −0.030 | <0.001 * | −0.033 | <0.001 * | 0.011 | 0.077 | −0.023 | <0.001 * | −0.040 | <0.001 * | −0.037 | <0.001 * |
| BMI | 0.009 | <0.001 * | 0.007 | <0.001 * | 0.012 | <0.001 * | 0.008 | <0.001 * | 0.011 | <0.001 * | - | - |
| SBP | - | - | - | - | - | - | - | - | - | - | −0.004 | 0.005 * |
| ALB | - | - | −0.019 | 0.002 * | - | - | - | - | - | - | - | - |
| ALP | −0.007 | <0.001 * | −0.003 | 0.001 * | −0.003 | 0.036 * | - | - | - | - | −0.005 | <0.001 * |
| eGFR | - | - | - | - | - | - | - | - | −0.001 | <0.001 * | - | - |
| TCH | - | - | - | - | - | - | −0.001 | 0.002 * | - | - | - | - |
| Variable | Lumbar Spine BMD | Right Hip Femoral Neck BMD | Right Hip Total BMD | Left Hip Femoral Neck BMD | Left Hip Total BMD | Trabecular Bone Score | ||||||
|---|---|---|---|---|---|---|---|---|---|---|---|---|
| β | p | β | p | β | p | β | p | β | p | β | p | |
| Vegetarian × time | 0.006 | 0.471 | −0.001 | 0.786 | −0.004 | 0.668 | 0.003 | 0.567 | −0.010 | 0.306 | 0.007 | 0.465 |
| Vegetarian | −0.025 | 0.005 * | −0.008 | 0.132 | −0.005 | 0.610 | −0.010 | 0.085 | 0.002 | 0.860 | −0.013 | 0.154 |
| Time | −0.021 | 0.002 * | −0.014 | 0.008 * | 0.037 | <0.001 * | −0.011 | 0.046 * | −0.00002 | 0.998 | −0.023 | 0.007 * |
| Age | - | - | −0.004 | 0.007 * | −0.004 | 0.011 * | −0.004 | 0.004 * | −0.004 | 0.014 * | −0.002 | 0.031 * |
| BMI | 0.010 | <0.001 * | 0.006 | <0.001 * | 0.013 | <0.001 * | 0.006 | <0.001 * | 0.012 | <0.001 * | - | - |
| SBP | - | - | −0.003 | 0.010 * | - | - | - | - | - | - | - | - |
| ALB | - | - | −0.017 | 0.012 * | - | - | - | - | −0.022 | 0.047 * | - | - |
| Age Group (Years) | Mean of p Value of the Vegetarian × Time interaction term (95% Confidence Interval) | ||||||||
|---|---|---|---|---|---|---|---|---|---|
| Original Data | 10% Misclassification inVegetarian Status | 20% Misclassification in Vegetarian Status | |||||||
| Lumbar Spine BMD | Left Hip Femoral Neck BMD | Trabecular Bone Score | Lumbar Spine BMD | Left Hip Femoral Neck BMD | Trabecular Bone Score | Lumbar Spine BMD | Left Hip Femoral Neck BMD | Trabecular Bone Score | |
| 40–55 | <0.001 * | 0.015 * | 0.705 | 0.001 (0.001, 0.002) | 0.032 (0.030, 0.034) | 0.699 (0.687, 0.710) | 0.005 (0.004, 0.006) | 0.061 (0.056, 0.066) | 0.667 (0.654, 0.681) |
| 56–64 | 0.791 | 0.669 | 0.743 | 0.711 (0.699, 0.723) | 0.331 (0.319, 0.343) | 0.726 (0.714, 0.738) | 0.650 (0.635, 0.664) | 0.386 (0.370, 0.402) | 0.667 (0.652, 0.681) |
| 65–90 | 0.471 | 0.567 | 0.465 | 0.589 (0.575, 0.604) | 0.693 (0.679, 0.706) | 0.542 (0.527, 0.557) | 0.590 (0.573, 0.606) | 0.637 (0.622, 0.652) | 0.544 (0.528, 0.561) |
Publisher’s Note: MDPI stays neutral with regard to jurisdictional claims in published maps and institutional affiliations. |
© 2022 by the authors. Licensee MDPI, Basel, Switzerland. This article is an open access article distributed under the terms and conditions of the Creative Commons Attribution (CC BY) license (https://creativecommons.org/licenses/by/4.0/).
Share and Cite
Chuang, T.-L.; Koo, M.; Chuang, M.-H.; Lin, C.-H.; Huang, C.-H.; Wang, Y.-F. Changes in Bone Mineral Density and Trabecular Bone Score over Time between Vegetarian and Non-Vegetarian Middle-Aged and Older Women: A Three-Year Retrospective Medical Record Review. Int. J. Environ. Res. Public Health 2022, 19, 2445. https://doi.org/10.3390/ijerph19042445
Chuang T-L, Koo M, Chuang M-H, Lin C-H, Huang C-H, Wang Y-F. Changes in Bone Mineral Density and Trabecular Bone Score over Time between Vegetarian and Non-Vegetarian Middle-Aged and Older Women: A Three-Year Retrospective Medical Record Review. International Journal of Environmental Research and Public Health. 2022; 19(4):2445. https://doi.org/10.3390/ijerph19042445
Chicago/Turabian StyleChuang, Tzyy-Ling, Malcolm Koo, Mei-Hua Chuang, Chun-Hung Lin, Chin-Huan Huang, and Yuh-Feng Wang. 2022. "Changes in Bone Mineral Density and Trabecular Bone Score over Time between Vegetarian and Non-Vegetarian Middle-Aged and Older Women: A Three-Year Retrospective Medical Record Review" International Journal of Environmental Research and Public Health 19, no. 4: 2445. https://doi.org/10.3390/ijerph19042445
APA StyleChuang, T.-L., Koo, M., Chuang, M.-H., Lin, C.-H., Huang, C.-H., & Wang, Y.-F. (2022). Changes in Bone Mineral Density and Trabecular Bone Score over Time between Vegetarian and Non-Vegetarian Middle-Aged and Older Women: A Three-Year Retrospective Medical Record Review. International Journal of Environmental Research and Public Health, 19(4), 2445. https://doi.org/10.3390/ijerph19042445