
The Cost-Effectiveness Analysis of the Productivity Measurement and Enhancement System Intervention to Reduce Employee Work-Related Stress and Enhance Work Performance


Abstract
:1. Introduction
2. Materials and Methods
2.1. Study Design
2.2. Study Participants
2.3. Measures
2.3.1. Objective Organizational Measures of Quantitative Workload
2.3.2. Stress
2.3.3. Costs of the ProMes Intervention
2.4. Statistical Analysis
3. Results
Cost-Effectiveness
4. Discussion
Strengths and Limitations
5. Conclusions
Author Contributions
Funding
Institutional Review Board Statement
Informed Consent Statement
Data Availability Statement
Acknowledgments
Conflicts of Interest
Appendix A
Appendix B

| Effect Size (t-test) | 95% CI | Average Cost (EUR) | Minimum (ACER) | Maximum (ACER) | |
|---|---|---|---|---|---|
| Tasks/Time | 0.569 | (−0.489; 1.610) | 1742 | 3563 | 1082 |
| Time/Visits | −1.884 | (−3.101; −0.623) | 1742 | 562 | 2797 |
| Time/Admin | −0.560 | (−1.613; 0.511) | 1742 | 1080 | 3409 |
| Time/Phone | 0.304 | (−0.750; 1.348) | 1742 | 2323 | 1293 |
| Stress (mean) | −0.425 | (−1.472; 0.636) | 1742 | 1184 | 2739 |
References
- Cox, T.; Griffiths, A.J.; Rial-Gonzalez, E. Research on Work-Related Stress, European Agency for Safety and Health at Work; Office for Official Publications of the European Communities: Luxembourg, 2000; Available online: http://agency.osha.eu.int/publications/reports/stress (accessed on 2 February 2020).
- Dewa, C.S.; Loong, D.; Bonato, S.; Hees, H. Incidence rates of sickness absence related to mental disorders: A systematic literature review. BMC Public Health 2014, 14, 205. [Google Scholar] [CrossRef] [PubMed] [Green Version]
- EU-OSHA. OSH in Figures: Stress at Work—Facts and Figures; European Agency for Safety and Health at Work—European Communities: Luxembourg, 2009; Available online: http://osha.europa.eu/en/publications/reports/TE-81-08-478-ENCOSH_in_figures_stress_at_work/view (accessed on 10 October 2014).
- Försäkringskassan. Socialförsäkringen i Siffror 2021; Swedish Social Insurance Agency (Försäkringskassan): Stockholm, Sweden, 2021; Available online: https://www.forsakringskassan.se/wps/wcm/connect/e64c34f8-0a59-4382-bdf0-9adabb7a0609/socialforsakringen-i-siffror-2021.pdf?MOD=AJPERES&CVID=: (accessed on 4 January 2021).
- Försäkringskassan. Sjukfrånvaro i Psykiatriska Diagnoser. en Registerstudie av Sveriges Arbetande Befolkning i Åldern 20–69 år; Försäkringskassan: Stockholm, Sweden, 2020. [Google Scholar]
- EU-OSHA. European Survey of Enterprises on New and Emerging Risks: Managing Safety and Health at Work, European Communities; European Agency for Safety and Health at Work: Luxembourg, 2010; Available online: https://osha.europa.eu/en/publications/reports/esener1_osh_management (accessed on 14 January 2020).
- EU-OSHA. Campaign Guide—Managing Stress and Psychosocial Risks at Work; European Agency for Safety and Health at Work—European Communities: Luxembourg, 2014; Available online: https://www.healthy-workplaces.eu/en/campaign-material/introducing-the-campaign-guide (accessed on 9 August 2021).
- Mather, L.; Blom, V.; Bergstrom, G.; Svedberg, P. Adverse outcomes of sick leave due to mental disorders: A prospective study of discordant twin pairs. Scand. J. Public Health 2017, 1403494817735755. [Google Scholar] [CrossRef] [Green Version]
- Van den Broek, K.; Hassard, J.; Flemming, D.; Gründler, R.; Dewe, P.; Teoh, K.; Cosemans, B.; Cosmar, M.; Cox, T. Calculating the Cost of Work-Related Stress and Psychosocial Risks; European Agency for Safety and Health at Work—Publications Office: Luxembourg, 2015. [Google Scholar]
- Lenneman, J.; Schwartz, S.; Giuseffi, D.L.; Wang, C. Productivity and health: An application of three perspectives to measuring productivity. J. Occup. Environ. Med./Am. Coll. Occup. Environ. Med. 2011, 53, 55–61. [Google Scholar] [CrossRef] [PubMed]
- Schwartz, S.M.; Riedel, J. Productivity and health: Best practices for better measures of productivity. J. Occup. Environ. Med./Am. Coll. Occup. Environ. Med. 2010, 52, 865–871. [Google Scholar] [CrossRef]
- Matrix. Economic Analysis of Workplace Mental Health Promotion and Mental Disorder Prevention Programmes and of Their Potential Contribution to EU Health, Social and Economic Policy Objectives; Executive Agency for Health and Consumers: Luxembourg, 2013. [Google Scholar]
- Hassard, J.; Teoh, K.R.H.; Visockaite, G.; Dewe, P.; Cox, T. The cost of work-related stress to society: A systematic review. J. Occup. Health Psychol. 2018, 23, 1–17. [Google Scholar] [CrossRef] [PubMed] [Green Version]
- Bergstrom, G.; Lohela-Karlsson, M.; Kwak, L.; Bodin, L.; Jensen, I.; Torgen, M.; Nybergh, L. Preventing sickness absenteeism among employees with common mental disorders or stress-related symptoms at work: Design of a cluster randomized controlled trial of a problem-solving based intervention versus care-as-usual conducted at the Occupational Health Services. BMC Public Health 2017, 17, 436. [Google Scholar] [CrossRef] [Green Version]
- Keus Van De Poll, M.; Bergstrom, G.; Jensen, I.; Nybergh, L.; Kwak, L.; Lornudd, C.; Lohela-Karlsson, M. Cost-Effectiveness of a Problem-Solving Intervention Aimed to Prevent Sickness Absence among Employees with Common Mental Disorders or Occupational Stress. Int. J. Environ. Res. Public Health 2020, 17, 5234. [Google Scholar] [CrossRef]
- Axen, I.; Bjork Bramberg, E.; Vaez, M.; Lundin, A.; Bergstrom, G. Interventions for common mental disorders in the occupational health service: A systematic review with a narrative synthesis. Int. Arch. Occup. Environ. Health 2020, 93, 823–838. [Google Scholar] [CrossRef] [Green Version]
- Goorden, M.; Vlasveld, M.C.; Anema, J.R.; van Mechelen, W.; Beekman, A.T.; Hoedeman, R.; van der Feltz-Cornelis, C.M.; Hakkaart-van Roijen, L. Cost-utility analysis of a collaborative care intervention for major depressive disorder in an occupational healthcare setting. J. Occup. Rehabil. 2014, 24, 555–562. [Google Scholar] [CrossRef] [Green Version]
- Rebergen, D.S.; Bruinvels, D.J.; van Tulder, M.W.; van der Beek, A.J.; van Mechelen, W. Cost-effectiveness of guideline-based care for workers with mental health problems. J. Occup. Environ. Med./Am. Coll. Occup. Environ. Med. 2009, 51, 313–322. [Google Scholar] [CrossRef]
- Uegaki, K.; Bakker, I.; de Bruijne, M.; van der Beek, A.; Terluin, B.; van Marwijk, H.; Heymans, M.; Stalman, W.; van Mechelen, W. Cost-effectiveness of a minimal intervention for stress-related sick leave in general practice: Results of an economic evaluation alongside a pragmatic randomised control trial. J. Affect. Disord. 2010, 120, 177–187. [Google Scholar] [CrossRef] [PubMed]
- van Oostrom, S.H.; Heymans, M.W.; de Vet, H.C.; van Tulder, M.W.; van Mechelen, W.; Anema, J.R. Economic evaluation of a workplace intervention for sick-listed employees with distress. Occup. Environ. Med. 2010, 67, 603–610. [Google Scholar] [CrossRef]
- Nielsen, K.; Noblet, A. Organizational Interventions for Health and Well-Being: A Handbook for Evidence-Based Practice; Routledge: London, UK, 2018. [Google Scholar]
- Daniels, K.; Gedikli, C.; Watson, D.; Semkina, A.; Vaughn, O. Job design, employment practices and well-being: A systematic review of intervention studies. Ergonomics 2017, 60, 1177–1196. [Google Scholar] [CrossRef] [PubMed] [Green Version]
- Pritchard, R.D.; Harrell, M.M.; DiazGranados, D.; Guzman, M.J. The productivity measurement and enhancement system: A meta-analysis. J. Appl. Psychol. 2008, 93, 540–567. [Google Scholar] [CrossRef] [PubMed]
- Arapovic-Johansson, B.; Wåhlin, C.; Hagberg, J.; Kwak, L.; Björklund, C.; Jensen, I. Participatory workplace intervention for stress prevention in primary health care. A randomized controlled trial. Eur. J. Work. Organ. Psychol. 2018, 27, 219–234. [Google Scholar] [CrossRef]
- Pritchard, R.D.; Paquin, A.R.; DeCuir, A.D.; McCormick, M.J.; Bly, P.R. Measuring and improving organizational productivity: An overview of ProMES, The Productivity Measurement and Enhancement System. In Improving Organizational Performance with the Productivity Measurement and Enhancement System: An International Collaboration; Pritchard, R.D., Holling, H., Lammers, F., Clark, B.D., Eds.; Nova Science: Huntington, NY, USA, 2002; pp. 3–50. [Google Scholar]
- Gaillard, A.; Sultan-Taïeb, H.; Sylvain, C.; Durand, M.-J. Economic evaluations of mental health interventions: A systematic review of interventions with work-focused components. Saf. Sci. 2020, 132, 104982. [Google Scholar] [CrossRef]
- Dhaini, S.; Zuniga, F.; Ausserhofer, D.; Simon, M.; Kunz, R.; De Geest, S.; Schwendimann, R. Absenteeism and Presenteeism among Care Workers in Swiss Nursing Homes and Their Association with Psychosocial Work Environment: A Multi-Site Cross-Sectional Study. Gerontology 2016, 62, 386–395. [Google Scholar] [CrossRef] [PubMed] [Green Version]
- Gustafsson, K.; Marklund, S.; Leineweber, C.; Bergstrom, G.; Aboagye, E.; Helgesson, M. Presenteeism, Psychosocial Working Conditions and Work Ability among Care Workers-A Cross-Sectional Swedish Population-Based Study. Int. J. Environ. Res. Public Health 2020, 17, 2419. [Google Scholar] [CrossRef] [Green Version]
- Higgins, J.P.T.; Thomas, J.; Chandler, J.; Cumpston, M.; Li, T.; Page, M.J.; Welch, V.A. Cochrane Handbook for Systematic Reviews of Interventions; John Wiley & Sons: Hoboken, NJ, USA, 2019. [Google Scholar]
- Arapovic-Johansson, B.; Jensen, I.; Wahlin, C.; Bjorklund, C.; Kwak, L. Process Evaluation of a Participative Organizational Intervention as a Stress Preventive Intervention for Employees in Swedish Primary Health Care. Int. J. Environ. Res. Public Health 2020, 17, 7285. [Google Scholar] [CrossRef]
- SMS-Track. SMS-Track Questionnaire 1.1.3. Available online: https://www.sms-track.com/ (accessed on 1 October 2013).
- SCB. Yrken i Sverige. Available online: https://www.scb.se/hitta-statistik/sverige-i-siffror/utbildning-jobb-och-pengar/yrken-i-sverige/ (accessed on 14 September 2021).
- The Swedish National Board of Health and Welfare. Handbok för Utveckling av Effektivitetsindikatorer; The National Board of Health and Welfare: Stockholm, Sweden, 2016. [Google Scholar]
- Dallner, M.; Elo, A.-L.; Gamberale, F.; Hottinen, V.; Knardahl, S.; Lindström, K.; Skogstad, A.; Oerhede, E. Validation of the General Nordic Questionnaire (QPSNordic) for Psychological and Social Factors at Work; Nordic Council of Ministers: Copenhagen, Denmark, 2000. [Google Scholar]
- Elo, A.L.; Leppanen, A.; Jahkola, A. Validity of a single-item measure of stress symptoms. Scand. J. Work. Environ. Health 2003, 29, 444–451. [Google Scholar] [CrossRef] [Green Version]
- Arapovic-Johansson, B.; Wahlin, C.; Kwak, L.; Bjorklund, C.; Jensen, I. Work-related stress assessed by a text message single-item stress question. Occup. Med. 2017, 67, 601–608. [Google Scholar] [CrossRef] [PubMed] [Green Version]
- Tompa, E.; Verbeek, J.; van Tulder, M.; de Boer, A. Developing guidelines for good practice in the economic evaluation of occupational safety and health interventions. Scand. J. Work. Environ. Health 2010, 36, 313–318. [Google Scholar] [CrossRef] [PubMed]
- Ramsay, C.R.; Matowe, L.; Grilli, R.; Grimshaw, J.M.; Thomas, R.E. Interrupted time series designs in health technology assessment: Lessons from two systematic reviews of behavior change strategies. Int. J. Technol. Assess. Health Care 2003, 19, 613–623. [Google Scholar] [CrossRef] [PubMed] [Green Version]
- Cohen, R.; Swerdlik, M.; Philips, S. Psychological Testing and Assessment: An Introduction to Tests and Measurements; Mayfield Publishing Company: Mountain View, CA, USA, 2013. [Google Scholar]
- Harris, D.N. Toward policy-relevant benchmarks for interpreting effect sizes: Combining effects with costs. Educ. Eval. Policy Anal. 2009, 31, 3–29. [Google Scholar] [CrossRef] [Green Version]
- Donker, T.; Blankers, M.; Hedman, E.; Ljotsson, B.; Petrie, K.; Christensen, H. Economic evaluations of Internet interventions for mental health: A systematic review. Psychol. Med. 2015, 45, 3357–3376. [Google Scholar] [CrossRef]
- Lamontagne, A.D.; Keegel, T.; Louie, A.M.; Ostry, A.; Landsbergis, P.A. A systematic review of the job-stress intervention evaluation literature, 1990–2005. Int. J. Occup. Environ. Health 2007, 13, 268–280. [Google Scholar] [CrossRef] [PubMed]
- Hamberg-van Reenen, H.H.; Proper, K.I.; van den Berg, M. Worksite mental health interventions: A systematic review of economic evaluations. Occup. Environ. Med. 2012, 69, 837–845. [Google Scholar] [CrossRef] [Green Version]
- Chi, Y.L.; Blecher, M.; Chalkidou, K.; Culyer, A.; Claxton, K.; Edoka, I.; Glassman, A.; Kreif, N.; Jones, I.; Mirelman, A.J.; et al. What next after GDP-based cost-effectiveness thresholds? Gates Open Res. 2020, 4, 176. [Google Scholar] [CrossRef]
- Kazibwe, J.; Gheorghe, A.; Wilson, D.; Ruiz, F.; Chalkidou, K.; Chi, Y.L. The Use of Cost-Effectiveness Thresholds for Evaluating Health Interventions in Low- and Middle-Income Countries From 2015 to 2020: A Review. Value Health, 2021; in press. [Google Scholar] [CrossRef]
- Dopp, A.R.; Hanson, R.F.; Saunders, B.E.; Dismuke, C.E.; Moreland, A.D. Community-based implementation of trauma-focused interventions for youth: Economic impact of the learning collaborative model. Psychol. Serv. 2017, 14, 57–65. [Google Scholar] [CrossRef]
- van Dongen, J.M.; van Wier, M.F.; Tompa, E.; Bongers, P.M.; van der Beek, A.J.; van Tulder, M.W.; Bosmans, J.E. Trial-based economic evaluations in occupational health: Principles, methods, and recommendations. J. Occup. Environ. Med./Am. Coll. Occup. Environ. Med. 2014, 56, 563–572. [Google Scholar] [CrossRef] [PubMed] [Green Version]
- Hudson, J.; Fielding, S.; Ramsay, C.R. Methodology and reporting characteristics of studies using interrupted time series design in healthcare. BMC Med. Res. Methodol. 2019, 19, 137. [Google Scholar] [CrossRef] [PubMed] [Green Version]
- Teoh, K.R.H.; Hassard, J.; Cox, T. Doctors’ working conditions, wellbeing, and hospital quality of care: A multilevel analysis. Saf. Sci. 2020, 135, 105–115. [Google Scholar] [CrossRef]
- Cheng, H.; Yang, H.; Ding, Y.; Wang, B. Nurses’ mental health and patient safety: An extension of the job demands-resources model. J. Nurs. Manag. 2020, 28, 653–663. [Google Scholar] [CrossRef] [PubMed]
- Giusino, D.; De Angelis, M.; Mazzetti, G.; Christensen, M.; Innstrand, S.T.; Faiulo, I.R.; Chiesa, R. “We All Held Our Own”: Job Demands and Resources at Individual, Leader, Group, and Organizational Levels During COVID-19 Outbreak in Health Care. A Multi-Source Qualitative Study. Workplace Health Saf. 2022, 70, 6–16. [Google Scholar] [CrossRef]
- Lakens, D. Calculating and reporting effect sizes to facilitate cumulative science: A practical primer for t-tests and ANOVAs. Front. Psychol. 2013, 4, 863. [Google Scholar] [CrossRef] [Green Version]
- Bang, H.; Zhao, H. Average cost-effectiveness ratio with censored data. J. Biopharm. Stat. 2012, 22, 401–415. [Google Scholar] [CrossRef] [Green Version]
| Variable | Description | |
|---|---|---|
| Sex, n (%) | Female | 42 (86) |
| Male | 7 (14) | |
| Age, years, mean (SD) | Mean age | 44.4 (12.2) |
| Working hours, mean (SD) | Weekly working hours | 37.3 (5.8) |
| Formal ed. level, n (%) | Secondary school | 9 (18) |
| University education | 39 (80) | |
| Higher academic ed. | 1 (2) | |
| Profession, n (%) | Nurse | 13 (27) |
| Physiotherapist | 7 (14.5) | |
| Physician | 10 (20.5) | |
| Medical secretary | 6 (12) | |
| Midwife | 4 (8) | |
| Laboratory technician | 3 (6) | |
| Assistant nurse | 3 (6) | |
| Counselor | 2 (4) | |
| Manager/Assist. Man. | 1 (2) |
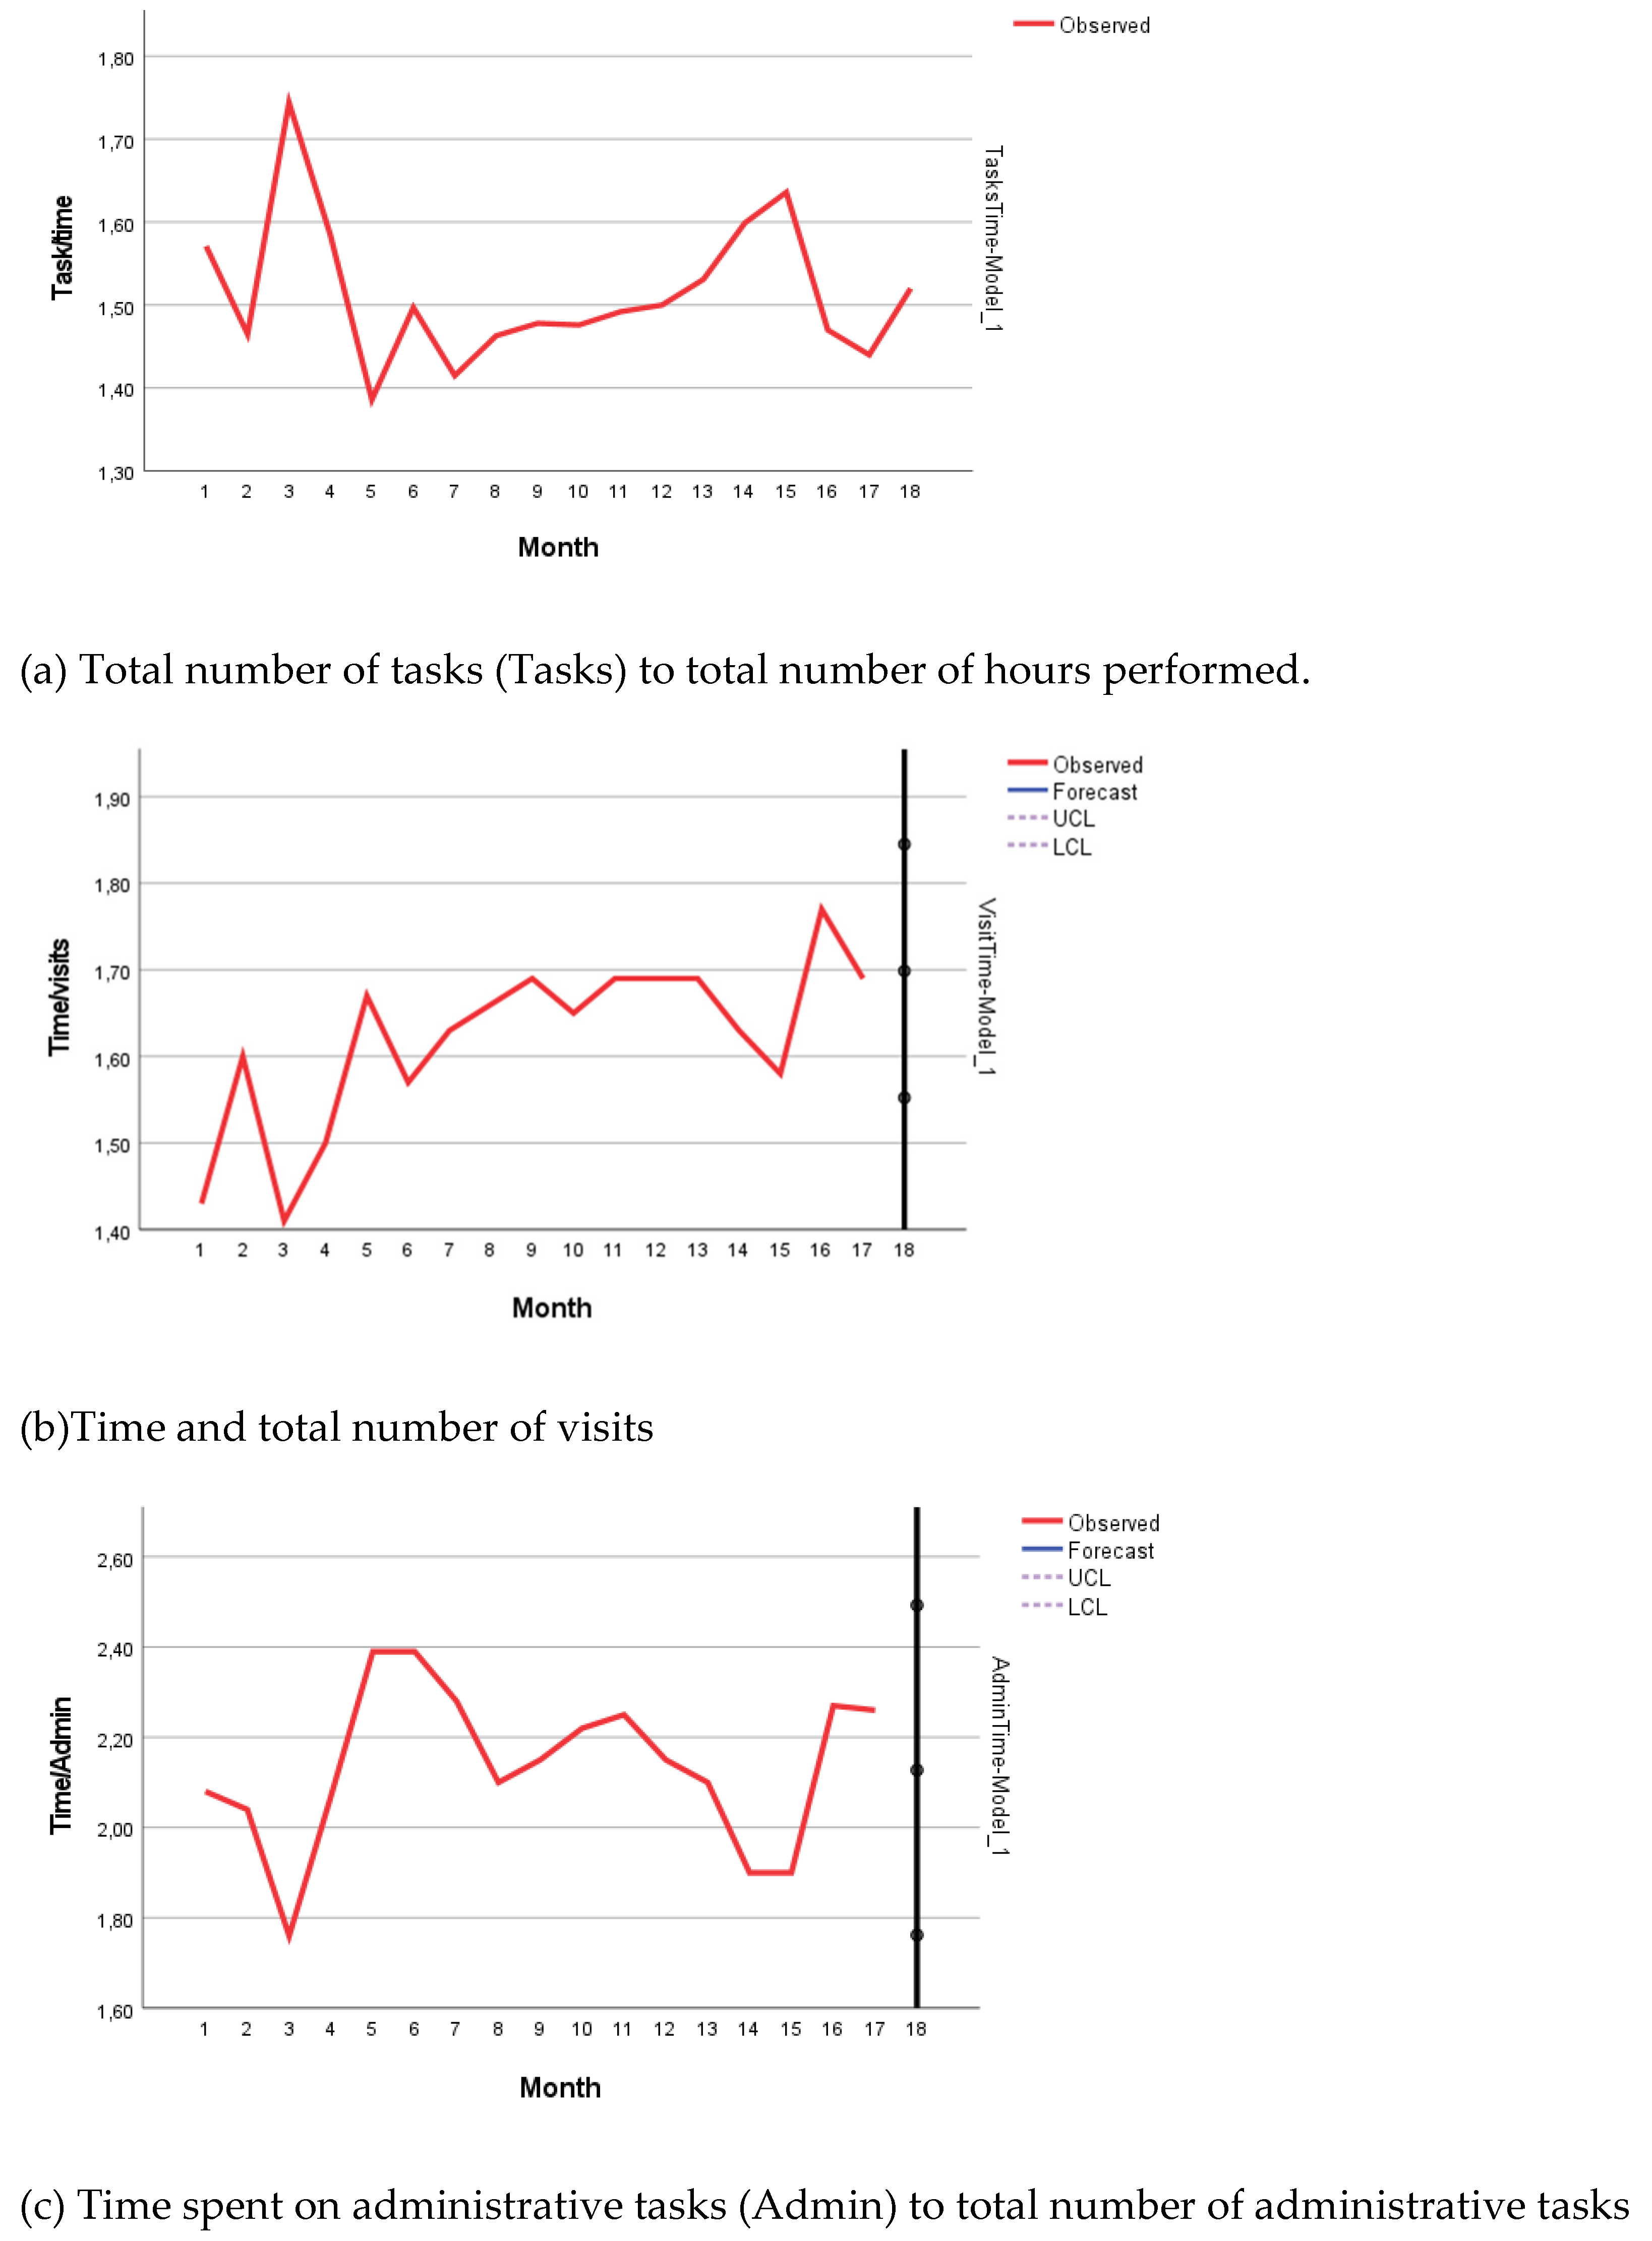
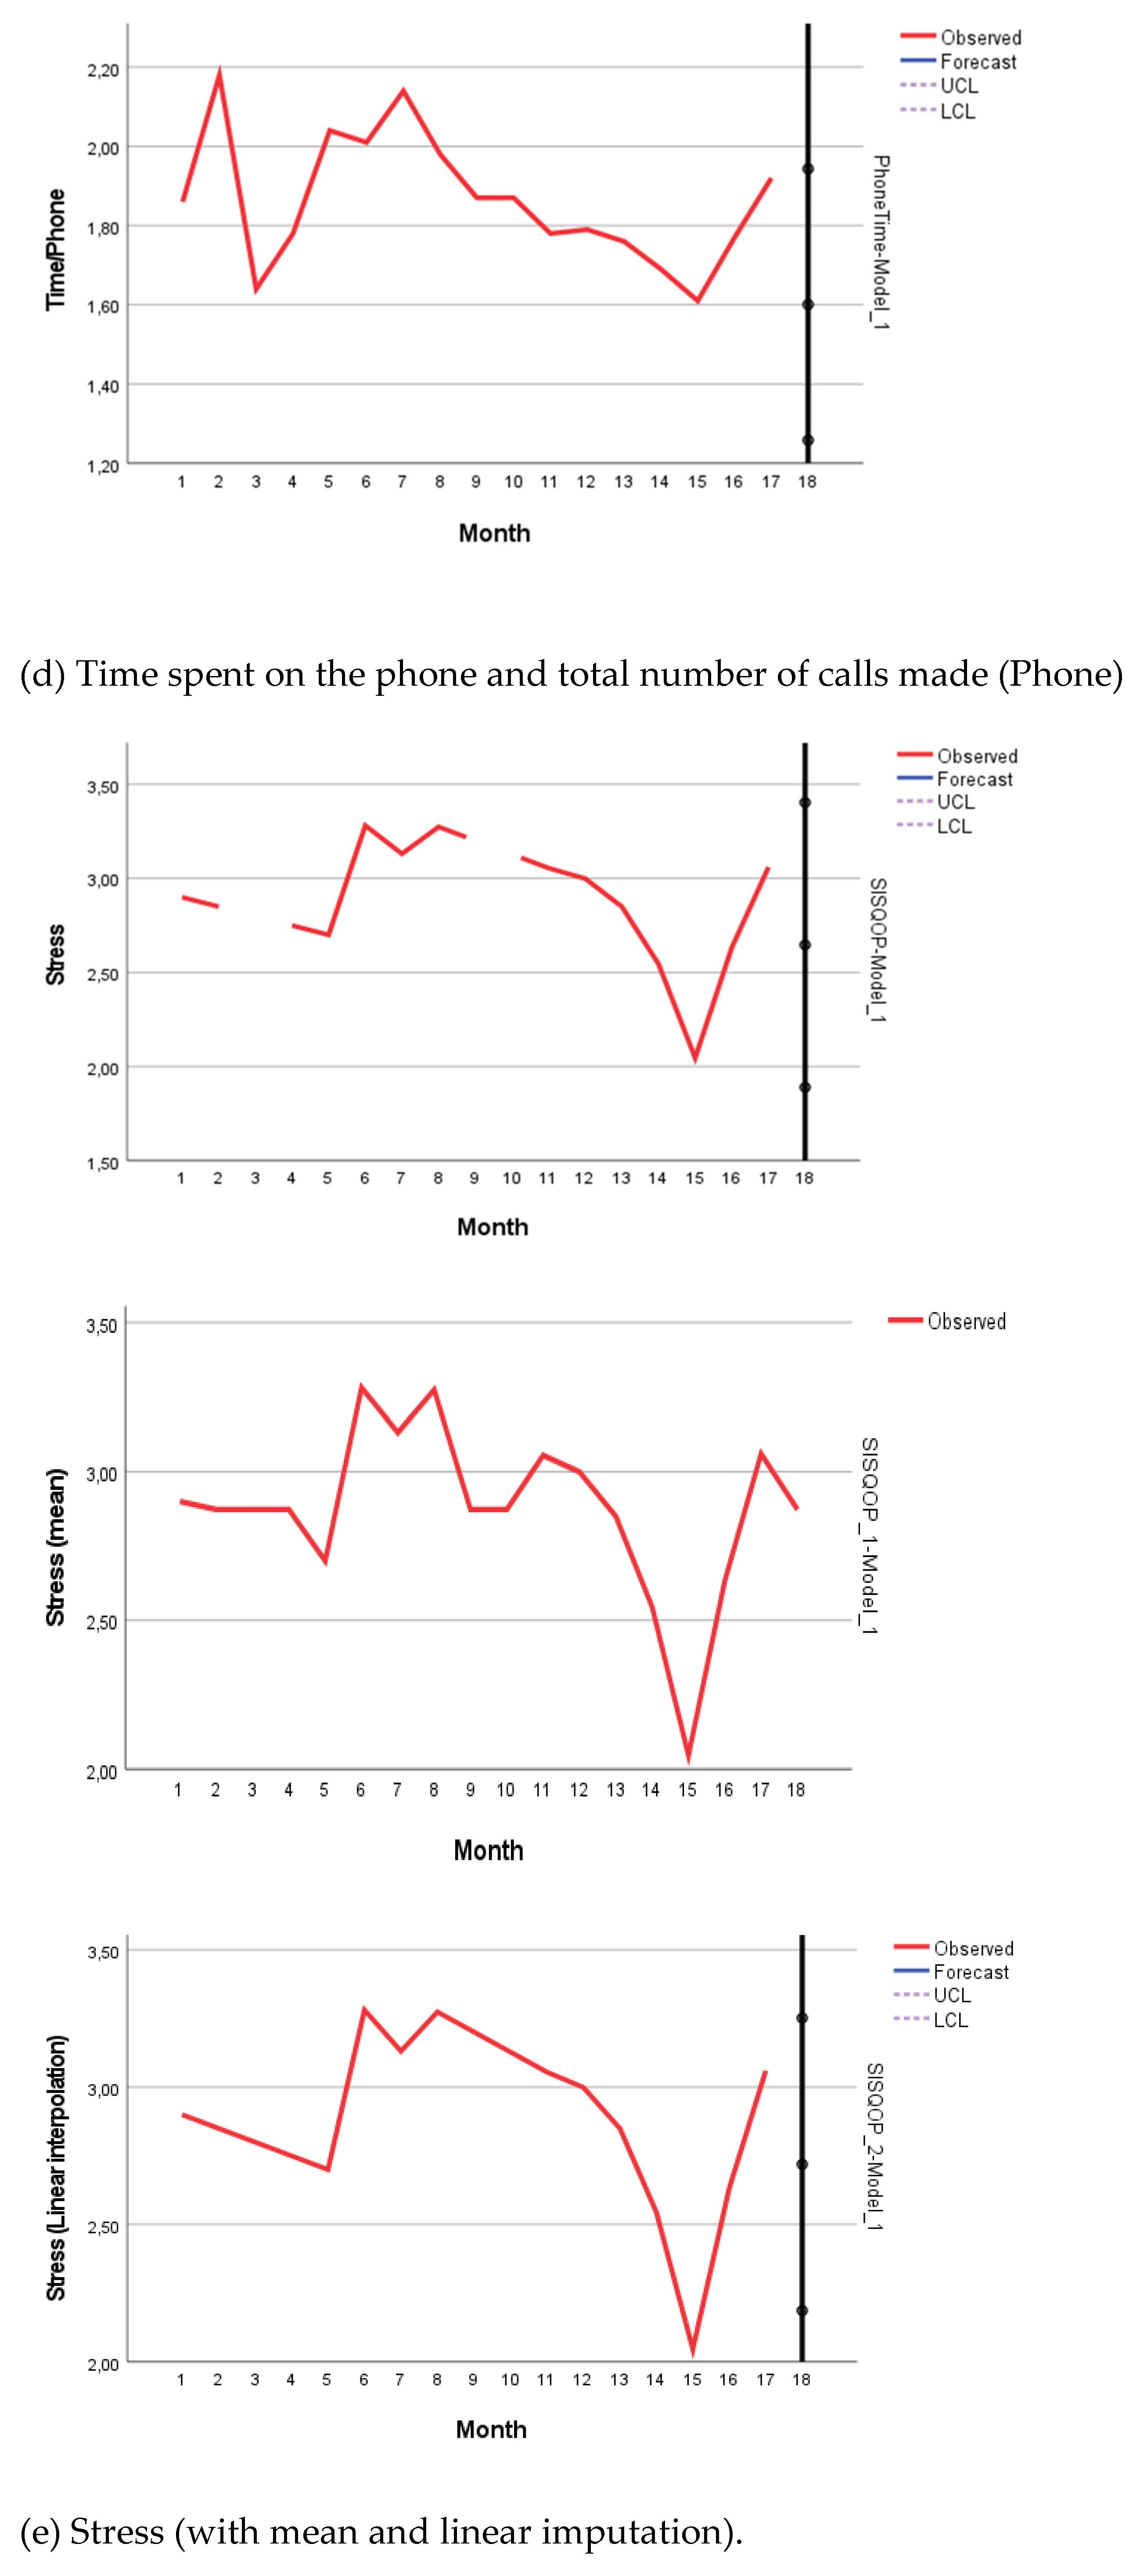
| Year/Month ¹ | Tasks/Time 2 | Time/Visits 3 | Time/Admin 3 | Time/Phone 3 | Stress 4 (Mean/Month) |
|---|---|---|---|---|---|
| 1305 | 1.57 | 1.43 | 2.08 | 1.86 | 2.9 |
| 1306 | 1.47 | 1.60 | 2.04 | 2.18 | 2.85 |
| 1307 | 1.74 | 1.41 | 1.76 | 1.64 | 2.8 |
| 1308 | 1.58 | 1.50 | 2.07 | 1.78 | 2.75 |
| 1309 | 1.39 | 1.67 | 2.39 | 2.04 | 2.7 |
| 1310 | 1.50 | 1.57 | 2.39 | 2.01 | 3.26 |
| 1311 | 1.41 | 1.63 | 2.28 | 2.14 | 3.21 |
| 1312 | 1.46 | 1.66 | 2.10 | 1.98 | 3.13 |
| 1401 | 1.48 | 1.69 | 2.15 | 1.87 | 3.11 |
| 1402 | 1.48 | 1.65 | 2.22 | 1.87 | 3.03 |
| 1403 | 1.49 | 1.69 | 2.25 | 1.78 | 2.96 |
| 1404 | 1.50 | 1.69 | 2.15 | 1.79 | 2.92 |
| 1405 | 1.53 | 1.69 | 2.10 | 1.76 | 2.86 |
| 1406 | 1.60 | 1.63 | 1.90 | 1.69 | 2.78 |
| 1407 | 1.64 | 1.58 | 1.90 | 1.61 | 2.67 |
| 1408 | 1.47 | 1.77 | 2.27 | 1.77 | 2.51 |
| 1409 | 1.44 | 1.69 | 2.26 | 1.92 | 2.59 |
| Cost Description | Total Cost (EUR) | Unit Cost (EUR) |
|---|---|---|
| Personnel time associated with intervention delivery (facilitators) | 39,998 | 816 |
| Preparation and planning of the intervention | 3016 | 62 |
| Training of staff, Kick-off | 8623 | 176 |
| Documentation of assessments | 7667 | 156 |
| Staff meetings concerning the intervention | 839 | 17 |
| Travel time, other supplies, and equipment | 9541 | 195 |
| Personnel cost of developing and implementing intervention | 9631 | 197 |
| Other miscellaneous staff-related time use | 6065 | 124 |
| Total | 85,380 | 1742 |
| Outcomes | Mean (Before) | Mean (After) | Mean Difference | 95% CI | Effect Size | 95% CI |
|---|---|---|---|---|---|---|
| Tasks/Time | 1.550 | 1.501 | 0.049 | (−0.047; 0.144) | 0.569 | (−0.489; 1.610) |
| Time/Visits | 1.522 | 1.662 | −0.141 | (−0.224; −0.055) | −1.884 | (−3.101; −0.623) |
| Time/Admin | 2.068 | 2.164 | −0.096 | (−0.291; 0.099) | −0.560 | (−1.613; 0.511) |
| Time/Phone | 1.90 | 1.849 | 0.051 | (−0.139; 0.241) | 0.304 | (−0.750; 1.348) |
| Stress 1 | 2.80 | 2.934 | −0.134 | (−0.490; 0.222) | −0.425 | (−1.472; 0.636) |
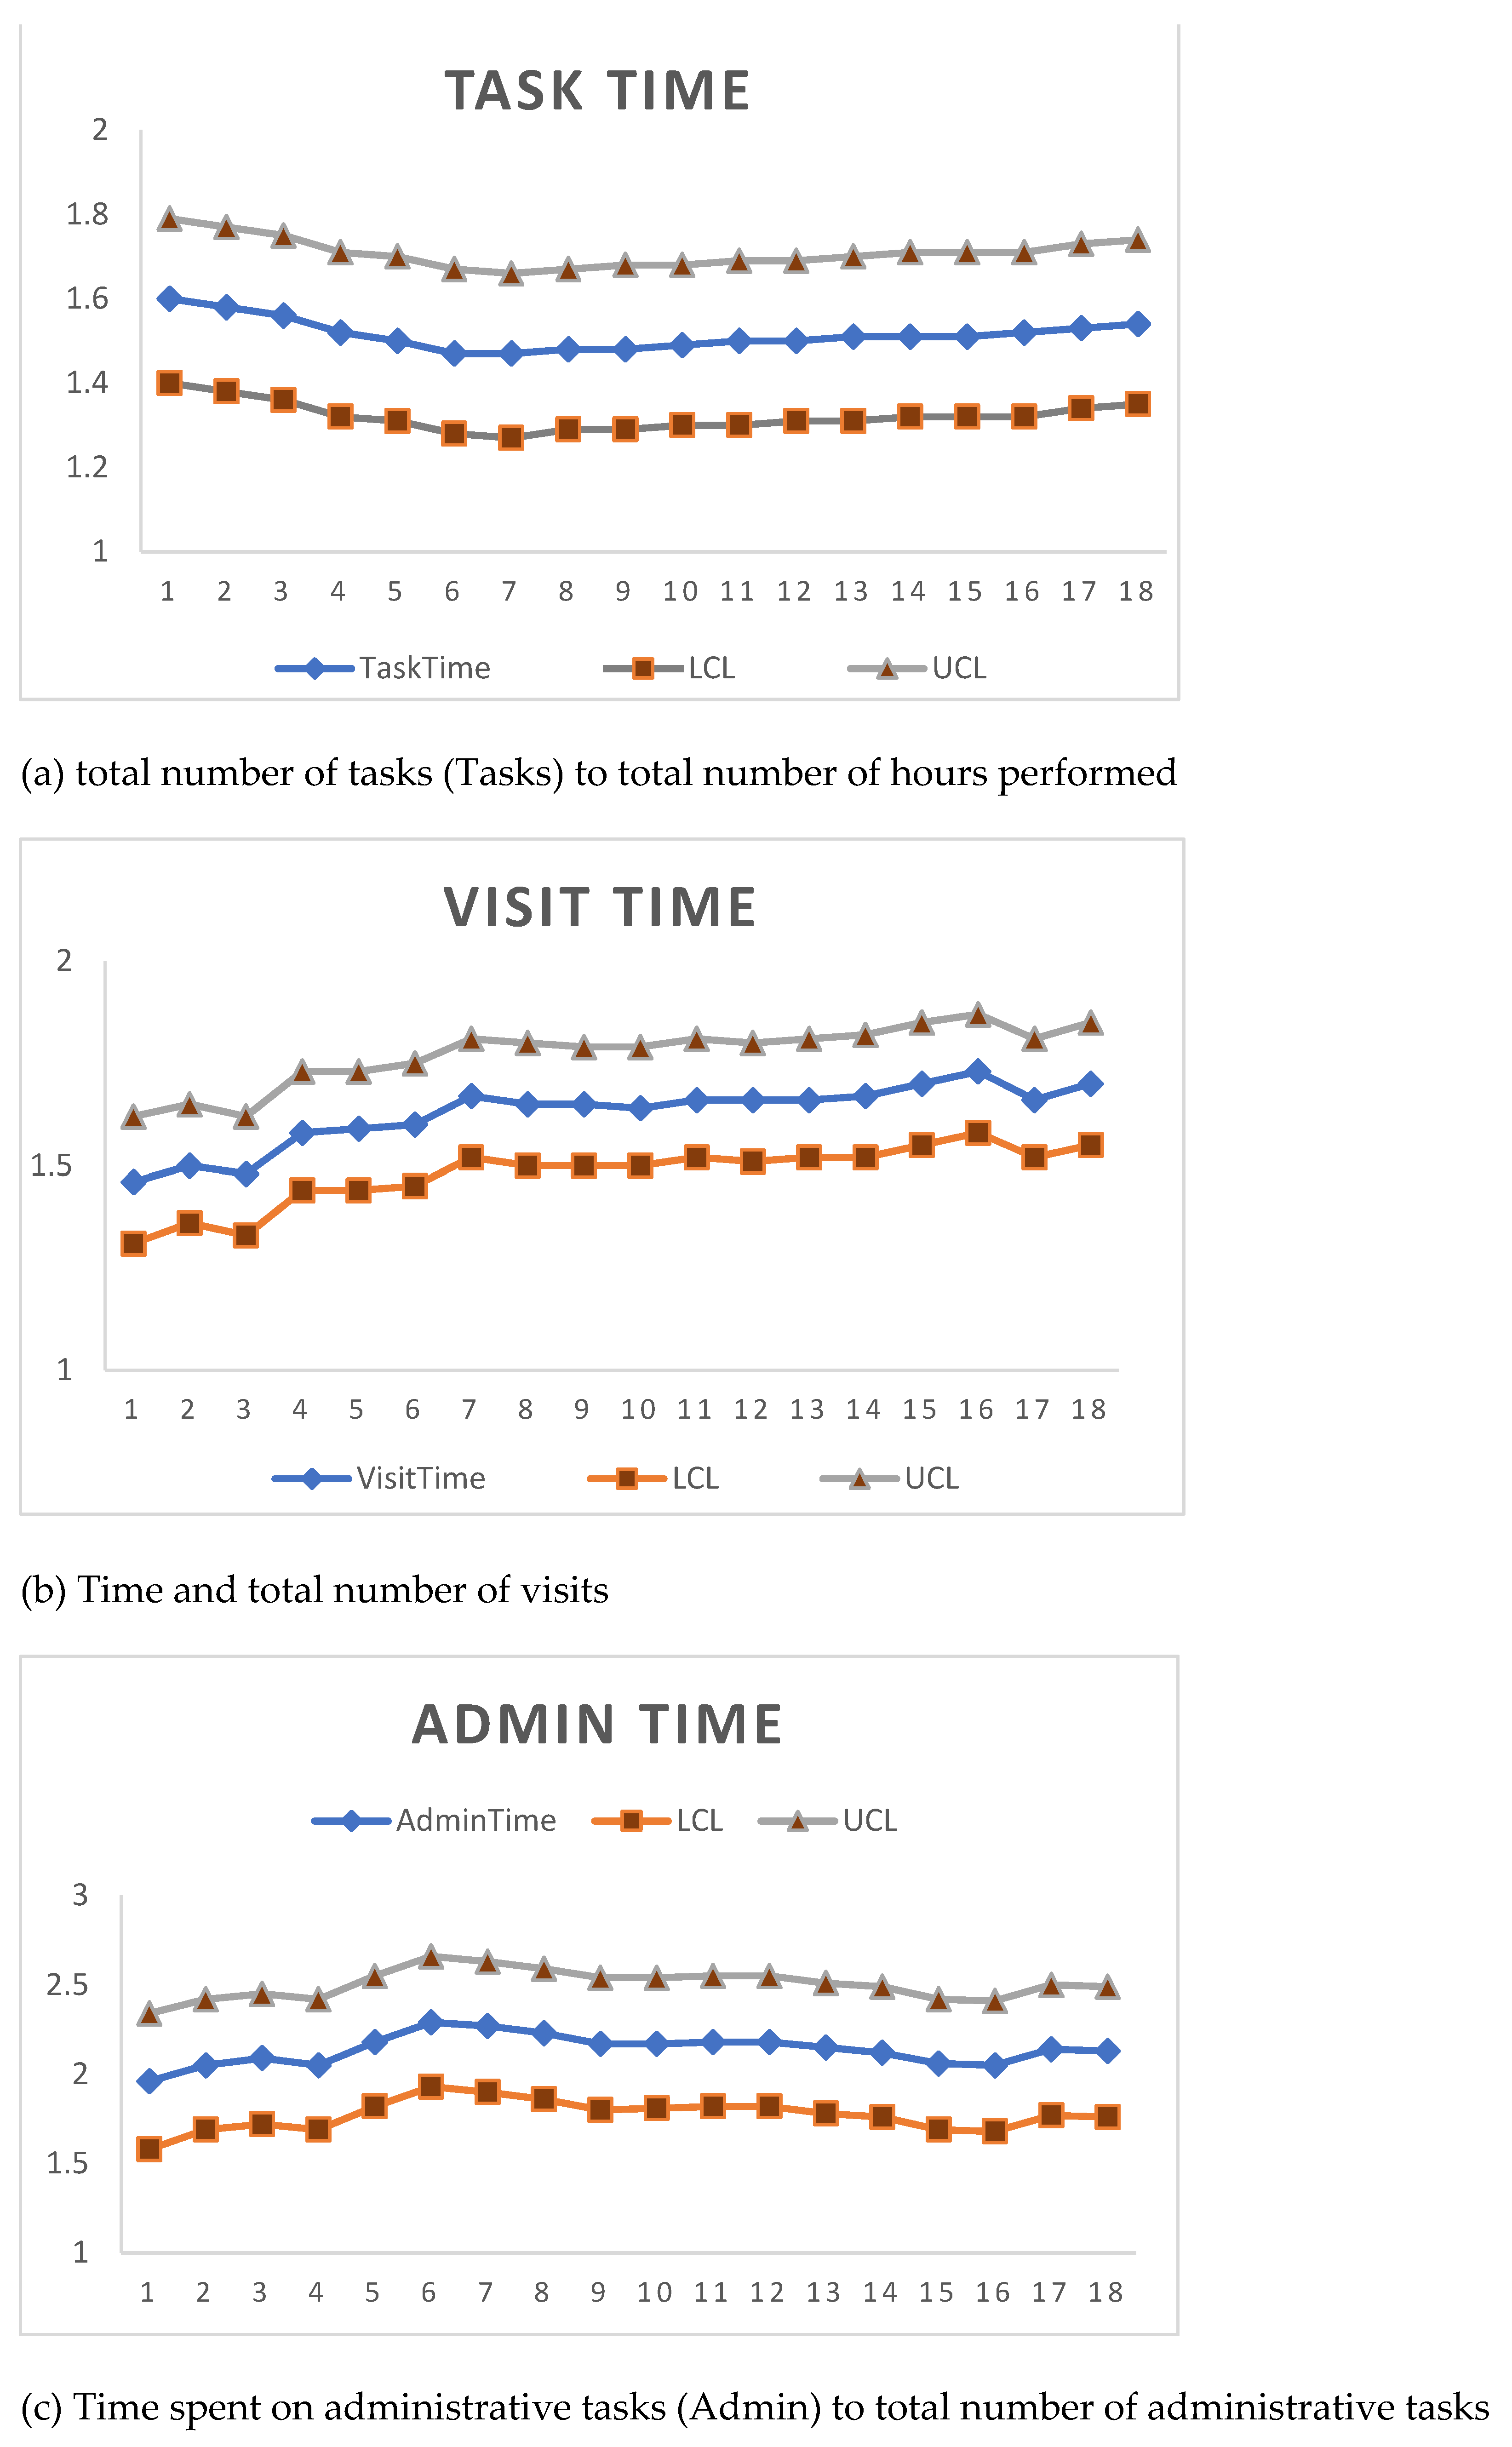
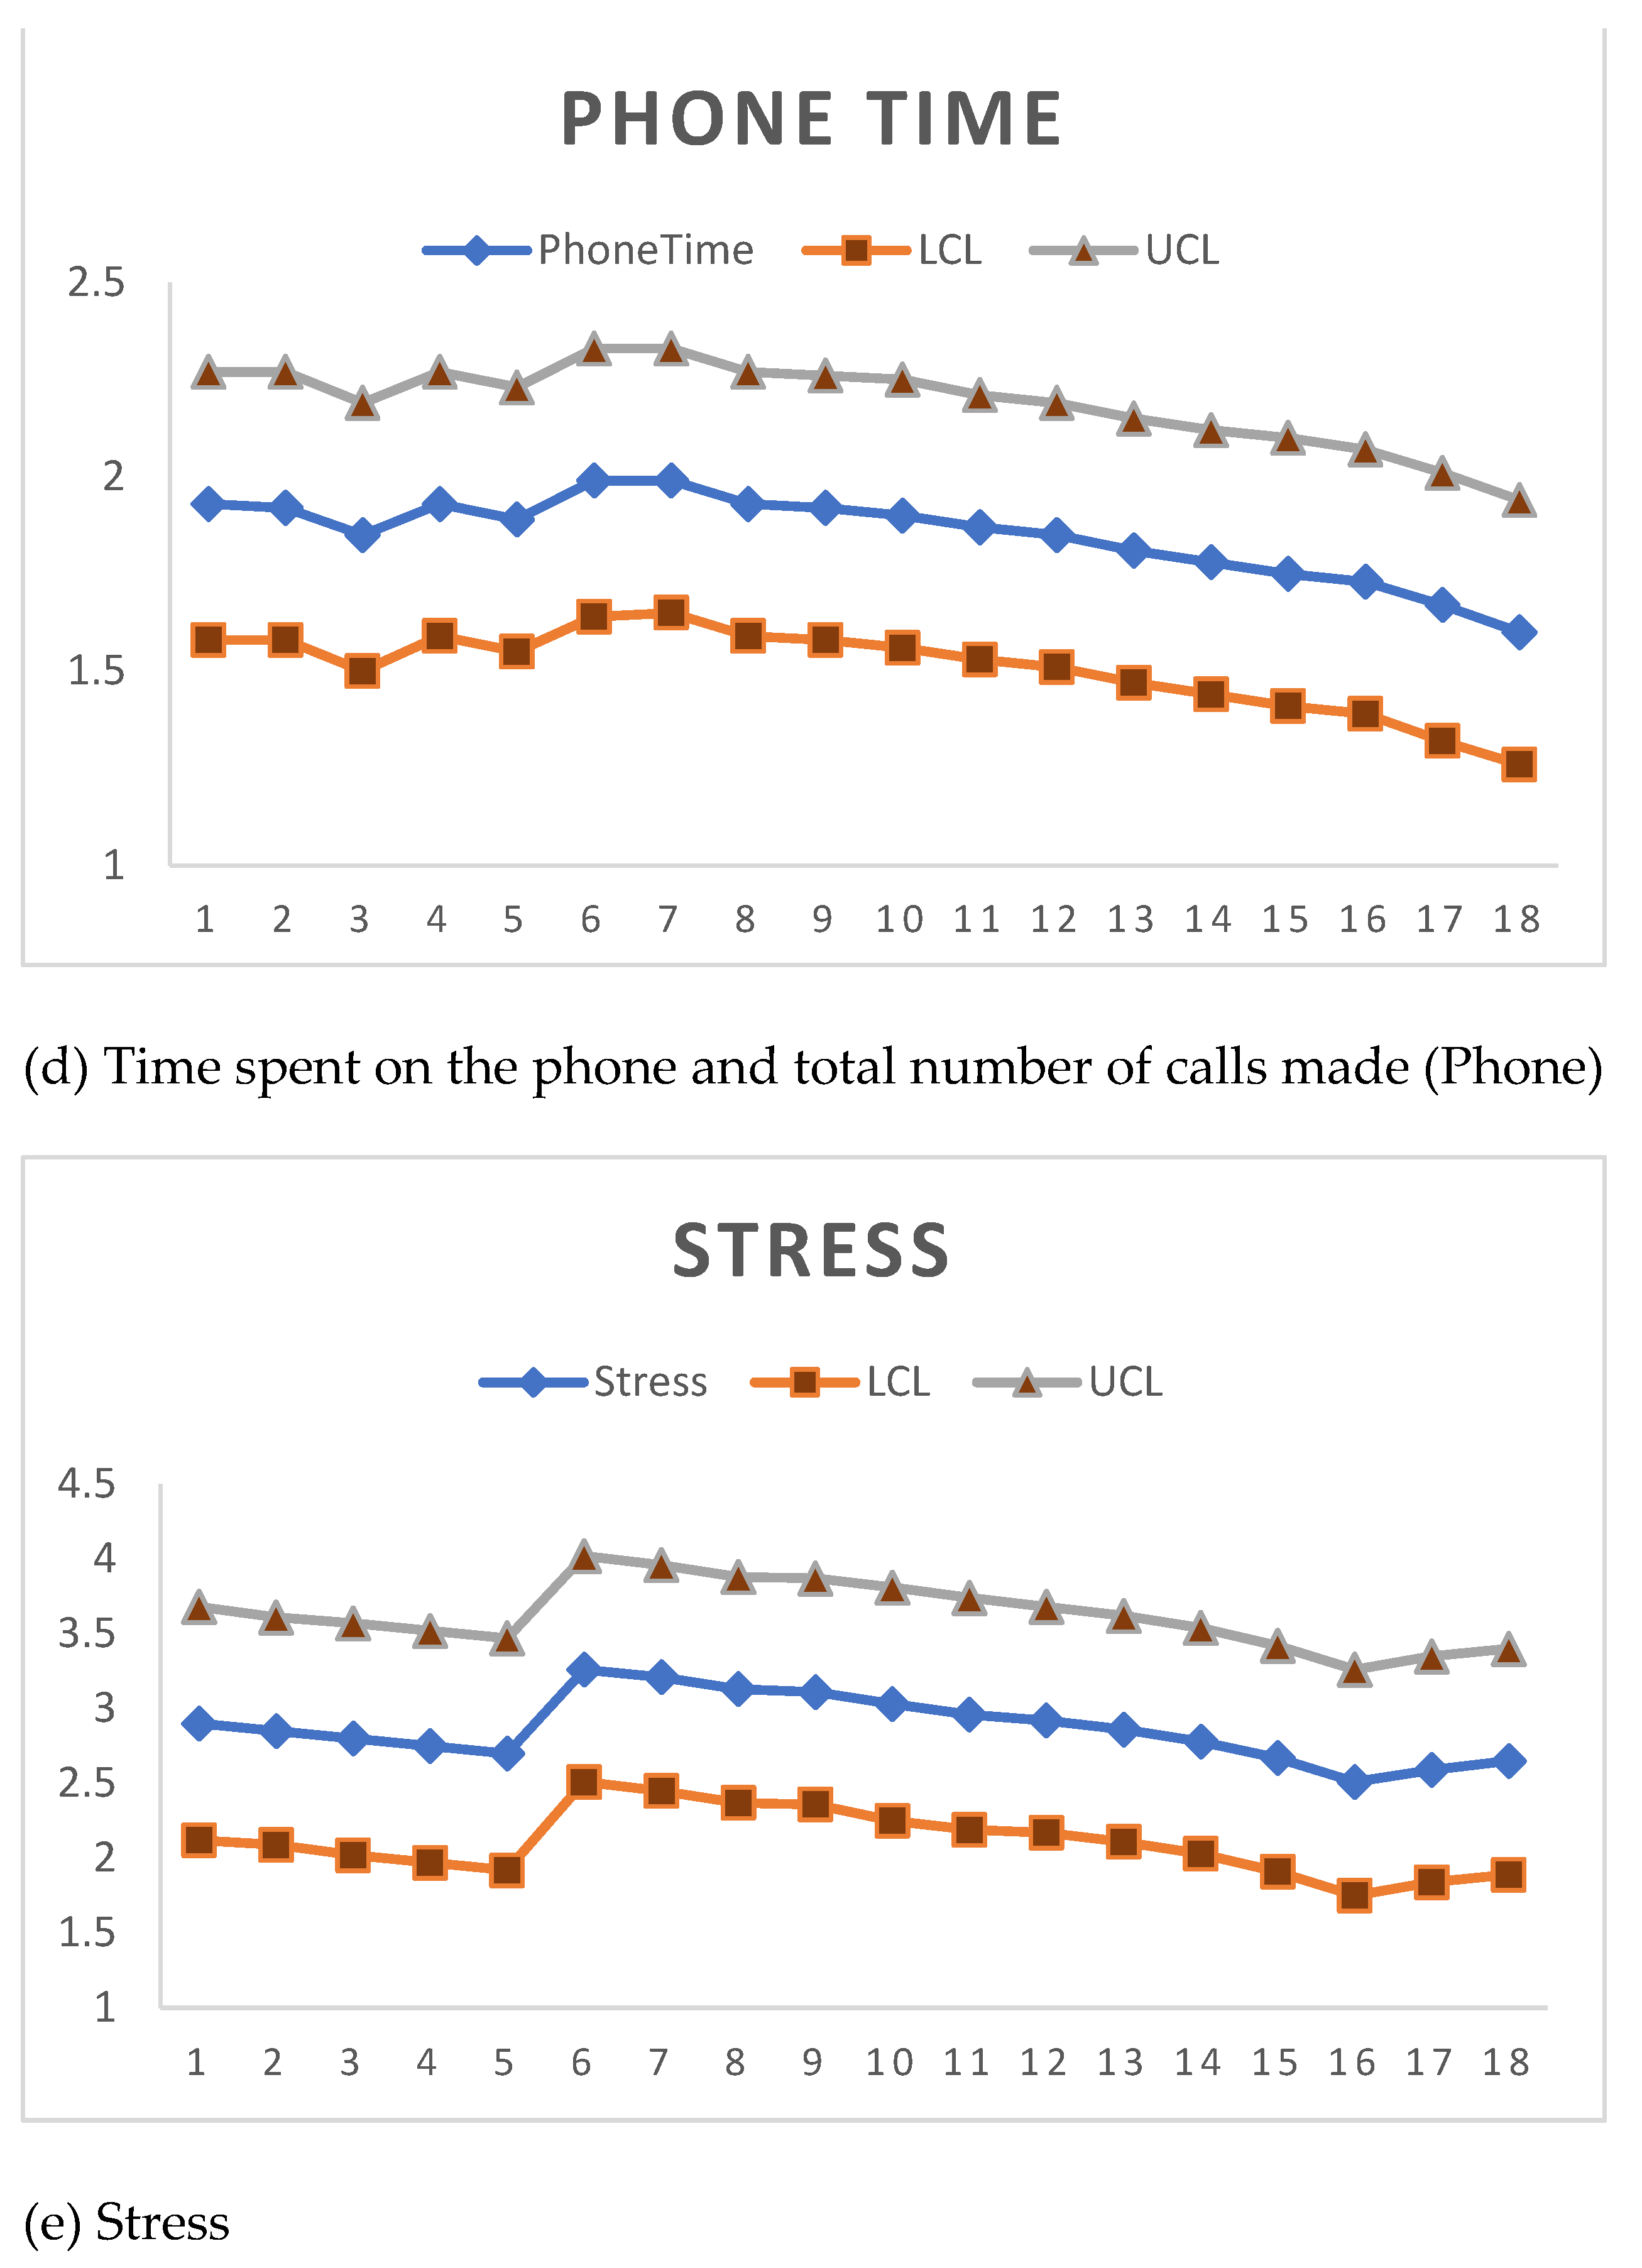
| Outcomes | Pre-Slope | Pre-Slope (p-Value) | Post-Slope | Slope Diff. | Slope Diff. (p-Value) |
|---|---|---|---|---|---|
| Tasks/Time | −0.023 | 0.440 | 0.006 | 0.029 | 0.337 |
| Time/Visits | 0.027 | 0.166 | 0.005 | −0.022 | 0.259 |
| Time/Admin | 0.061 | 0.355 | −0.014 | −0.075 | 0.278 |
| Time/Phone | −0.014 | 0.776 | −0.031 | −0.017 | 0.726 |
| Stress | −0.051 | 0.672 | −0.060 | −0.009 | 0.943 |
| Stress (mean imputation) | −0.054 | 0.565 | −0.047 | 0.007 | 0.941 |
| Stress (Linear interpolation) | −0.051 | 0.576 | −0.059 | −0.008 | 0.939 |
| Outcomes | Cost (EUR) | Effect Sizes (t-test) | ACERs (EUR) | Effect Sizes (ITS) | ACERs (EUR) | Cohen’s d (ITS) | ACERs (EUR) |
|---|---|---|---|---|---|---|---|
| Stress | 1742 | −0.425 | 4099 | −0.008 | 217,807 | −0.042 | 41,487 |
| Tasks/Time | 1742 | 0.569 | 3062 | 0.029 | 60,085 | 0.525 | 3319 |
| Time/Visits | 1742 | −1.884 | 925 | −0.022 | 79,202 | −0.631 | 2761 |
| Time/Admin | 1742 | −1.613 | 1080 | −0.075 | 23,233 | −0.605 | 2880 |
| Time/Phone | 1742 | 0.304 | 5732 | −0.017 | 102,497 | −0.191 | 9123 |
Publisher’s Note: MDPI stays neutral with regard to jurisdictional claims in published maps and institutional affiliations. |
© 2022 by the authors. Licensee MDPI, Basel, Switzerland. This article is an open access article distributed under the terms and conditions of the Creative Commons Attribution (CC BY) license (https://creativecommons.org/licenses/by/4.0/).
Share and Cite
Jensen, I.; Arapovic-Johansson, Z.; Aboagye, E. The Cost-Effectiveness Analysis of the Productivity Measurement and Enhancement System Intervention to Reduce Employee Work-Related Stress and Enhance Work Performance. Int. J. Environ. Res. Public Health 2022, 19, 2431. https://doi.org/10.3390/ijerph19042431
Jensen I, Arapovic-Johansson Z, Aboagye E. The Cost-Effectiveness Analysis of the Productivity Measurement and Enhancement System Intervention to Reduce Employee Work-Related Stress and Enhance Work Performance. International Journal of Environmental Research and Public Health. 2022; 19(4):2431. https://doi.org/10.3390/ijerph19042431
Chicago/Turabian StyleJensen, Irene, Zana Arapovic-Johansson, and Emmanuel Aboagye. 2022. "The Cost-Effectiveness Analysis of the Productivity Measurement and Enhancement System Intervention to Reduce Employee Work-Related Stress and Enhance Work Performance" International Journal of Environmental Research and Public Health 19, no. 4: 2431. https://doi.org/10.3390/ijerph19042431
APA StyleJensen, I., Arapovic-Johansson, Z., & Aboagye, E. (2022). The Cost-Effectiveness Analysis of the Productivity Measurement and Enhancement System Intervention to Reduce Employee Work-Related Stress and Enhance Work Performance. International Journal of Environmental Research and Public Health, 19(4), 2431. https://doi.org/10.3390/ijerph19042431