
Injuries and Overuse Injuries in Show Jumping—A Retrospective Epidemiological Cross-Sectional Study of Show Jumpers in Germany

 ,
,  , , and
Abstract
:1. Introduction
2. Materials and Methods
Statistical Analysis
3. Results
3.1. Injury Location
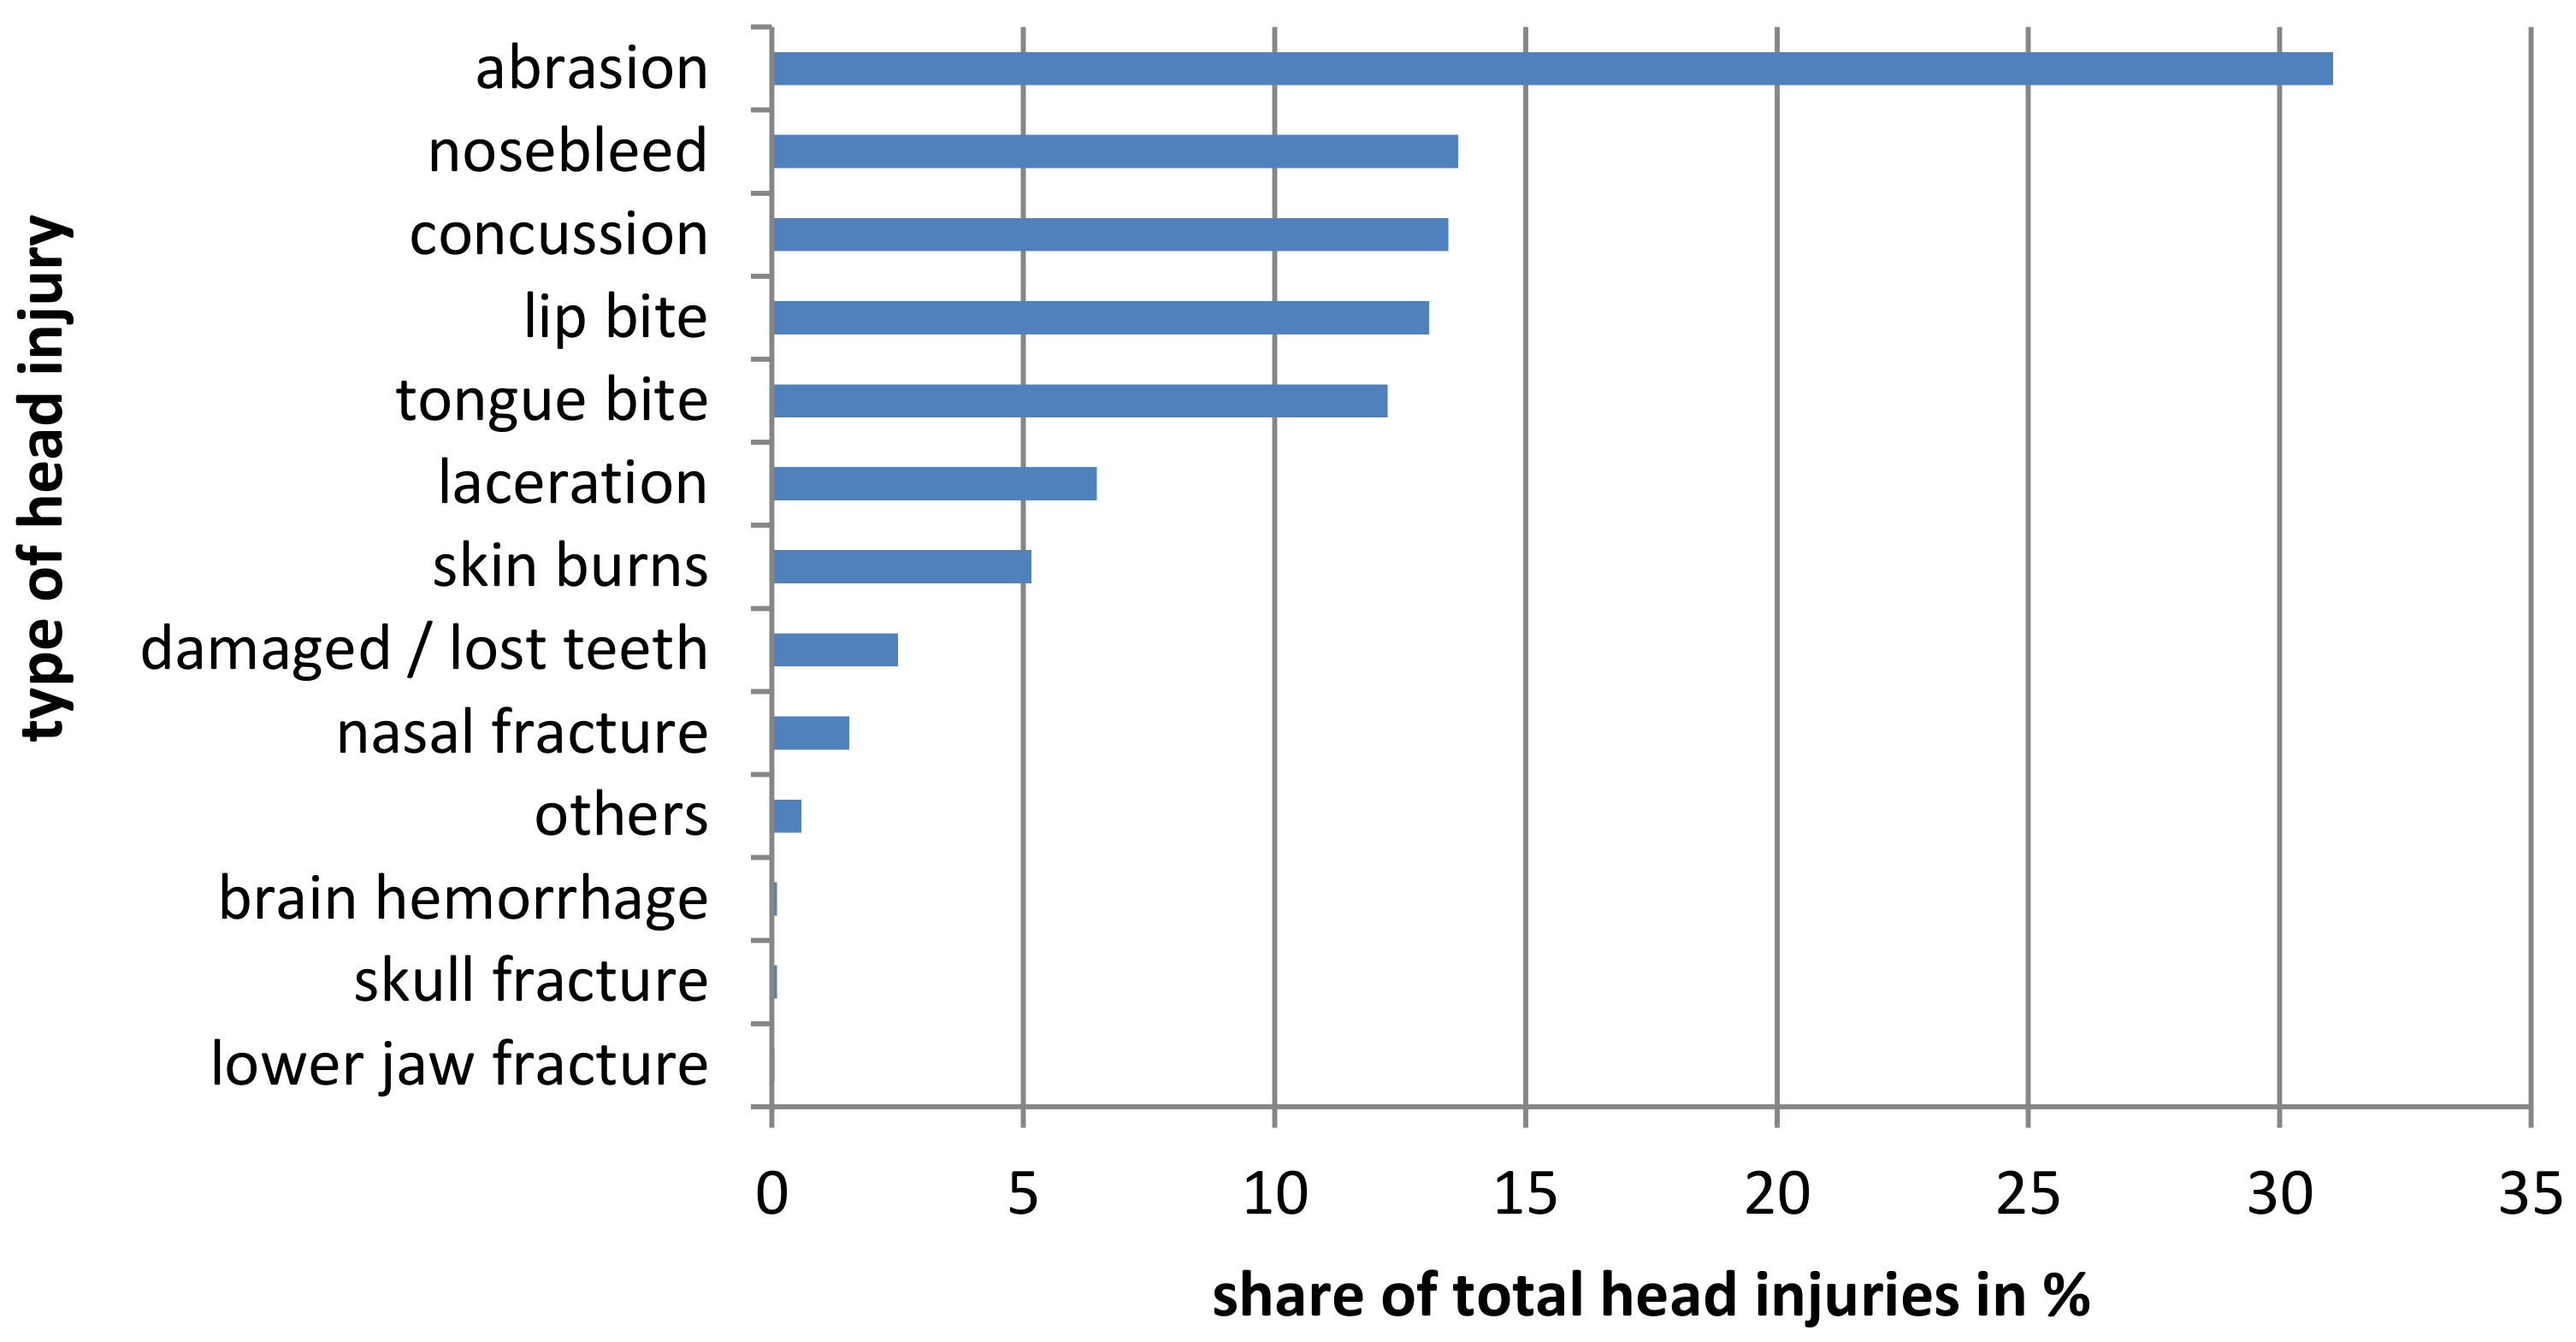
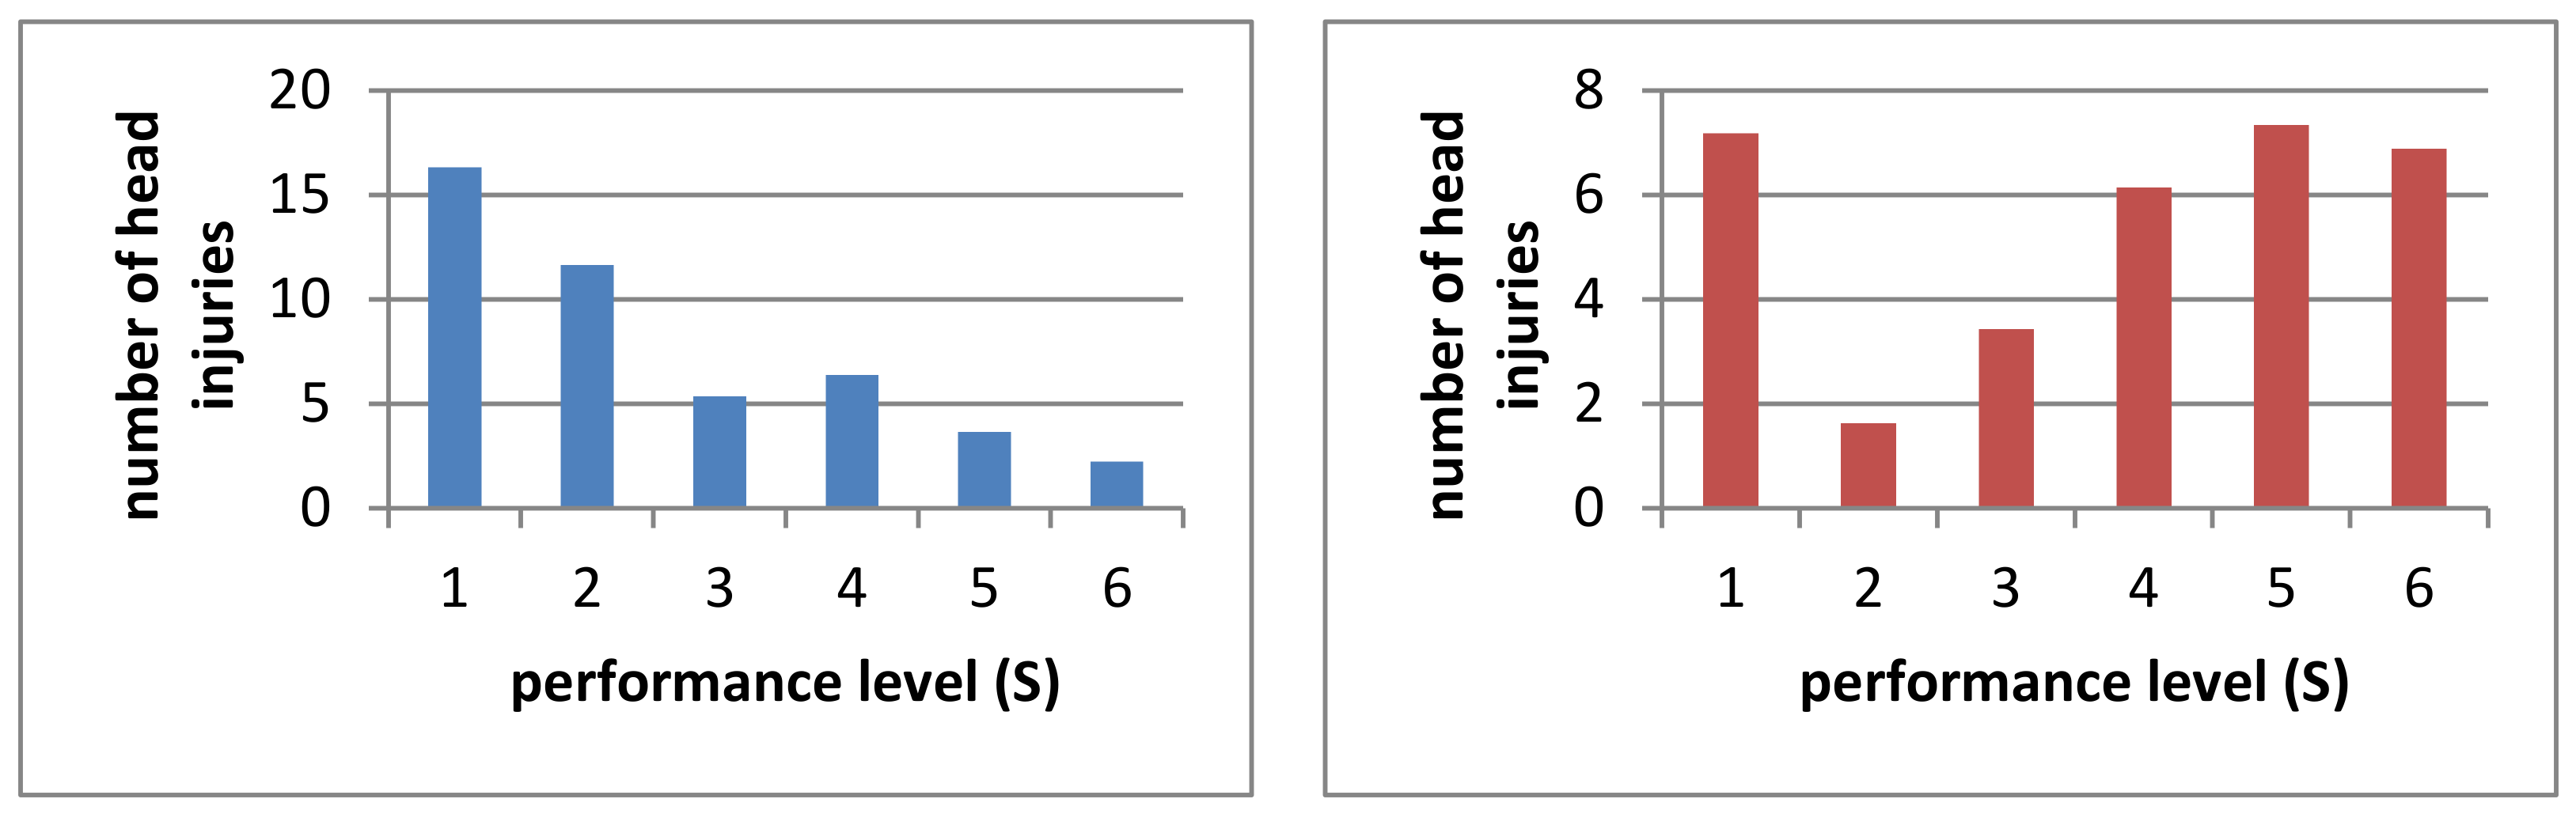
3.1.1. Head
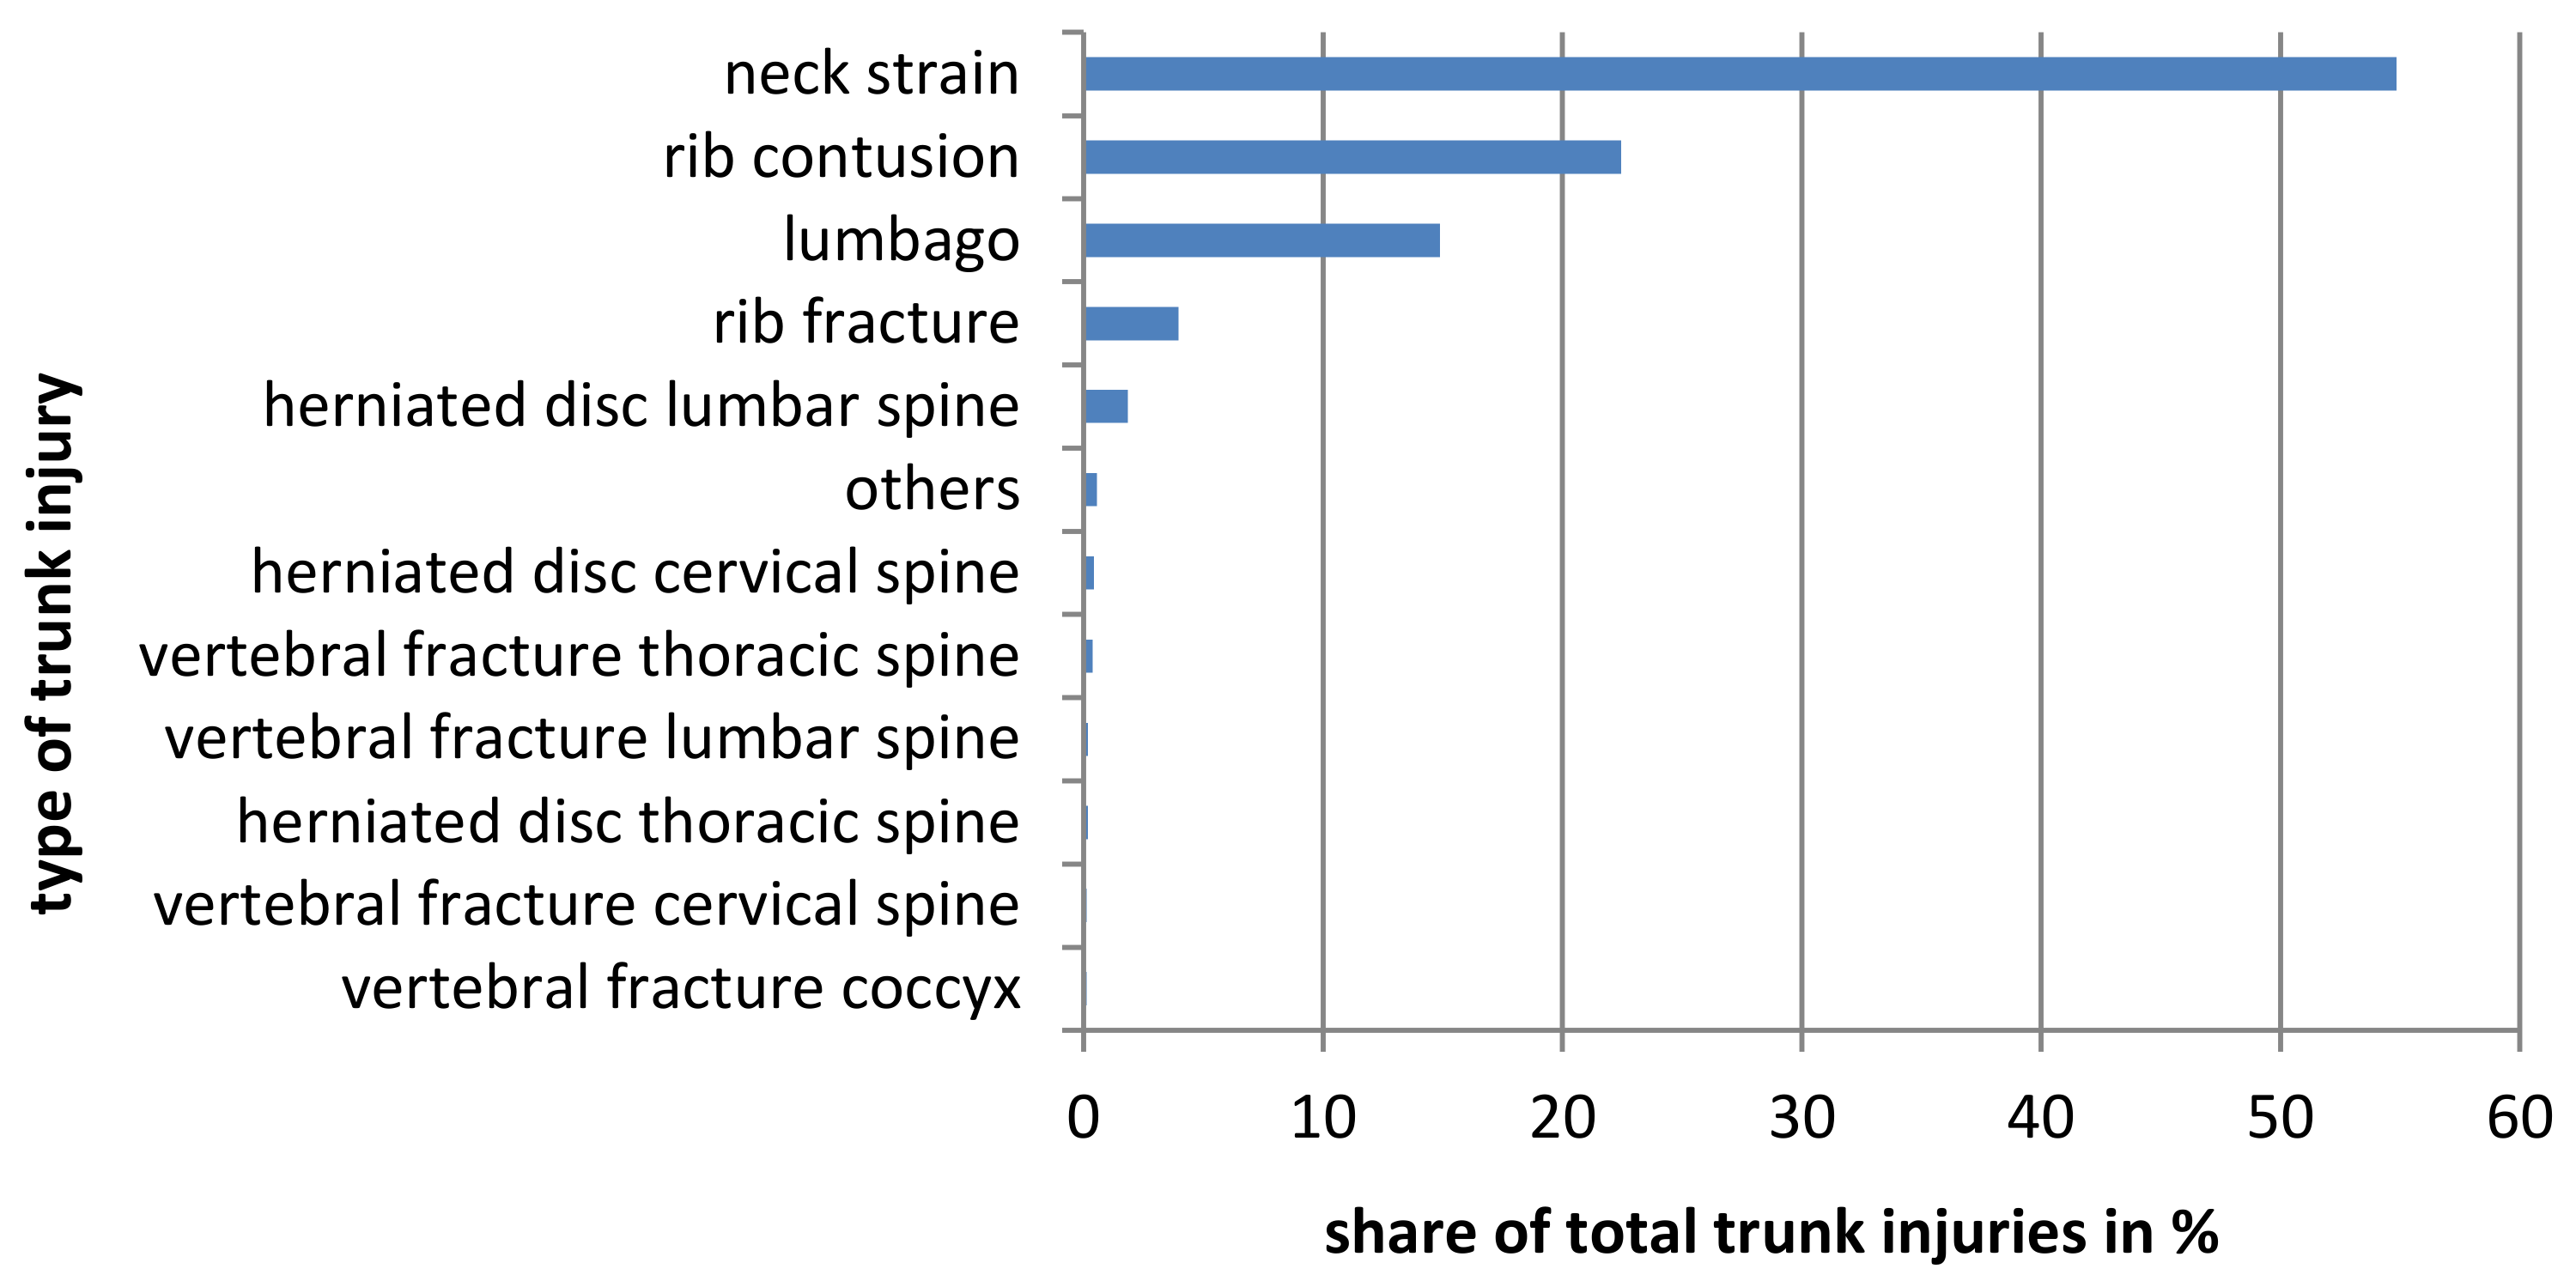
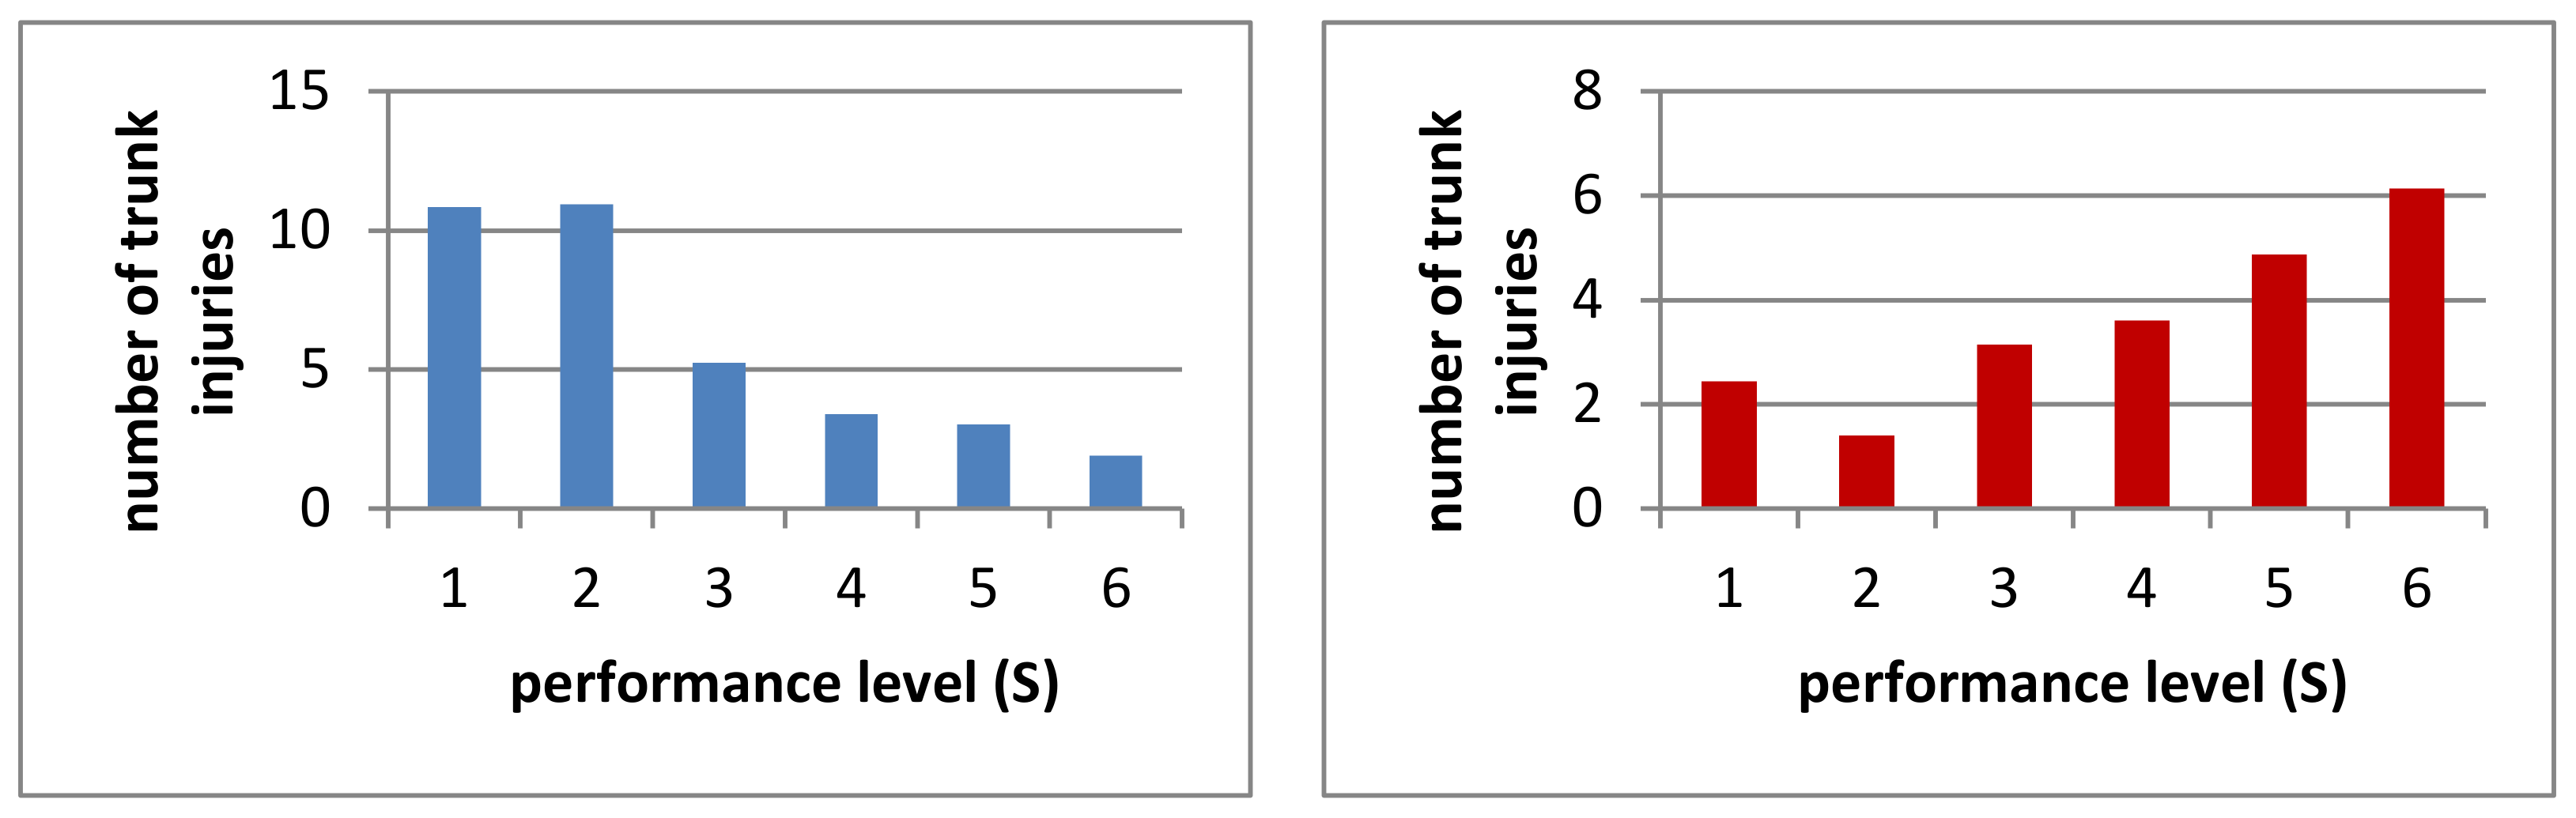
3.1.2. Trunk
3.2. Types of Injuries
3.3. Injury Break
3.4. Protective Equipment
4. Discussion
4.1. Injury Frequency
4.2. Injury Location
4.3. Differences of the Collective
4.4. Types of Injuries
4.5. Protective Equipment
5. Conclusions
Author Contributions
Funding
Institutional Review Board Statement
Informed Consent Statement
Data Availability Statement
Acknowledgments
Conflicts of Interest
References
- Spring-Reiter. Springreiter. Available online: https://www.spring-reiter.de/index.php/abwuerfe-fehler-und-regeln-im-parcours/ (accessed on 23 November 2021).
- FEI Jumping Rules. Available online: https://inside.fei.org/fei/disc/jumping/rules (accessed on 23 November 2021).
- Pferd-Aktuell. Deutsche Reiterliche Vereinigung: Leistungsklassen und Ranglistenpunkte im Pferdesport. Available online: https://www.pferd-aktuell.de/turniersport/turnierteilnehmer/leistungsklassen-und-ranglistenpunkte (accessed on 23 November 2021).
- Hessler, C.; Eckert, V.; Meiners, J.; Jürgens, C.; Reicke, B.; Matthes, G.; Ekkernkamp, A.; Püschel, K. Causes, injuries, therapy and possibilities of prevention of equine-related accidents. Results of a 2-center-study. Unfallchirurgie 2014, 117, 123–127. [Google Scholar] [CrossRef]
- Rathfelder, F.J.; Klever, P.; Nachtkamp, J.; Paar, O. Injuries in horseback riding—Incidence and causes. Sportverletz Sportschaden 1995, 9, 77–83. [Google Scholar] [CrossRef]
- Clark, J.M.; Hoshizaki, T.B.; Annaidh, A.N.; Gilchrist, M.D. Equestrian helmet standards: Do they represent real-world accident conditions? Ann. Biomed. Eng. 2020, 48, 2247–2267. [Google Scholar] [CrossRef] [PubMed]
- Ball, C.G.; Ball, J.E.; Kirkpatrick, A.W.; Mulloy, R.H. Equestrian injuries: Incidence, injury patterns, and risk factors for 10 years of major traumatic injuries. Am. J. Surg. 2007, 193, 636–640. [Google Scholar] [CrossRef]
- Lechler, P.; Walt, L.; Grifka, J.; Waltl, V.; Renkawitz, T. Traumatology and sport injuries in professional and amateur show-jumping competitors. Sportverletz Sportschaden 2011, 25, 222–226. [Google Scholar] [CrossRef]
- Gass, M.; Kühl, S.; Connert, T.; Filippi, A. Dental trauma in showjumping—A trinational study between Switzerland, France and Germany. Dent. Traumatol. 2016, 32, 174–179. [Google Scholar] [CrossRef] [PubMed]
- Kauther, M.D.; Rummel, S.; Hussmann, B.; Lendemans, S.; Wedemeyer, C.; Jaeger, M. Wheel-gymnastic-related injuries and overuse syndromes of amateurs and professionals. Knee Surg. Sports Traumatol. Arthrosc. 2015, 23, 2440–2448. [Google Scholar] [CrossRef]
- Burggraf, M.; Burgsmüller, L.; Meyer, H.-L.; Polan, C.; Husen, M.; Mester, B.; Dudda, M.; Kauther, M.D. Injuries in inline skater hockey. Sportverletz Sportschaden 2020, 34, 212–216. (In German) [Google Scholar] [CrossRef] [PubMed]
- Meyer, H.-L.; Minnemann, F.; Polan, C.; Burggraf, M.; Dudda, M.; Kauther, M.D. Injuries in underwater rugby: A retrospective cross-sectional epidemiological study. Diving Hyperb. Med. J. 2021, 51, 282–287. [Google Scholar] [CrossRef]
- Krüger, L.; Hohberg, M.; Lehmann, W.; Dresing, K. Assessing the risk for major injuries in equestrian sports. BMJ Open Sport Exerc. Med. 2018, 4, e000408. [Google Scholar] [CrossRef] [PubMed] [Green Version]
- Fleischer, L.; Faschingbauer, M.; Seide, K.; Kienast, B. Verletzungsmuster bei Reitunfällen. Deutsche Zeitschrift Sportmedizin 2016, 67, 270–275. [Google Scholar] [CrossRef]
- Heitkamp, H.-C.; Horstmann, T.; Hillgeris, D. Riding injuries and injuries due to handling horses in experienced riders. Unfallchirurgie 1998, 101, 122–128. [Google Scholar] [CrossRef] [PubMed]
- Mayberry, J.C.; Pearson, T.E.; Wiger, K.J.; Diggs, B.S.; Mullins, R.J. Equestrian injury prevention efforts need more attention to novice riders. J. Trauma 2007, 62, 735–739. [Google Scholar] [CrossRef] [PubMed]
- Havlik, H.S. Equestrian sport-related injuries: A review of current literature. Curr. Sports Med. Rep. 2010, 9, 299–302. [Google Scholar] [CrossRef]
- McCrory, P.; Turner, M. Equestrian injuries. Med. Sport Sci. 2005, 48, 8–17. [Google Scholar] [CrossRef] [Green Version]
- Sorli, J.M. Equestrian injuries: A five year review of hospital admissions in British Columbia, Canada. Inj. Prev. 2000, 6, 59–61. [Google Scholar] [CrossRef] [Green Version]
- McCrory, P.; Turner, M.; LeMasson, B.; Bodere, C.; Allemandou, A. An analysis of injuries resulting from professional horse racing in France during 1991–2001: A comparison with injuries resulting from professional horse racing in Great Britain during 1992–2001. Br. J. Sports Med. 2006, 40, 614–618. [Google Scholar] [CrossRef]
- Schmidt, B.; Höllwarth, M.E. Sports accidents in children and adolescents. Z Kinderchirurgie 1989, 44, 357–362. (In German) [Google Scholar] [CrossRef]
- Schmidt, B.; Mayr, J.; Fasching, G.; Nöres, H. Equestrian accidents in children and adolescents. Unfallchirurgie 1994, 97, 661–662. (In German) [Google Scholar]
- Giebel, G.; Braun, K.; Mittelmeier, W. Equestrian accidents in children. Chirurgie 1993, 64, 938–947. (In German) [Google Scholar]
- Siebenga, J.; Segers, M.J.M.; Elzinga, M.J.; Bakker, F.C.; Haarman, H.J.T.M.; Patka, P. Spine fractures caused by horse riding. Eur. Spine J. 2006, 15, 465–471. [Google Scholar] [CrossRef] [PubMed]
- Hessler, C.; Namislo, V.; Kammler, G.; Lockemann, U.; Püschel, K.; Meenen, N.M. Reitunfallbedingte Wirbelsäulenverletzungen - eine Analyse von 30 Fällen [Spine injuries due to horse riding accidents - an analysis of 30 cases]. Sportverletz Sportschaden 2011, 25, 93–96. [Google Scholar] [CrossRef]
- Moss, P.S.; Wan, A.; Whitlock, M.R. A changing pattern of injuries to horse riders. Emerg. Med. J. 2002, 19, 412–414. [Google Scholar] [CrossRef] [PubMed] [Green Version]
- Thomas, K.E.; Annest, J.L.; Gilchrist, J.; Bixby-Hammett, D.M. Non-fatal horse related injuries treated in emergency departments in the United States, 2001–2003. Br. J. Sports Med. 2006, 40, 619–626. [Google Scholar] [CrossRef] [PubMed]
- Cobey, K.D.; Laan, F.; Stulp, G.; Buunk, A.P.; Pollet, T. Sex differences in risk taking behavior among Dutch cyclists. Evol. Psychol. 2013, 11, 350–364. [Google Scholar] [CrossRef] [Green Version]
- Feler, J.; A Maung, A.; O’Connor, R.; A Davis, K.; Gerrard, J. Sex-based differences in helmet performance in bicycle trauma. J. Epidemiol. Community Health 2021, 75, 994–1000. [Google Scholar] [CrossRef]
- Dittmer, H. The injury pattern in horseback riding. Langenbecks Archiv Chirurgue 1991, 466–469. (In German) [Google Scholar]
- Assmus, H.; Martini, A.K. Nerve compression syndromes of the upper extremity. Zeitschrift Orthopädie Unfallchirurgie 2010, 148, 595–610. (In German) [Google Scholar] [CrossRef]
- Hessler, C.; Schilling, B.; Meenen, N.M.; Lockemann, U.; Püschel, K. Risks in sport riding—A critical survey of safety standards in sport riding. Sportverletz Sportschaden 2010, 24, 154–158. [Google Scholar] [CrossRef]


| Performance Level | Number of Study Participants | Age in Years | Riding Hours (Exposure Time) | Injuries/1000 Riding Hours |
|---|---|---|---|---|
| S 1 | 18 (5.0%) | 29.9 ± 9.6 | 20,716.2 ± 23,546 | 2.1 |
| S 2 | 33 (9.1%) | 34.3 ± 14.8 | 22,279.6 ± 25,901.2 | 1.7 |
| S 3 | 69 (19.9%) | 30.9 ± 13.5 | 5556.5 ± 8289.3 | 3.6 |
| S 4 | 85 (23.4%) | 25.5 ± 8.2 | 1850.3 ± 1755.8 | 11.1 |
| S 5 | 92 (25.3%) | 26.2 ± 9.6 | 1657.8 ± 2586.8 | 6.9 |
| S 6 | 66 (18.2%) | 21.1 ± 6.7 | 473.5 ± 407.1 | 17.6 |
| Body Region | Total Number of Injuries/Overuse Damage | Number of Riders with Injuries | Average Number of Injuries/Careers Per Rider |
|---|---|---|---|
| head | 2073 (30.6%) | 232 (63.9%) | 5.7 ± 11.3 |
| trunk | 1612 (23.9%) | 247 (68%) | 4.4 ± 7.6 |
| shoulder | 607 (9.0%) | 150 (41.3%) | 1.7 ± 4.3 |
| elbow | 329 (4.9%) | 88 (24.2%) | 0.9 ± 3 |
| wrist/hand | 883 (13.0%) | 162 (44.6%) | 2.4 ± 7 |
| pelvis/thigh | 328 (4.8%) | 101 (27.8%) | 0.9 ± 2.4 |
| knee | 595 (8.8%) | 122 (33.6%) | 1.6 ± 10.8 |
| lower leg | 341 (5.0%) | 99 (27.3%) | 0.9 ± 2.7 |
| Injury Type | Number of Injuries | Average Number of Injuries/Career of a Rider | Most Common Injury |
|---|---|---|---|
| bruises/skin injuries | 3209 | 8.8 ± 16.4 | head abrasion (20.1%) |
| distensions/distortions | 1885 | 5.2 ± 9 | cervical spine distortion (46.9%) |
| dislocations | 275 | 0.8 ± 10.5 | patellar dislocation (82.2%) |
| fractures | 246 | 0.7 ± 1.6 | rib fractures (26%) |
| ruptures | 196 | 0.5 ± 1.9 | hand tendon injuries (42.4%) |
Publisher’s Note: MDPI stays neutral with regard to jurisdictional claims in published maps and institutional affiliations. |
© 2022 by the authors. Licensee MDPI, Basel, Switzerland. This article is an open access article distributed under the terms and conditions of the Creative Commons Attribution (CC BY) license (https://creativecommons.org/licenses/by/4.0/).
Share and Cite
Meyer, H.-L.; Scheidgen, P.; Polan, C.; Beck, P.; Mester, B.; Kauther, M.D.; Dudda, M.; Burggraf, M. Injuries and Overuse Injuries in Show Jumping—A Retrospective Epidemiological Cross-Sectional Study of Show Jumpers in Germany. Int. J. Environ. Res. Public Health 2022, 19, 2305. https://doi.org/10.3390/ijerph19042305
Meyer H-L, Scheidgen P, Polan C, Beck P, Mester B, Kauther MD, Dudda M, Burggraf M. Injuries and Overuse Injuries in Show Jumping—A Retrospective Epidemiological Cross-Sectional Study of Show Jumpers in Germany. International Journal of Environmental Research and Public Health. 2022; 19(4):2305. https://doi.org/10.3390/ijerph19042305
Chicago/Turabian StyleMeyer, Heinz-Lothar, Philip Scheidgen, Christina Polan, Paula Beck, Bastian Mester, Max Daniel Kauther, Marcel Dudda, and Manuel Burggraf. 2022. "Injuries and Overuse Injuries in Show Jumping—A Retrospective Epidemiological Cross-Sectional Study of Show Jumpers in Germany" International Journal of Environmental Research and Public Health 19, no. 4: 2305. https://doi.org/10.3390/ijerph19042305
APA StyleMeyer, H.-L., Scheidgen, P., Polan, C., Beck, P., Mester, B., Kauther, M. D., Dudda, M., & Burggraf, M. (2022). Injuries and Overuse Injuries in Show Jumping—A Retrospective Epidemiological Cross-Sectional Study of Show Jumpers in Germany. International Journal of Environmental Research and Public Health, 19(4), 2305. https://doi.org/10.3390/ijerph19042305