
Ecological Risk, Input Flux, and Source of Heavy Metals in the Agricultural Plain of Hebei Province, China

Abstract
:1. Introduction
2. Materials and Methods
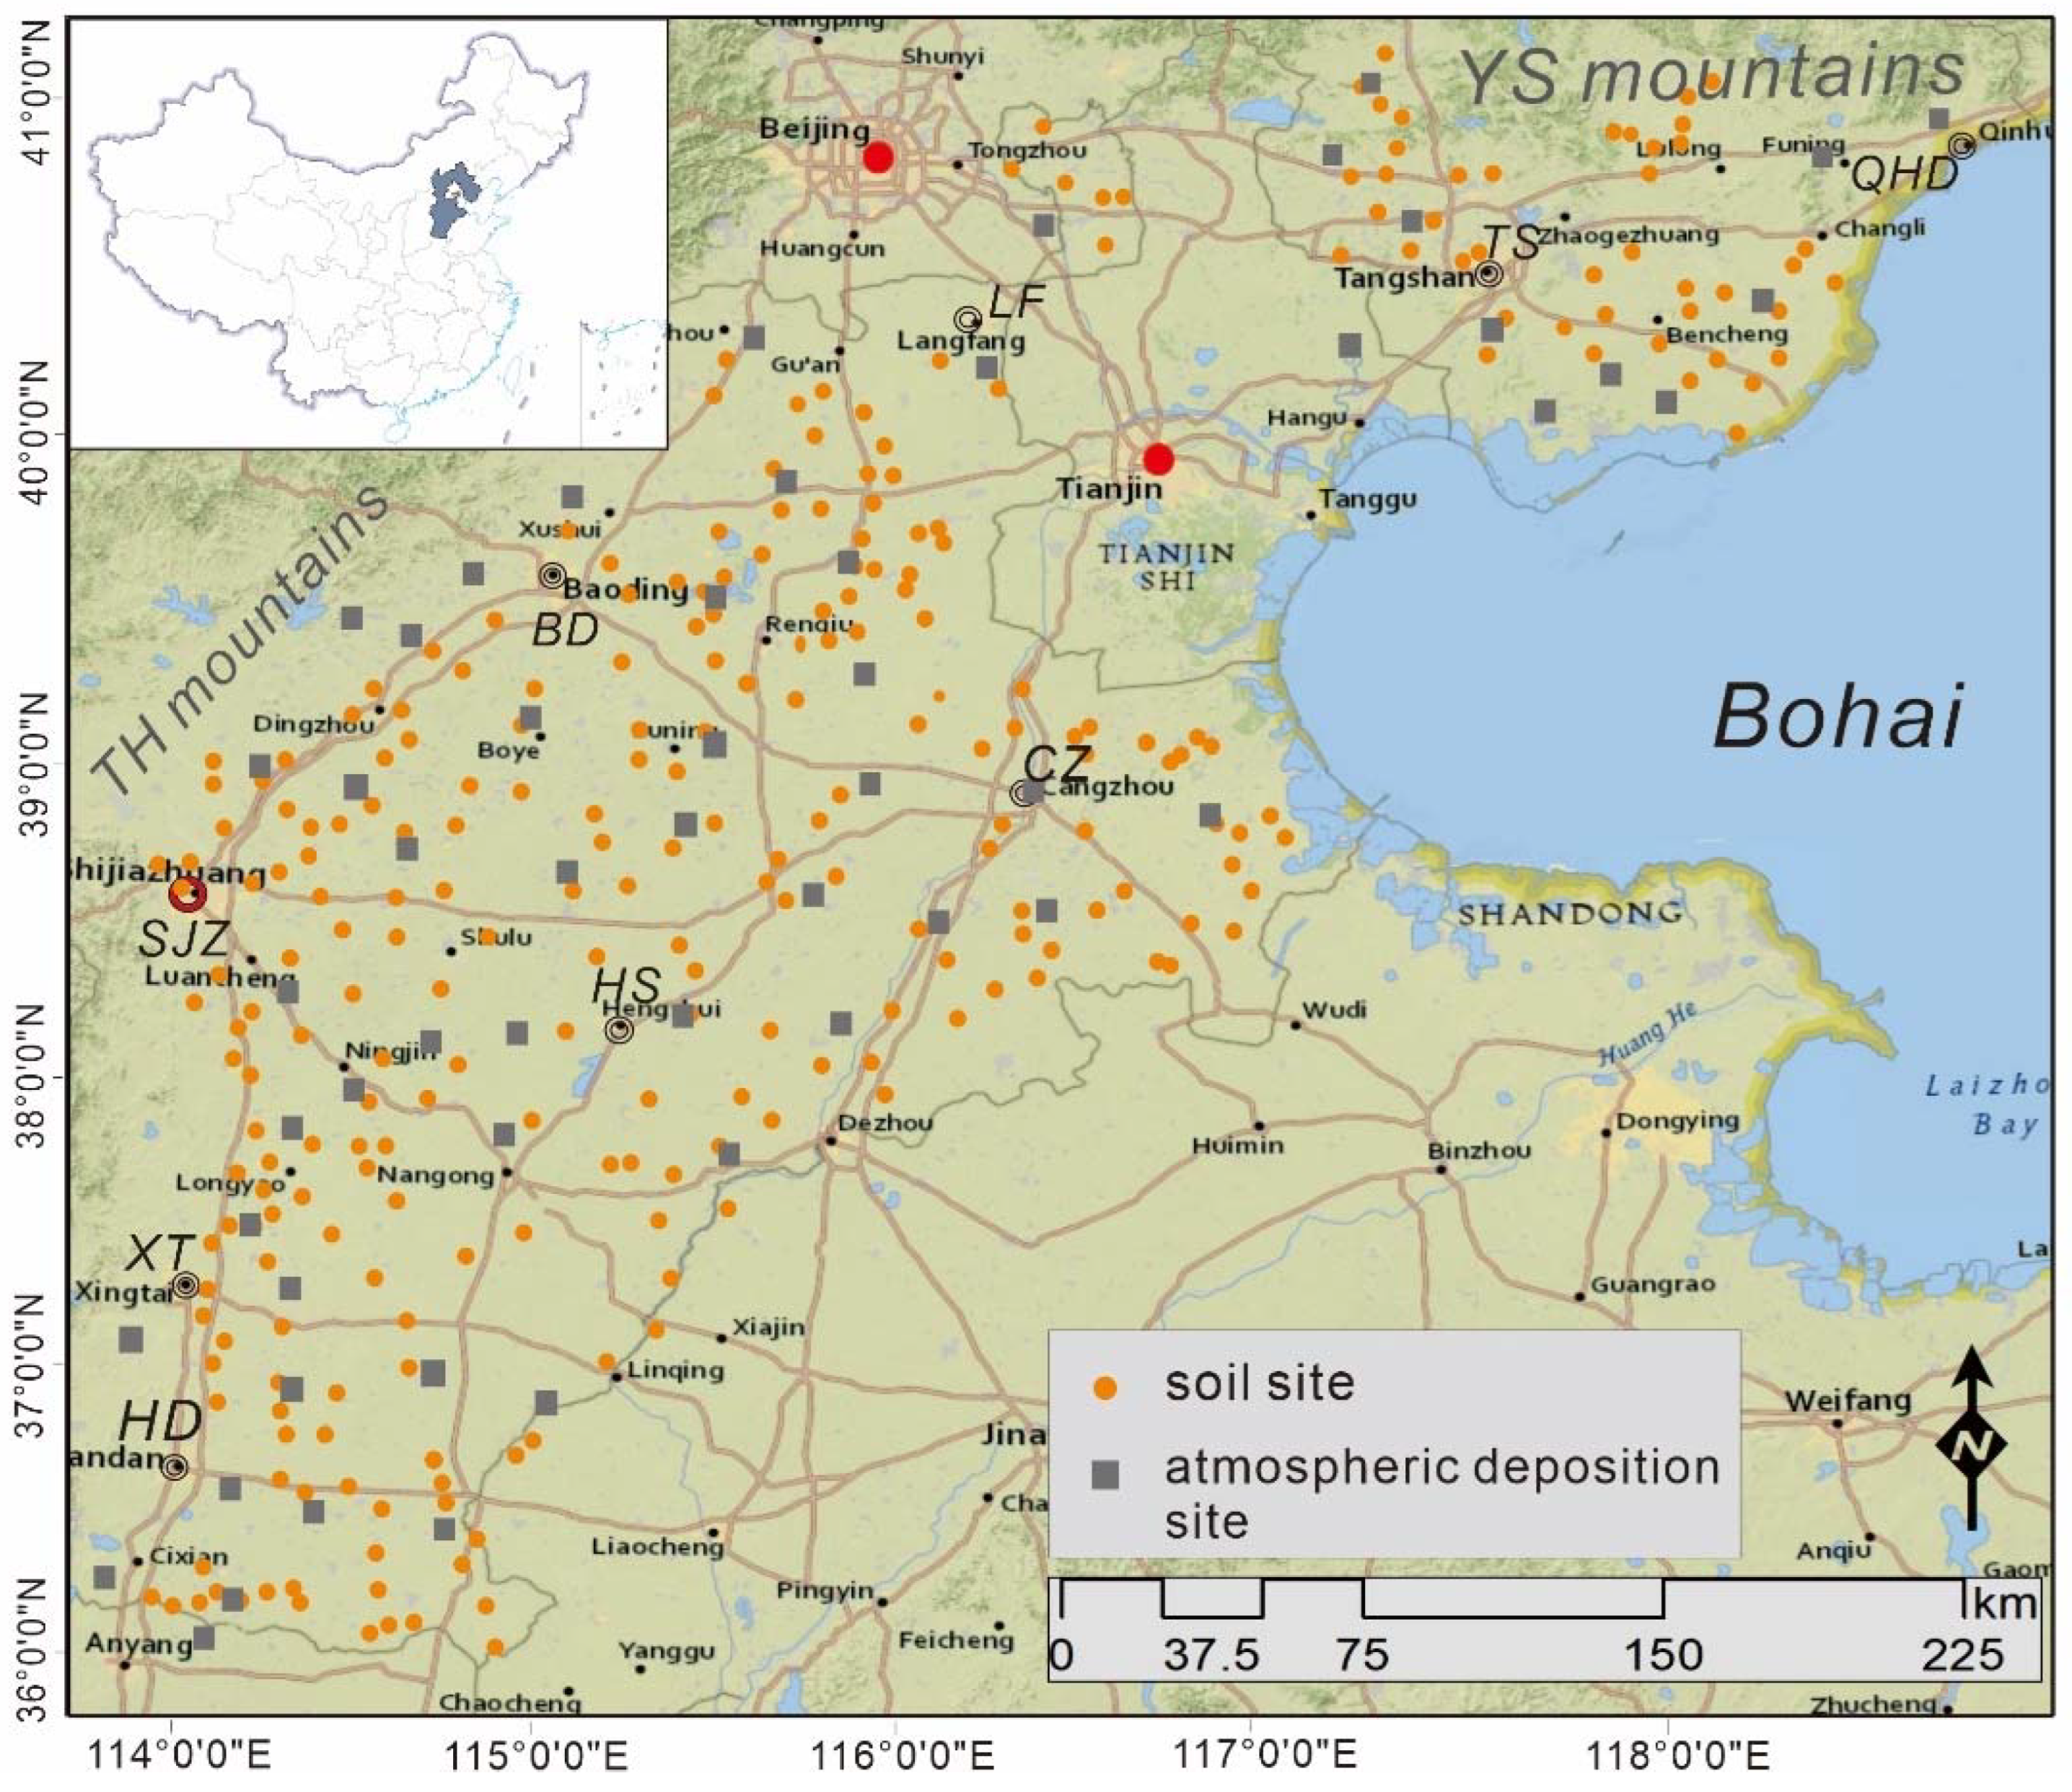
2.1. Study Area
2.2. Sample Collection and Treatment
2.2.1. Soil Samples
2.2.2. Atmospheric Deposition
2.2.3. Chemical Fertilizer
2.2.4. Irrigation Water
2.3. Chemical Analysis and Quality
2.4. Statistical Analysis
2.5. Pollution Assessment Methodology
2.5.1. Index of Geoaccumulation
2.5.2. Potential Ecological Risk Index (RI)
2.6. Input Flux Analysis
2.6.1. Atmospheric Deposition
2.6.2. Irrigation Water
2.6.3. Fertilizer
2.7. Source Apportionment Methodology
3. Results and Discussion
3.1. Soil HM Concentration and Pollution Indices
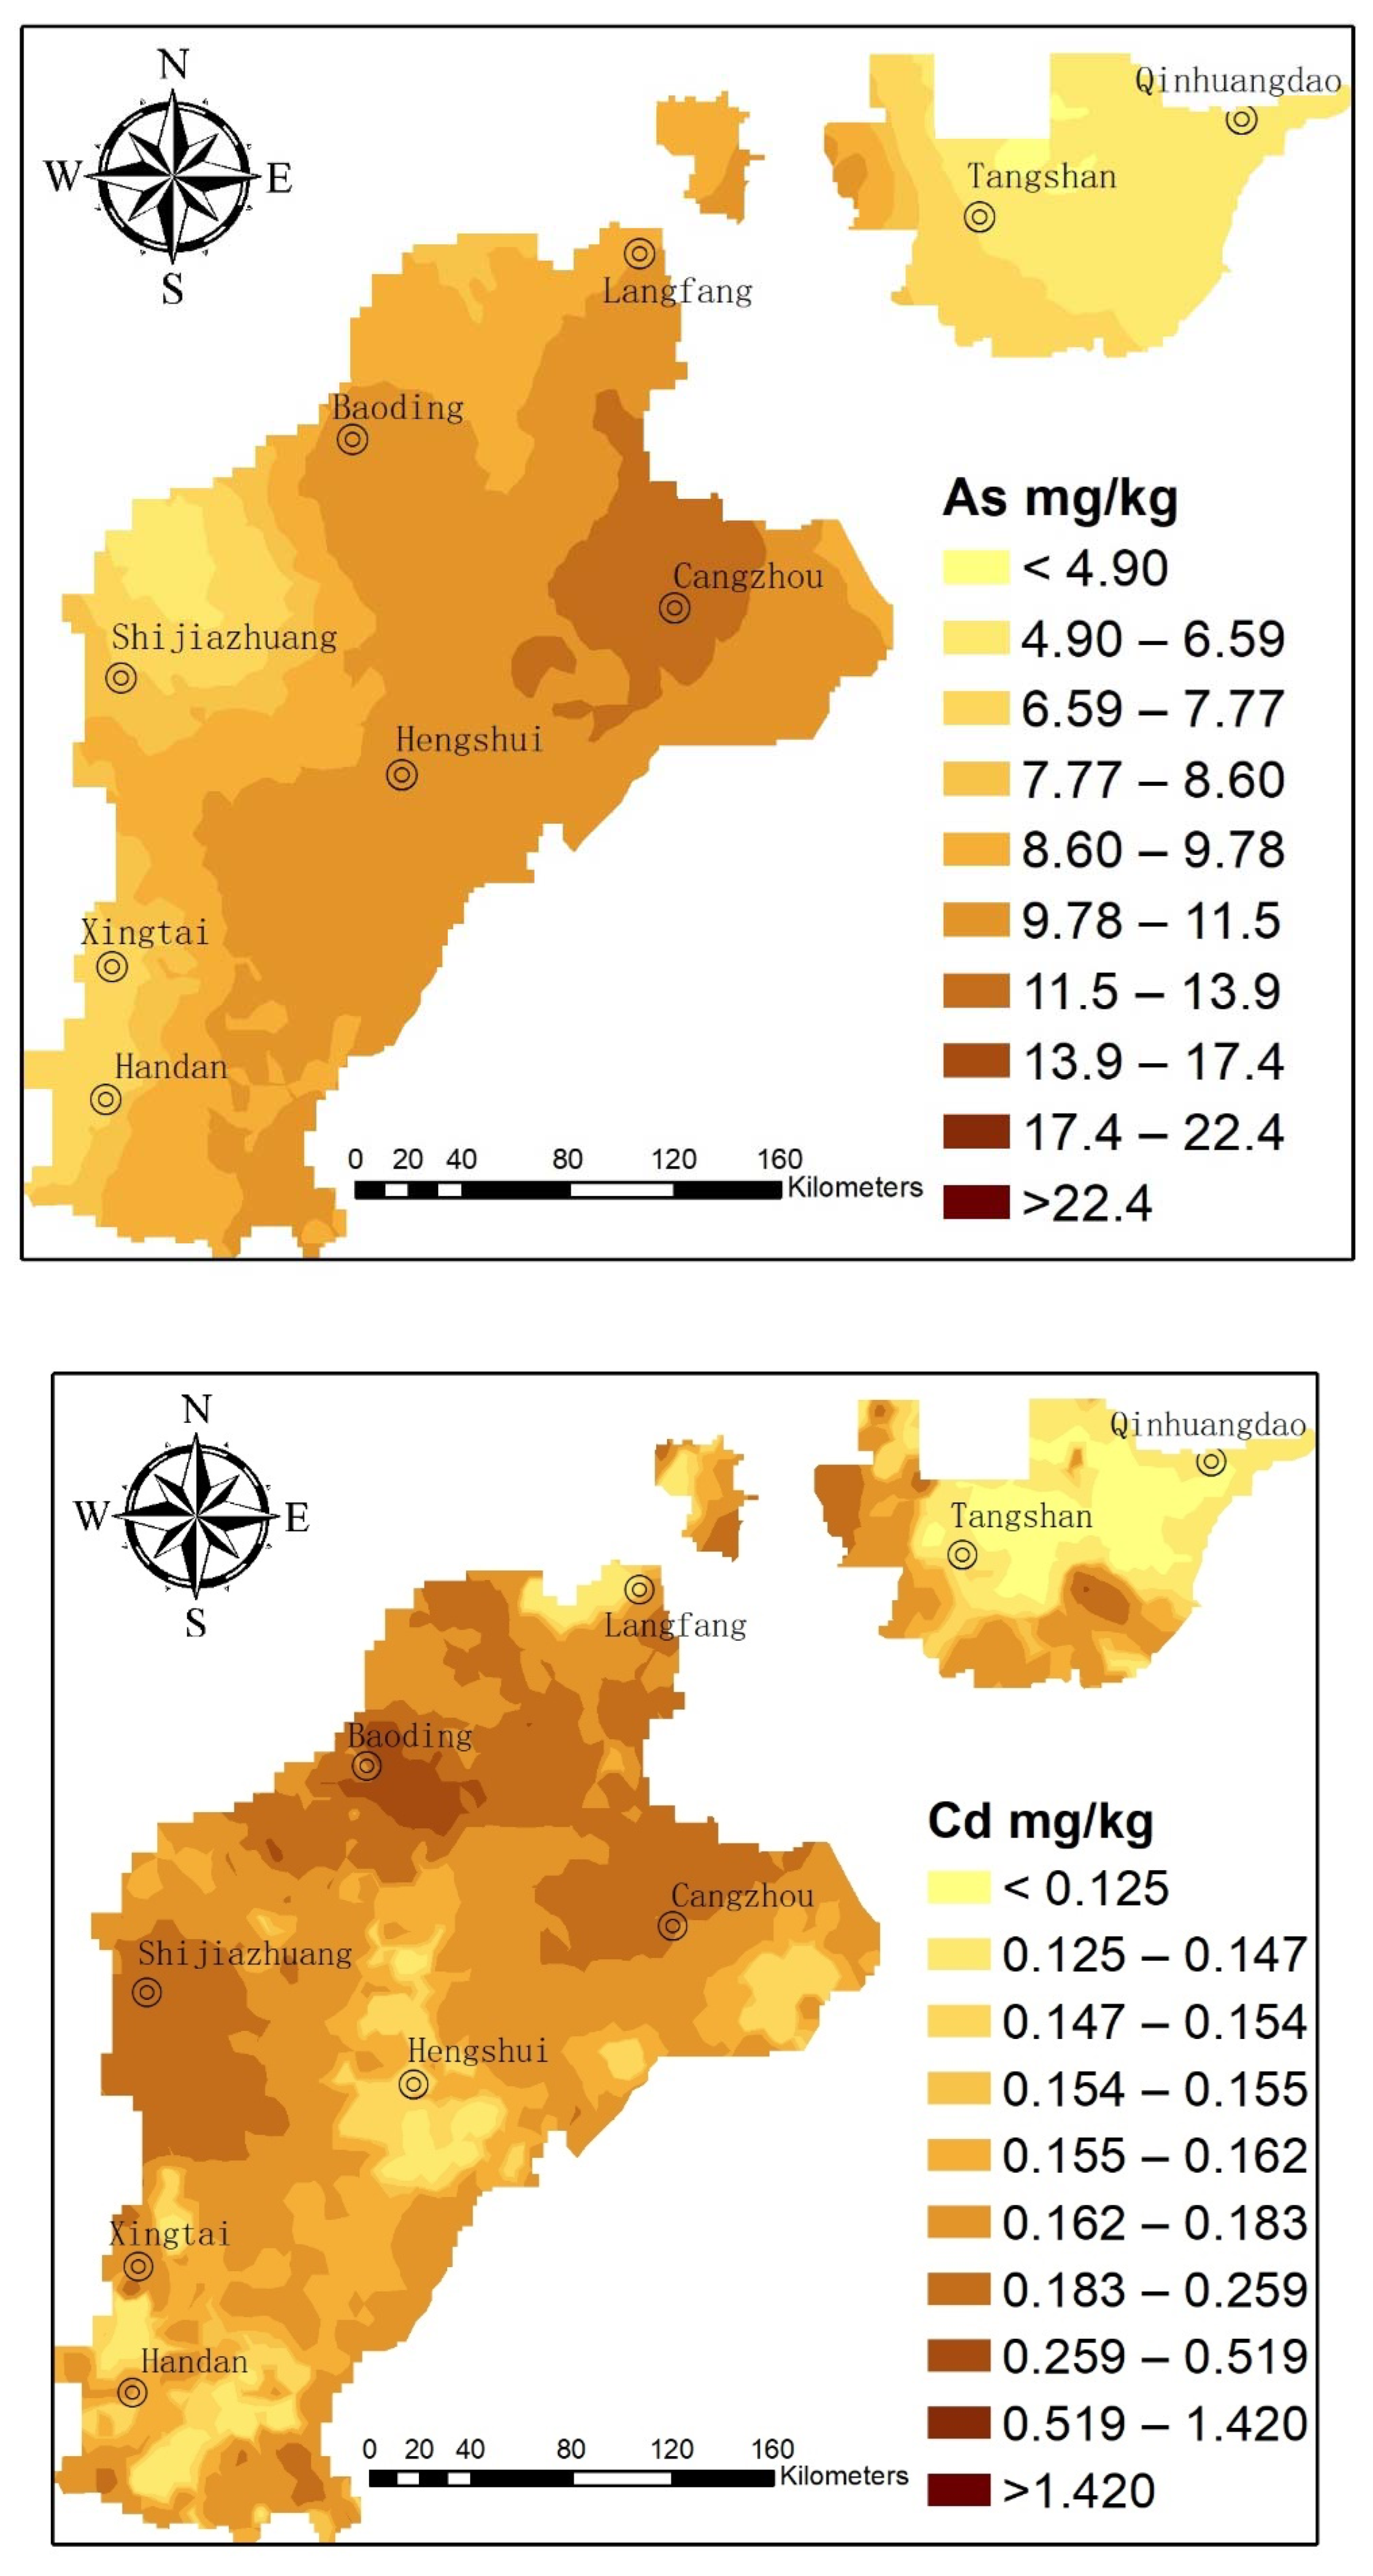
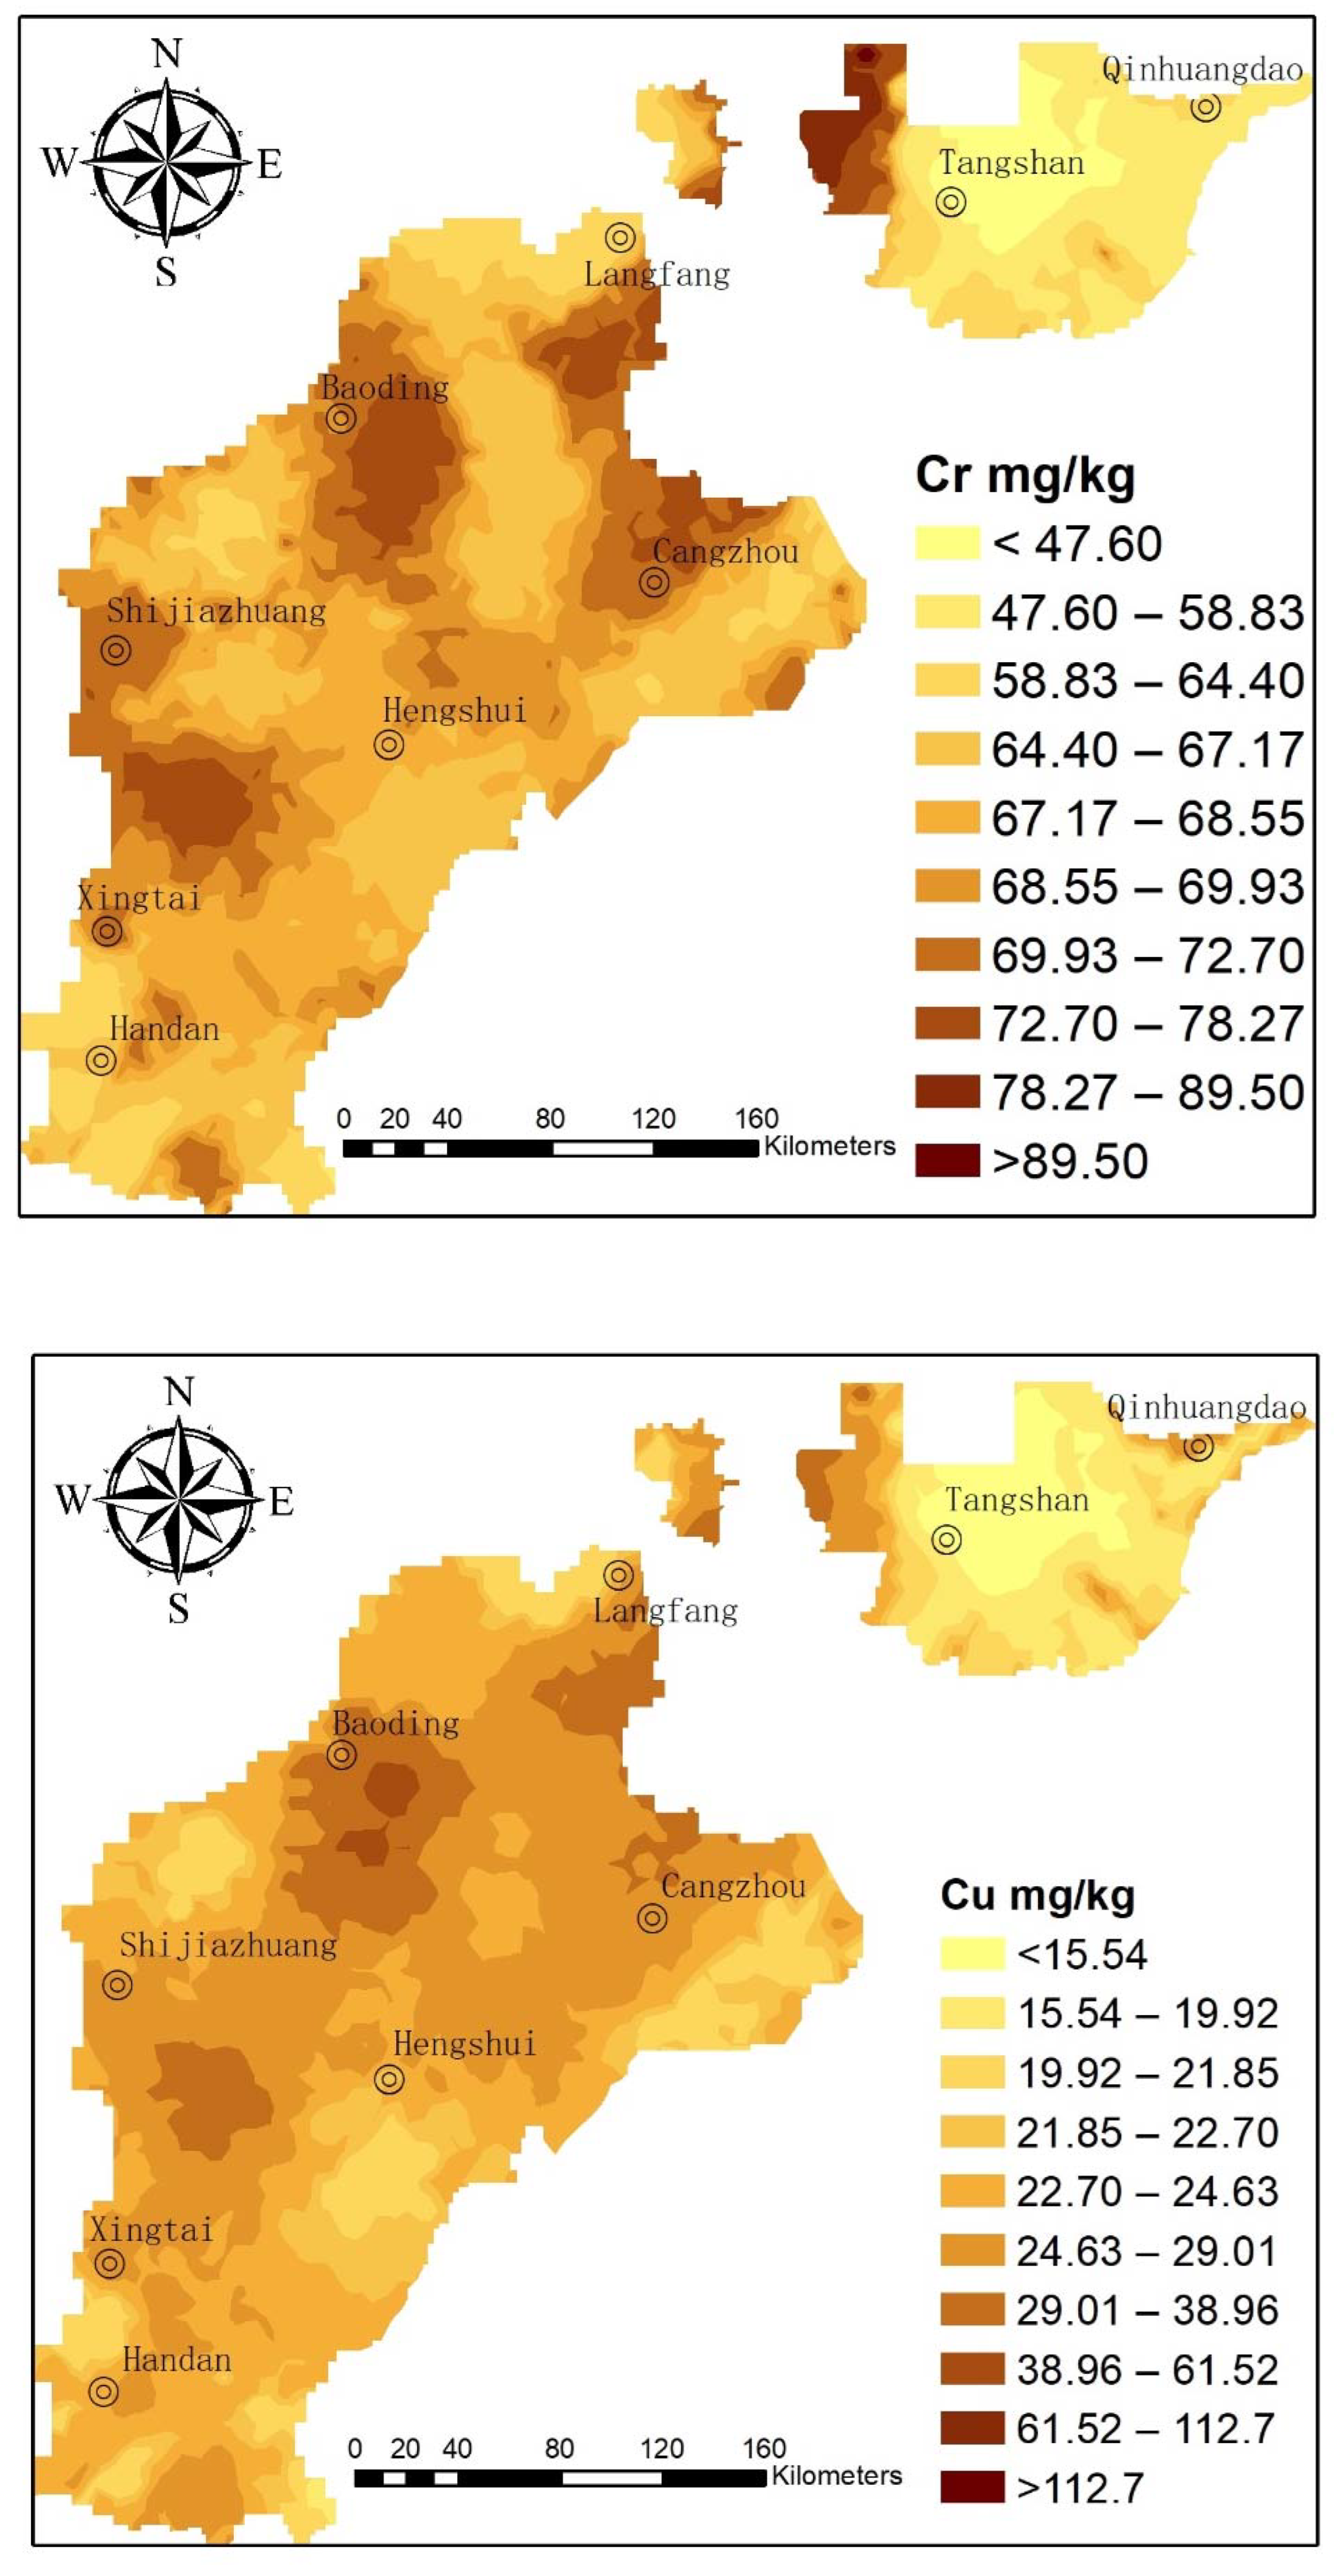
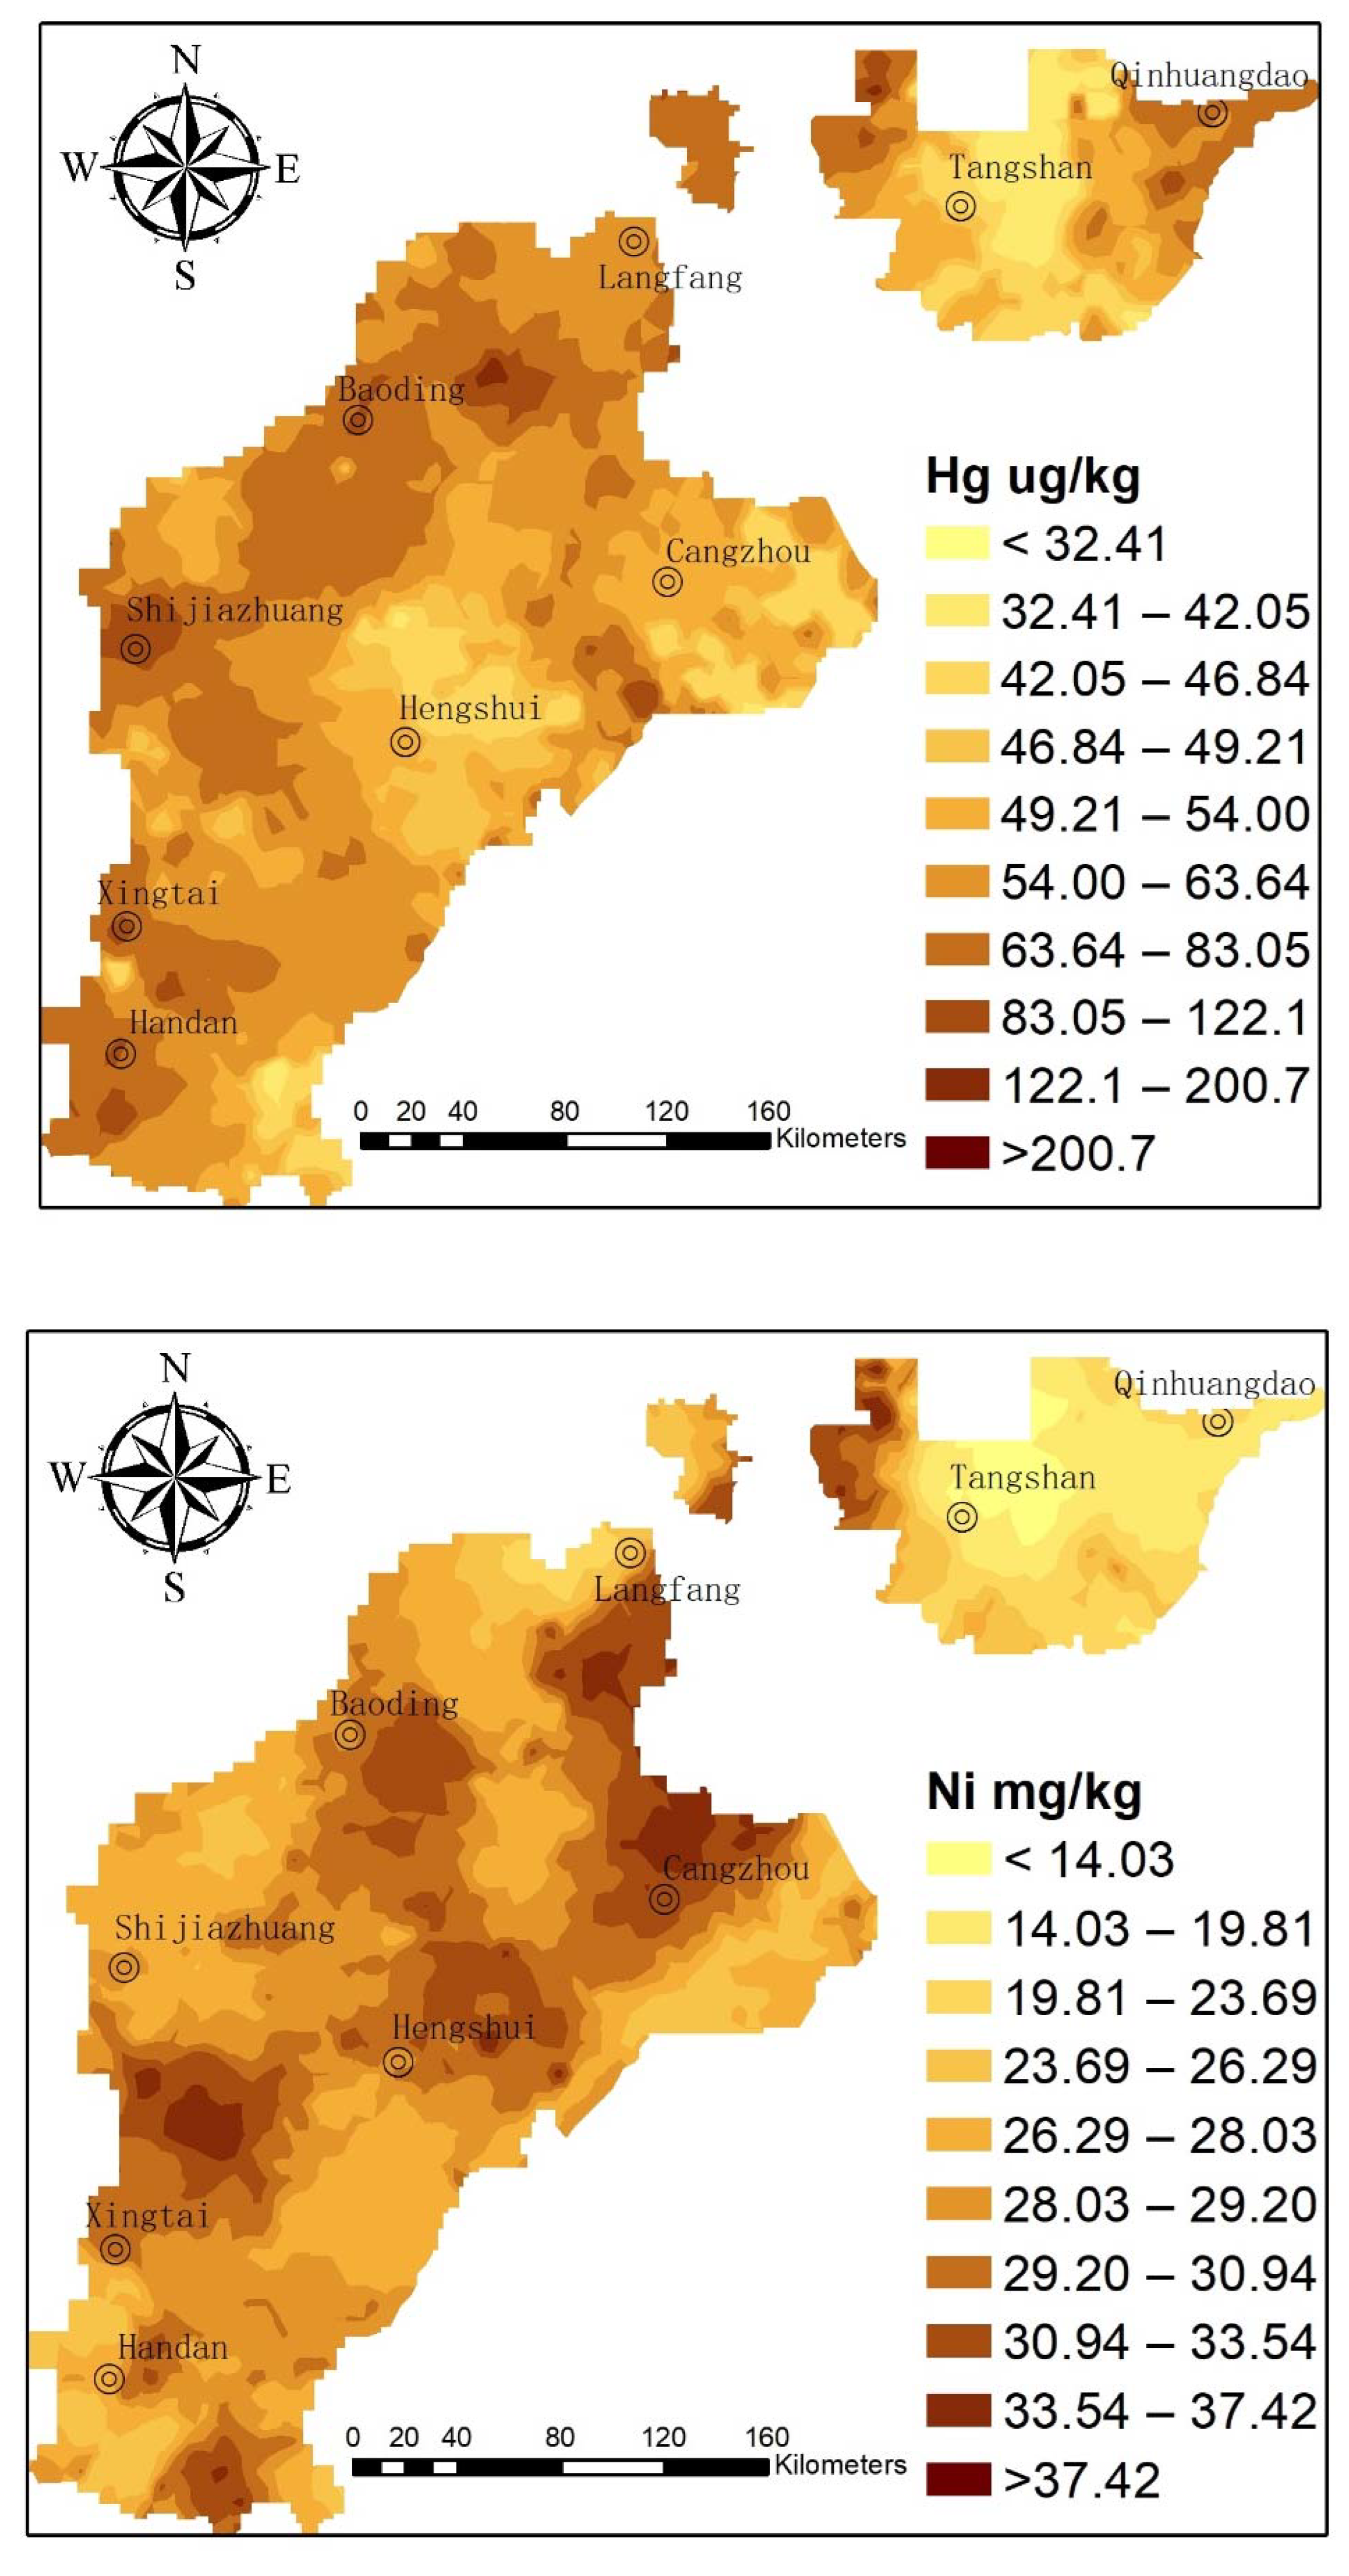
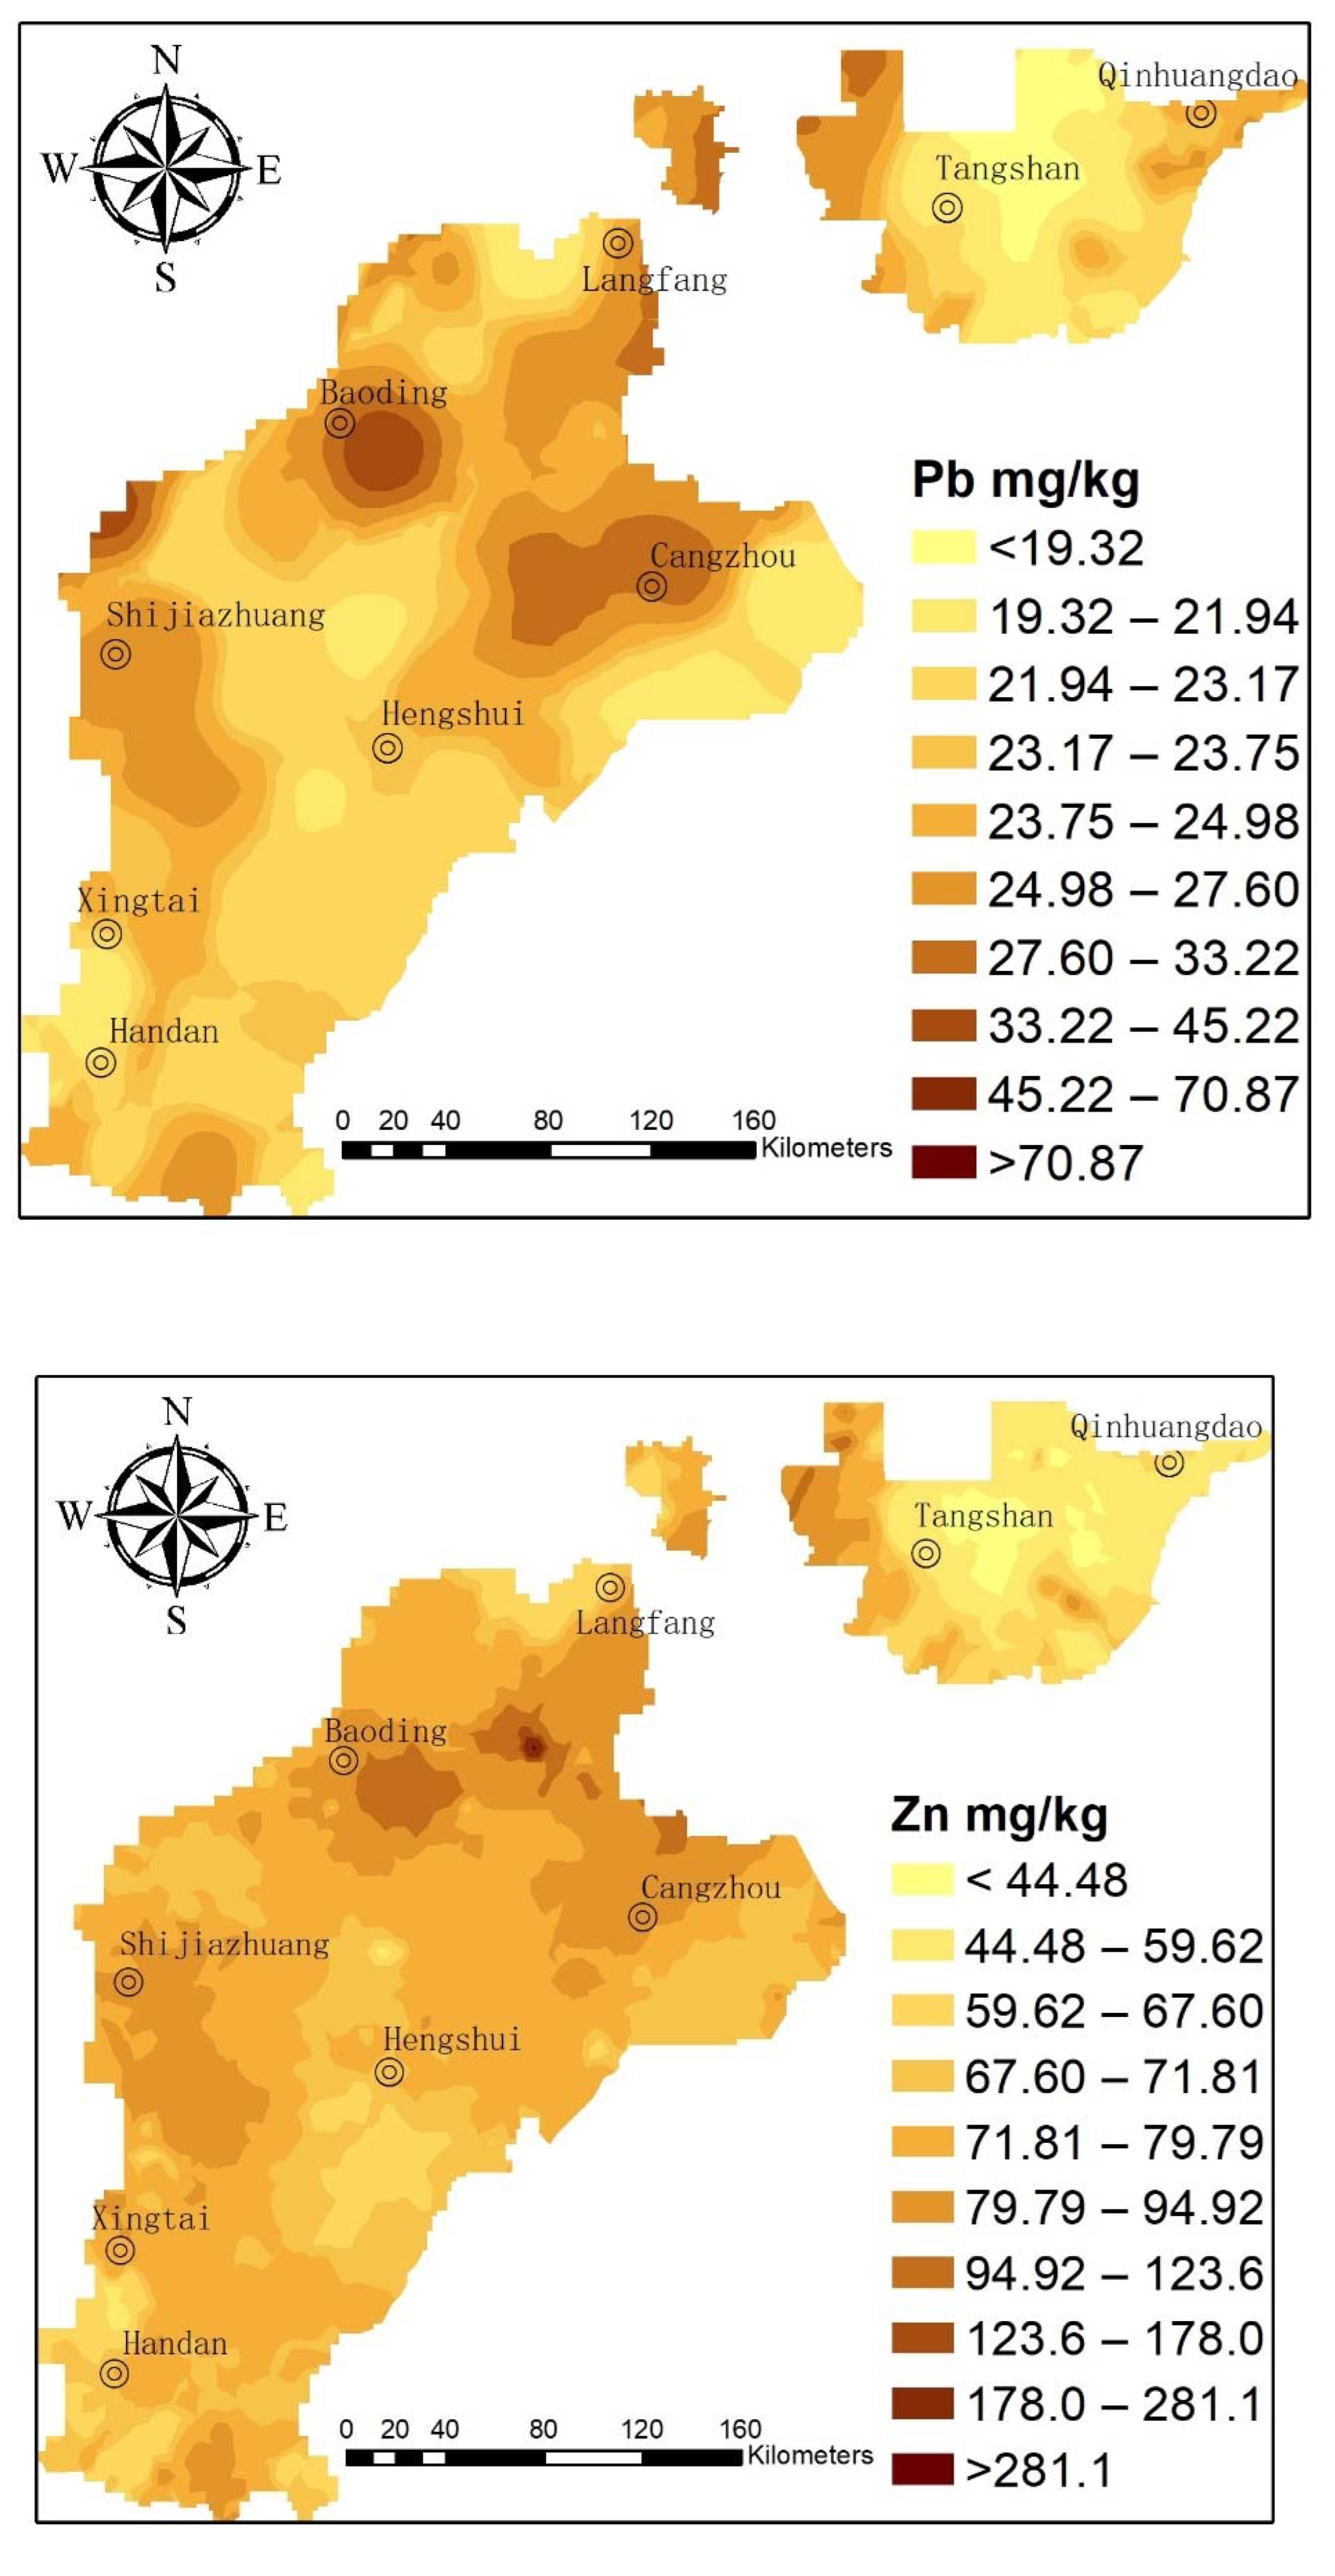
3.2. Soil HM Spatial Distribution
3.2.1. As
3.2.2. Ni
3.2.3. Cr
3.2.4. Pb
3.2.5. Cu
3.2.6. Hg
3.2.7. Cd
3.2.8. Zn
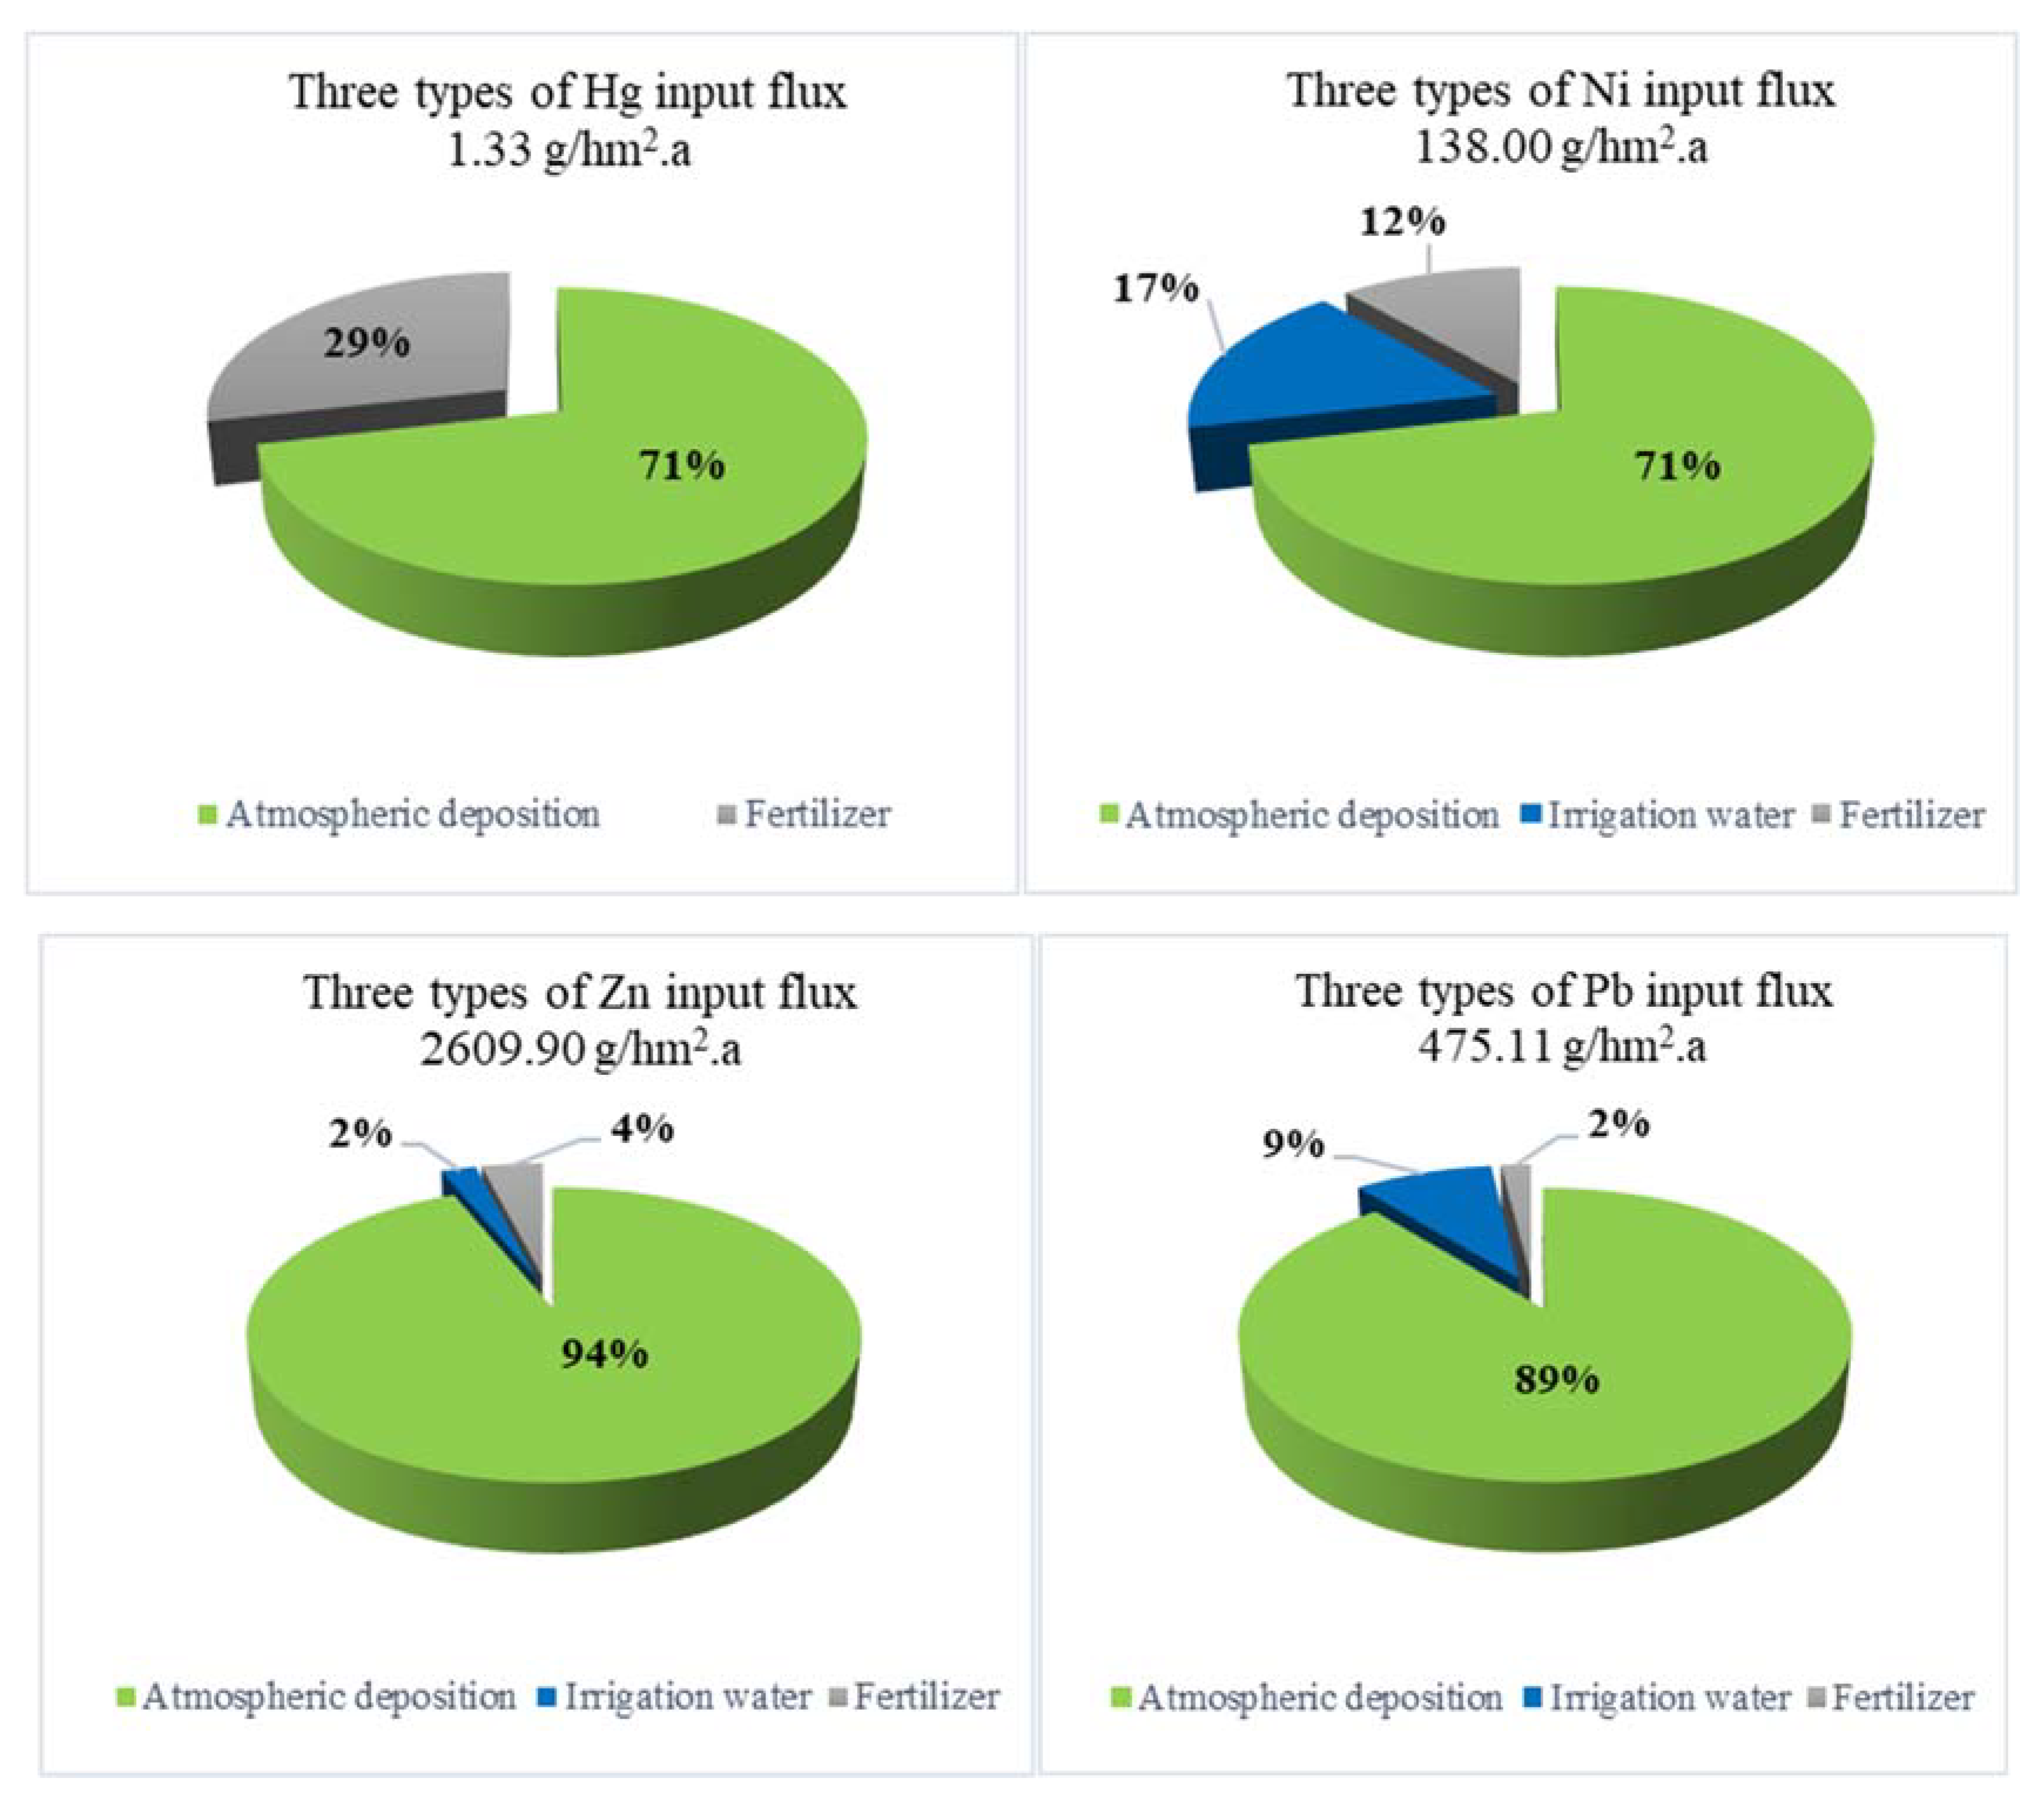
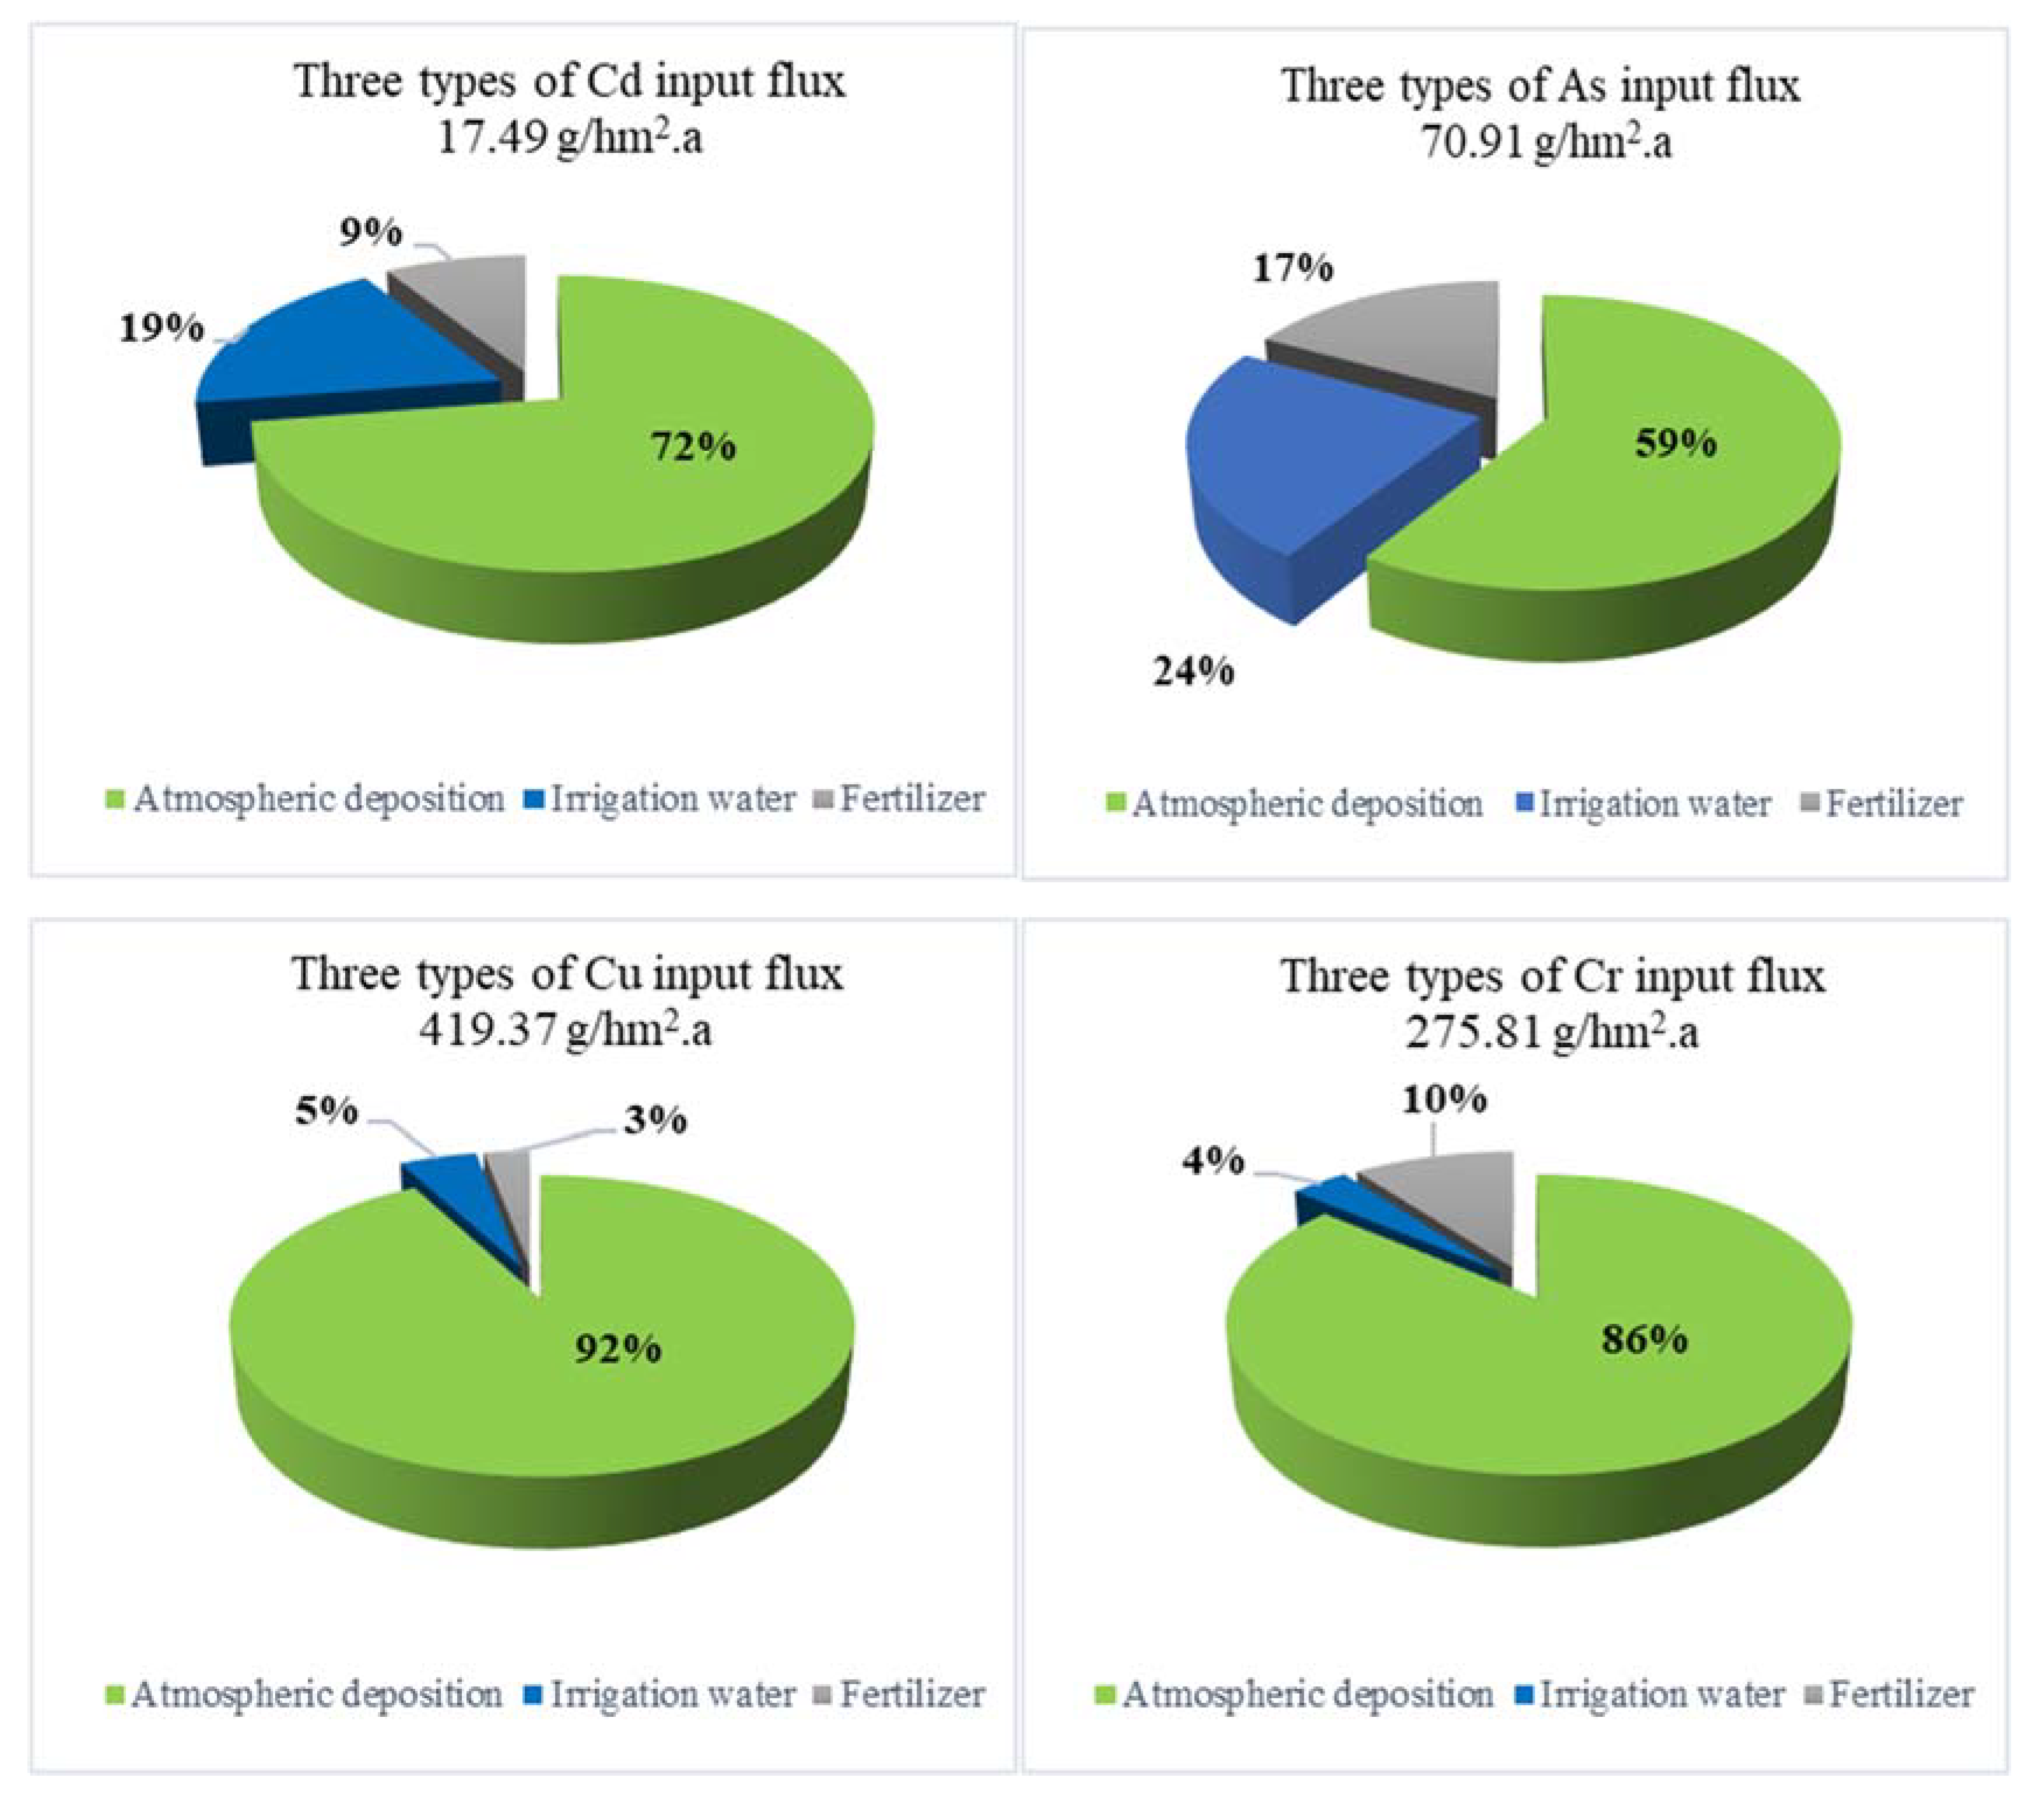
3.3. Input Flux
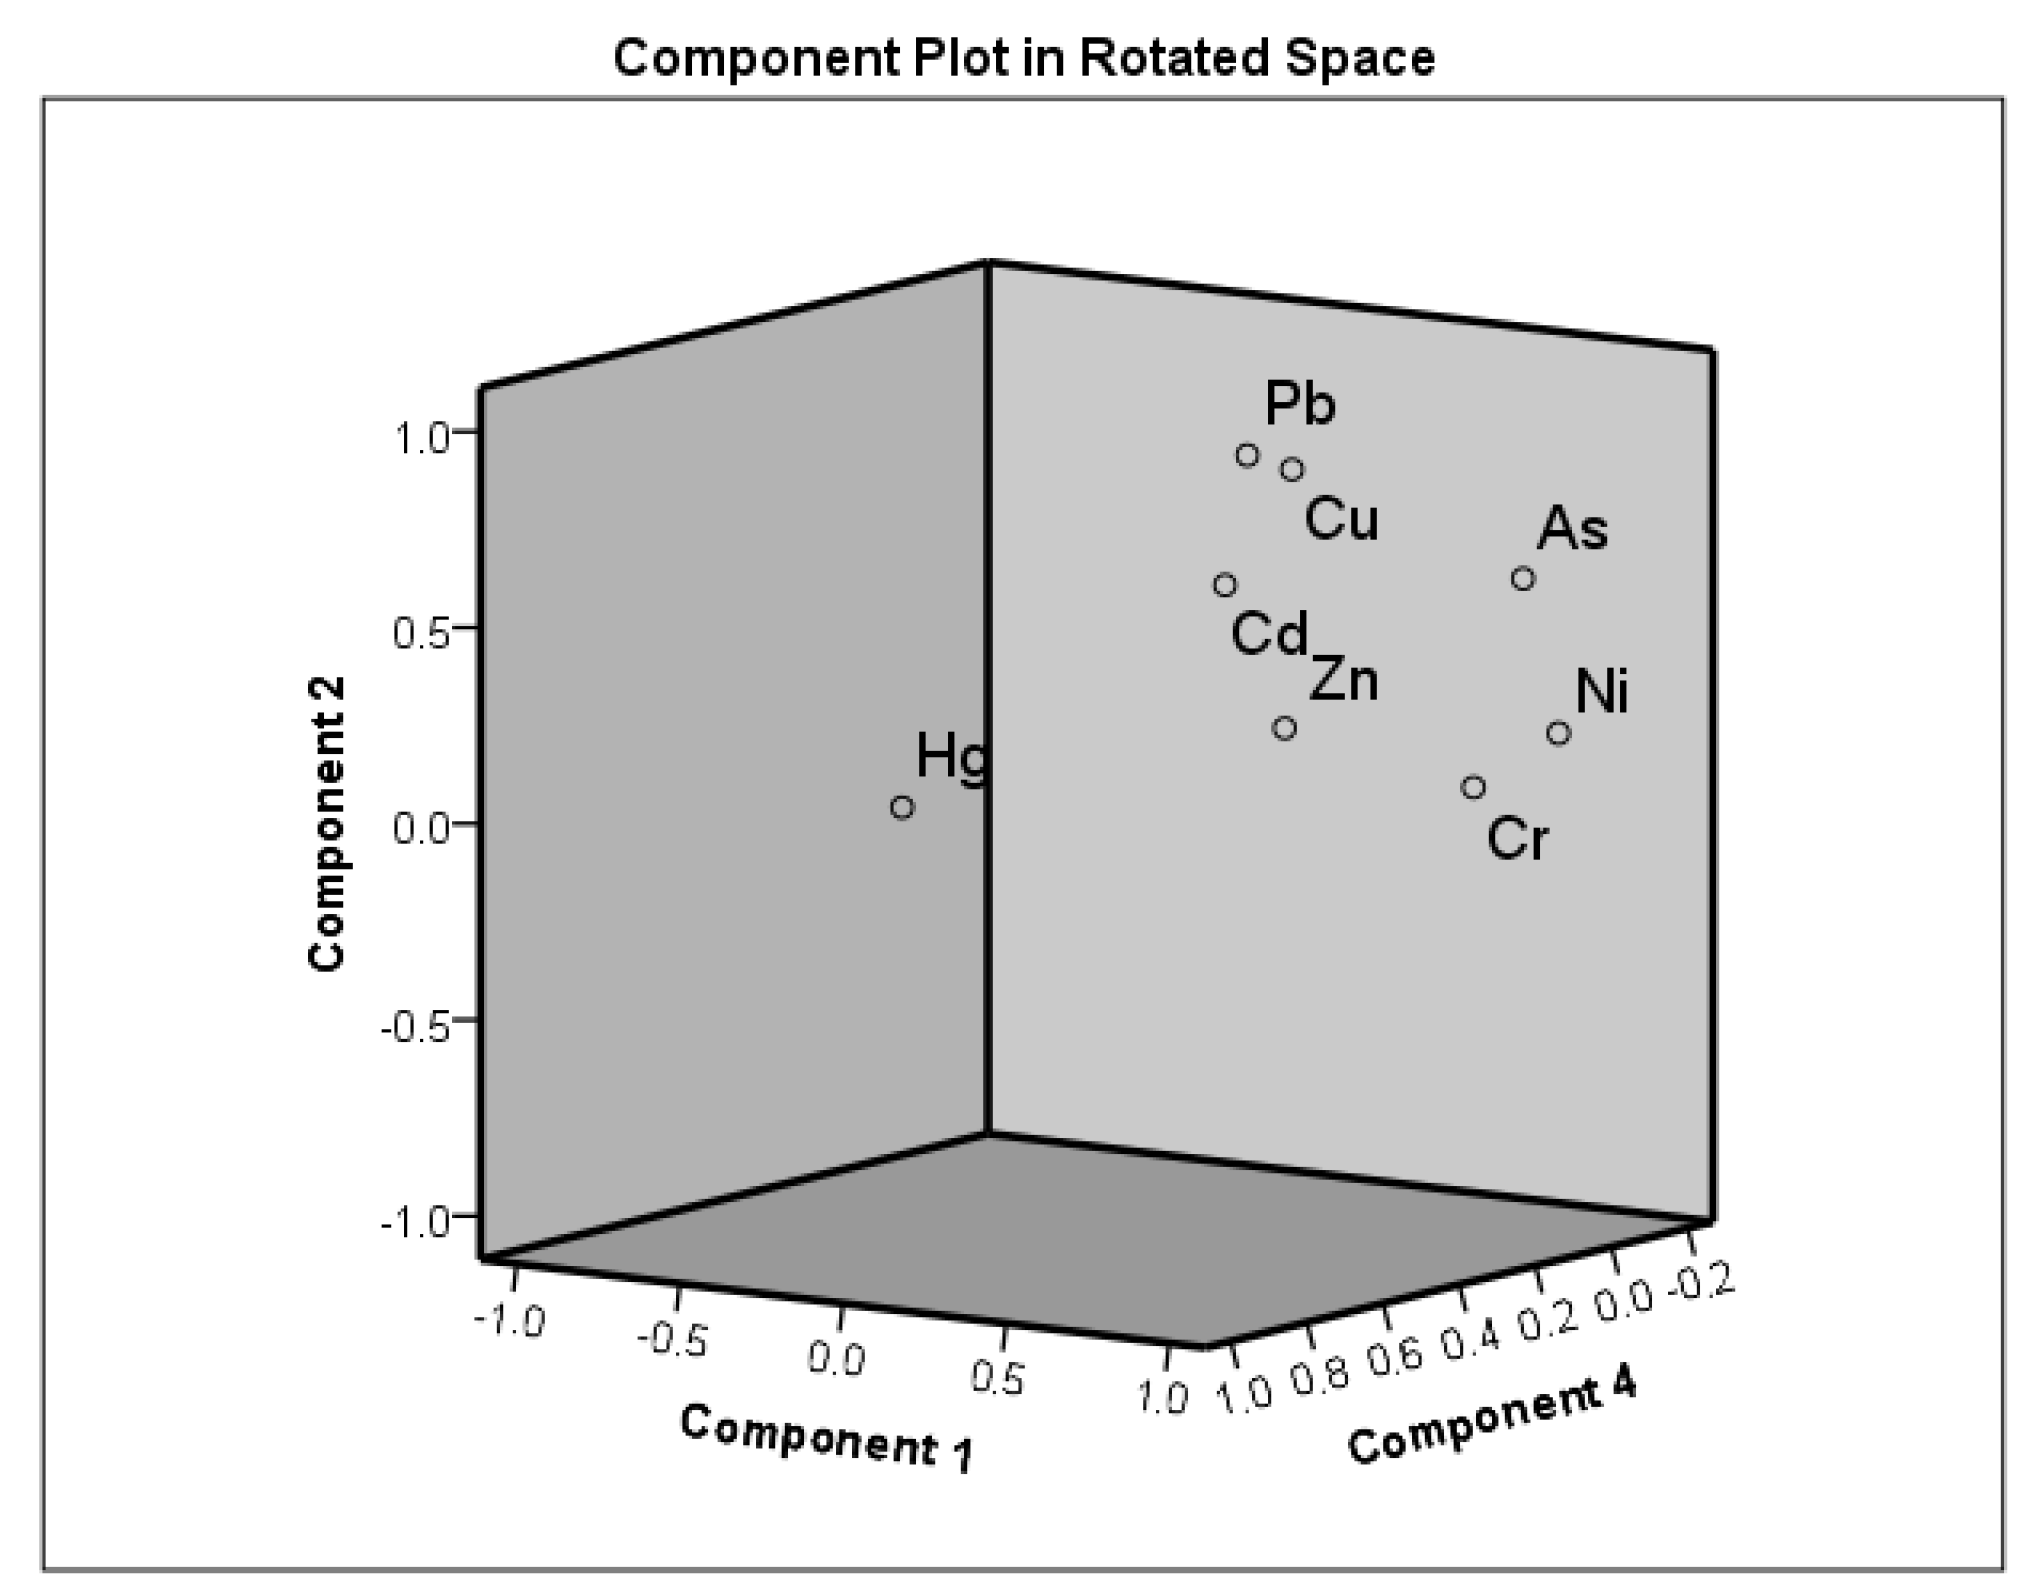
3.4. Correlation Coefficient
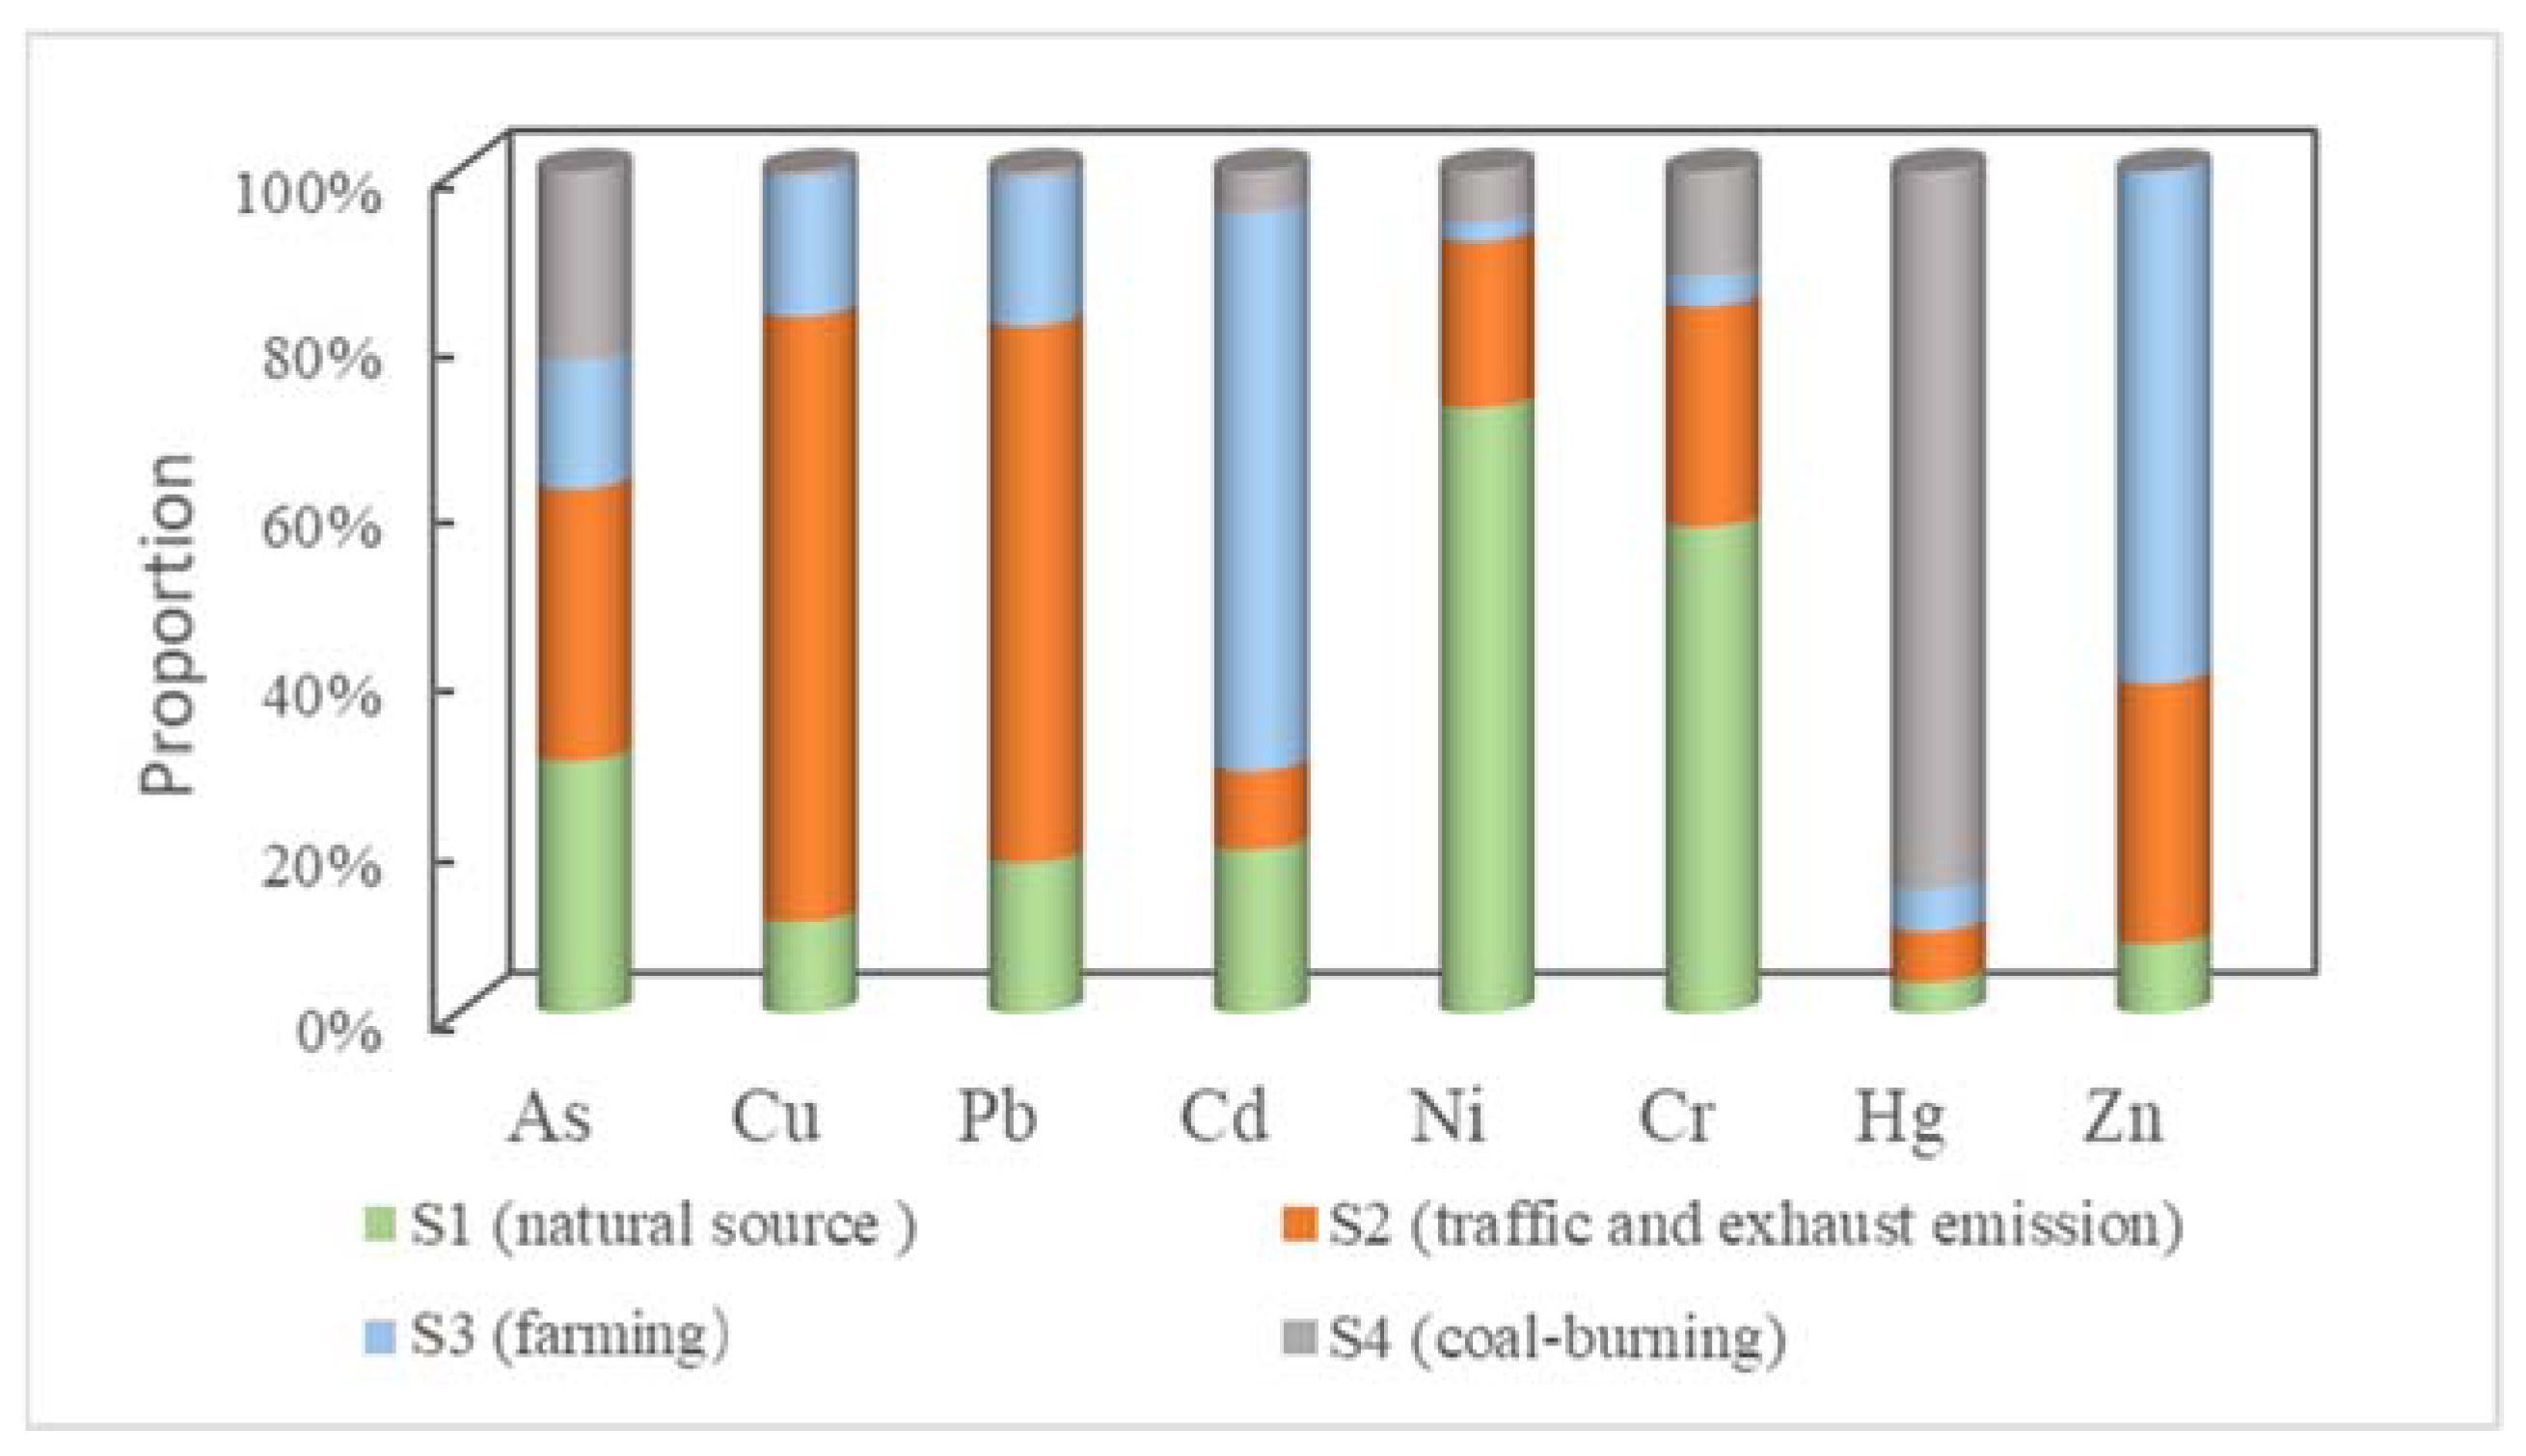
3.5. Contribution Rate
3.5.1. FA
3.5.2. Source Distribution
3.6. Management
3.6.1. Fertilizer
3.6.2. Coal Combustion
3.6.3. Irrigation Water
3.6.4. Vehicular Emissions
4. Conclusions
Supplementary Materials
Author Contributions
Funding
Institutional Review Board Statement
Informed Consent Statement
Conflicts of Interest
References
- Kumar, S.S.; Kumar, A.; Singh, S.; Malyan, S.K.; Baram, S.; Sharma, J.; Pugazhendhi, A. Industrial wastes: Fly ash, steel slag and phosphogypsum-Potential candidates to mitigate greenhouse gas emissions from paddy fields. Chemosphere 2019, 241, 124824. [Google Scholar] [CrossRef] [PubMed]
- Zhang, W.L.; Ji, H.J.; Kolbe, H.; Xu, A.G. Estimation of agricultural non-point source pollution in China and the alleviating strategies Ⅱ. Status of agricultural non-point source pollution and the alleviating strategies in European and American countries. Sci. Agric. Sinica 2004, 37, 1018–1025. [Google Scholar]
- Sun, B.; Zhang, L.; Yang, L.; Zhang, F.; Norse, D.; Zhu, Z. Agricultural non-point source pollution in China: Causes and mitigation measures. Ambio 2012, 41, 370–379. [Google Scholar] [CrossRef] [PubMed] [Green Version]
- Quan, W.; Yan, L. Effects of agricultural non-point source pollution on eutrophica-tion of water body and its control measure. Acta Ecol. Sinica. 2002, 22, 291–299. [Google Scholar]
- Guo, W.; Fu, Y.; Ruan, B.; Ge, H.; Zhao, N. Agricultural non-point source pollution in the Yongding River Basin. Ecol. Indic. 2014, 36, 254–261. [Google Scholar] [CrossRef]
- MEP; MLR. Report on the National General Survey of Soil Contamination in China. 2014. Available online: http://english.www.gov.cn/policies/latest_releases/2014/08/23/content_281474983026954.htm (accessed on 13 January 2022).
- Chinese Environmental Protection Administration (CEPA). Environmental Quality Standard for Soils (GB15618-2018); Standards Press of China: Beijing, China, 2018; Available online: https://www.chinesestandard.net/PDF/English.aspx/GB15618-2018 (accessed on 13 January 2022).
- Chinese Environmental Protection Administration (CEPA). Measures for the Management of Soil Environment on Agricultural Land (Trial); Standards Press of China: Beijing, China, 2017; Available online: https://www.iisd.org/system/files/publications/financing-models-soil-remediation-china.pdf (accessed on 13 January 2022).
- Wang, C.; Zhang, S.; Liu, J.; Xing, Y.; Li, M.; Liu, Q. Pollution level and risk assessment of heavy metals in a metal smelting area of Xiong’an New Area. Geol. China 2021, 48, 1697–1709. Available online: https://kns.cnki.net/kcms/detail/11.1167.P.20210301.1753.015.html (accessed on 13 January 2022).
- Cai, K.; Li, C. Street dust heavy metal pollution source apportionment and sustainable management in a typical city—Shijiazhuang, China. Int. J. Environ. Res. Public Health 2019, 16, 2625. [Google Scholar] [CrossRef] [Green Version]
- Shangguan, Y.; Cheng, B.; Zhao, L.; Hou, H.; Ma, J.; Sun, Z.J.; Huo, X.L. Distribution assessment and source identification using multivariate statistical analyses and artificial neutral networks for trace elements in agricultural soils in Xinzhou of Shanxi Province, China. Pedosphere 2018, 28, 542–554. [Google Scholar] [CrossRef]
- CSY. National Bureau of Statistics of China. In China Statistical Yearbook 2019; China Statistical Press: Beijing, China, 2019. [Google Scholar]
- Dong, T.X.; Yang, H.X.; Li, H.F.; Qiao, Y.H.; Su, D.C. Accumulation Characteristics of heavy metals in the soil with wheat-corn rotation system in north China. J. Agric. Resour. Environ. 2014, 31, 355–365. [Google Scholar]
- Usery, E.L.; Finn, M.P.; Scheidt, D.J.; Ruhl, S.; Beard, T.; Bearden, M. Geospatial data resampling and resolution effects on watershed modeling: A case study using the agricultural non-point source pollution model. J. Geogr. Syst. 2004, 6, 289–306. [Google Scholar] [CrossRef]
- Yang, S.; Dong, G.; Zheng, D.; Xiao, H.; Gao, Y.; Lang, Y. Coupling Xinanjiang model and SWAT to simulate agricultural non-point source pollution in Songtao watershed of Hainan, China. Ecol. Model. 2011, 222, 3701–3717. [Google Scholar] [CrossRef]
- Mohammed, H.; Yohannes, F.; Zeleke, G. Validation of agricultural non-point source (AGNPS) pollution model in Kori watershed, South Wollo, Ethiopia. Int. J. Appl. Earth Obs. 2004, 6, 97–109. [Google Scholar] [CrossRef]
- Cai, M.; Li, H.E.; Zhuang, Y.T.; Wang, Q.H. Application of modified export coefficient method in polluting load estimation of non-point source pollution. J. Hydraul. Eng. 2004, 7, 40–45. [Google Scholar]
- Hou, Q.; Yang, Z.; Ji, J.; Yu, T.; Chen, G.; Li, J.; Yuan, X. Annual net input fluxes of heavy metals of the agro-ecosystem in the Yangtze River delta, China. J. Geochem. Explor. 2014, 139, 68–84. [Google Scholar] [CrossRef]
- Guo, H.; Wang, T.; Louie, P.K.K. Source apportionment of ambient non-methane hydrocarbons in Hong Kong: Application of a principal component analysis/absolute principal component scores (PCA/APCS) receptor model. Environ. Pollut. 2004, 129, 489–498. [Google Scholar] [CrossRef]
- Cai, K.; Li, C.; Na, S. Spatial distribution, pollution source, and health risk assessment of heavy metals in atmospheric depositions: A case study from the sustainable city of Shijiazhuang, China. Atmosphere 2019, 10, 222. [Google Scholar] [CrossRef] [Green Version]
- Men, C.; Liu, R.; Xu, F.; Wang, Q.; Guo, L.; Shen, Z. Pollution characteristics, risk assessment, and source apportionment of heavy metals in road dust in Beijing, China. Sci. Total Environ. 2018, 612, 138–147. [Google Scholar] [CrossRef]
- Othman, M.; Latif, M.T. Pollution characteristics, sources, and health risk assessments of urban road dust in Kuala Lumpur City. Environ. Sci. Pollut. Res 2020, 27, 11227–11245. [Google Scholar] [CrossRef]
- Cai, K.; Song, Z. Cycling and total risks of multiple as fractions in the Beijing–Tianjin–Hebei area on the agricultural plain, China. Ecotox. Environ. Safe 2020, 190, 110097. [Google Scholar] [CrossRef]
- Technical Standard of Geological Survey of China Geological Survey. Specification for Multi-Objective Regional Geochemical Survey (1:250000) (DD2005-01); Standard Press of China: Beijing, China, 2005. [Google Scholar]
- Standard Examination Methods for Drinking Water—Metal Parameters. GB/T5750.6-2006. National Health Commission of the People’s Republic of China. Available online: http://www.nhc.gov.cn/wjw/pgw/201805/e3b8ea5eb9a345df8b74ee93087feccd.shtml (accessed on 13 January 2022).
- Geological and Mineral Industry Standards of the People’s Republic of China (DZ/T0279-2016). Analysis Methods for Regional Geochemical Sample. Ministry of Natural Resources of the People’s Republic of China. Available online: http://g.mnr.gov.cn/201701/t20170123_1430106.html (accessed on 13 January 2022).
- Muller, G. Index of geoaccumulation in sediments of the Rhine River. Geojournal 1969, 2, 108–118. [Google Scholar]
- Hasan, A.B.; Kabir, S.; Reza, A.H.M.S.; Zaman, M.N.; Ahsan, A.; Rashid, M. Enrichment factor and geo-accumulation index of trace metals in sediments of the ship breaking area of Sitakund Upazilla (Bhatiary-Kumira), Chittagong, Bangladesh. J. Geochem. Explor. 2013, 125, 130–137. [Google Scholar] [CrossRef]
- Chinese Environmental Protection Administration (CEPA). Elemental Background Values of Soils in China; Environmental Science Press of China: Beijing, China, 1990. [Google Scholar]
- Hakanson, L. An ecological risk index for aquatic pollution control. A sedimentological approach. Water Res. 1980, 14, 975–1001. [Google Scholar] [CrossRef]
- Mihankhah, T.; Saeedi, M.; Karbassi, A. A comparative study of elemental pollution and health risk assessment in urban dust of different land-uses in Tehran’s urban area. Chemosphere 2020, 241, 124984. [Google Scholar] [CrossRef]
- Yi, K.; Fan, W.; Chen, J.; Jiang, S.; Huang, S.; Peng, L.; Luo, S. Annual input and output fluxes of heavy metals to paddy fields in four types of contaminated areas in Hunan Province, China. Sci. Total Environ. 2018, 634, 67–76. [Google Scholar] [CrossRef]
- Thurston, G.D.; Spengler, J.D. A quantitative assessment of source contributions to inhalable particulate matter pollution in metropolitan Boston. Atmos. Pollut. 1985, 19, 9–25. [Google Scholar] [CrossRef]
- Wang, C.; Yang, Z.; Zhong, C.; Ji, J. Temporal–spatial variation and source apportionment of soil heavy metals in the representative river–alluviation depositional system. Environ. Pollut. 2016, 216, 18–26. [Google Scholar] [CrossRef]
- Ministry of Ecology and Environment of the People’s Republic of China (MEE). Soil Environmental Quality–Risk Control Standard for Soil Contamination of Agricultural Land (GB15618-2018). Beijing, China, 2018. Available online: http://www.mee.gov.cn/ywgz/fgbz/bz/bzwb/trhj/201807/t20180703_446029.shtml (accessed on 13 January 2022).
- Zhou, Y.L.; Wang, Q.J.; Wang, C.W.; Liu, F.; Song, Y.T.; Guo, Z.J.; Yang, Z.B. Heavy metal pollution and cumulative effect of soil-crop system around typical enterprises in Xiong’an new district. Environ. Sci. 2021. [Google Scholar] [CrossRef]
- Shen, B.; Wang, X.; Zhang, Y.; Zhang, M.; Wang, K.; Xie, P.; Ji, H. The optimum pH and Eh for simultaneously minimizing bioavailable cadmium and arsenic contents in soils under the organic fertilizer application. Sci. Total Environ. 2020, 711, 135229. [Google Scholar] [CrossRef]
- Guo, Z.J.; Zhou, Y.L.; Wang, Q.L.; Wang, C.W.; Song, Y.T.; Liu, F.; Yang ZKong, M. Characteristics of soil heavy metal pollution and health risk in Xiong’an New District. China Environ. Sci. 2021, 41, 431–441. [Google Scholar]
- Guo, H.Q.; Yang, Z.H.; Li, H.L.; Ma, W.J.; Ren, J.F. Envrionmental quality and anthropogenic pollution assessment of heavy metals in topsoil of Hebei plain. Geol. China 2011, 38, 218–224. [Google Scholar]
- Cui, X.T.; Qin, Z.Y.; Luan, W.L.; Song, Z.F. Assessment of the heavy metal pollution and the potential ecological hazard in soil and plain area of Baoding City of hebei province. Geoscience 2014, 28, 523–530. [Google Scholar]
- Zhang, X.Z.; Wang, S.M.; Li, J.H. Research on the enrichment and origin of cadmium in soils in a coastal area of east Hebei Province. Earth Envrion. 2007, 35, 321–326. [Google Scholar]
- Huang, R.J.; Cheng, R.; Jing, M.; Yang, L.; Li, Y.; Chen, Q.; Zhang, R. Source-specific health risk analysis on particulate trace elements: Coal combustion and traffic emission as major contributors in wintertime Beijing. Environ. Sci. Technol. 2018, 52, 10967–10974. [Google Scholar] [CrossRef] [PubMed]
- Yang, S.; Yan, X.L.; Feng, Y.T. Spatial distribution and source identification of heavy metals in the farmland soil of the Caofeidian in Hebei Province. Acta Sci. Circumstantiae 2019, 39, 3064–3072. [Google Scholar]
- Luo, L.; Ma, Y.; Zhang, S.; Wei, D.; Zhu, Y. An inventory of trace element inputs to agricultural soils in China. J. Environ. Manag. 2009, 90, 2524–2530. [Google Scholar] [CrossRef]
- Zhang XZGuo HQLi, H.L. Distinguishing origins of elements in environmental geochemistry of Baiyangdian Billabong of Hebei Province, north China. Earth Sci. Front. 2008, 15, 90–96. [Google Scholar]
- Jiang, W.; Hou, Q.; Yang, Z.; Yu, T.; Zhong, C.; Yang, Y.; Fu, Y. Annual input fluxes of heavy metals in agricultural soil of Hainan Island, China. Environ. Sci. Pollut. Res. 2014, 21, 7876–7885. [Google Scholar] [CrossRef]
- Zeng, X.; Wang, Z.; Wang, J.; Guo, J.; Chen, X.; Zhuang, J. Health risk assessment of heavy metals via dietary intake of wheat grown in Tianjin sewage irrigation area. Ecotoxicology 2015, 24, 2115–2124. [Google Scholar] [CrossRef]
- Zhou, Q.; Tang, Y. Coal combustion on environment pollution in China. In Proceedings of the 2011 International Conference on Electrical and Control Engineering, Yichang, China, 16–18 September 2011; IEEE: Manhattan, NY, USA, 2011; pp. 1482–1486. [Google Scholar] [CrossRef]
- Zeng, T.; Sarofim, A.F.; Senior, C.L. Vaporization of arsenic, selenium and antimony during coal combustion. Combust. Flame 2001, 126, 1714–1724. [Google Scholar] [CrossRef]
- Tian, H.Z.; Qu, Y.P. Inventories of atmospheric arsenic emissions from coal combustion in China, 2005. Environ. Sci. 2009, 30, 956–962. [Google Scholar]
- Oyedele, D.J.; Asonugho, C.; Awotoye, O.O. Heavy metals in soil and accumulation by edible vegetables after phosphate fertilizer application. Electron. J. Environ. Agric. Food Chem. 2006, 5, 1446–1453. [Google Scholar]
- Cheraghi, M.; Lorestani, B.; Merrikhpour, H. Investigation of the effects of phosphate fertilizer application on the heavy metal content in agricultural soils with different cultivation patterns. Biol. Trace Elem. Res. 2012, 145, 87–92. [Google Scholar] [CrossRef] [PubMed]
- Atafar, Z.; Mesdaghinia, A.; Nouri, J.; Homaee, M.; Yunesian, M.; Ahmadimoghaddam, M.; Mahvi, A.H. Effect of fertilizer application on soil heavy metal concentration. Environ. Monit. Assess. 2010, 160, 83. [Google Scholar] [CrossRef] [PubMed]
- Zuo, H.; Ma, L.; Wang, Z.; Liu, J.; Ma, C. Research on fertilizer application technology for seedlings and its development trends. World For. Res. 2010, 23, 39–43. [Google Scholar]
- Jie, G.; Hua, G. Prospects on the technical innovation to increase fertilizer use efficiency. Trans. Chinese Soc. Agric. Eng. 2000, 2, 17–20. [Google Scholar]
- Streets, D.G.; Hao, J.; Wu, Y.; Jiang, J.; Chan, M.; Tian, H.; Feng, X. Anthropogenic mercury emissions in China. Atmos. Environ. 2005, 39, 7789–7806. [Google Scholar] [CrossRef] [Green Version]
- Hower, J.C.; Senior, C.L.; Suuberg, E.M.; Hurt, R.H.; Wilcox, J.L.; Olson, E.S. Mercury capture by native fly ash carbons in coal-fired power plants. Prog. Energy Combust. 2010, 36, 510–529. [Google Scholar] [CrossRef] [Green Version]
- Pavlish, J.H.; Sondreal, E.A.; Mann, M.D.; Olson, E.S.; Galbreath, K.C.; Laudal, D.L.; Benson, S.A. Status review of mercury control options for coal-fired power plants. Fuel Process Technol. 2003, 82, 89–165. [Google Scholar] [CrossRef]
- Galbreath, K.C.; Zygarlicke, C.J. Mercury transformations in coal combustion flue gas. Fuel Process Technol. 2000, 65, 289–310. [Google Scholar] [CrossRef]
- Wang, S.X.; Zhang, L.; Li, G.H.; Wu, Y.; Hao, J.M.; Pirrone, N.; Ancora, M.P. Mercury emission and speciation of coal-fired power plants in China. Atmos. Chem. Phys. 2010, 10, 1183–1192. [Google Scholar]
- Shao, J.Q.; Liu, C.C.; Yan, X.L. Cadmium distribution characteristics and environmental risk assessment in typical sewage irrigation area of Hebei Province. Acta Sci. Circumstantiae 2019, 39, 917–927. [Google Scholar]
- Liu, Y.L.; Liu, S.Q.; Xun, Z.J.; Yan, Y.L.; Hou, D.L. Assessment of potential ecological risk of soll heavy metals in sewage irrigated area of baoding suburban. J. Anhui Agri. Sci. 2011, 39, 10330–10332. [Google Scholar]
- El-Mageed, A.; Taia, A.; Shaaban, A.; El-Mageed, A.; Shimaa, A.; Semida, W.M.; Rady, M.O. Silicon defensive role in maize (Zea mays L.) against drought stress and metals-contaminated irrigation water. Silicon 2021, 13, 2165–2176. [Google Scholar] [CrossRef]
- Edelstein, M.; Ben-Hur, M. Heavy metals and metalloids: Sources, risks and strategies to reduce their accumulation in horticultural crops. Sci. Hortic. 2018, 234, 431–444. [Google Scholar] [CrossRef]
- Zhan, F.; Li, B.; Jiang, M.; Yue, X.; He, Y.; Xia, Y.; Wang, Y. Arbuscular mycorrhizal fungi enhance antioxidant defense in the leaves and the retention of heavy metals in the roots of maize. Environ. Sci. Pollut. Res 2018, 25, 24338–24347. [Google Scholar] [CrossRef] [PubMed]
- Thorpe, A.; Harrison, R.M. Sources and properties of non-exhaust particulate matter from road traffic: A review. Sci. Total Environ. 2008, 400, 270–282. [Google Scholar] [CrossRef]
- Habibi, K. Characterization of particulate lead in vehicle exhaust-experimental techniques. Environ. Sci. Technol. 1970, 4, 239–248. [Google Scholar] [CrossRef]
- Osumi, K. Exhaust Gas Purification System and Exhaust Gas Purification Method. U.S. Patent 9,593,614, 14 March 2017. [Google Scholar]
- MacKinnon, G.; MacKenzie, A.B.; Cook, G.T.; Pulford, I.D.; Duncan, H.J.; Scott, E.M. Spatial and temporal variations in Pb concentrations and isotopic composition in roaddust, farmland soil and vegetation in proximity to roads since cessation of use of leaded petrol in the UK. Sci. Total Environ. 2011, 409, 5010–5019. [Google Scholar] [CrossRef] [Green Version]
- Saeedi, M.; Hosseinzadeh, M.; Jamshidi, A.; Pajooheshfar, S.P. Assessment of heavy metals contamination and leaching characteristics in highway side soils, Iran. Environ. Monit. Assess. 2009, 151, 231–241. [Google Scholar] [CrossRef]
- Karmakar, D.; Padhy, P.K. Air pollution tolerance, anticipated performance, and metal accumulation indices of plant species for greenbelt development in urban industrial area. Chemosphere 2019, 237, 124522. [Google Scholar] [CrossRef]
- Esfandiari, M.; Sodaiezadeh, H.; Ardakani, H. Assessment of heavy metals in Cypress (Thuja orientalis L.) in the Yazd Highway green belt. Desert 2020, 25, 15–23. [Google Scholar]
- Mondal, S.; Singh, G. Air pollution tolerance, anticipated performance, and metal accumulation capacity of common plant species for green belt development. Environ. Sci. Pollut. Res 2021, 1–12. [Google Scholar] [CrossRef] [PubMed]


| Statistical | As | Cu | Pb | Cd | Ni | Cr | Hg | Zn | pH | orgC % | CEC cmol/kg |
|---|---|---|---|---|---|---|---|---|---|---|---|
| Mean | 9.38 | 24.77 | 24.48 | 0.19 | 27.62 | 66.65 | 0.06 | 75.62 | 8.15 | 1.03 | 11.23 |
| Median | 9.22 | 23.70 | 23.50 | 0.16 | 27.60 | 67.20 | 0.05 | 72.10 | 8.27 | 0.99 | 10.50 |
| Std. Deviation | 3.21 | 14.11 | 9.08 | 0.35 | 6.60 | 11.23 | 0.04 | 53.76 | 0.47 | 0.40 | 4.12 |
| coefficient of variation % | 34.18 | 56.98 | 37.07 | 183.02 | 23.88 | 16.85 | 64.65 | 71.08 | 5.77 | 38.83 | 36.69 |
| Skewness | 0.96 | 11.07 | 8.50 | 11.66 | −0.70 | −0.27 | 4.40 | 12.55 | −1.52 | 1.81 | 0.82 |
| Kurtosis | 4.87 | 156.19 | 88.87 | 137.08 | 1.29 | 3.65 | 27.34 | 180.81 | 3.06 | 7.98 | 0.66 |
| Minimum | 2.47 | 5.60 | 13.70 | 0.05 | 5.40 | 25.00 | 0.01 | 15.80 | 6.20 | 0.16 | 2.70 |
| Maximum | 29.50 | 228.90 | 125.70 | 4.52 | 43.20 | 112.10 | 0.36 | 879.00 | 9.05 | 3.66 | 27.40 |
| Local background [29] | 12.80 | 21.80 | 21.50 | 0.09 | 30.80 | 68.30 | 0.04 | 71.90 | - | - | - |
| Soil risk screening values [35] | 25.00 | 100.00 | 170.00 | 0.60 | 190.00 | 250.00 | 3.40 | 300.00 | - | - | - |
| Heavy Metals | As | Cu | Pb | Cd | Ni | Cr | Hg | Zn |
|---|---|---|---|---|---|---|---|---|
| Igeo | −0.34 ± 0.16 | −0.15 ± 0.14 | −0.14 ± 0.09 | −0.008 ± 0.16 | −0.24 ± 0.13 | −0.19 ± 0.08 | −0.05 ± 0.19 | −0.18 ± 0.13 |
| Er | 9.52 ± 3.25 | 4.88 ± 2.78 | 5.62 ± 2.08 | 52.46 ± 96.02 | 4.35 ± 1.04 | 1.92 ± 0.32 | 133.01 ± 85.99 | 1.13 ± 0.80 |
| RI | 212.90 ± 142.55 | |||||||
Publisher’s Note: MDPI stays neutral with regard to jurisdictional claims in published maps and institutional affiliations. |
© 2022 by the authors. Licensee MDPI, Basel, Switzerland. This article is an open access article distributed under the terms and conditions of the Creative Commons Attribution (CC BY) license (https://creativecommons.org/licenses/by/4.0/).
Share and Cite
Cai, K.; Li, C. Ecological Risk, Input Flux, and Source of Heavy Metals in the Agricultural Plain of Hebei Province, China. Int. J. Environ. Res. Public Health 2022, 19, 2288. https://doi.org/10.3390/ijerph19042288
Cai K, Li C. Ecological Risk, Input Flux, and Source of Heavy Metals in the Agricultural Plain of Hebei Province, China. International Journal of Environmental Research and Public Health. 2022; 19(4):2288. https://doi.org/10.3390/ijerph19042288
Chicago/Turabian StyleCai, Kui, and Chang Li. 2022. "Ecological Risk, Input Flux, and Source of Heavy Metals in the Agricultural Plain of Hebei Province, China" International Journal of Environmental Research and Public Health 19, no. 4: 2288. https://doi.org/10.3390/ijerph19042288
APA StyleCai, K., & Li, C. (2022). Ecological Risk, Input Flux, and Source of Heavy Metals in the Agricultural Plain of Hebei Province, China. International Journal of Environmental Research and Public Health, 19(4), 2288. https://doi.org/10.3390/ijerph19042288