
The Impact of Transport on Population Health and Health Equity for Māori in Aotearoa New Zealand: A Prospective Burden of Disease Study

 , , , ,
Abstract
1. Introduction
2. Methods
2.1. Scenario Details
2.2. Health Impact Modelling
3. Results
4. Discussion
4.1. Summary of Findings
4.2. Transport’s Role in Health Inequity
4.3. Transport as a Determinant of Health
4.4. Strengths and Limitations
5. Conclusions
Author Contributions
Funding
Institutional Review Board Statement
Informed Consent Statement
Data Availability Statement
Acknowledgments
Conflicts of Interest
References
- Woodcock, J.; Banister, D.; Edwards, P.; Prentice, A.M.; Roberts, I. Energy and Transport. Lancet 2007, 370, 1078–1088. [Google Scholar] [CrossRef]
- Van Schalkwyk, M.C.I.; Mindell, J.S. Current Issues in the Impacts of Transport on Health. Br. Med. Bull. 2018, 125, 67–77. [Google Scholar] [CrossRef] [PubMed]
- Glazener, A.; Sanchez, K.; Ramani, T.; Zietsman, J.; Nieuwenhuijsen, M.J.; Mindell, J.S.; Fox, M.; Khreis, H. Fourteen pathways between urban transportation and health: A conceptual model and literature review. J. Transp. Health 2021, 21, 101070. [Google Scholar] [CrossRef]
- Swinburn, B.A.; Vivica, I.; Kraak, S.A.; Vincent, J.; Atkins, P.I.; Baker, J.R.; Bogard, H.B.; Calvillo, A.; De Schutter, O.; Devarajan, R.; et al. The Global Syndemic of Obesity, Undernutrition, and Climate Change: The Lancet Commission Report. Lancet 2019, 393, 791–846. [Google Scholar] [CrossRef]
- Tranter, P.J. Speed Kills: The Complex Links between Transport, Lack of Time and Urban Health. J. Urban Health Bull. N. Y. Acad. Med. 2010, 87, 155–166. [Google Scholar] [CrossRef]
- Woodcock, J.; Edwards, P.; Tonne, C.; Armstrong, B.G.; Ashiru, O.; Banister, D.; Beevers, S.; Chalabi, Z.; Chowdhury, Z.; Cohen, A.; et al. Public Health Benefits of Strategies to Reduce Greenhouse-Gas Emissions: Urban Land Transport. Lancet 2009, 374, 1930–1943. [Google Scholar] [CrossRef]
- Banister, D. Inequality in Transport; Alexandrine Press: Oxon, UK, 2018. [Google Scholar]
- Randal, E.; Shaw, C.; Woodward, A.; Howden-Chapman, P.; Macmillan, A.; Hosking, J.; Chapman, R.; Waa, A.M.; Keall, M. Fairness in Transport Policy: A New Approach to Applying Distributive Justice Theories. Sustainability 2020, 12, 10102. [Google Scholar] [CrossRef]
- Royal Commission on Social Policy. The April Report Colume 2: Future Directions; Royal Commission on Social Policy: Wellington, New Zealand, 1988. [Google Scholar]
- Human Rights Commission. Human Rights Commission. Human Rights and the Treaty of Waitangi. In Human Rights in New Zealand 2010; Human Rights Commission: Wellington, New Zealand, 2010. [Google Scholar]
- United Nations General Assembly. Resolution 61/295 United Nations Declaration on the Rights of Indigenous Peoples; a/Res/61/295 (2 October 2007); United Nations: New York, NY, USA, 2007. [Google Scholar]
- Hosking, J.; Ameratunga, S.; Exeter, D.; Stewart, J.; Bell, A. Ethnic, Socioeconomic and Geographical Inequalities in Road Traffic Injury Rates in the Auckland Region. Aust. N. Z. J. Public Health 2013, 37, 162–167. [Google Scholar] [CrossRef]
- Russell, M.; Davies, C.; Wild, K.; Shaw, C. Pedalling Towards Equity: Exploring Women’s Cycling in a New Zealand City. J. Transp. Geogr. 2021, 91, 102987. [Google Scholar] [CrossRef]
- Jones, R.; Kidd, B.; Wild, K.; Woodward, A. Cycling Amongst Māori: Patterns, Influences and Opportunities. N. Z. Geogr. 2020, 76, 182–193. [Google Scholar] [CrossRef]
- Raerino, K.; Macmillan, A.K.; Jones, R.G. Indigenous Māori Perspectives on Urban Transport Patterns Linked to Health and Wellbeing. Health Place 2013, 23, 54–62. [Google Scholar] [CrossRef]
- Ministry of Health. Annual Data Explorer 2019/20: New Zealand Health Survey [Data File]. Available online: https://minhealthnz.shinyapps.io/nz-health-survey-2019-20-annual-data-explorer/ (accessed on 24 September 2021).
- Statistics New Zealand. National and Subnational Period Life Tables: 2017–2019; Statistics New Zealand: Wellington, New Zealand, 2021. [Google Scholar]
- Statistics New Zealand. Māori Population Estimates: At 30 June 2020. Statistics New Zealand. Available online: https://www.stats.govt.nz/information-releases/maori-population-estimates-at-30-june-2020 (accessed on 11 October 2021).
- Bhalla, K.; Shotten, M.; Cohen, A.; Brauer, M.; Shahraz, S.; Burnett, R.; Leach-Kemon, K.; Freedman, G.; Murray, J.L.C. Transport for Health: The Global Burden of Disease from Motorized Road Transport (English); World Bank Group: Washington, DC, USA, 2014. [Google Scholar]
- Briggs, D.; Mason, K.; Borman, B. Rapid Assessment of Environmental Health Impacts for Policy Support: The Example of Road Transport in New Zealand. Int. J. Environ. Res. Public Health 2016, 13, 61. [Google Scholar] [CrossRef]
- Iungman, T.; Khomenko, S.; Nieuwenhuijsen, M.; Barboza, E.P.; Ambròs, A.; Padilla, C.; Mueller, N. The Impact of Urban and Transport Planning on Health: Assessment of the Attributable Mortality Burden in Madrid and Barcelona and Its Distribution by Socioeconomic Status. Environ. Res. 2021, 196, 110988. [Google Scholar] [CrossRef] [PubMed]
- Mueller, N.; Rojas-Rueda, D.; Basagaña, X.; Cirach, M.; Cole-Hunter, T.; Dadvand, P.; Donaire-Gonzalez, D.; Foraster, M.; Gascon, M.; Martinez, D.; et al. Health Impacts Related to Urban and Transport Planning: A Burden of Disease Assessment. Environ. Int. 2017, 107, 243–257. [Google Scholar] [CrossRef] [PubMed]
- Mueller, N.; Rojas-Rueda, D.; Khreis, H.; Cirach, M.; Milà, C.; Espinosa, A.; Foraster, M.; McEachan, R.R.C.; Kelly, B.; Wright, J.; et al. Socioeconomic Inequalities in Urban and Transport Planning Related Exposures and Mortality: A Health Impact Assessment Study for Bradford, UK. Environ. Int. 2018, 121, 931–941. [Google Scholar] [CrossRef] [PubMed]
- Sohrabi, S.; Khreis, H. Burden of Disease from Transportation Noise and Motor Vehicle Crashes: Analysis of Data from Houston, Texas. Environ. Int. 2020, 136, 105520. [Google Scholar] [CrossRef]
- Sohrabi, S.; Zietsman, J.; Khreis, H. Burden of Disease Assessment of Ambient Air Pollution and Premature Mortality in Urban Areas: The Role of Socioeconomic Status and Transportation. Int. J. Environ. Res. Public Health 2020, 17, 1166. [Google Scholar] [CrossRef]
- Tainio, M. Burden of Disease Caused by Local Transport in Warsaw, Poland. J. Transp. Health 2015, 2, 423–433. [Google Scholar] [CrossRef]
- Mueller, N.; Rojas-Rueda, D.; Basagaña, X.; Cirach, M.; Cole-Hunter, T.; Dadvand, P.; Donaire-Gonzalez, D.; Foraster, M.; Gascon, M.; Martinez, D.; et al. Urban and Transport Planning Related Exposures and Mortality: A Health Impact Assessment for Cities. Environ. Health Perspect. 2017, 125, 89–96. [Google Scholar] [CrossRef]
- Khomenko, S.; Nieuwenhuijsen, M.; Ambròs, A.; Wegener, S.; Mueller, N. Is a Liveable City a Healthy City? Health Impacts of Urban and Transport Planning in Vienna, Austria. Environ. Res. 2020, 183, 109238. [Google Scholar] [CrossRef]
- Blakely, T.; Cleghorn, C.; van der Deen, F.P.; Cobiac, L.J.; Mizdrak, A.; Mackenbach, J.P.; Woodward, A.; van Baal, P.; Wilson, N. Prospective Impact of Tobacco Eradication and Overweight and Obesity Eradication on Future Morbidity and Health-Adjusted Life Expectancy: Simulation Study. J. Epidemiol. Community Health 2020, 74, 354–361. [Google Scholar] [CrossRef] [PubMed]
- Mizdrak, A.; Blakely, T.; Cleghorn, C.L.; Cobiac, L. Potential of Active Transport to Improve Health, Reduce Healthcare Costs, and Reduce Greenhouse Gas Emissions: A Modelling Study. PLoS ONE 2019, 14, e0219316. [Google Scholar] [CrossRef] [PubMed]
- Mizdrak, A.; Blakely, T.; Cleghorn, C.L.; Cobiac, L. Technical Report for BODE3 Active Transport and Physical Activity Model; Department of Public Health, University of Otago: Wellington, New Zealand, 2018. [Google Scholar]
- Ministry of Health. Position Paper on Māori Health Analytics—Age Standardisation; Ministry of Health: Wellington, New Zealand, 2018. [Google Scholar]
- Robson, B.; Purdie, G.; Cram, F.; Simmonds, S. Age Standardisation—An Indigenous Standard? Emerg. Themes Epidemiol. 2007, 4, 3. [Google Scholar] [CrossRef] [PubMed]
- Burden of Disease Epidemiology Equity and Cost-Effectiveness Programme. Disease Inputs Used for Multi-State Life Table Modelling (Version 1.0); University of Otago: Wellington, New Zealand, 2019. [Google Scholar]
- Ainsworth, B.E.; Haskell, W.L.; Whitt, M.C.; Irwin, M.L.; Swartz, A.M.; Strath, S.J.; O’Brien, W.L.; Bassett, D.R., Jr.; Schmitz, K.H.; Emplaincourt, P.O.; et al. Compendium of Physical Activities: An Update of Activity Codes and Met Intensities. Med. Sci. Sports Exerc. 2000, 32, S498–S504. [Google Scholar] [CrossRef] [PubMed]
- Brauer, M.; Freedman, G.; Frostad, J.; Van Donkelaar, A.; Martin, R.; Dentener, F.; Van Dingenen, R.; Estep, K.; Amini, H.; Apte, J.; et al. Ambient Air Pollution Exposure Estimation for the Global Burden of Disease 2013. Environ. Sci. Technol. 2016, 50, 79–88. [Google Scholar] [CrossRef]
- Global Burden of Disease Study. Global Burden of Disease Study 2015 Results; Institute for Health Metrics and Evaluation (IHME): Seattle, WA, USA, 2016. [Google Scholar]
- Ministry of Health. Health Loss in New Zealand: A Report from the New Zealand Burden of Diseases, Injuries and Risk Factors Study, 2006–2013; Ministry of Health: Wellington, New Zealand, 2016. [Google Scholar]
- de Sá, T.H.; Tainio, M.; Goodman, A.; Edwards, P.; Haines, A.; Gouveia, N.; Monteiro, C.; Woodcock, J. Health Impact Modelling of Different Travel Patterns on Physical Activity, Air Pollution and Road Injuries for São Paulo, Brazil. Environ. Int. 2017, 108, 22–31. [Google Scholar]
- Hales, S.; Atkinson, J.; Metcalfe, J.; Kuschel, G.; Woodward, A. Long Term Exposure to Air Pollution, Mortality and Morbidity in New Zealand: Cohort Study. Sci. Total Environ. 2021, 801, 149660. [Google Scholar] [CrossRef]
- Peden, M.; Scurfield, R.; Sleet, D.; Mathers, C.; Jarawan, E.; Hyder, A.A.; Mohan, D.; Hyder, A.A.; Jarawan, E. World Report on Road Traffic Injury Prevention; World Health Organization: Geneva, Switzerland, 2004. [Google Scholar]
- Lindsay, G.; Macmillan, A.; Woodward, A. Moving Urban Trips from Cars to Bicycles: Impact on Health and Emissions. Aust. N. Z. J. Public Health 2011, 35, 54–60. [Google Scholar] [CrossRef]
- Diderichsen, F.; Andersen, I.; Manuel, C.; Andersen, A.-M.N.; Bach, E.; Baadsgaard, M.; Brønnum-Hansen, H.; Hansen, F.K.; Jeune, B.; Jørgensen, T.; et al. Health Inequality—Determinants and Policies. Scand. J. Public Health 2012, 40 (Suppl. 8), 12–105. [Google Scholar] [CrossRef]
- Shaw, C.; Russell, M.; Keall, M.; MacBride-Stewart, S.; Wild, K.; Reeves, D.; Bentley, R.; Woodward, A. Beyond the Bicycle: Seeing the Context of the Gender Gap in Cycling. J. Transp. Health 2020, 18, 100871. [Google Scholar] [CrossRef]
- van der Deen, F.S.; Wilson, N.; Cleghorn, C.L.; Kvizhinadze, G.; Cobiac, L.J.; Nghiem, N.; Blakely, T. Impact of Five Tobacco Endgame Strategies on Future Smoking Prevalence, Population Health and Health System Costs: Two Modelling Studies to Inform the Tobacco Endgame. Tob. Control 2018, 27, 278–286. [Google Scholar] [CrossRef] [PubMed]
- Mattioli, G.; Roberts, C.; Steinberger, J.K.; Brown, A. The Political Economy of Car Dependence: A Systems of Provision Approach. Energy Res. Soc. Sci. 2020, 66, 101486. [Google Scholar] [CrossRef]
- Woodcock, J.; Aldred, R. Cars, Corporations, and Commodities: Consequences for the Social Determinants of Health. Emerg. Themes Epidemiol. 2008, 5, 4. [Google Scholar] [CrossRef] [PubMed]
- Mindell, J. Lessons from Tobacco Control for Advocates of Healthy Transport. J. Public Health Med. 2001, 23, 91–97. [Google Scholar] [CrossRef] [PubMed][Green Version]
- Douglas, M.J.; Watkins, S.J.; Gorman, D.R.; Higgins, M. Are Cars the New Tobacco? J. Public Health 2011, 33, 160–169. [Google Scholar] [CrossRef] [PubMed]
- Fishman, E.; Böcker, L.; Helbich, M. Adult Active Transport in the Netherlands: An Analysis of Its Contribution to Physical Activity Requirements. PLoS ONE 2015, 10, e0121871. [Google Scholar] [CrossRef]
- Hartmann, A.; Abel, S. How Oslo Achieved Zero Pedestrian and Bicycle Fatalities in 2019, and How Other Cities Can Apply What Worked. Inst. Transp. Eng. ITE J. 2020, 90, 32–38. [Google Scholar]
- Ministry of Health. Smokefree Aotearoa 2025. Ministry of Health. Available online: https://www.health.govt.nz/our-work/preventative-health-wellness/tobacco-control/smokefree-aotearoa-2025 (accessed on 24 September 2021).


| Model Input | Ethnicity Specific | Source |
|---|---|---|
| Population estimates by age, sex and ethnicity | Yes | Statistics NZ 2011 Estimated population count. Values used published in Burden of Disease Epidemiology Equity and Cost-Effectiveness Programme [34] |
| Physical activity (MVPA-METmins/week) | Yes | Distribution calculated from NZ Health Survey 2011/12 using MET values from Ainsworth, et al. [35]. Values used published in Mizdrak, Blakely, Cleghorn and Cobiac [31] |
| Air pollution | No | Brauer, et al. [36]. Values used published in Mizdrak, Blakely, Cleghorn and Cobiac [31] |
| Injury incidence and mortality | Yes | Derived from Global Burden of Disease Study [37], Ministry of Health [38], and Ministry of Health National Collections. Values used published in Mizdrak, Blakely, Cleghorn and Cobiac [31] |
| Disease incidence, prevalence and mortality | Yes | Ministry of Health [38], Ministry of Health National Collections. Values used published in Burden of Disease Epidemiology Equity and Cost-Effectiveness Programme [34] |
| All-cause mortality rates | Yes | Statistics NZ period Life Table 2010, Table 2011 and Table 2012. Values used published in Burden of Disease Epidemiology Equity and Cost-Effectiveness Programme [34] |
| Morbidity rates | Yes | Global Burden of Disease Study [37], Ministry of Health [38]. Values used published in Burden of Disease Epidemiology Equity and Cost-Effectiveness Programme [34] |
| Health system costs | No | Analysis of Ministry of Health National Collections. Values used published in Mizdrak, Blakely, Cleghorn and Cobiac [31] |
| Overall Burden (95% Uncertainty Interval) | Physical Activity Only (95% Uncertainty Interval) | Air Pollution Only (95% Uncertainty Interval) | Road Injury Only (95% Uncertainty Interval) | ||
|---|---|---|---|---|---|
| HALYs (thousands) | All | 1280 (1110 to 1500) | 702 (583 to 846) | 106 (67.5 to 155) | 472 (386 to 562) |
| Māori females | 128 (109 to 149) | 80.6 (65.3 to 96.4) | 12.4 (8 to 19.1) | 34.7 (28.4 to 41.3) | |
| Non-Māori females | 412 (343 to 493) | 295 (236 to 361) | 37.1 (23.2 to 54.2) | 79.7 (60.4 to 98.6) | |
| Māori males | 179 (157 to 206) | 62.7 (51.4 to 75.5) | 11.1 (7.2 to 17) | 105 (88.5 to 122) | |
| Non-Māori males | 563 (483 to 662) | 264 (212 to 327) | 45.2 (28 to 65.7) | 253 (205 to 301) | |
| Health system costs (NZD2011 billions) | Total | −7.72 (−10.17 to −5.56) | −8.2 (−10.36 to −6.45) | −0.7 (−1.13 to −0.36) | 1.2 (0.17 to 2.31) |
| Total (95% Uncertainty Interval) | Physical Activity Only (95% Uncertainty Interval) | Air Pollution Only (95% Uncertainty Interval) | Road Injury Only (95% Uncertainty Interval) | |||||
|---|---|---|---|---|---|---|---|---|
| Raw | Age-Standardised | Raw | Age-Standardised | Raw | Age-Standardised | Raw | Age-Standardised | |
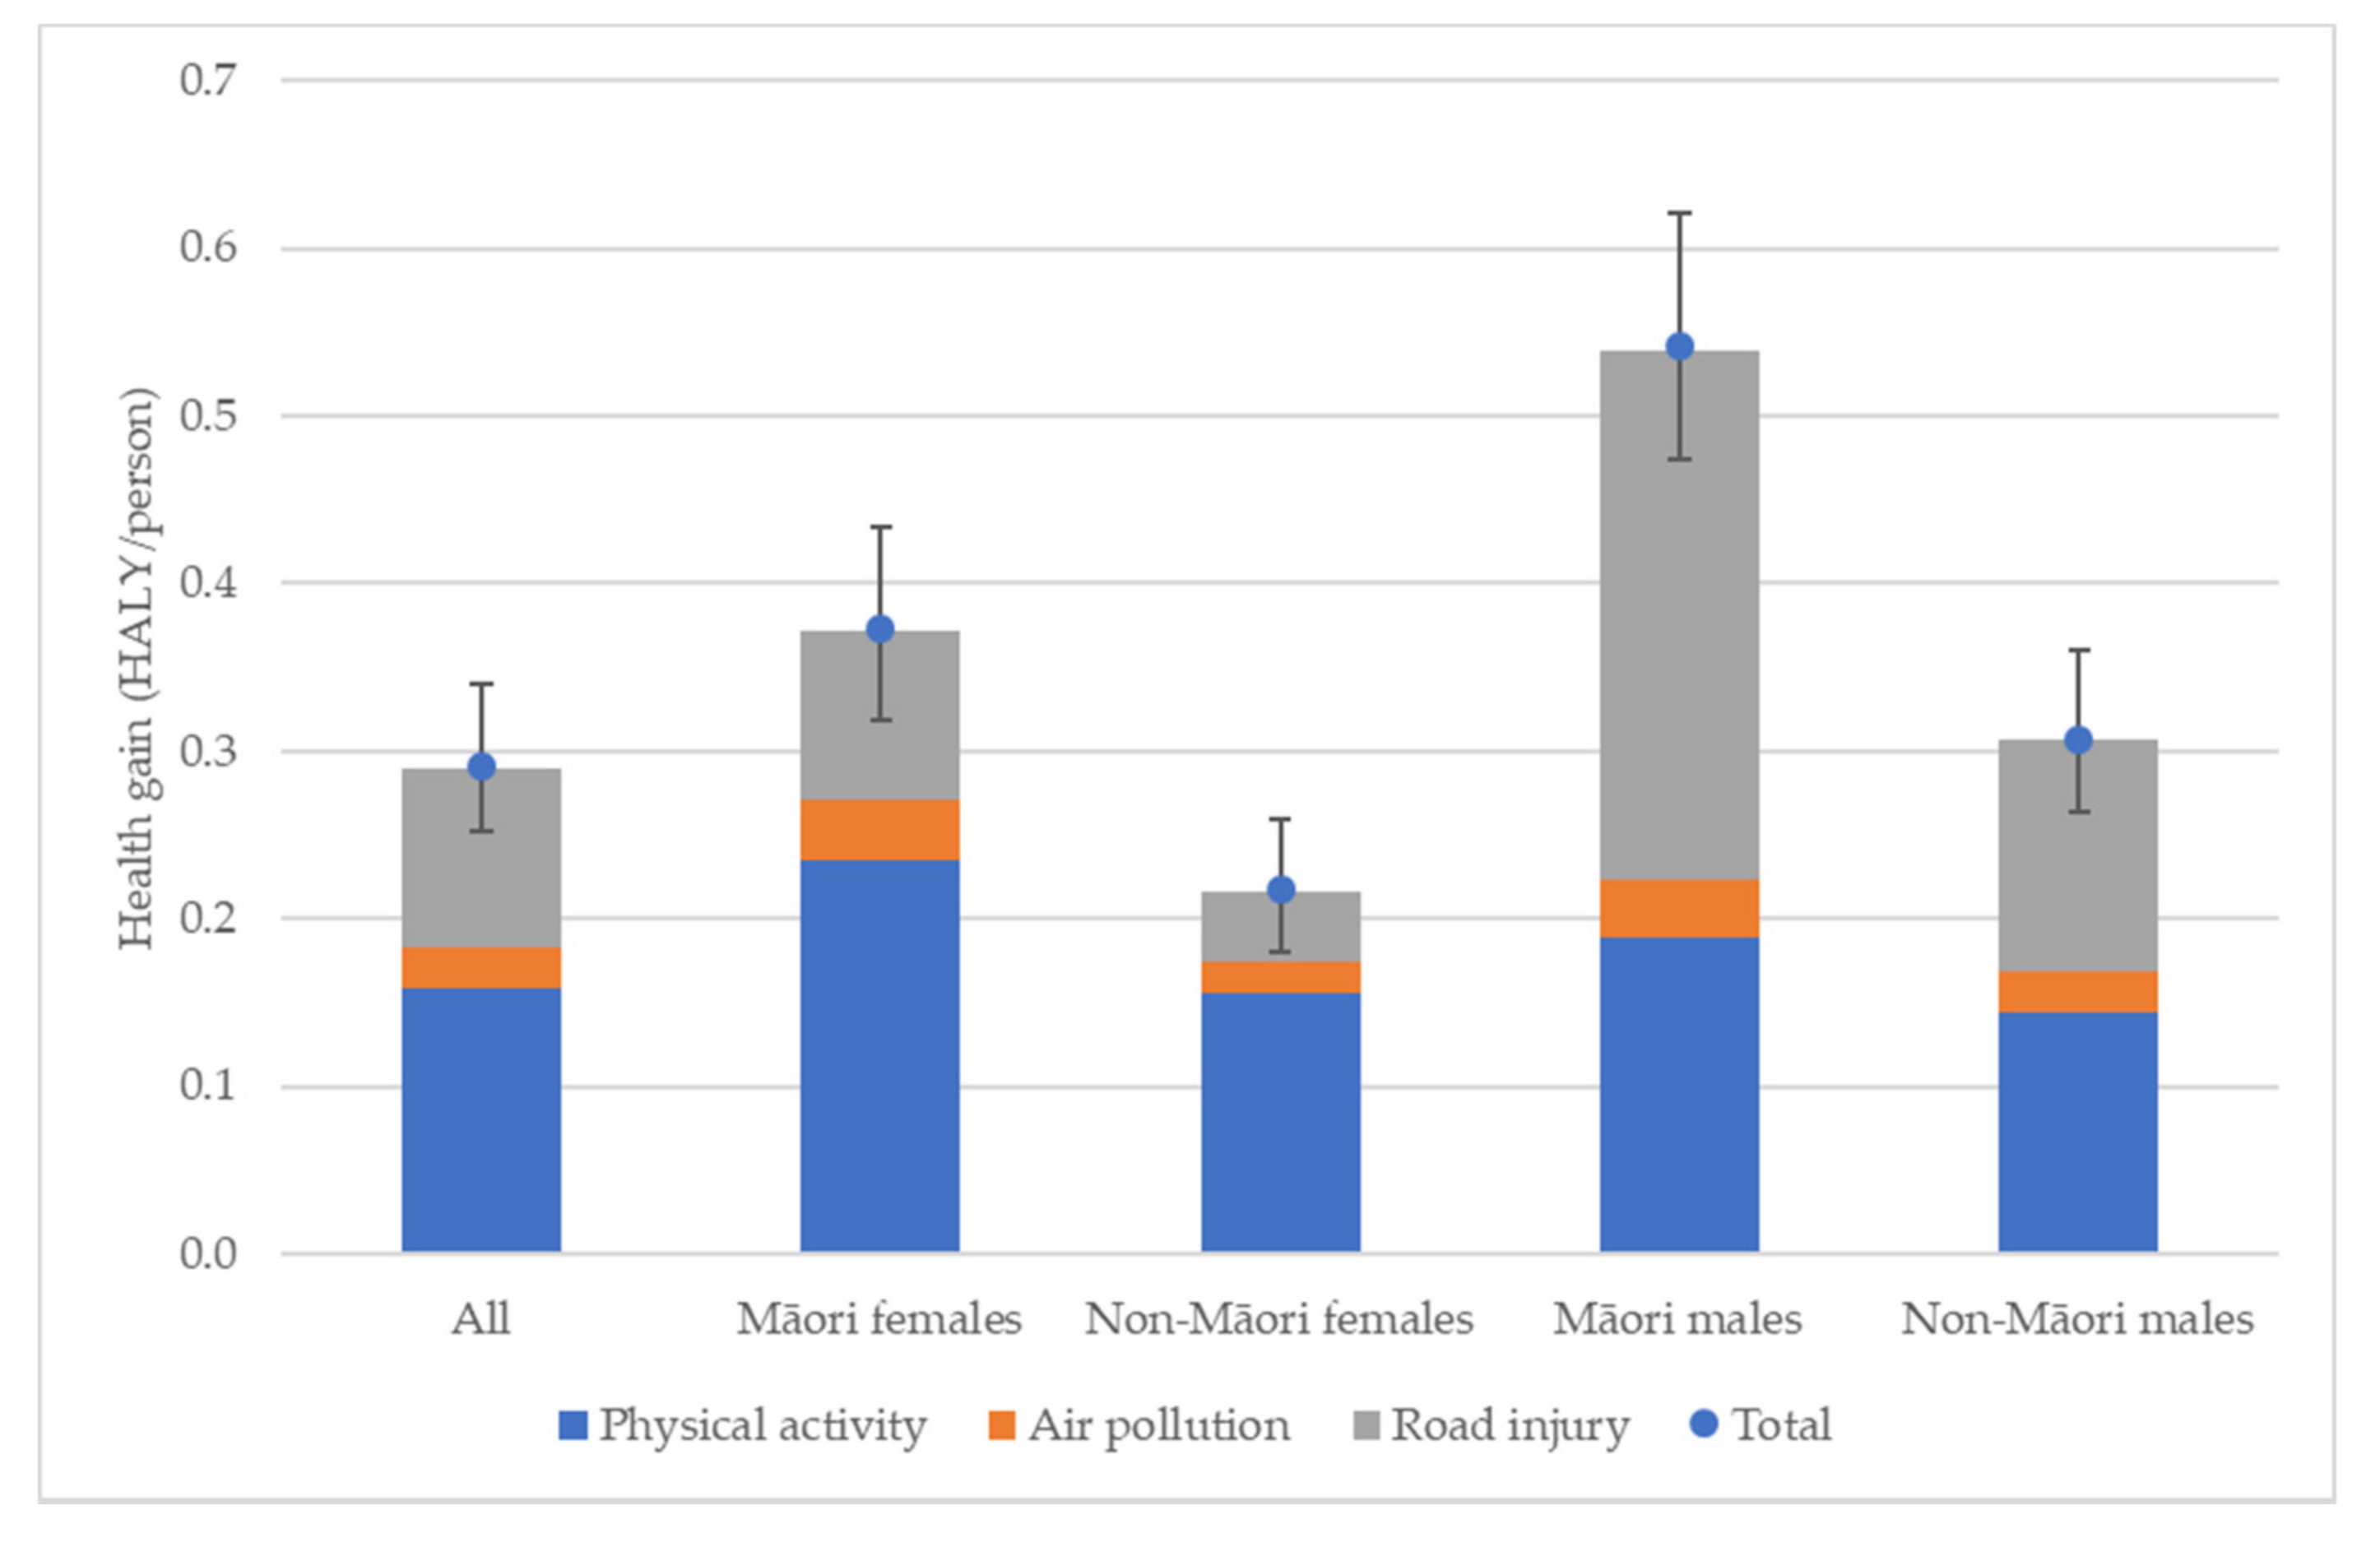
| All (HALY/person) | 0.29 (0.25 to 0.34) | 0.39 (0.34 to 0.45) | 0.16 (0.13 to 0.19) | 0.19 (0.16 to 0.23) | 0.02 (0.02 to 0.03) | 0.03 (0.02 to 0.04) | 0.11 (0.09 to 0.13) | 0.16 (0.14 to 0.19) |
| All ratio (Māori: non-Māori) | 1.74 (1.65 to 1.85) | 1.45 (1.38 to 1.52) | 1.42 (1.35 to 1.48) | 1.25 (1.19 to 1.30) | 1.58 (1.28 to 1.67) | 1.33 (1.07 to 1.40) | 2.32 (2.1 to 2.64) | 1.75 (1.59 to 1.95) |
| Māori females (HALY/person) | 0.37 (0.32 to 0.43) | 0.37 (0.32 to 0.43) | 0.24 (0.19 to 0.28) | 0.24 (0.19 to 0.28) | 0.04 (0.02 to 0.05) | 0.04 (0.02 to 0.05) | 0.10 (0.08 to 0.12) | 0.10 (0.08 to 0.12) |
| Non-Māori females (HALY/person) | 0.22 (0.18 to 0.26) | 0.26 (0.21 to 0.30) | 0.16 (0.12 to 0.19) | 0.18 (0.14 to 0.22) | 0.02 (0.01 to 0.03) | 0.02 (0.01 to 0.03) | 0.04 (0.03 to 0.05) | 0.05 (0.04 to 0.07) |
| Female ratio (Māori: non-Māori) | 1.72 (1.64 to 1.81) | 1.46 (1.40 to 1.53) | 1.51 (1.44 to 1.58) | 1.33 (1.27 to 1.38) | 1.85 (1.50 to 1.98) | 1.55 (1.25 to 1.66) | 2.41 (2.15 to 2.81) | 1.87 (1.68 to 2.14) |
| Māori males (HALY/person) | 0.54 (0.47 to 0.62) | 0.54 (0.47 to 0.62) | 0.19 (0.16 to 0.23) | 0.19 (0.16 to 0.23) | 0.03 (0.02 to 0.05) | 0.03 (0.02 to 0.05) | 0.32 (0.27 to 0.37) | 0.32 (0.27 to 0.37) |
| Non-Māori males (HALY/person) | 0.31 (0.26 to 0.36) | 0.38 (0.33 to 0.44) | 0.14 (0.12 to 0.18) | 0.16 (0.13 to 0.20) | 0.02 (0.02 to 0.04) | 0.03 (0.02 to 0.04) | 0.14 (0.11 to 0.16) | 0.19 (0.15 to 0.22) |
| Male ratio (Māori: non-Māori) | 1.76 (1.66 to 1.89) | 1.43 (1.36 to 1.52) | 1.32 (1.24 to 1.39) | 1.16 (1.10 to 1.22) | 1.36 (1.09 to 1.42) | 1.15 (0.92 to 1.20) | 2.29 (2.08 to 2.59) | 1.71 (1.57 to 1.90) |
Publisher’s Note: MDPI stays neutral with regard to jurisdictional claims in published maps and institutional affiliations. |
© 2022 by the authors. Licensee MDPI, Basel, Switzerland. This article is an open access article distributed under the terms and conditions of the Creative Commons Attribution (CC BY) license (https://creativecommons.org/licenses/by/4.0/).
Share and Cite
Randal, E.; Shaw, C.; McLeod, M.; Keall, M.; Woodward, A.; Mizdrak, A. The Impact of Transport on Population Health and Health Equity for Māori in Aotearoa New Zealand: A Prospective Burden of Disease Study. Int. J. Environ. Res. Public Health 2022, 19, 2032. https://doi.org/10.3390/ijerph19042032
Randal E, Shaw C, McLeod M, Keall M, Woodward A, Mizdrak A. The Impact of Transport on Population Health and Health Equity for Māori in Aotearoa New Zealand: A Prospective Burden of Disease Study. International Journal of Environmental Research and Public Health. 2022; 19(4):2032. https://doi.org/10.3390/ijerph19042032
Chicago/Turabian StyleRandal, Edward, Caroline Shaw, Melissa McLeod, Michael Keall, Alistair Woodward, and Anja Mizdrak. 2022. "The Impact of Transport on Population Health and Health Equity for Māori in Aotearoa New Zealand: A Prospective Burden of Disease Study" International Journal of Environmental Research and Public Health 19, no. 4: 2032. https://doi.org/10.3390/ijerph19042032
APA StyleRandal, E., Shaw, C., McLeod, M., Keall, M., Woodward, A., & Mizdrak, A. (2022). The Impact of Transport on Population Health and Health Equity for Māori in Aotearoa New Zealand: A Prospective Burden of Disease Study. International Journal of Environmental Research and Public Health, 19(4), 2032. https://doi.org/10.3390/ijerph19042032