
Study on the Maximum Safe Instantaneous Input of the Steering Wheel against Rollover for Trucks on Horizontal Curves


Abstract
:1. Introduction
2. Literature Review
2.1. Effects of Horizontal-Curve Features on Rollover
2.2. Effects of Vehicle Characteristics on Rollover
2.3. Effects of Driver Behaviors on Rollover
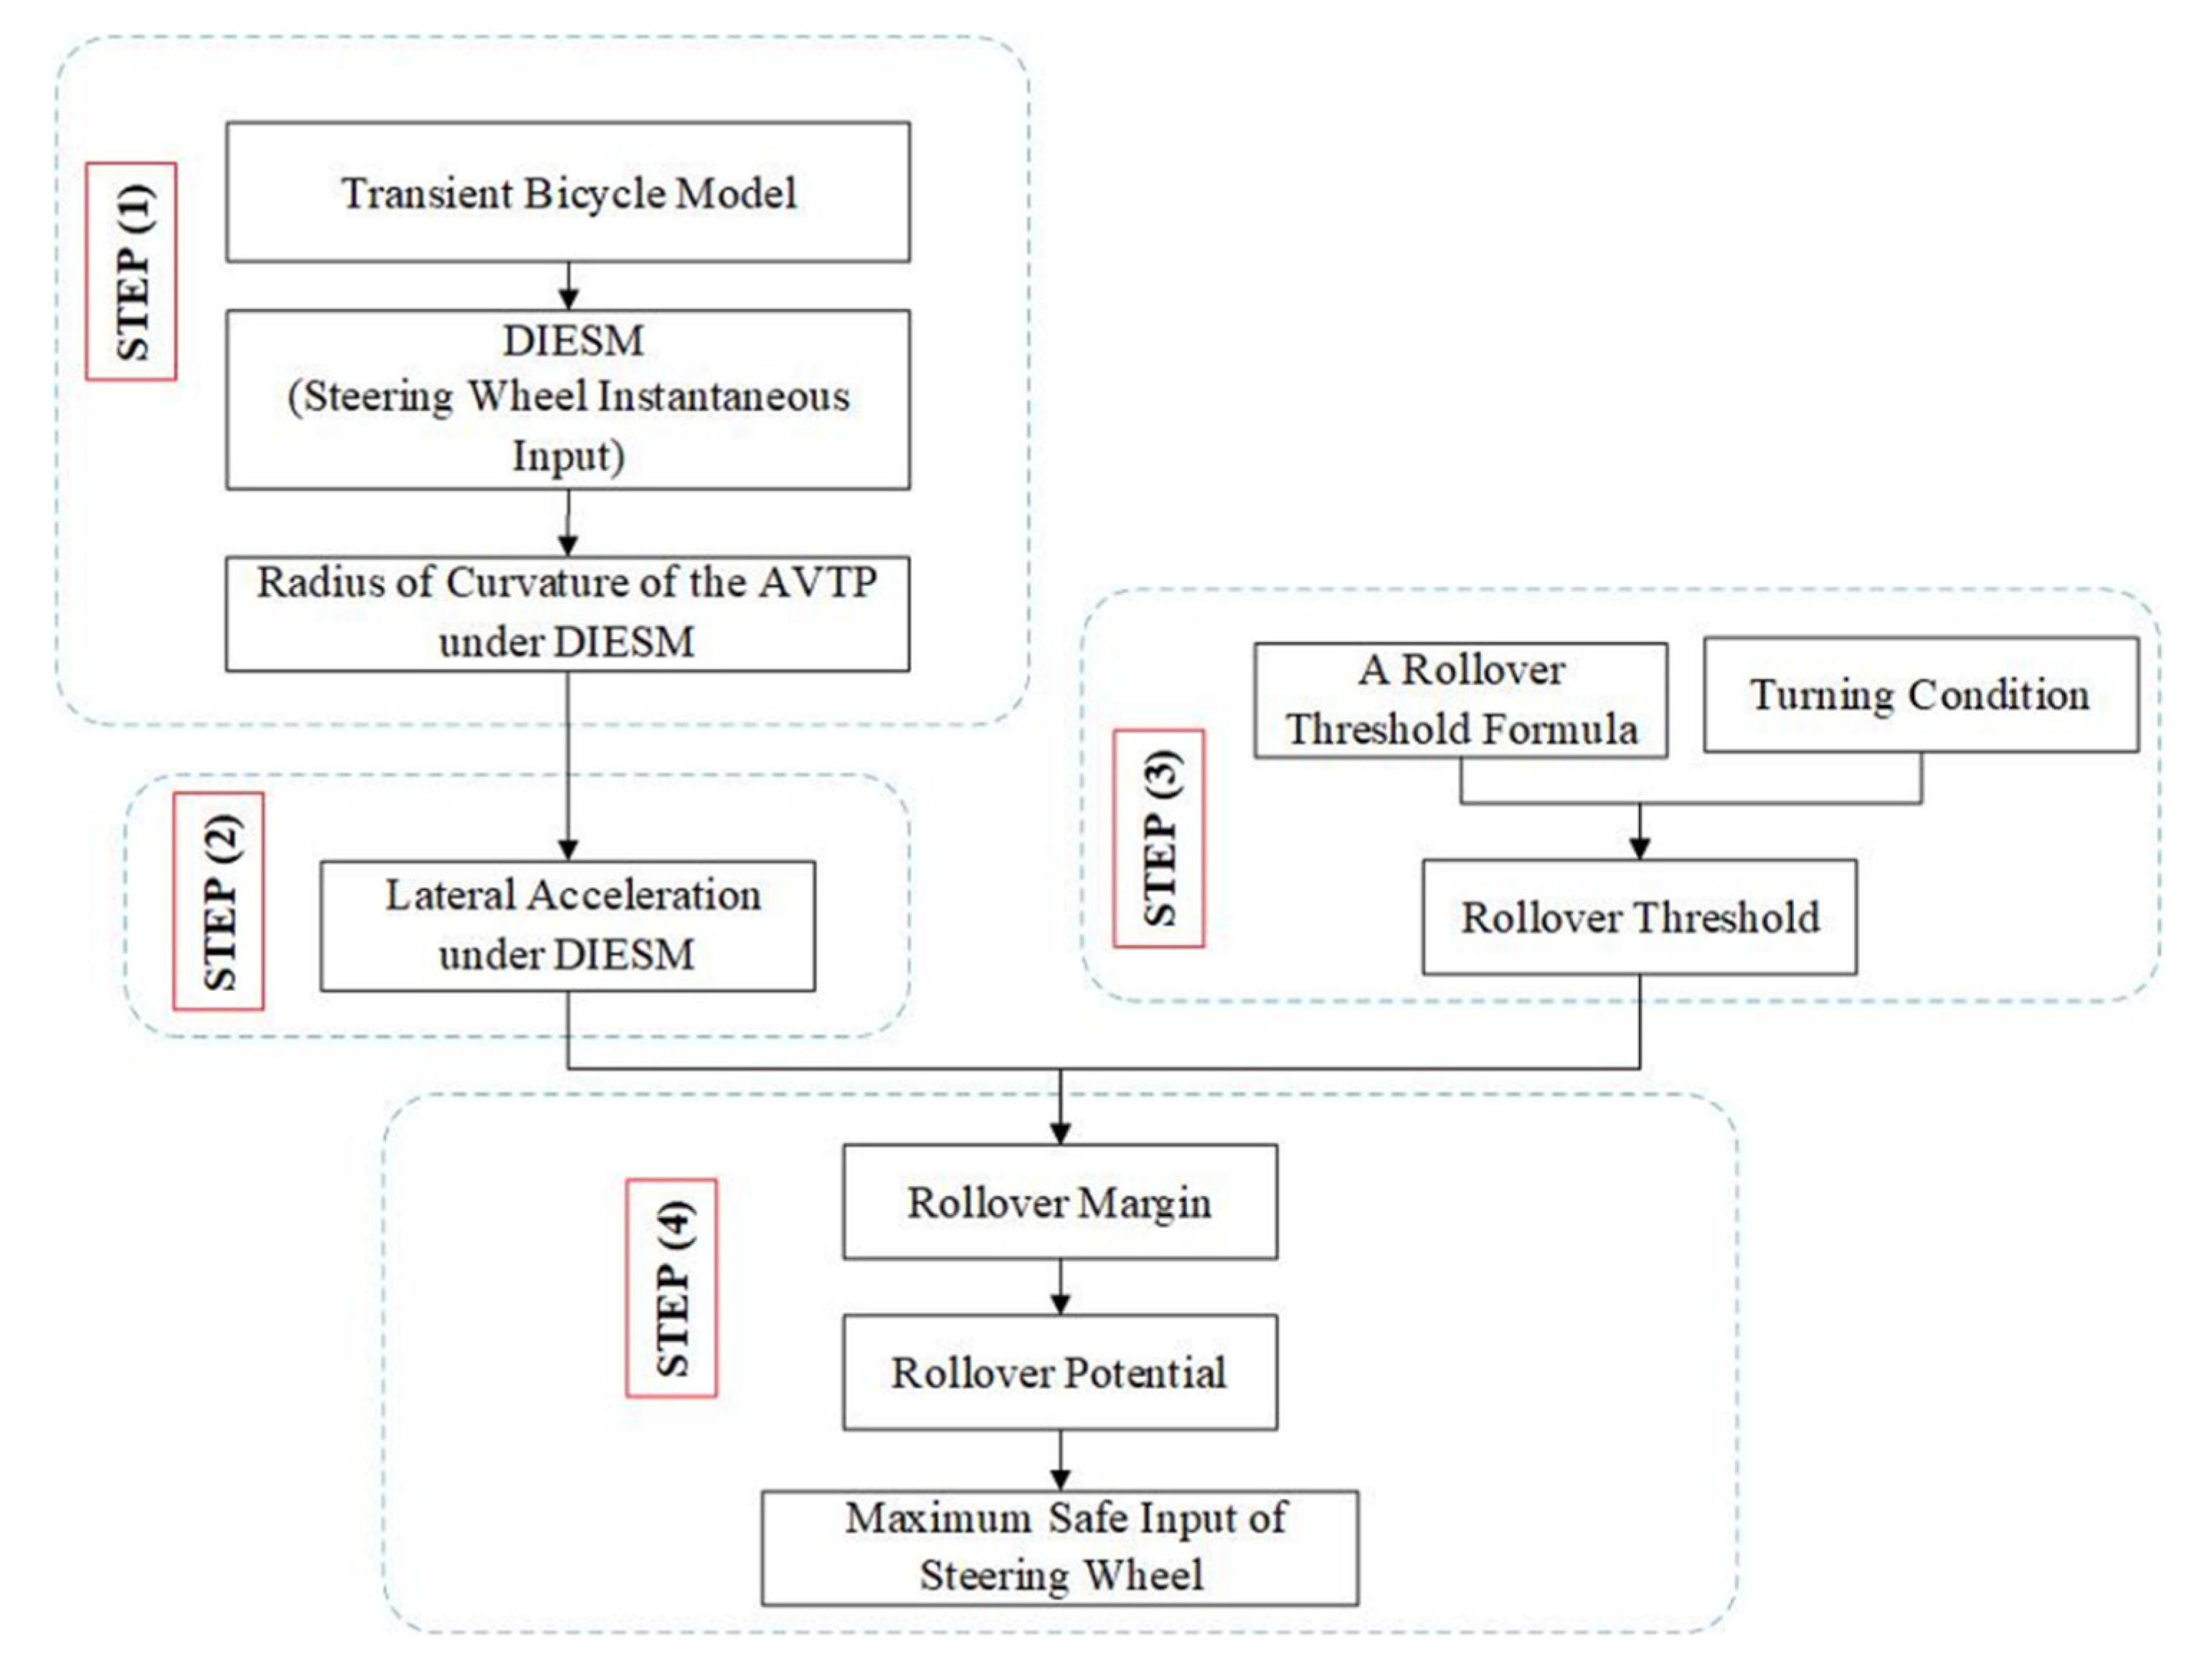
3. Theoretical Analysis Methods
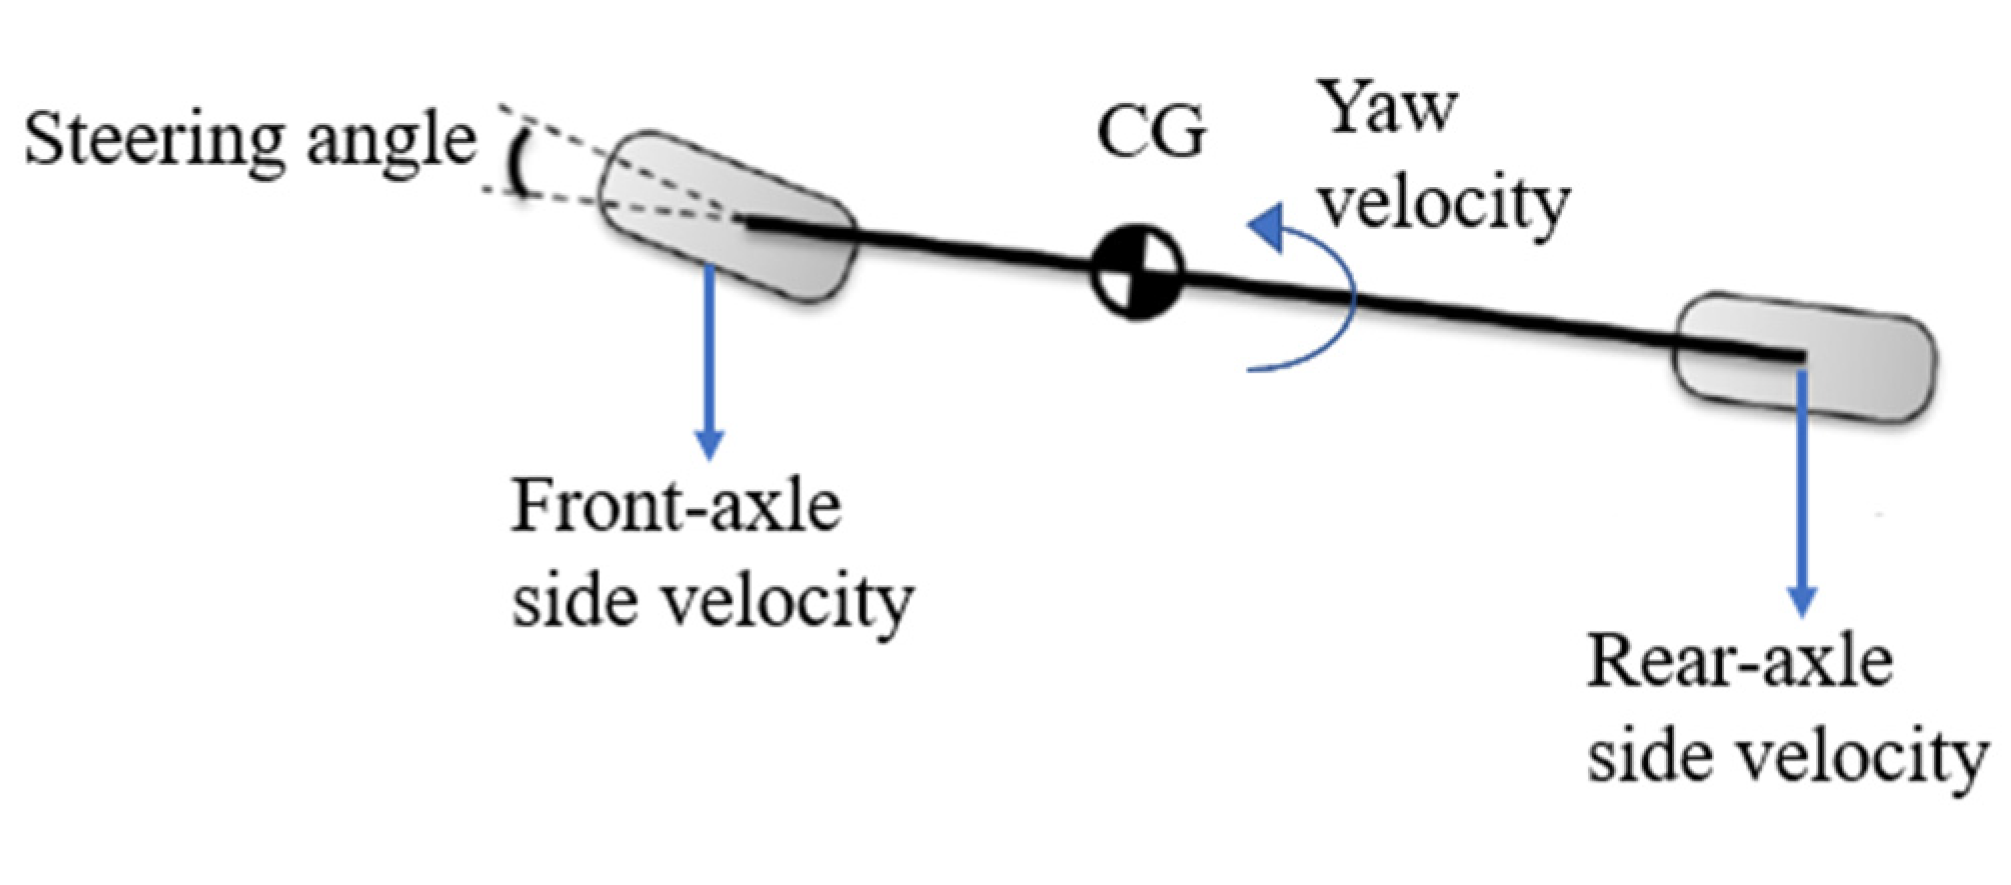
3.1. Transient Bicycle Model
3.1.1. Basic Assumptions
- The vehicle is right/left symmetric;
- There is no acceleration in the longitudinal direction of the vehicle, and the longitudinal speed is constant;
- The steering input is applied to the front wheel through the steering wheel with a fixed transmission ratio;
- Aerodynamics and rolling resistance of the tires are ignored.
3.1.2. Principle of Vehicle Steering
3.2. Radius of Curvature of the AVTP under DIESM
3.3. Rollover Margins
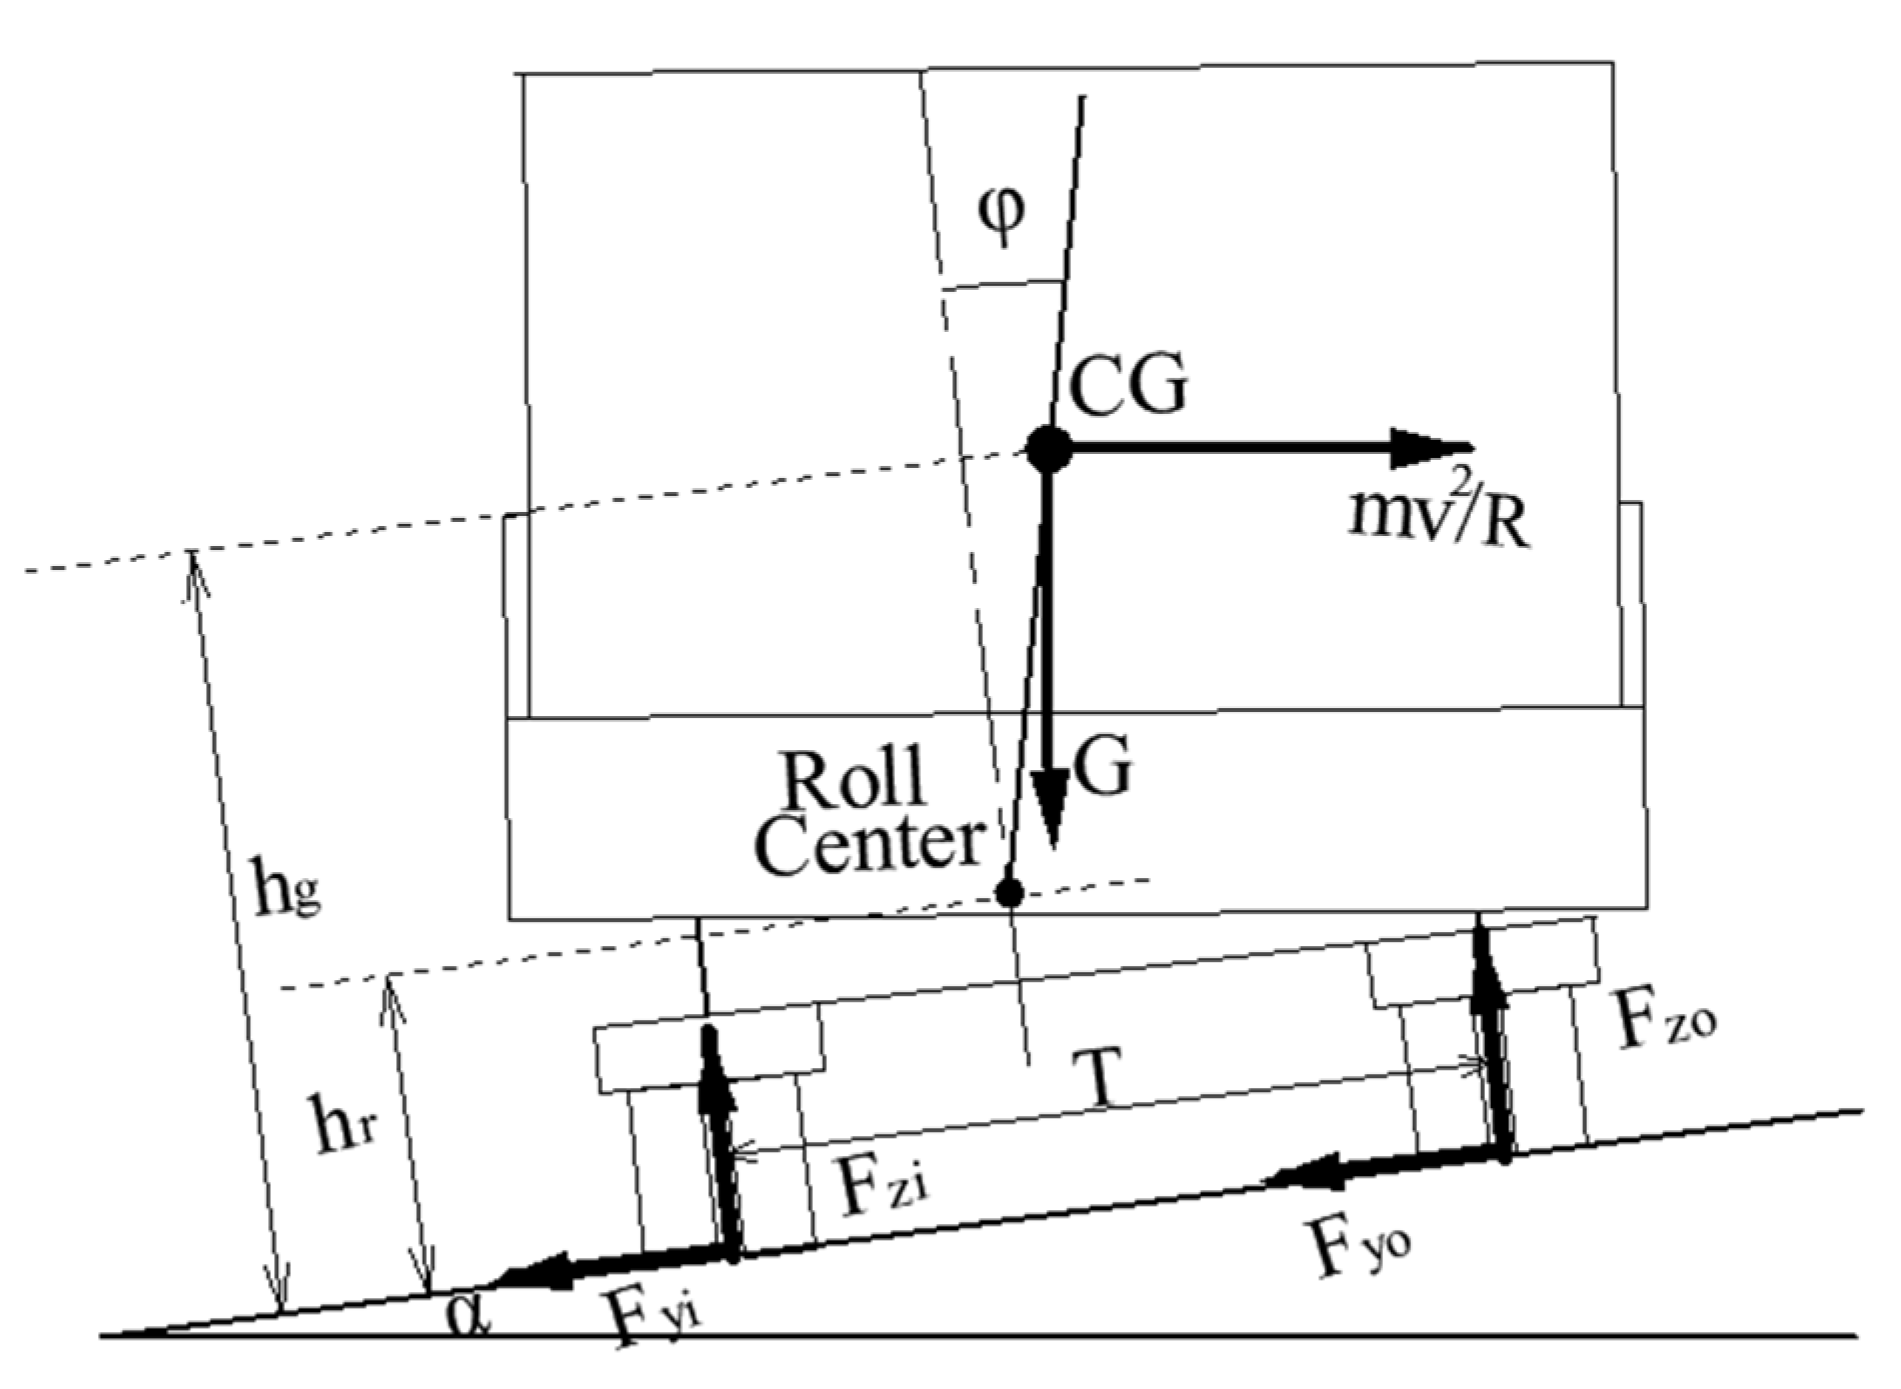
3.3.1. Vehicle’s Lateral Acceleration under DIESM
3.3.2. Vehicle’s Rollover Threshold
- The roll angle and roll angular velocity of the unsprung mass are ignored;
- The movement of the vehicle in the z-axis caused by uneven road surface is ignored.
- If turning from the outside to the inside of the curve, the vehicle’s rollover threshold can be written as Equation (12).
- If turning from the inside to the outside of the curve, the vehicle’s rollover threshold can be written as:
- Turning from the outside to the inside of the curve.
- 2.
- Turning from the inside to the outside of the curve.
3.4. The Maximum Safe Instantaneous Input of the Steering Wheel against Rollover
3.4.1. Formula Deduction
- Turning from the outside to the inside of the curve.
- 2.
- Turning from the inside to the outside of the curve.
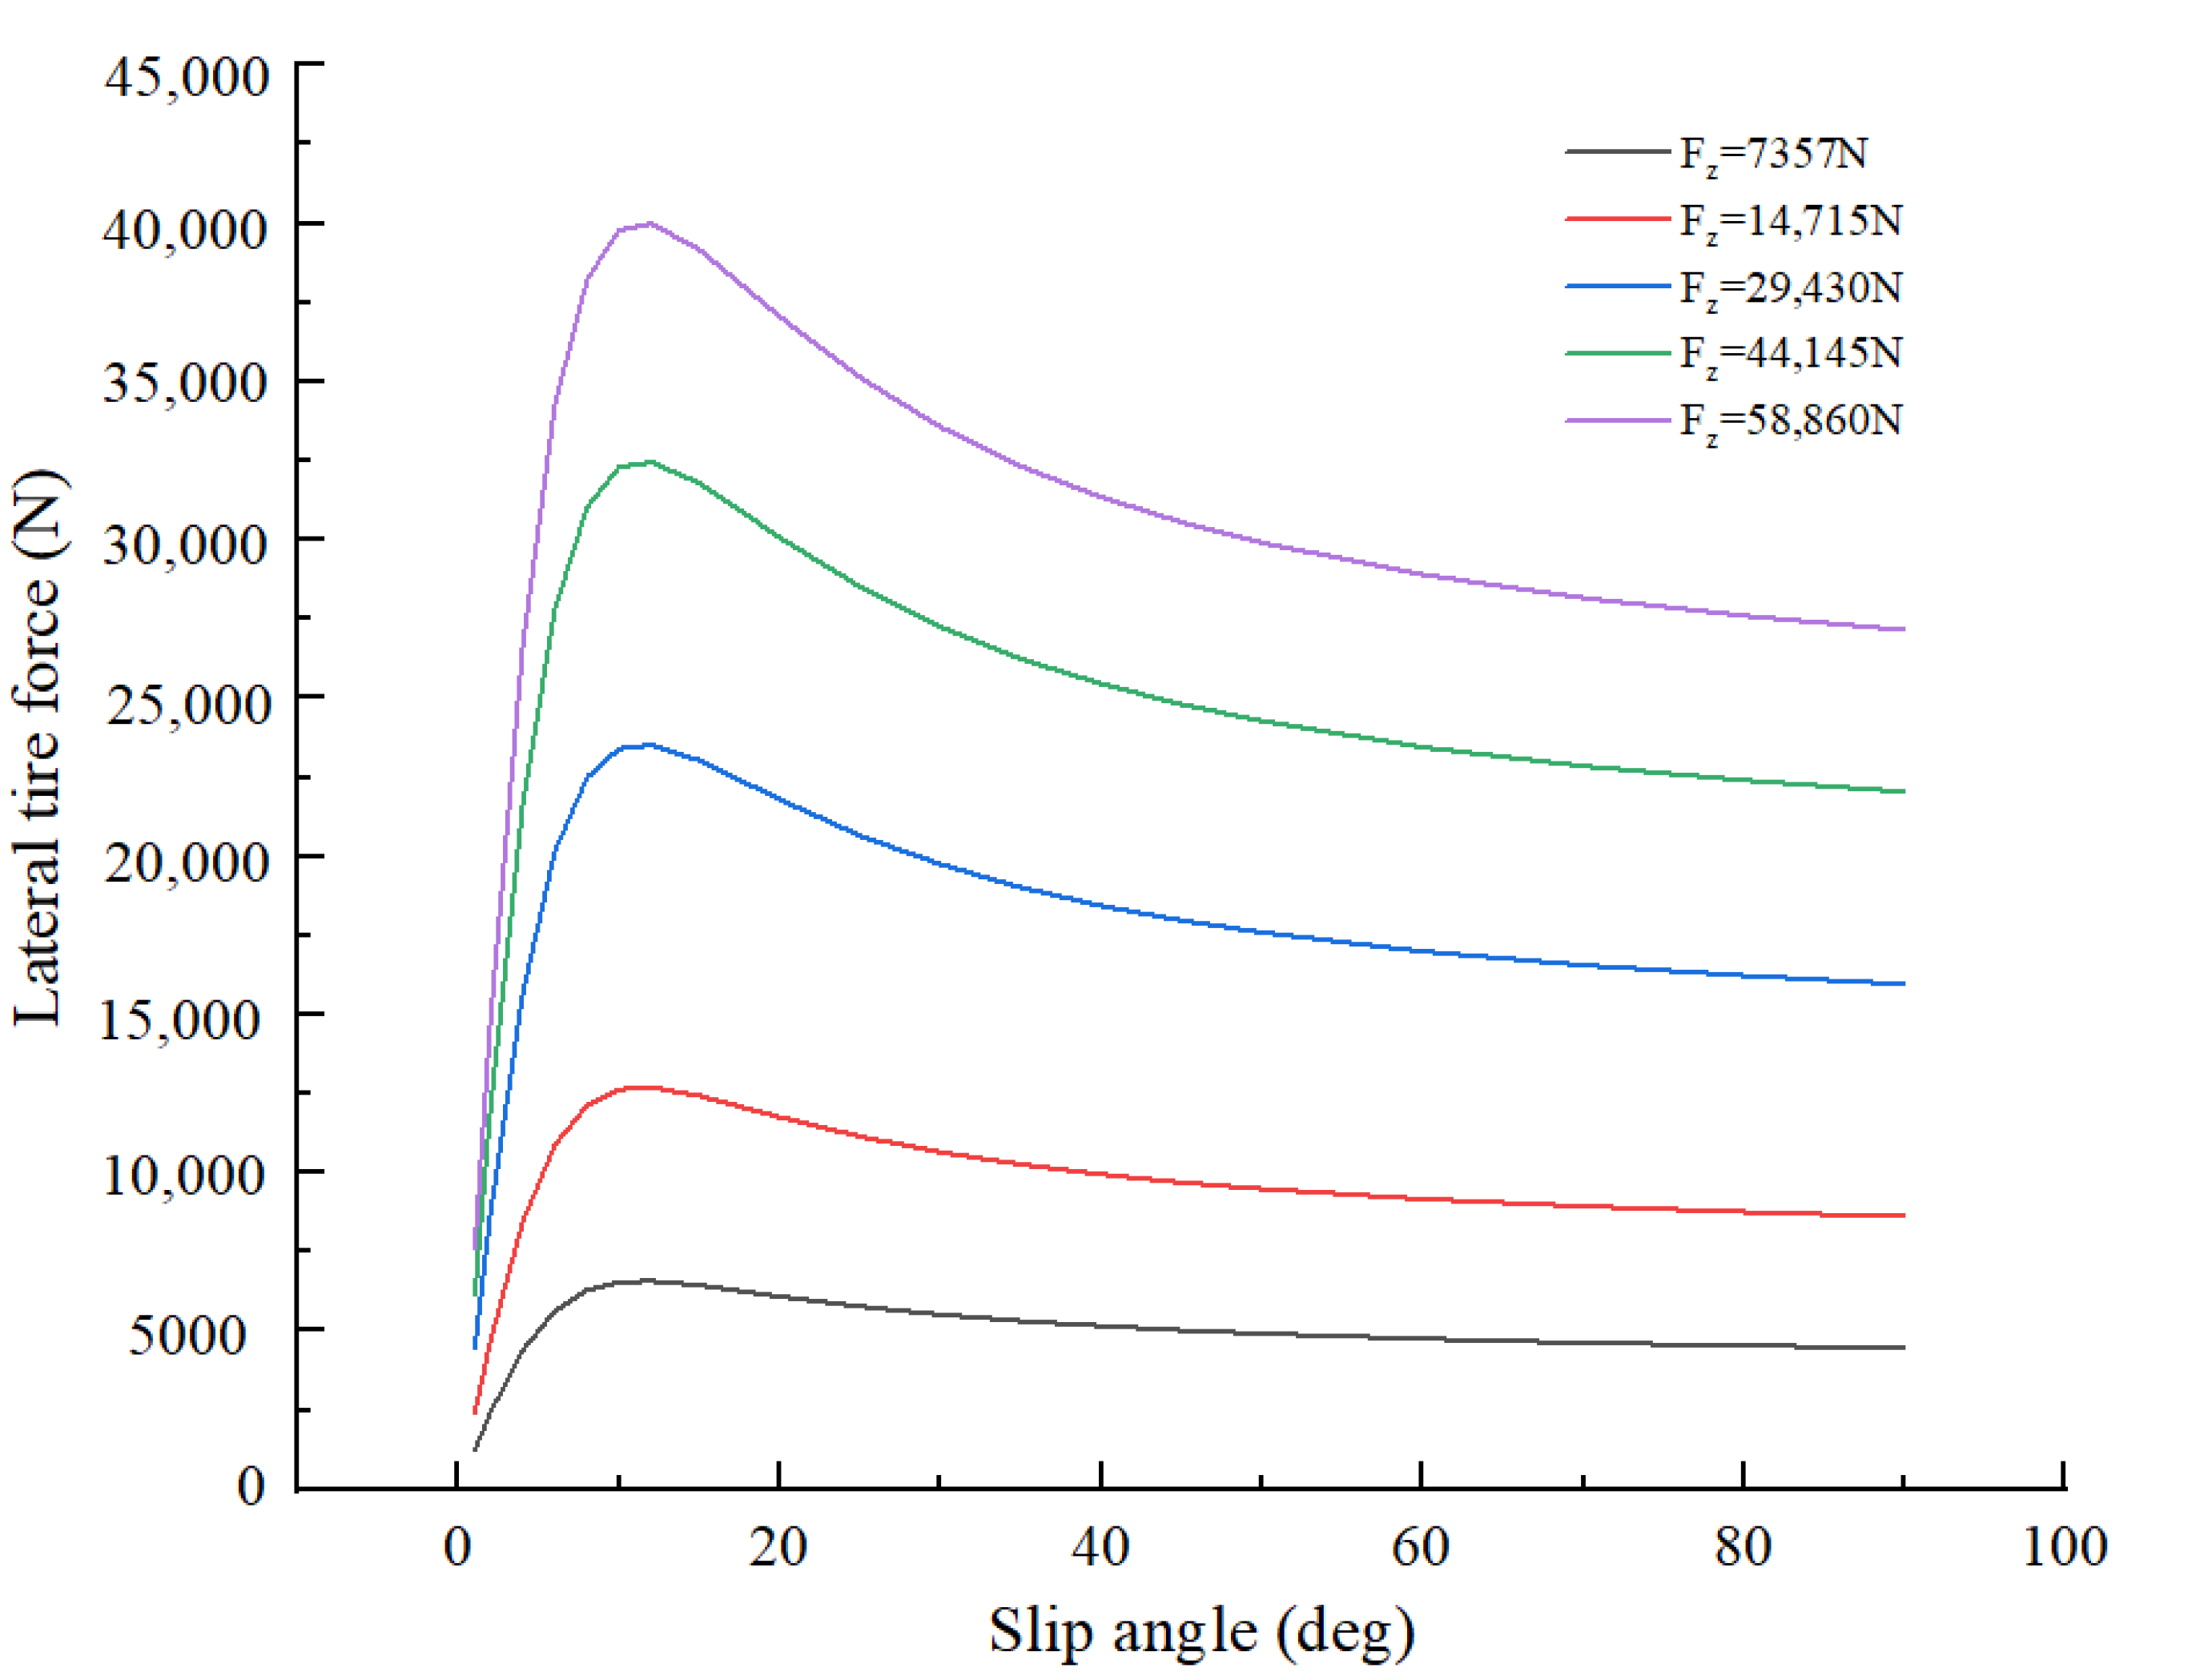
3.4.2. Identification of Parameters
4. Computer Simulation Methods
4.1. Simulation Modeling
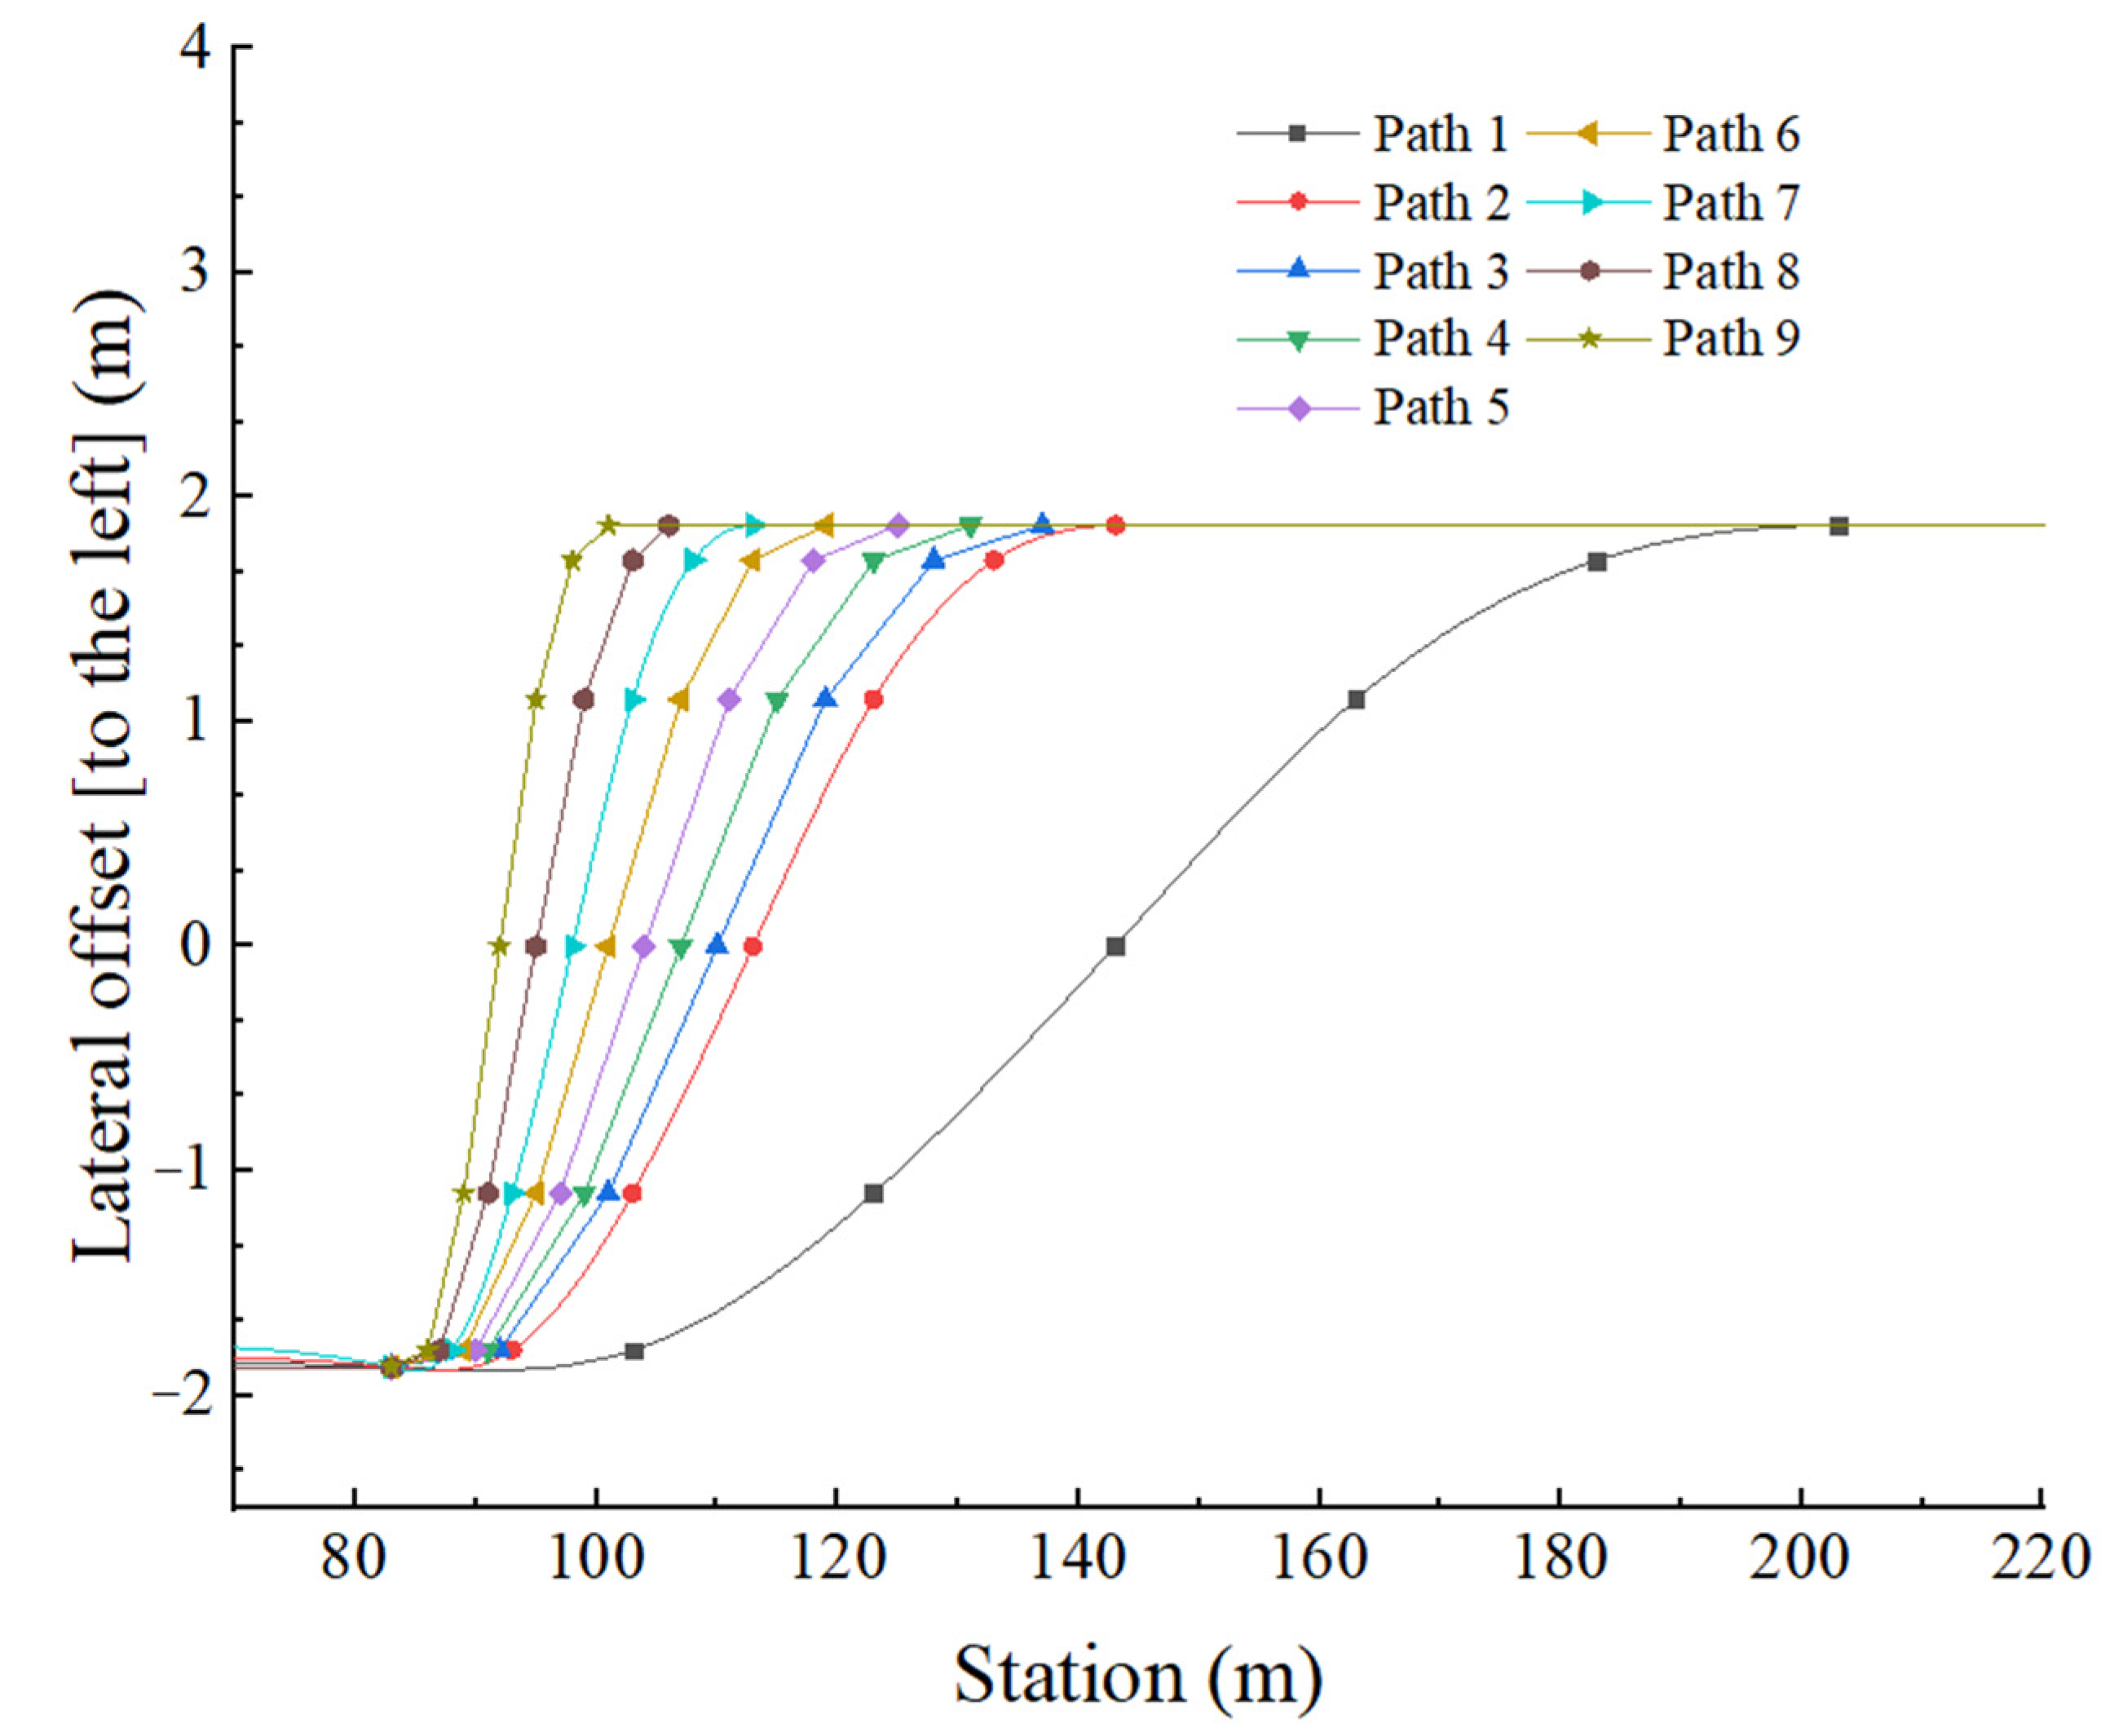
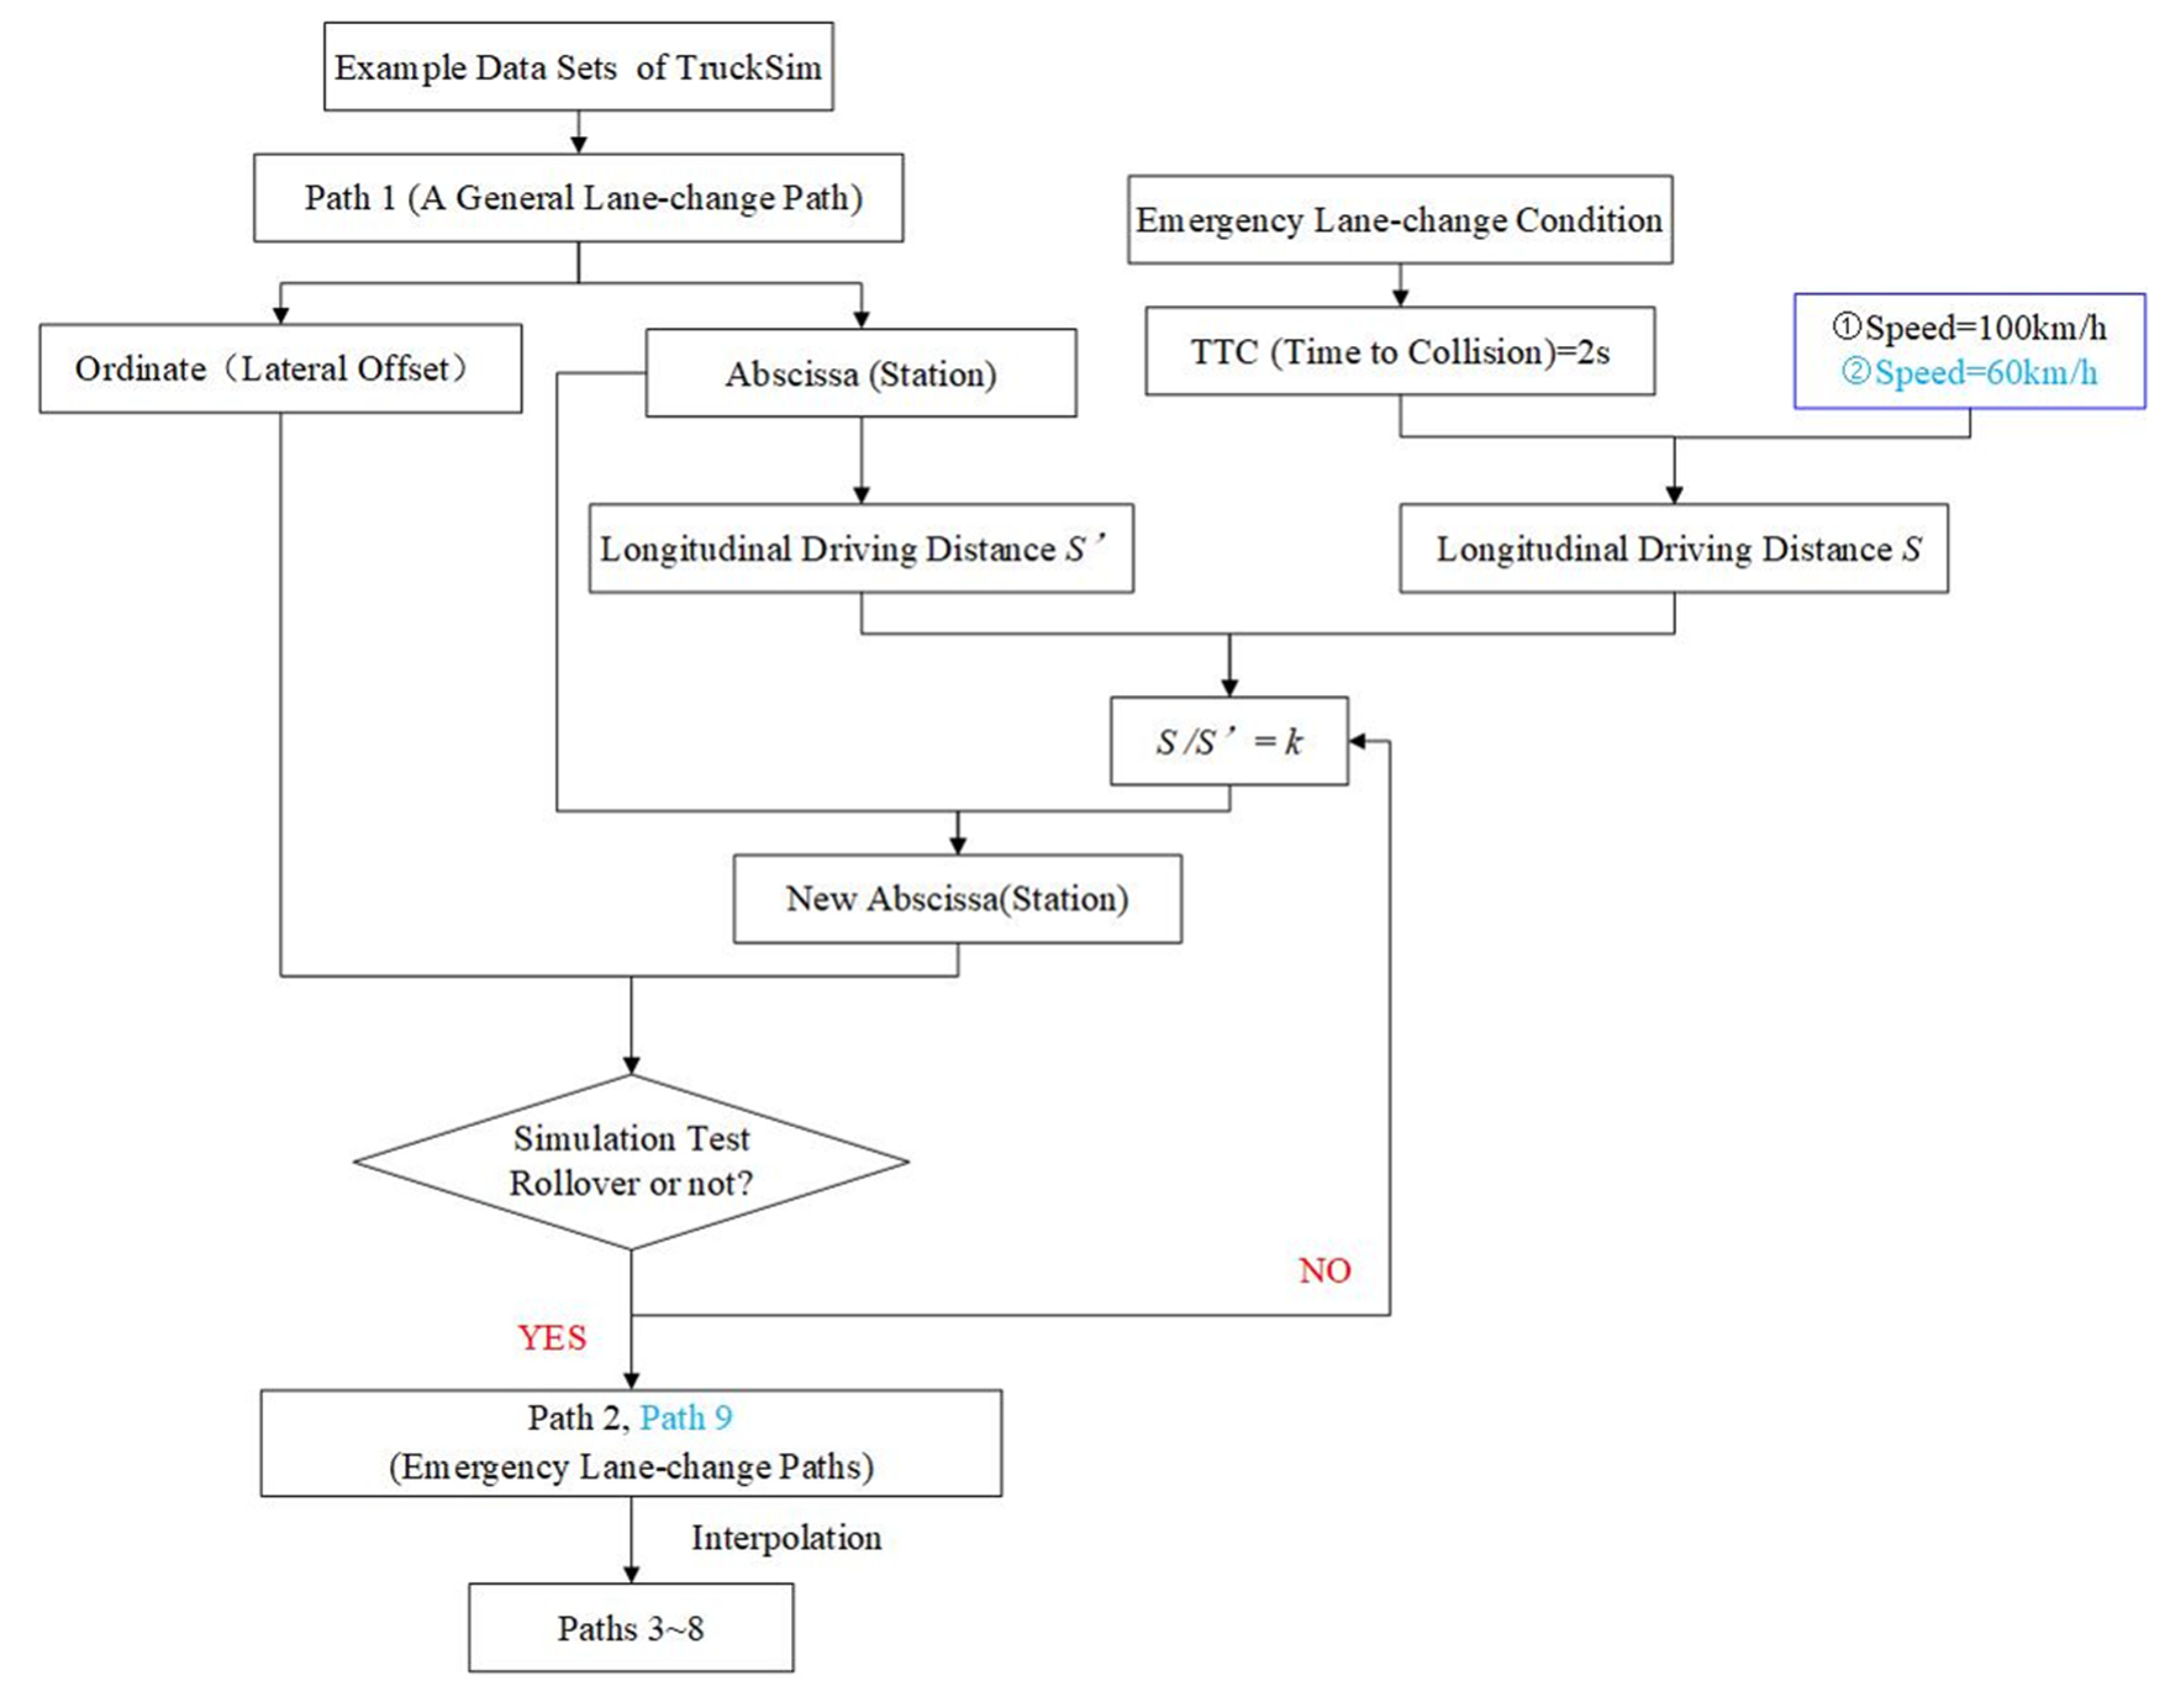
4.1.1. Target Speeds and Travel Paths
4.1.2. Methods of Establishing Travel Paths
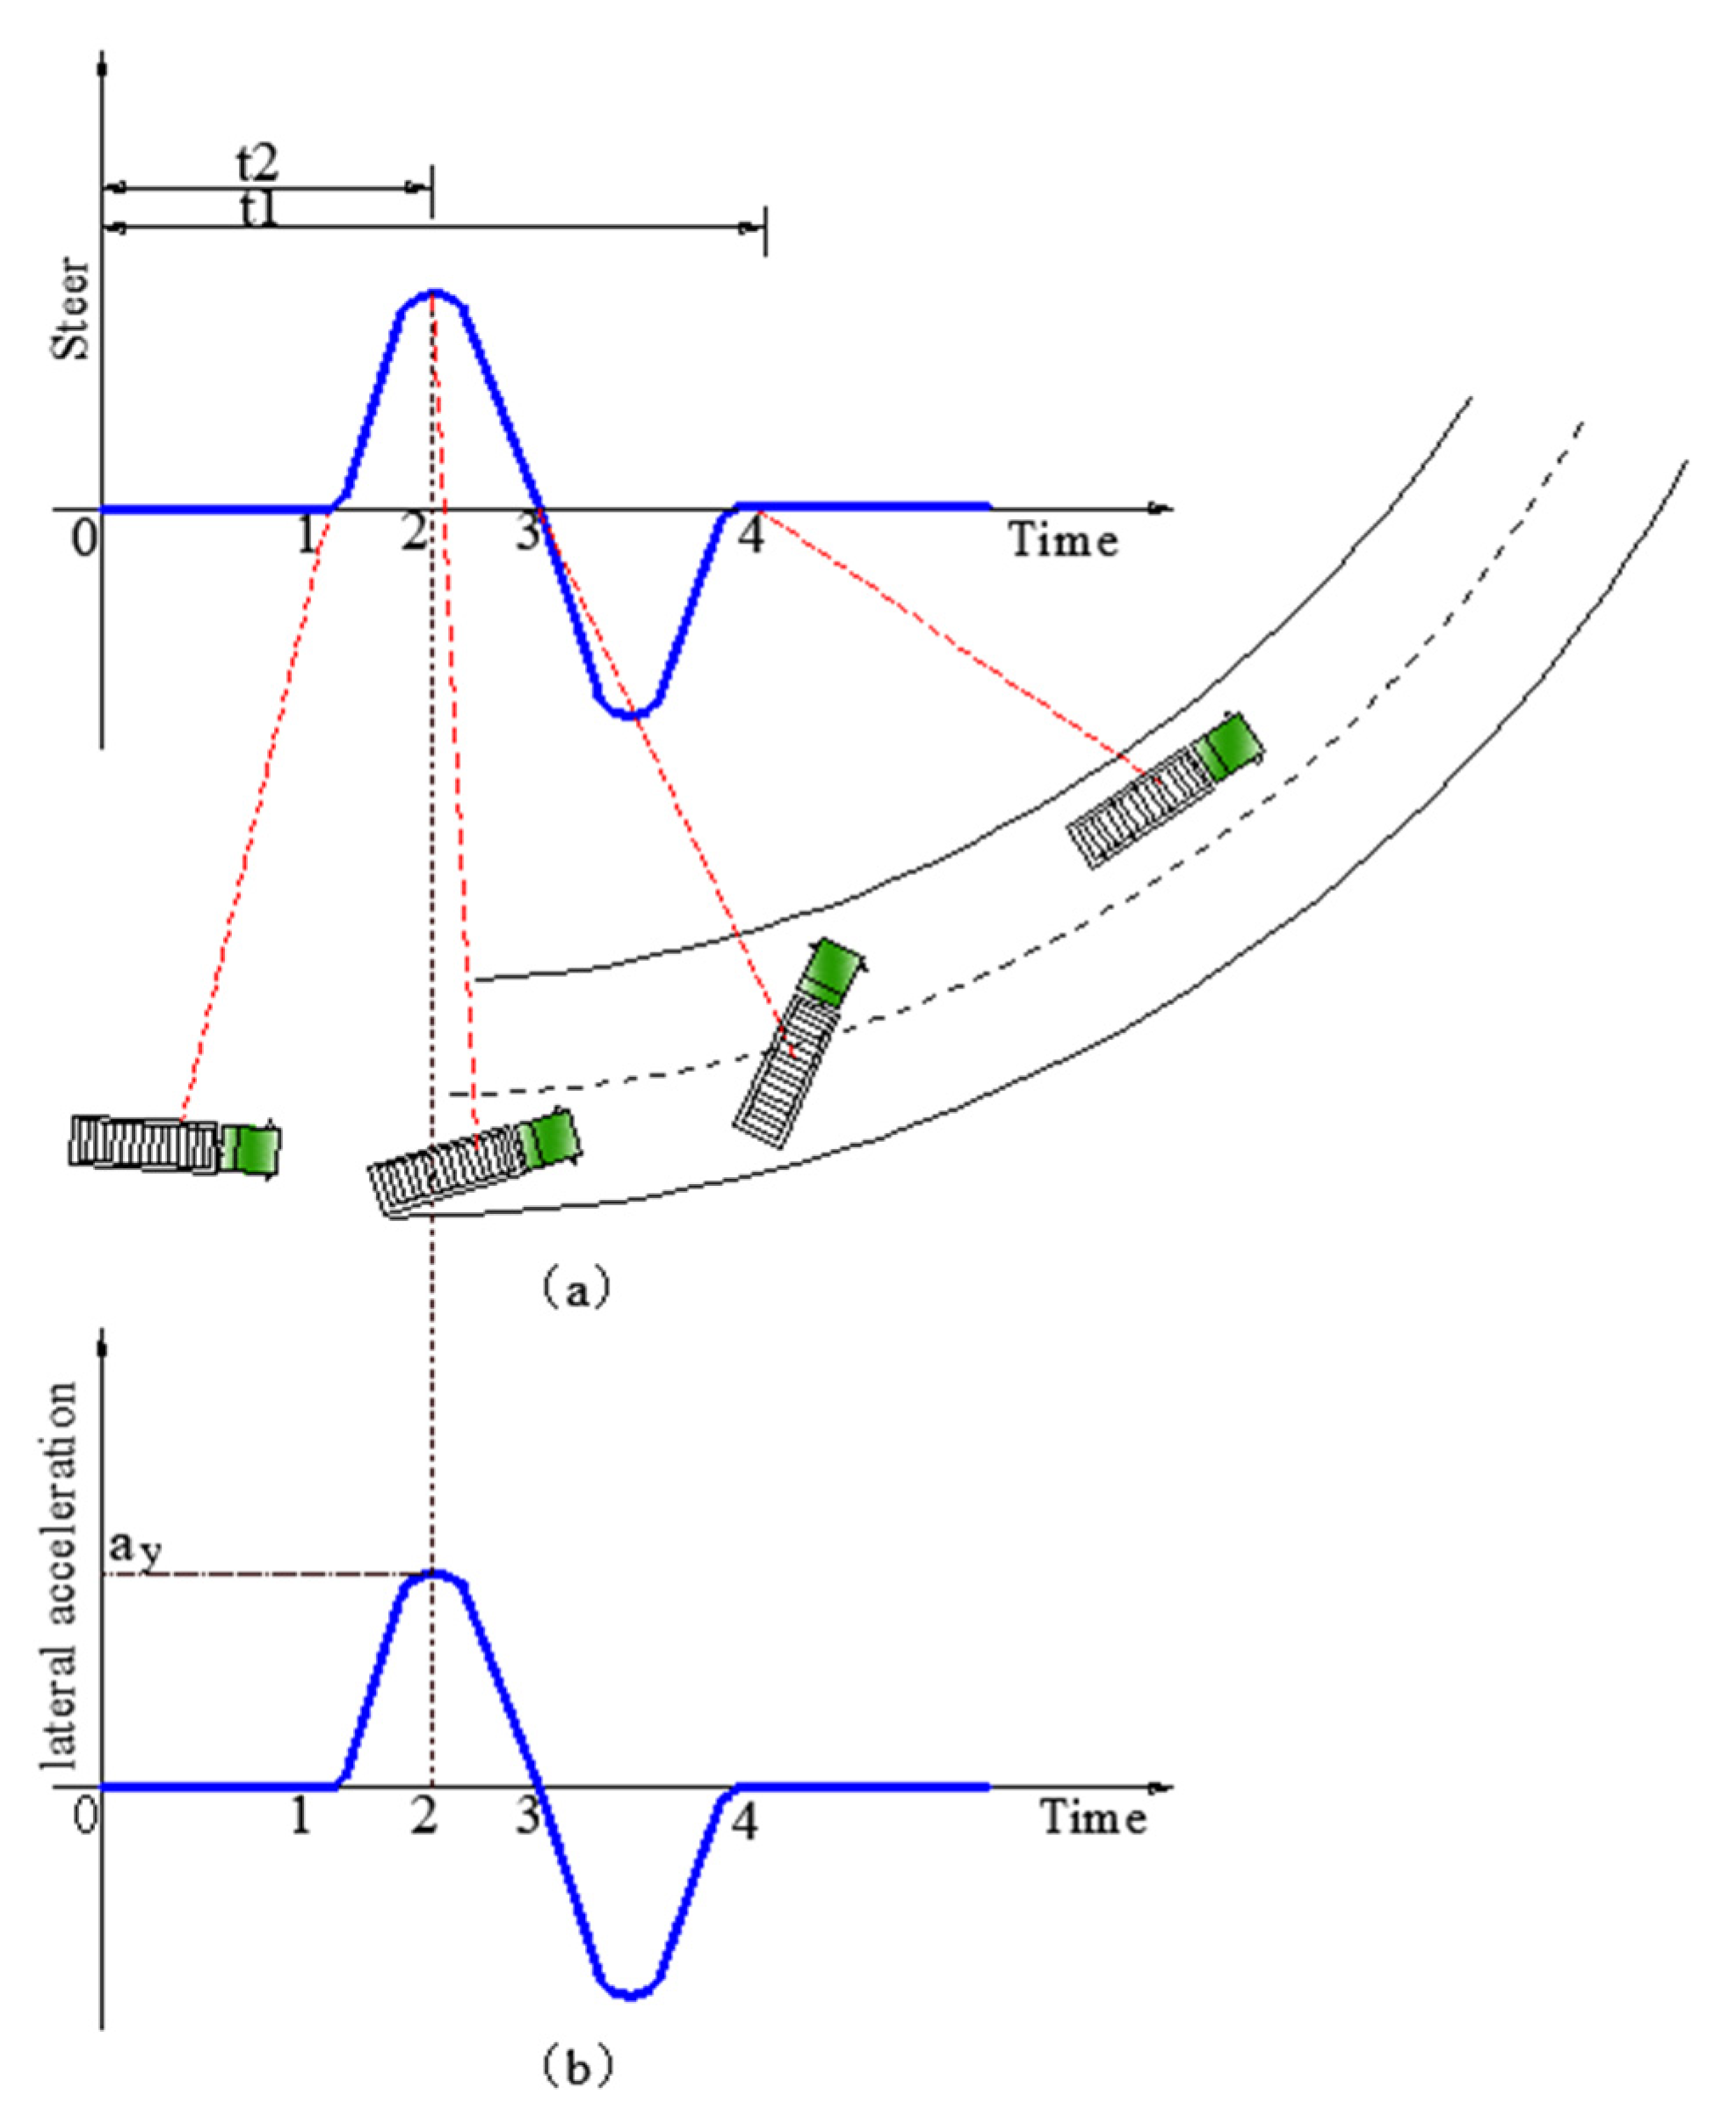
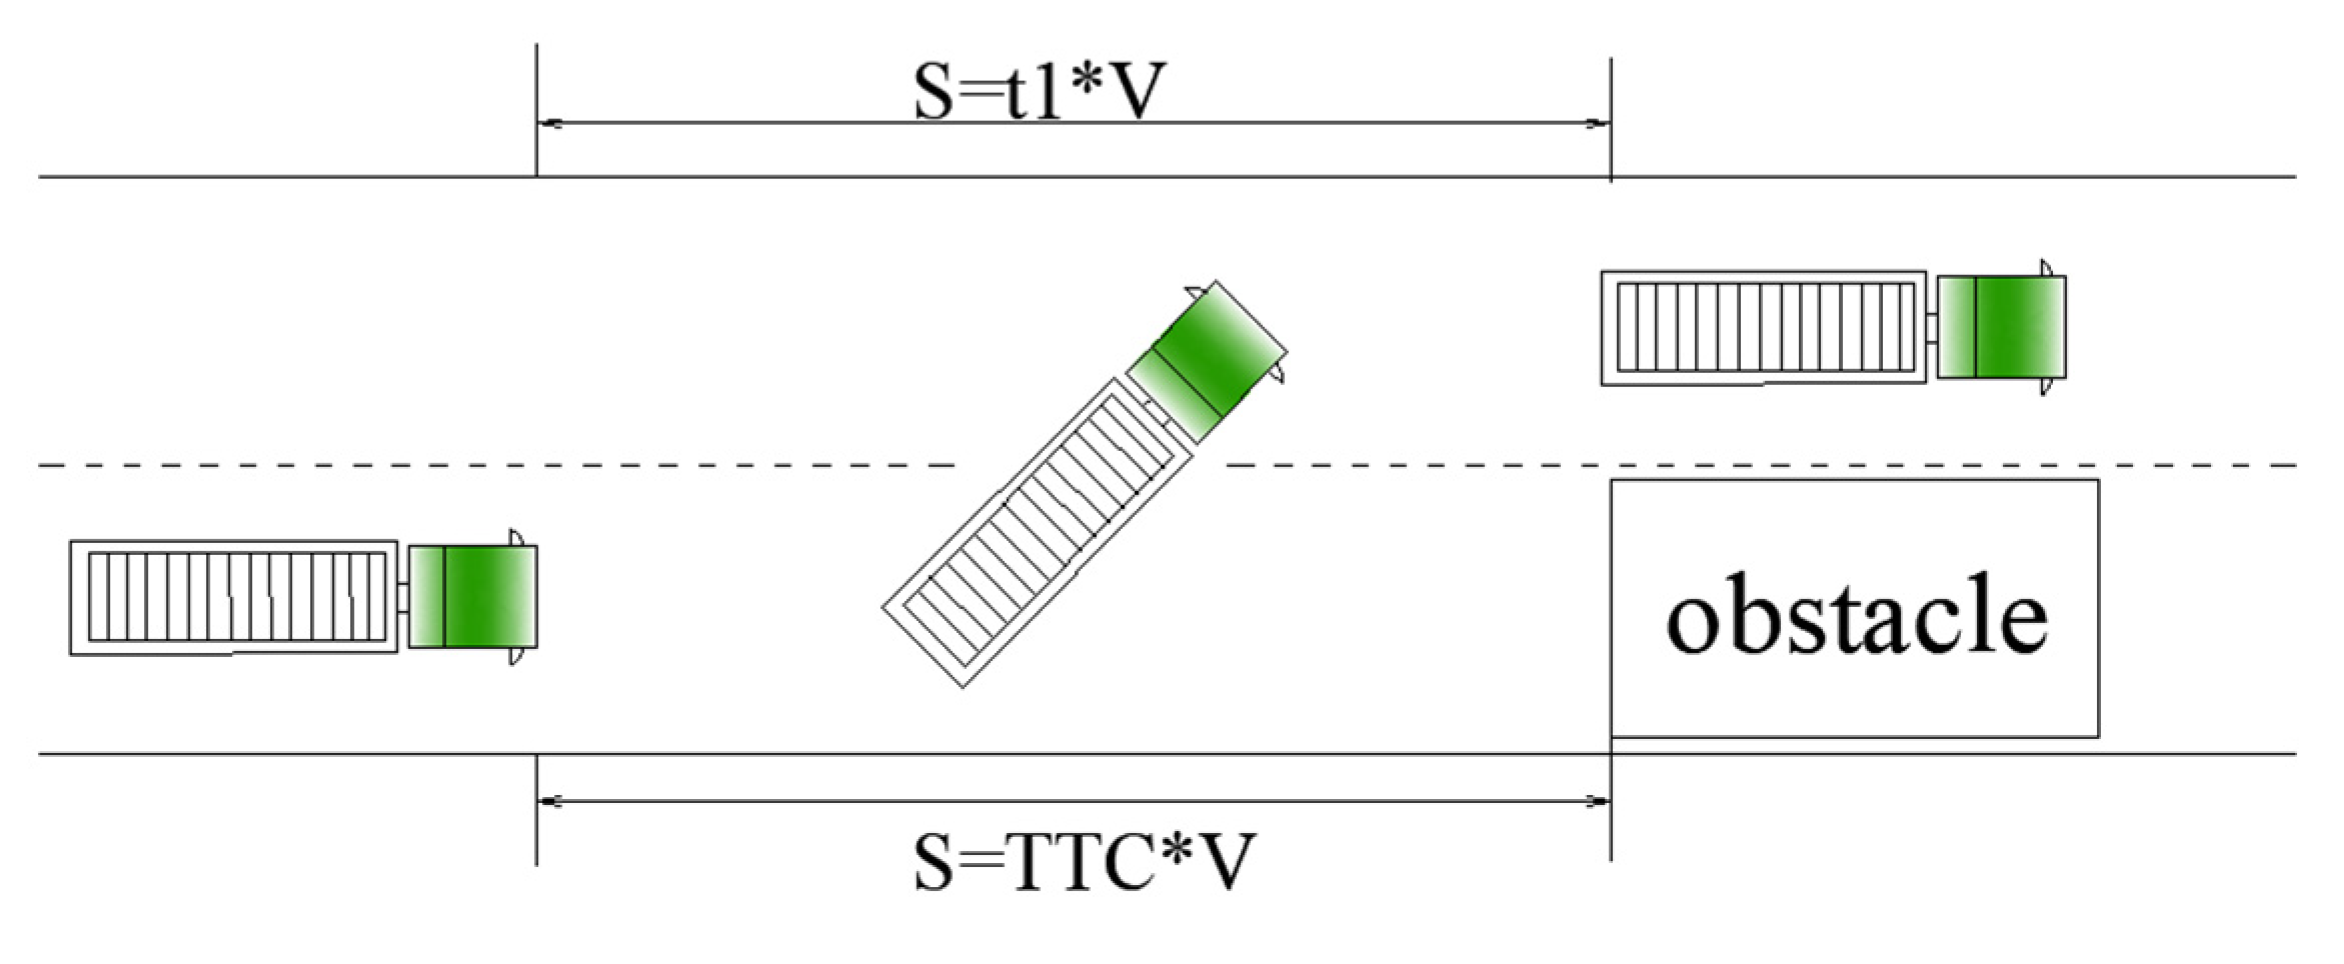
- Time of an emergency lane change.
- 2.
- Determination of the coefficient
4.2. Simulation Scenes Constructing
5. Results
5.1. Theoretical Results
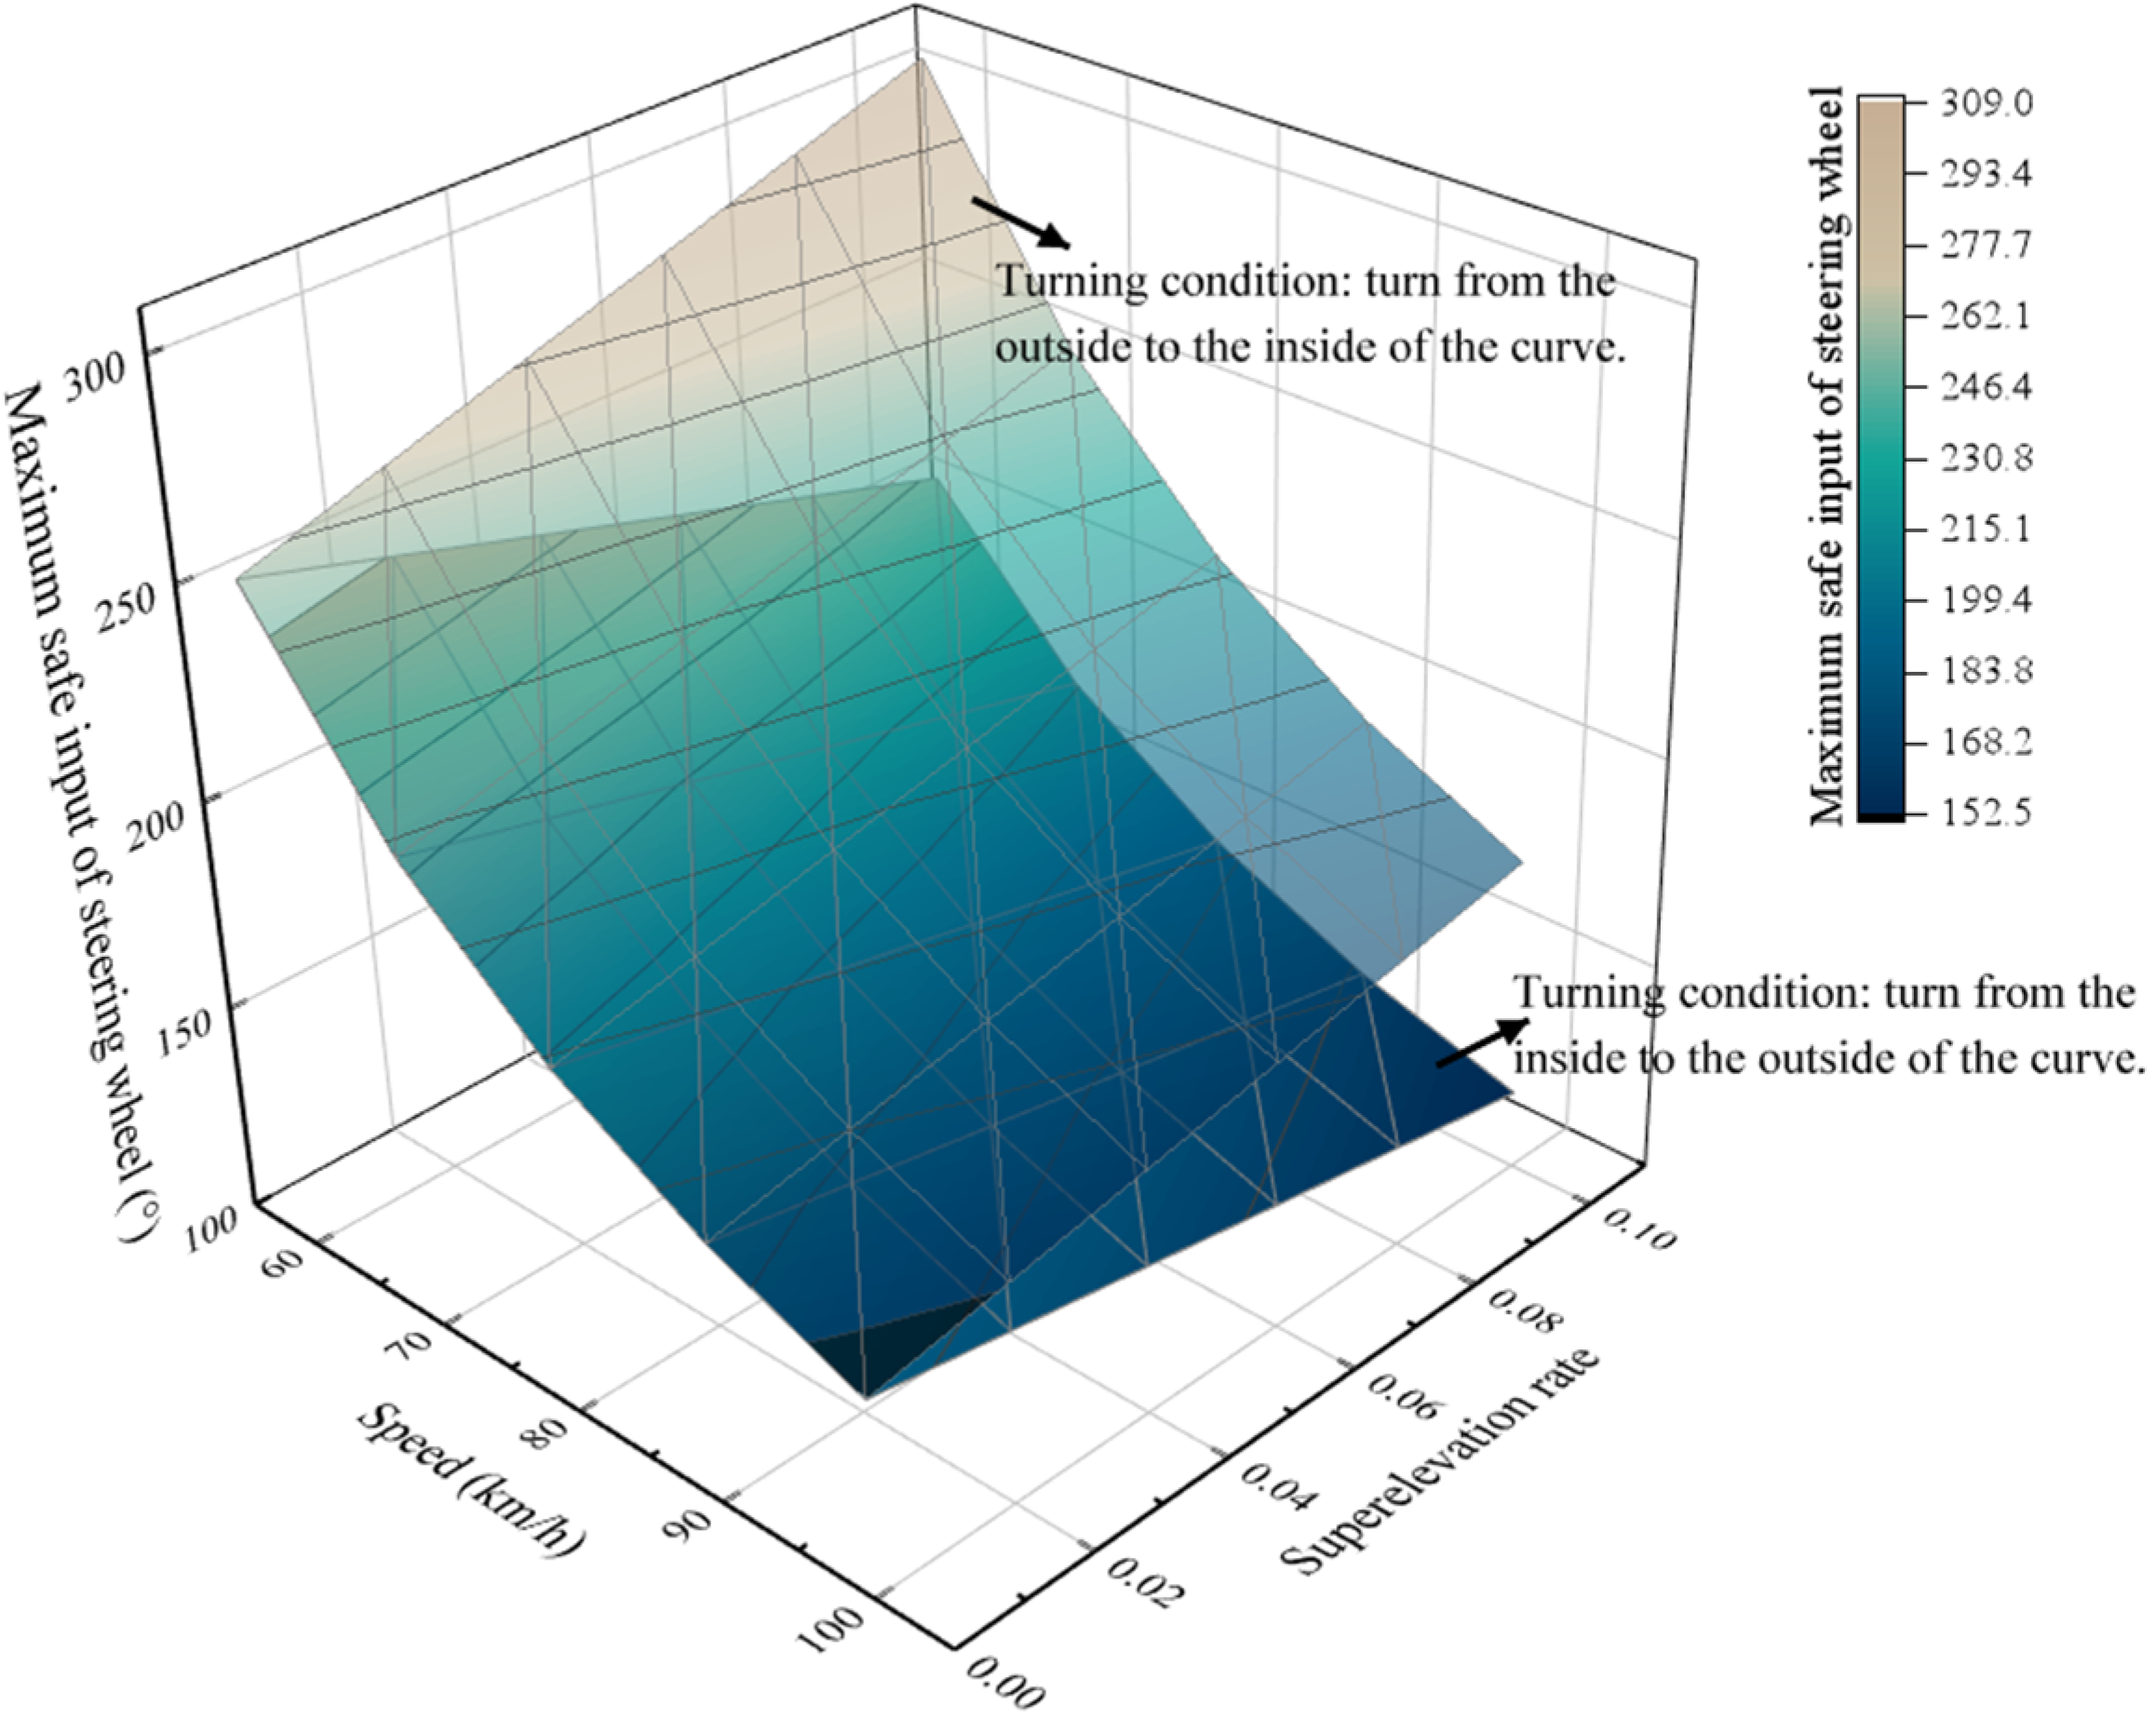
- , , , , , . The relationship between speed, superelevation rate and the maximum safe input of the steering wheel is shown in Figure 14.
- 2.
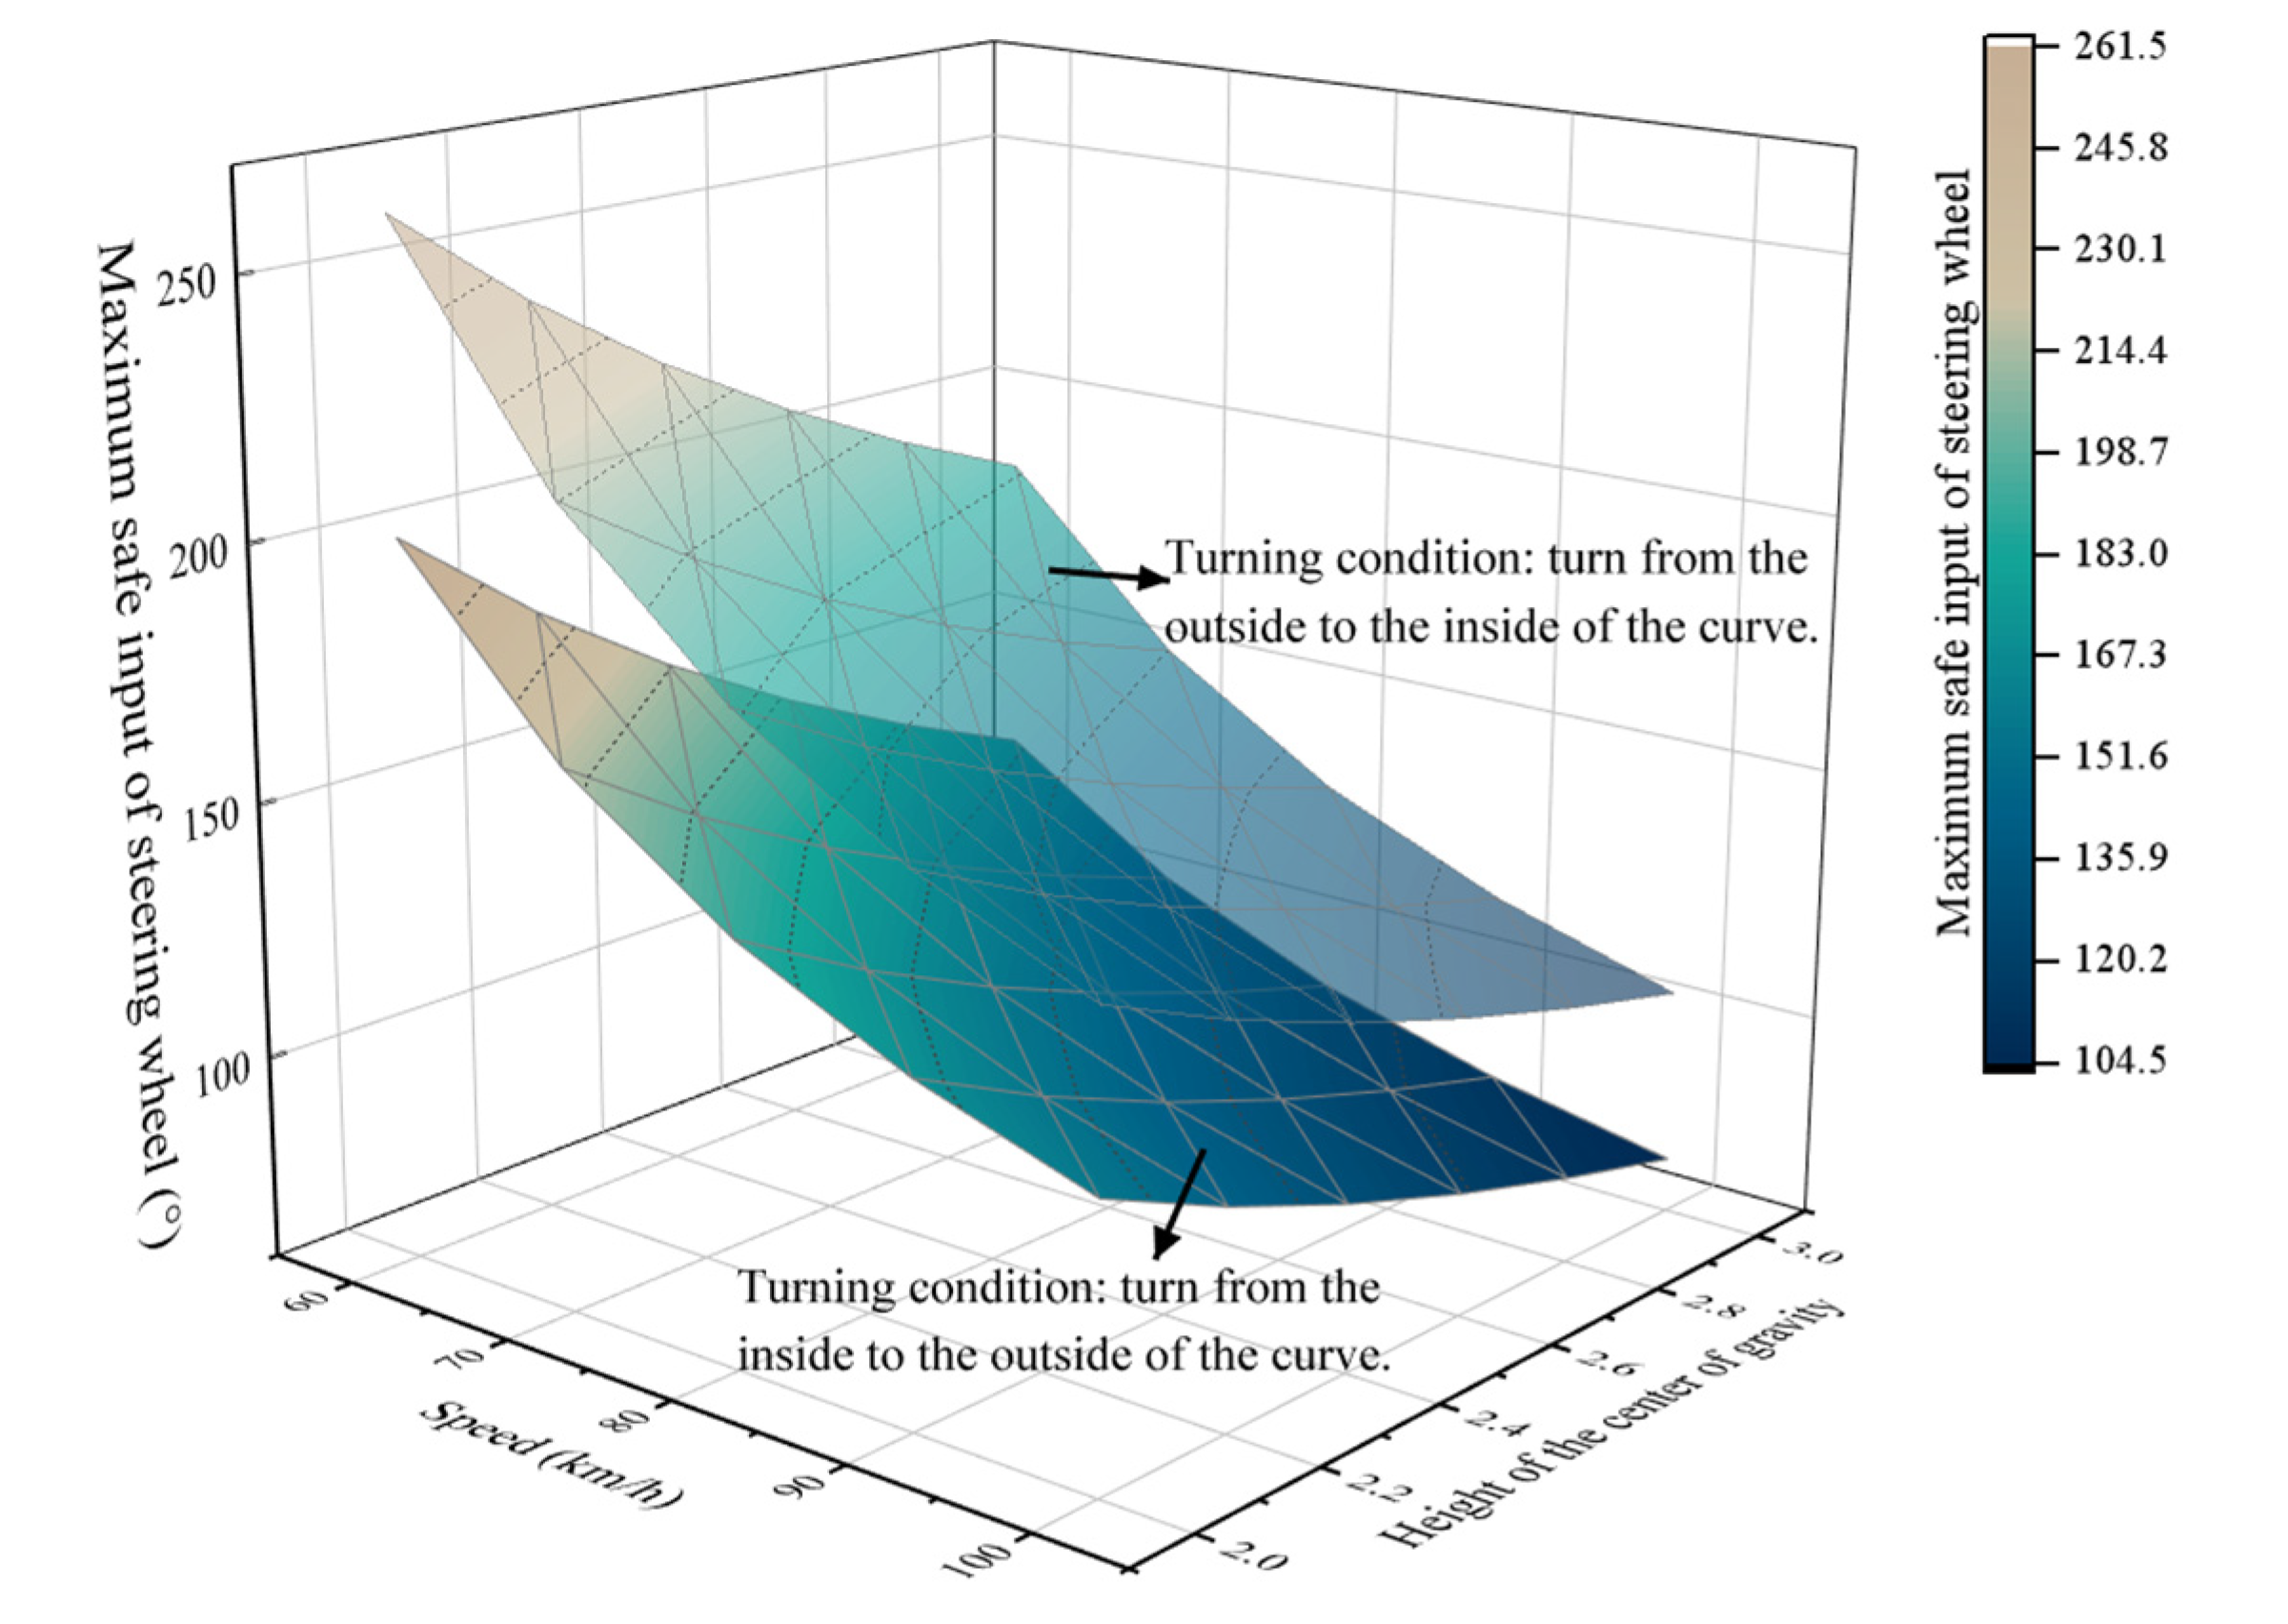
- , , , , , . The relationship between speed, CG height and maximum safe input of the steering wheel is shown in Figure 15.
5.2. Simulation Results
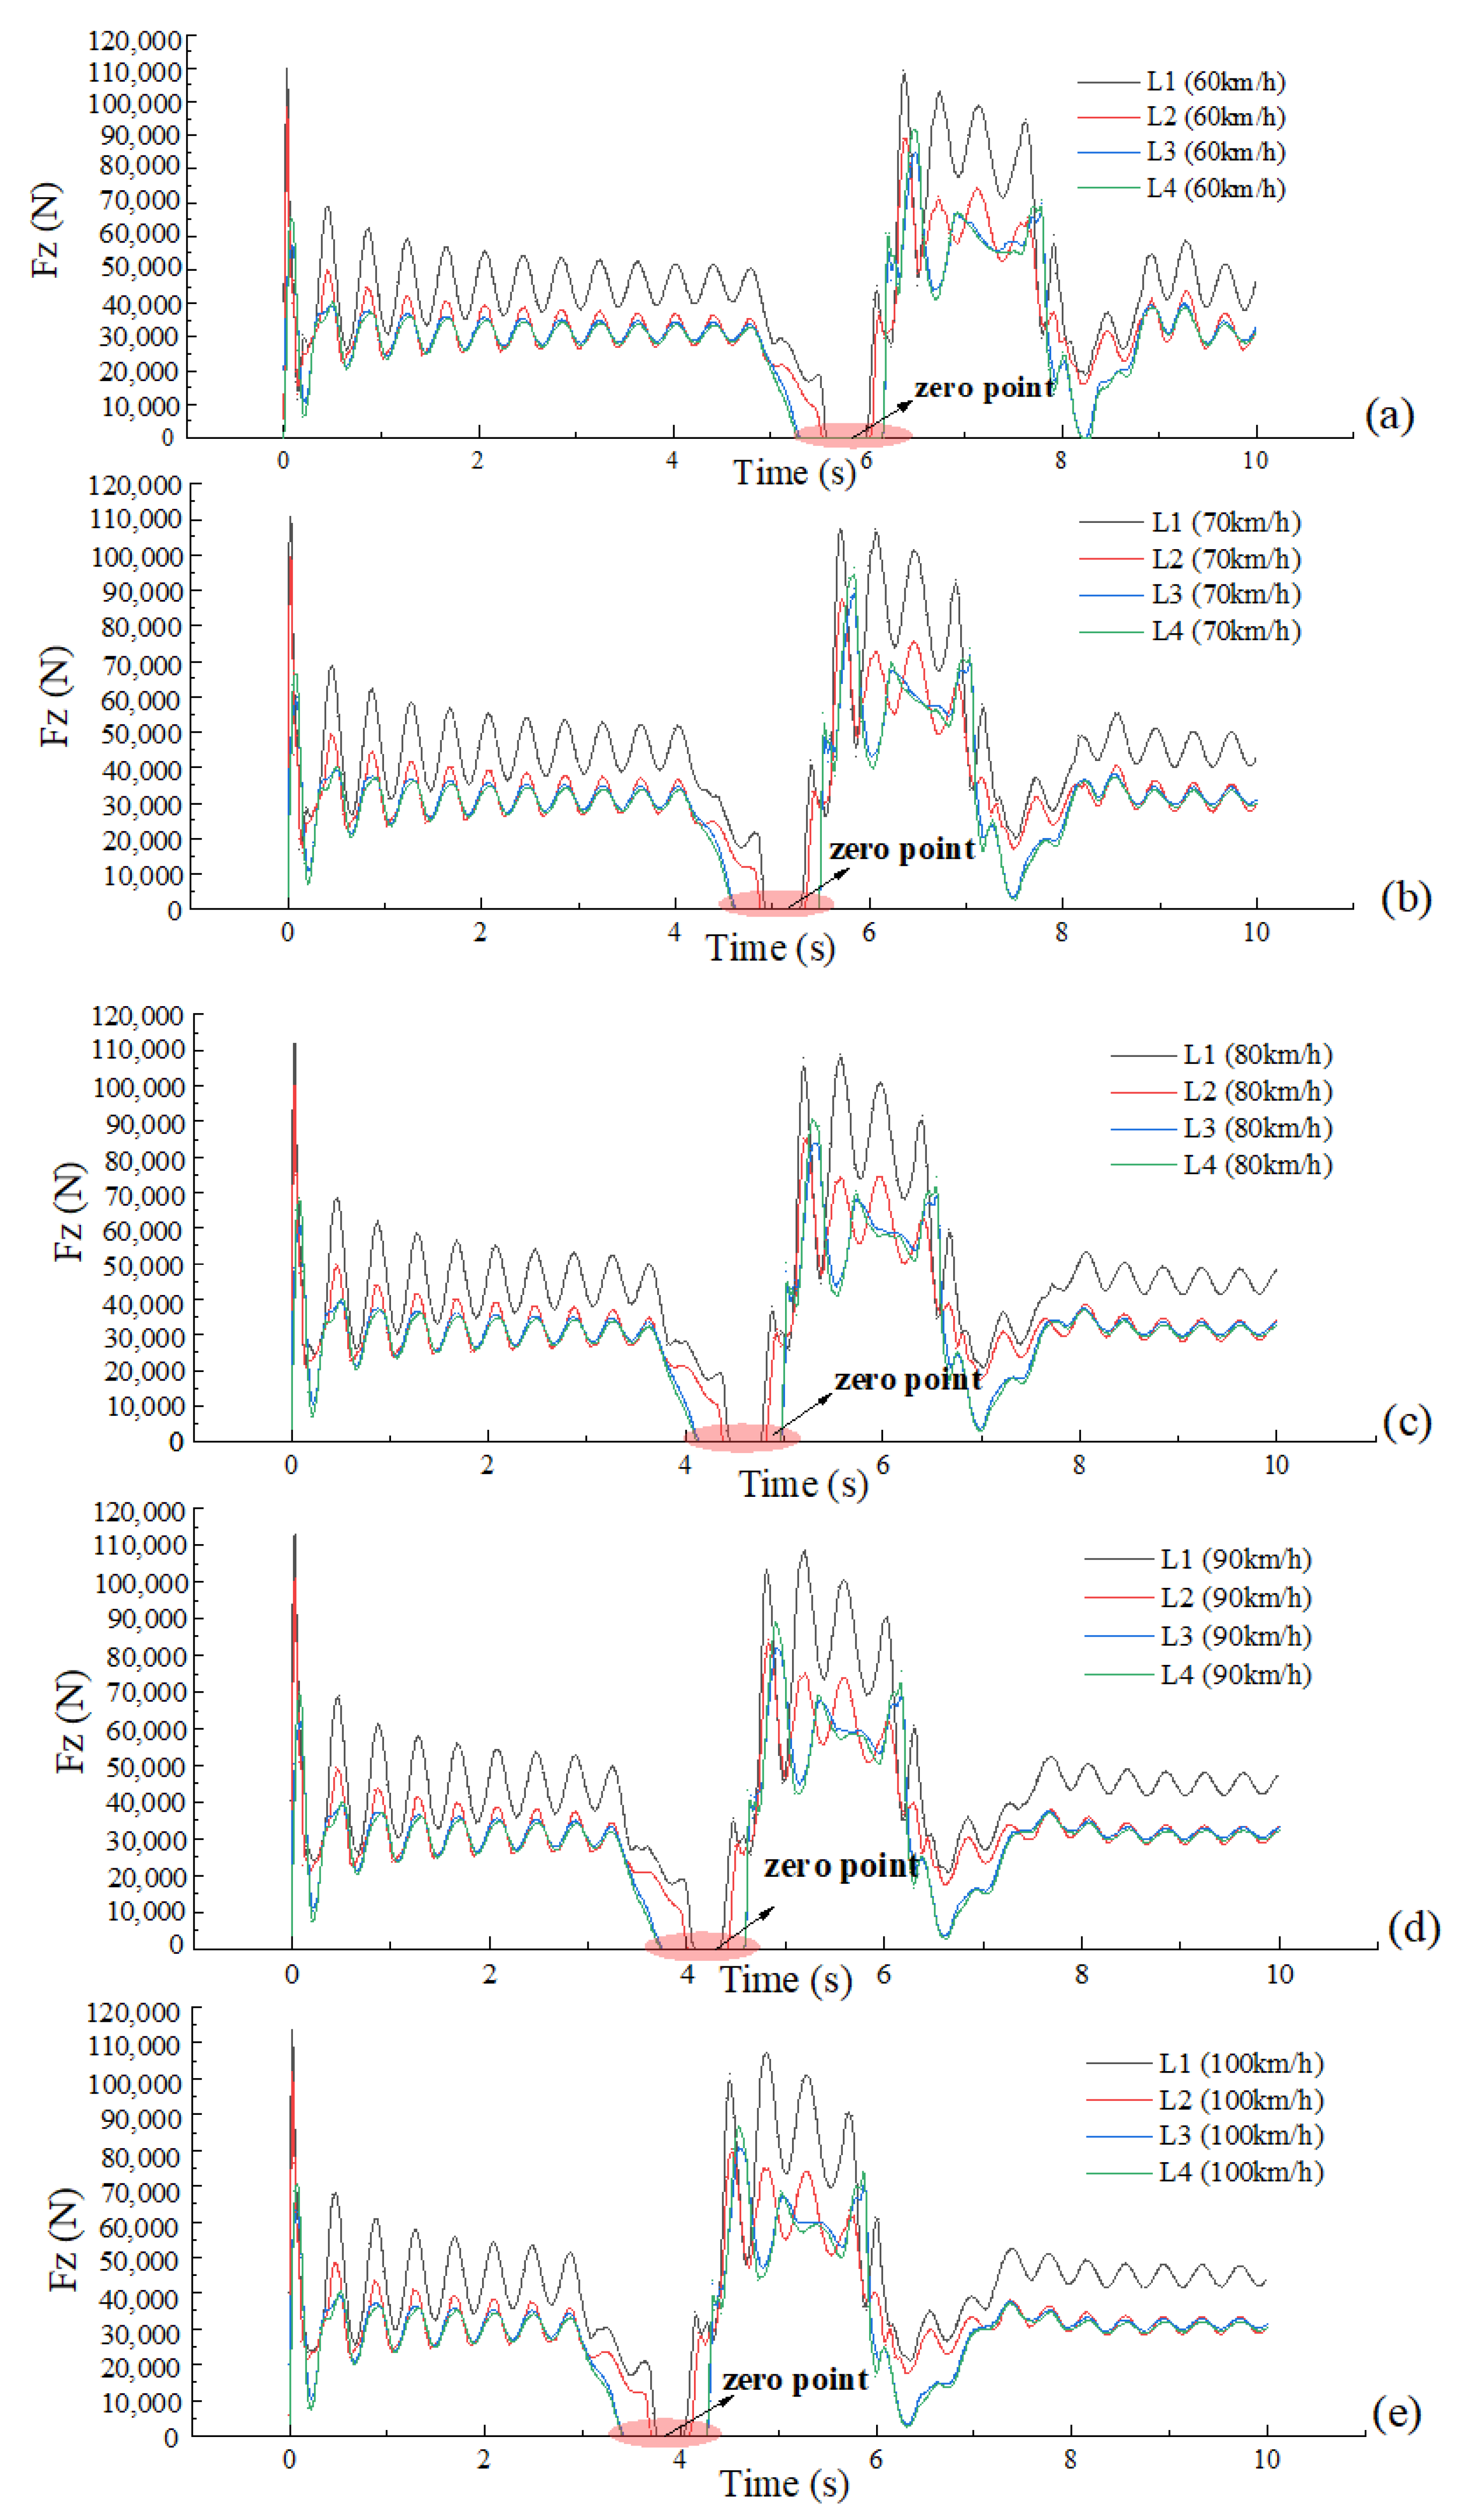
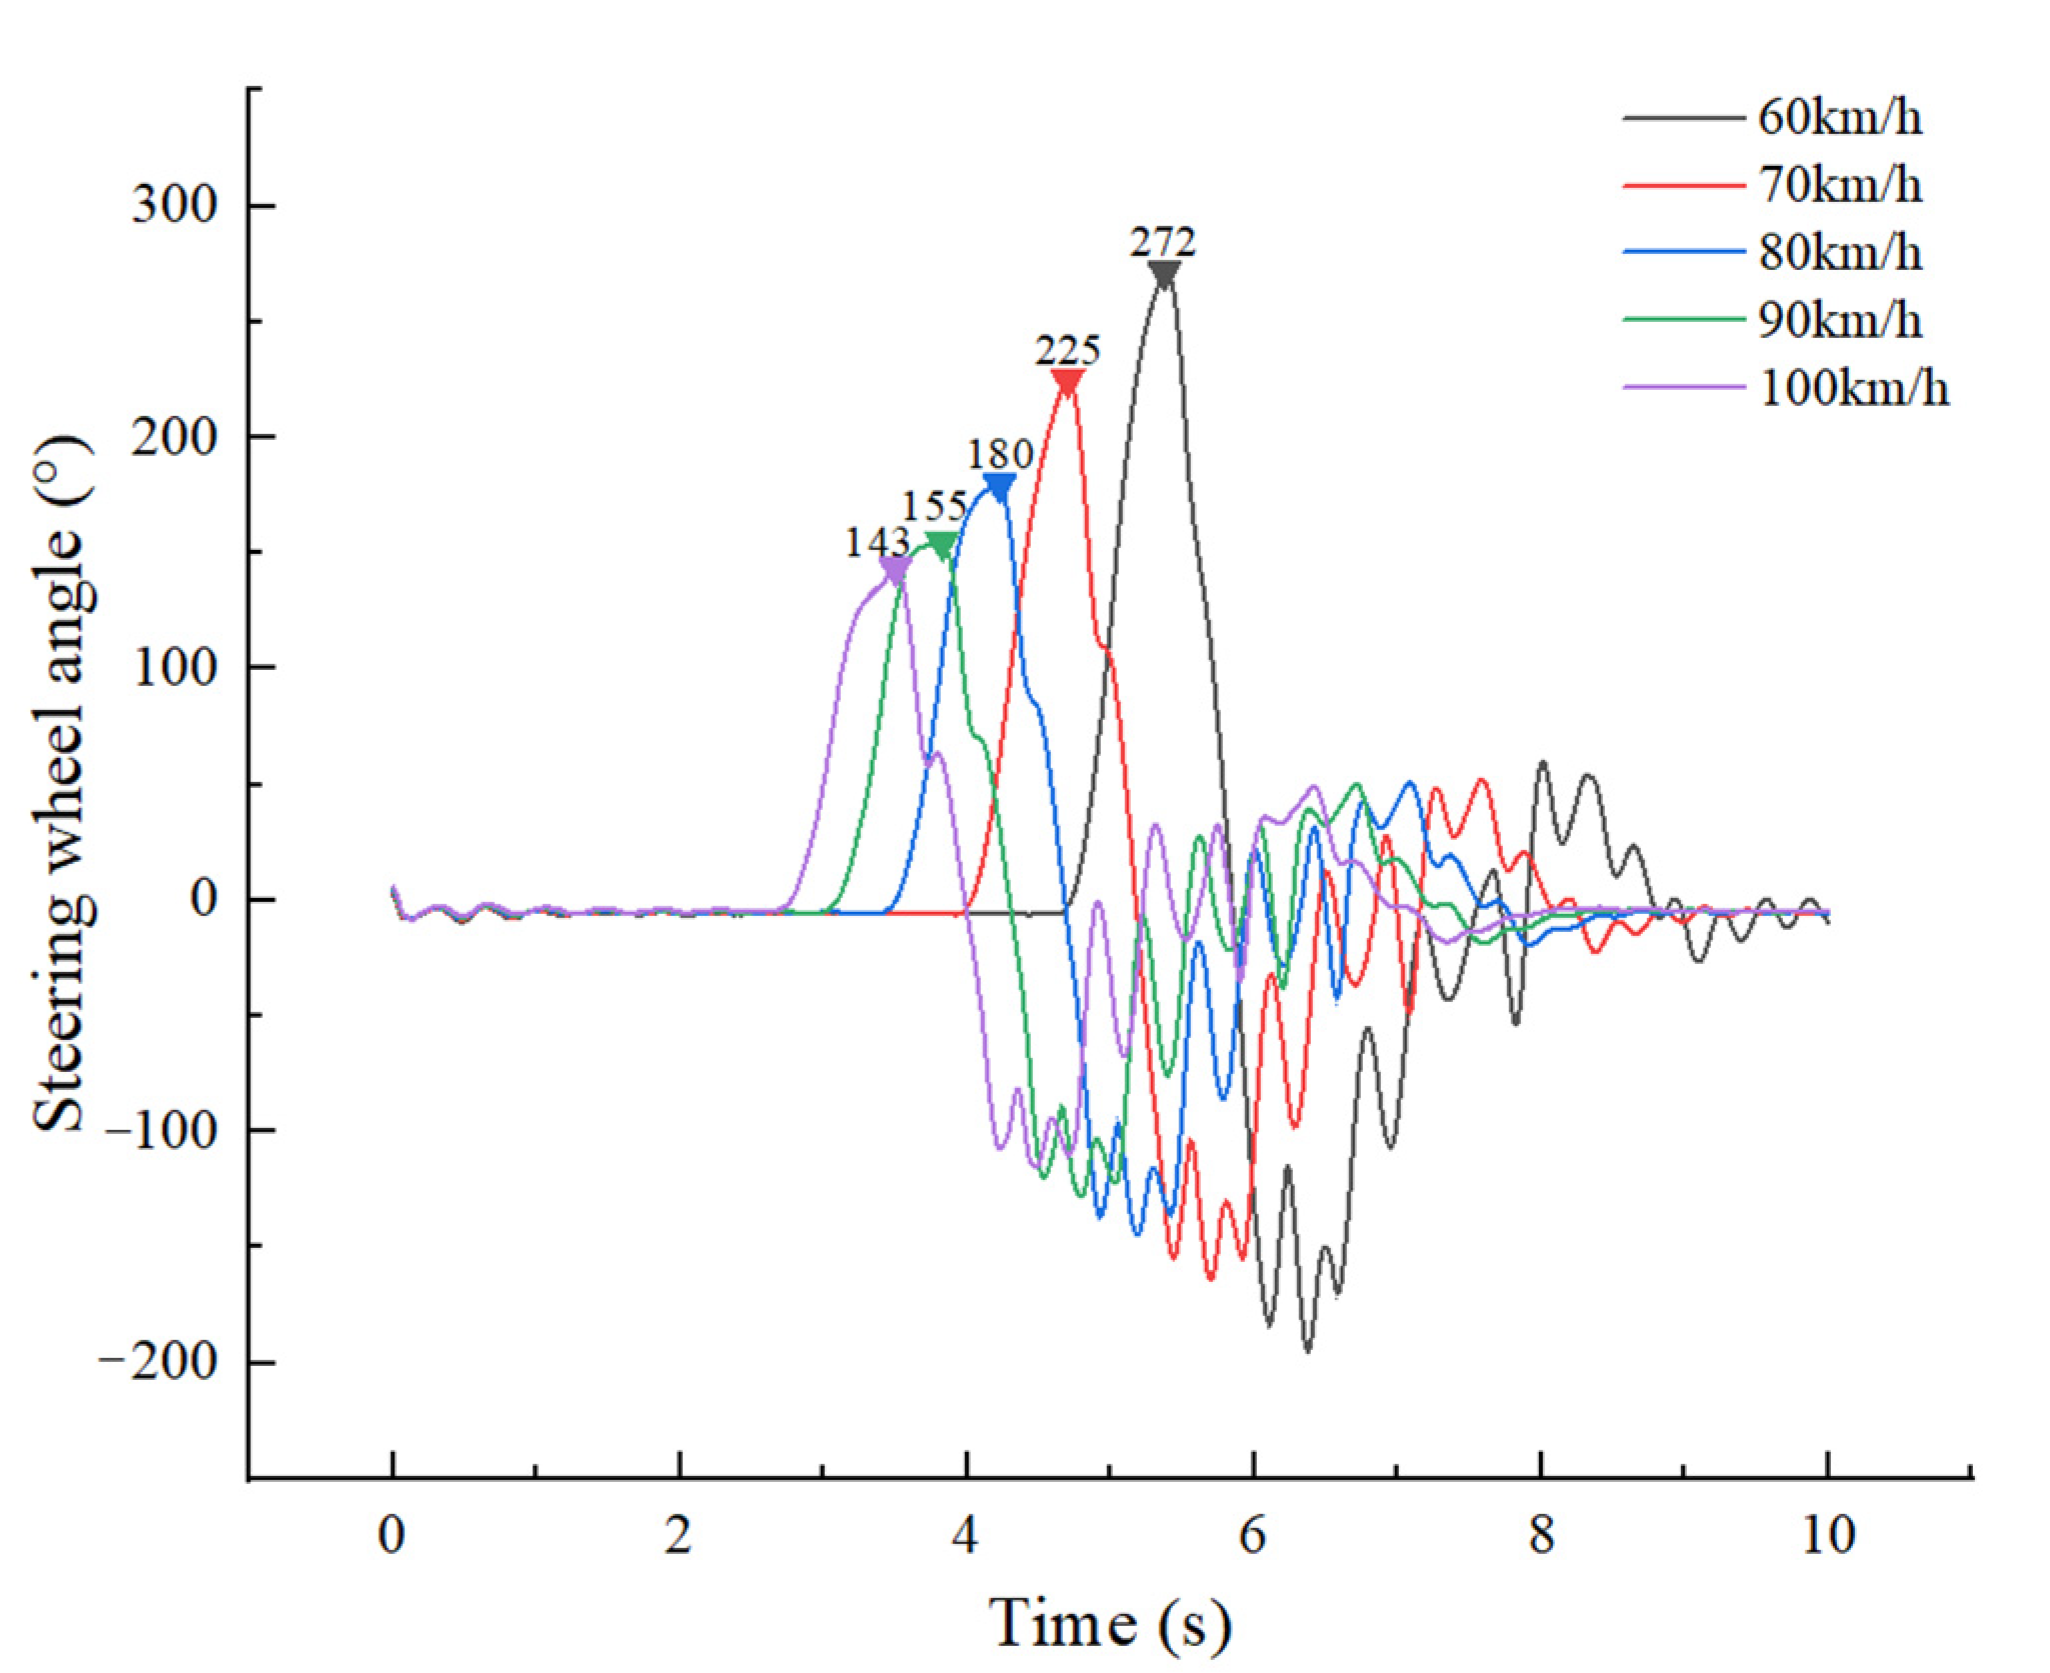
- As the full-load truck travelled along the No. 8 path at 60 km/h, and the steering wheel instantaneous input reached 272°, a very short time later, the vertical forces of the left tires (L1, L2, L3 and L4) of the truck were zero, that is, all the left tires lifted and the truck was just about to overturn, as shown in Figure 16 and Figure 17. As the full-load truck travelled along the No. 9 path at 60 km/h, the truck overturned. Therefore, the maximum safe input of the steering wheel for a full-load truck at 60 km/h is 272°.
5.3. Comparison of Theoretical and Simulation Results
6. Discussion
7. Conclusions
Author Contributions
Funding
Institutional Review Board Statement
Informed Consent Statement
Data Availability Statement
Conflicts of Interest
References
- FHWA. Roadway Departure Safety. Available online: https://safety.fhwa.dot.gov/roadway_dept/ (accessed on 23 November 2021).
- National Highway Traffic Safety Administration (NHTSA). A Compilation of Motor Vehicle Crash Data from the Fatality Analysis Reporting System and the General Estimates System; NHTSA, U.S. Department of Transportation: Washington, DC, USA, 2020; pp. 76–83. Available online: https://crashstats.nhtsa.dot.gov/#!/DocumentTypeList/11 (accessed on 30 December 2021).
- SAE. Recommended Practice, Roll-Over Tests Without Collision-SAE J857a, SAE Handbook; SAE International: Pittsburgh, PA, USA, 1969. [Google Scholar]
- Ford, J.E.; Thompson, J.E. Vehicle Rollover Dy namics Prediction by Mathematical Model. In Proceedings of the Thirteenth Stapp Car Crash Conference; Society of Automotive Engineers, Inc.: New York, NY, USA, 1969. [Google Scholar]
- Chen, F.; Ma, X.; Chen, S.; Yang, L. Crash Frequency Analysis Using Hurdle Models with Random Effects Considering Short-Term Panel Data. Int. J. Environ. Res. Public Health 2016, 13, 1043. [Google Scholar] [CrossRef] [Green Version]
- Yin, Y.; Wen, H.; Sun, L.; Hou, W. The influence of road geometry on vehicle rollover and skidding. Int. J. Environ. Res. Public Health 2020, 17, 1648. [Google Scholar] [CrossRef] [PubMed] [Green Version]
- Mao, X.; Yuan, C.; Gan, J.; Zhang, S. Risk factors affecting traffic accidents at urban weaving sections: Evidence from China. Int. J. Environ. Res. Public Health 2019, 16, 1542. [Google Scholar] [CrossRef] [PubMed] [Green Version]
- Farmer, C.M.; Lund, A.K. Rollover risk of cars and light trucks after accounting for driver and environmental factors. Accid. Anal. Prev. 2002, 34, 163–173. [Google Scholar] [CrossRef]
- Rudin-Brown, C.M. Vehicle Height Affects Drivers’ Speed Perception Implications for Rollover Risk. Transp. Res. Rec. J. Transp. Res. Board 2004, 1899, 84–89. [Google Scholar] [CrossRef]
- Mcknight, A.J.; Bahouth, G.T. Analysis of Large Truck Rollover Crashes. Traffic Inj. Prev. 2009, 10, 421–426. [Google Scholar] [CrossRef]
- National Highway Traffic Safety Administration (NHTSA). Special Crash Investigations On-Site Rollover Investigation; Vehicle: 2015 RAM 1500; Location: Missouri; Crash Date: May 2016; Report No. DOT HS 812 589; NHTSA, U.S. Department of Transportation: Washington, DC, USA, 2018.
- Phanomchoeng, G.; Rajamani, R. New Rollover Index for the Detection of Tripped and Untripped Rollovers. IEEE Trans. Ind. Electron. 2013, 60, 4726–4736. [Google Scholar] [CrossRef]
- FHWA. Horizontal Curve Safety 2019. Available online: https://safety.fhwa.dot.gov/roadway_dept/countermeasures/horicurves/ (accessed on 25 August 2021).
- Harwood, D.W.; Mason, J.M.; Glauz, W.D.; Kulakowski, B.T.; Fitzpatrick, K. Truck Characteristics for Use in Highway Design and Operation, Vol. I; Research Report. FHWA Report. FHWA-RD-89-226; Turner-Fairbank Highway Research Center: McLean, VA, USA, 1989.
- Harwood, D.W.; Marson, J.M. Horizontal Curve Design for Passenger Cars and Trucks. Transp. Res. Rec. 1994, 1445, 2–33. [Google Scholar]
- Harwood, D.W.; Torbic, D.J.; Richard, K.R.; Glauz, W.D.; Elefteriadou, L. NCHRP Report 505: Review of Truck Characteristics as Factors in Roadway Design; Transportation Research Board: Washington, DC, USA, 2003. [Google Scholar]
- American Association of State Highway and Transportation Officials (AASHTO). A Policy on Geometric Design of Highways and Streets, 7th ed.; American Association of State Highway and Transportation Officials: Washington, DC, USA, 2018. [Google Scholar]
- Bevan, G.P.; Gollee, H.; O’Reilly, J. Trajectory generation for road vehicle obstacle avoidance using convex optimization. Proc. Inst. Mech. Eng. Part D J. Automob. Eng. 2010, 224, 455–473. [Google Scholar] [CrossRef]
- Fausten. Accident Avoidance by Evasive Manoeuvres. In Proceedings of the 4th Tagung Sicherheit Durch Fahrerassistenz (TVSD), Munich, Germany, 15–16 April 2010. [Google Scholar]
- MacAdam, C.C.; Fancher, P.S.; Segel, L. Side Friction for Superelevation on Horizontal Curves, Final Technical Report Volume II; Report No. UMTRI-85-18-2; The University of Michigan Transportation Research Institute: Ann Arbor, MI, USA, 1985. [Google Scholar]
- Bonneson, J.A. NCHRP Report 439: Superelevation Distribution Methods and Transition Designs; Transportation Research Board: Washington, DC, USA, 2000. [Google Scholar]
- Torbic, D.J.; O’Laughlin, M.K.; Harwood, D.W.; Bauer, K.M.; Bokenkroger, C.D.; Lucas, L.M. Superelevation Criteria for Sharp Horizontal Curves on Steep Grades. National Academies of Sciences, Engineering, and Medicine 2014; The National Academies Press: Washington, DC, USA, 2014. [Google Scholar]
- Tejas, M.V. Design of Horizontal Curves with Downgrades using Low-Order Vehicle Dynamics Models. Master’s Thesis, Pennsylvania State University, Centre County, PA, USA, 2011. [Google Scholar]
- Vasilios, T.; Damrongrit, P.; Alexander, C. New Method of identifying Real-Time Predictive Lateral Load Transfer Ratio for Rollover Prevention Systems. In Proceedings of the 2009 American Control Conference, St. Louis, MO, USA, 10–12 June 2009. [Google Scholar]
- Furtado, G.; Easa, S.M.; Abd El Halim, A.O. Vehicle stability on combined horizontal and vertical alignment. In Proceedings of the Annual Conference of the Canadian Society for Civil Engineering, Montreal, QC, Canada, 1 January 2002. [Google Scholar]
- Sun, L.; You, K.S. Reliability-based risk analysis of vehicle moving on curved sections considering multiple failure modes. China J. Highw. Transp. 2013, 26, 36–42. [Google Scholar]
- Yue, L.; Wang, H.; Du, Y.C.; Yao, H.Y. Study on the design index of combination section of curved slope of mountain highway based on safety analysis. Eng. Mech. 2019, 36, 158–167. [Google Scholar]
- Gillespie, T.D.; Verma, M.K. Analysis of the Rollover Dynamics of Double-Bottom Tankers; SAE Technical Paper 781065; Society of Automotive Engineers: Warrendale, PA, USA, 1978. [Google Scholar]
- Aoki, A.; Marumo, Y.; Kageyama, I. Effects of multiple axles on the lateral dynamics of multi-articulated vehicles. Veh. Syst. Dyn. 2013, 51, 338–359. [Google Scholar] [CrossRef]
- Tarko, A.; Hall, T.; Romero, M.; Jiménez, C.G.L. Evaluating the rollover propensity of trucks—A roundabout example. Accid. Anal. Prev. 2016, 91, 127–134. [Google Scholar] [CrossRef]
- Ito, K.; Fujishiro, T.; Kanai, K.; Ochi, Y. Stability Analysis of Automatic Lateral Motion–Controlled Vehicle with Four-Wheel Steering System. In Proceedings of the 1990 American Control Conference, San Diego, CA, USA, 23–25 May 1990. [Google Scholar]
- Jalayer, M.; Shabanpour, R.; Pour-Rouholamin, M.; Golshani, N.; Zhou, H. Wrongway driving crashes: A random-parameters ordered probit analysis of injury severity. Accid. Anal. Prev. 2018, 117, 128–135. [Google Scholar] [CrossRef] [PubMed]
- Wali, B.; Khattak, A.J.; Bozdogan, H.; Kamrani, M. How is driving volatility related to intersection safety? A Bayesian heterogeneity-based analysis of instrumented vehicles data. Transp. Res. Part C Emerg. Technol. 2018, 92, 504–524. [Google Scholar] [CrossRef]
- Petridou, E.; Moustaki, M. Human factors in the causation of road traffic crashes. Eur. J. Epidemiol. 2000, 16, 819–826. [Google Scholar] [CrossRef]
- Wenzel, T.P.; Ross, M. The effects of vehicle model and driver behavior on risk. Accid. Anal. Prev. 2005, 37, 479–494. [Google Scholar] [CrossRef] [Green Version]
- Khattak, A.J.; Schneider, J.R.; Targa, F. Risk factors in large truck rollovers and injury severity: Analysis of single-vehicle collisions. In Proceedings of the Transportation Research Record, 82nd Annual Meeting, Washington, DC, USA, 12–16 January 2003. [Google Scholar]
- Mårtensson, J.; Nybacka, M.; Jerrelind, J.; Drugge, L. Evaluation of safety distance in vehicle platoons by combined braking and steering. In Proceedings of the 11th international symposium on advanced vehicle control, Seoul, Korea, 9–12 September 2012. [Google Scholar]
- Brannstrom, M.; Coelingh, E.; Sjoberg, J. Model-Based Threat Assessment for Avoiding Arbitrary Vehicle Collisions. IEEE Trans. Intell. Transp. Syst. 2010, 11, 658–669. [Google Scholar] [CrossRef]
- Larish, C.; Piyabongkarn, D.; Tsourapas, V.; Rajamani, R. A new predictive lateral load transfer ratio for rollover prevention systems. IEEE Trans. Veh. Technol. 2013, 62, 2928–2936. [Google Scholar] [CrossRef]
- Mitschke, M.; Wallentowitz, H. Vehicle Dynamics, 5th ed.; Tsinghua University Press: Beijing, China, 2009. [Google Scholar]
- Gillespie, T.D. Fundamentals of Vehicle Dynamics; Society of Automotive Engineers, Inc.: Warrendale, PA, USA, 2000. [Google Scholar]
- Sahin, H.; Liu, Y.; Wang, X.; Gordaninejad, F.; Evrensel, C.; Fuchs, A. Full-Scale Magnetorheological Fluid Dampers for Heavy Vehicle Rollover. J. Intell. Mater. Syst. Struct. 2007, 18, 1161–1167. [Google Scholar] [CrossRef]
- Kontaratos, M.; Psarianos, B.; Yotis, A. Minimum Horizontal Curve Radius as a Function of Grade Incurred by Vehicle Motion in the Driving Mode; Transportation Research Record 1445; Transportation Research Board: Washington, DC, USA, 1994. [Google Scholar]
- Yu, F.; Lin, Y. Automotive System Dynamics, 1st ed.; China Machine Press: Beijing, China, 2005. [Google Scholar]
- Li, L.; Ma, L.; Mou, Y.; Xu, C.; Li, W.R.; Shi, S.M. Parameter Identification Method for the Tire Cornering Stiffness of Model Vehicle. Automot. Eng. 2016, 12, 1508–1514. [Google Scholar]
- Dabbour, E.; Easa, S.M.; Abd El Halim, A.O. Radius requirements for reverse horizontal curves on three-dimensional alignments. Am. Soc. Civ. Eng. 2004, 130, 610–620. [Google Scholar] [CrossRef]
- Duprey, B.; Sayers, M.; Gillespie, T. Using TruckSim to Test Performance Based Standards (PBS). In Proceedings of the SAE 2012 Commercial Vehicle Engineering Congress, Rosemont, IL, USA, 2–3 October 2012. [Google Scholar]
- Li, H.H. Steering and handling Simulation of Multi-Axle Heavy-Duty Vehicle. Electronic, Scholarly Journal. Master’s Thesis, Wuhan University of Technology, Wuhan, China, 2013. Available online: https://kns.cnki.net/KCMS/detail/detail.aspx?dbname=CMFD201402&filename=1013295021.nh (accessed on 30 December 2021).
- Ministry of Transport of the, P.R.C. Design Specification for Highway Alignment, JTG D20-2017, 1st ed.; China Communications Press: Beijing, China, 2017.
- Eck, R.W.; French, L.J. Effective Superelevation for Large Trucks on Sharp Curves and Steep Grades; West Virginia Department of Transportation Research Project #153; West Virginia University: Morgantown, WV, USA, 2002. [Google Scholar]


| Scene ID | Driver Behavior | |
|---|---|---|
| Speed | Lane-Change Path | |
| (km/h) | Number | |
| 1 | 100 | 2 |
| 2 | 100 | 3 |
| 3 | 100 | 4 |
| 4 | 100 | 5 |
| 5 | 100 | 6 |
| 6 | 100 | 7 |
| 7 | 100 | 8 |
| 8 | 100 | 9 |
| 9 | 90 | 2 |
| 10 | 90 | 3 |
| 11 | 90 | 4 |
| 12 | 90 | 5 |
| 13 | 90 | 6 |
| 14 | 90 | 7 |
| 15 | 90 | 8 |
| 16 | 90 | 9 |
| 17 | 80 | 2 |
| 18 | 80 | 3 |
| 19 | 80 | 4 |
| 20 | 80 | 5 |
| 21 | 80 | 6 |
| 22 | 80 | 7 |
| 23 | 80 | 8 |
| 24 | 80 | 9 |
| 25 | 70 | 2 |
| 26 | 70 | 3 |
| 27 | 70 | 4 |
| 28 | 70 | 5 |
| 29 | 70 | 6 |
| 30 | 70 | 7 |
| 31 | 70 | 8 |
| 32 | 70 | 9 |
| 33 | 60 | 2 |
| 34 | 60 | 3 |
| 35 | 60 | 4 |
| 36 | 60 | 5 |
| 37 | 60 | 6 |
| 38 | 60 | 7 |
| 39 | 60 | 8 |
| 40 | 60 | 9 |
| Driver Behavior | Simulation Results | Theoretical Calculation Results | Difference | |
|---|---|---|---|---|
| Speed | Lane-Change Path | |||
| (km/h) | Number | (°) | (°) | (%) |
| 100 | 4 | 143 | 147 | 2.7 |
| 90 | 5 | 155 | 162 | 4.3 |
| 80 | 6 | 180 | 182 | 1.1 |
| 70 | 7 | 225 | 212 | 6.1 |
| 60 | 8 | 272 | 259 | 5.0 |
Publisher’s Note: MDPI stays neutral with regard to jurisdictional claims in published maps and institutional affiliations. |
© 2022 by the authors. Licensee MDPI, Basel, Switzerland. This article is an open access article distributed under the terms and conditions of the Creative Commons Attribution (CC BY) license (https://creativecommons.org/licenses/by/4.0/).
Share and Cite
Xu, J.; Xin, T.; Gao, C.; Sun, Z. Study on the Maximum Safe Instantaneous Input of the Steering Wheel against Rollover for Trucks on Horizontal Curves. Int. J. Environ. Res. Public Health 2022, 19, 2025. https://doi.org/10.3390/ijerph19042025
Xu J, Xin T, Gao C, Sun Z. Study on the Maximum Safe Instantaneous Input of the Steering Wheel against Rollover for Trucks on Horizontal Curves. International Journal of Environmental Research and Public Health. 2022; 19(4):2025. https://doi.org/10.3390/ijerph19042025
Chicago/Turabian StyleXu, Jinliang, Tian Xin, Chao Gao, and Zhenhua Sun. 2022. "Study on the Maximum Safe Instantaneous Input of the Steering Wheel against Rollover for Trucks on Horizontal Curves" International Journal of Environmental Research and Public Health 19, no. 4: 2025. https://doi.org/10.3390/ijerph19042025
APA StyleXu, J., Xin, T., Gao, C., & Sun, Z. (2022). Study on the Maximum Safe Instantaneous Input of the Steering Wheel against Rollover for Trucks on Horizontal Curves. International Journal of Environmental Research and Public Health, 19(4), 2025. https://doi.org/10.3390/ijerph19042025