
Macroeconomic and Social Indicators to Launch the PM-Based VBHC Model in the Healthcare System in Poland

Abstract
:1. Introduction
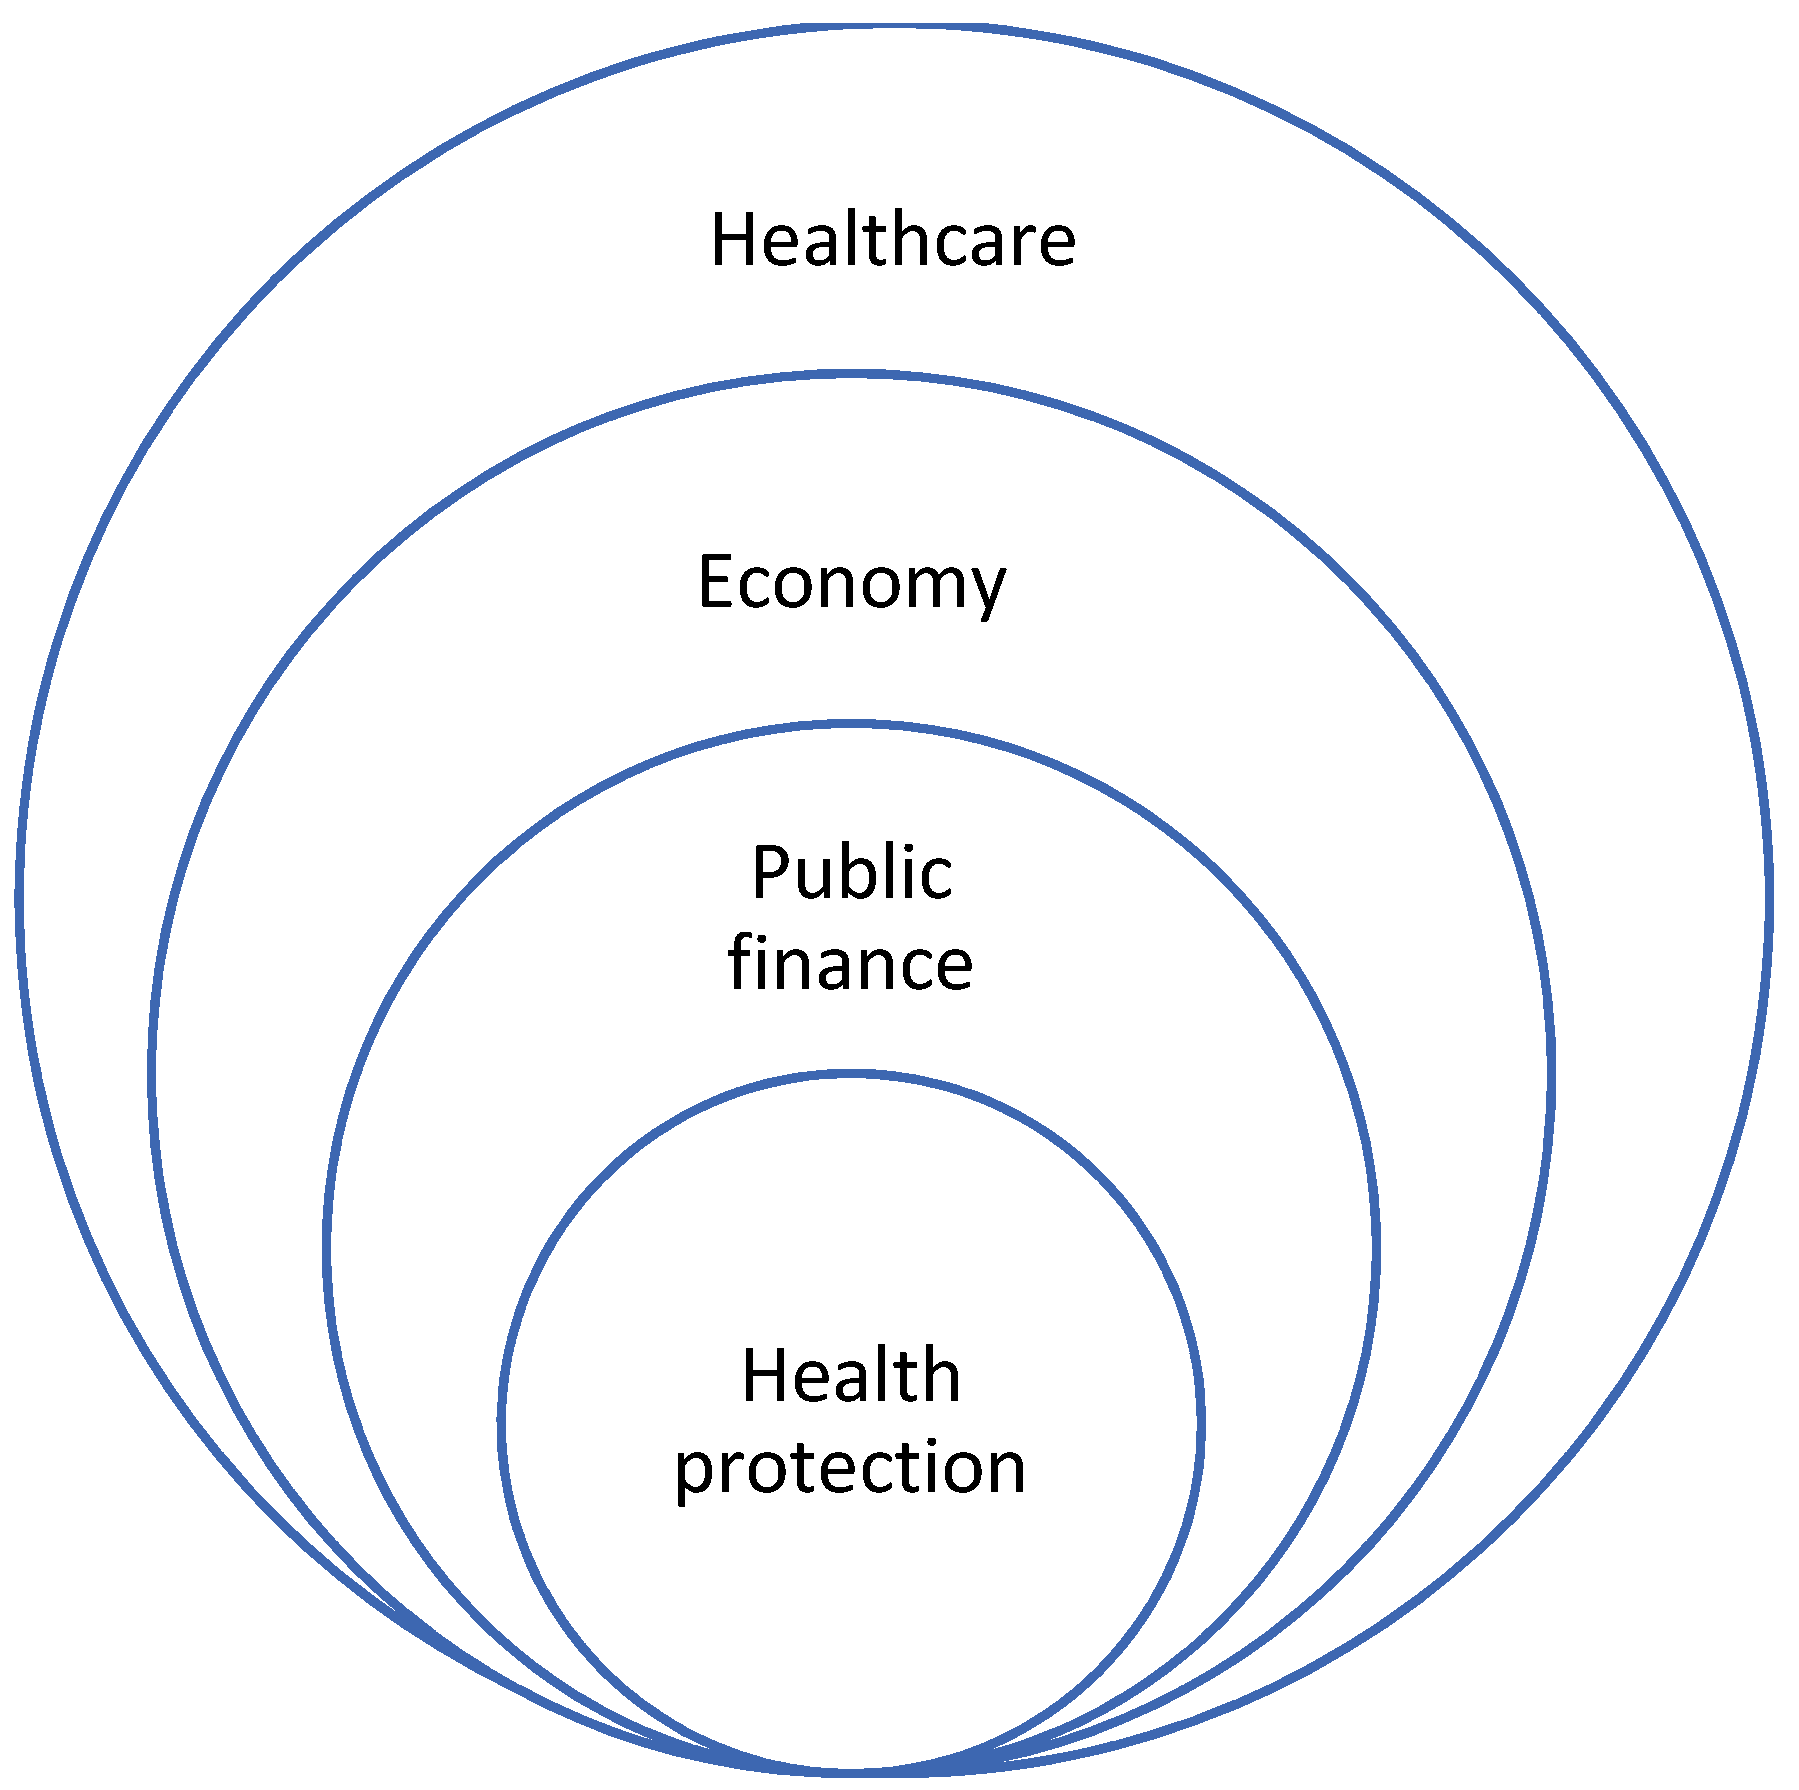
1.1. Value-Based Health Care (VBHC)
1.2. Personalised Medicine (PM)
1.3. Key Performance Indicators (KPIs)
2. Materials and Methods
2.1. Study Design
- Conversion of variables into stimulants;
- Assessment of relationships among the indicator variables (DEMATEL method);
- Assessment of the relative significance of the KPI variables;
- Determination of the weights of the KPI variables;
- Benchmark determination;
- Calculation of the indicator in relation to a selected benchmark.
2.2. Data
2.3. Software
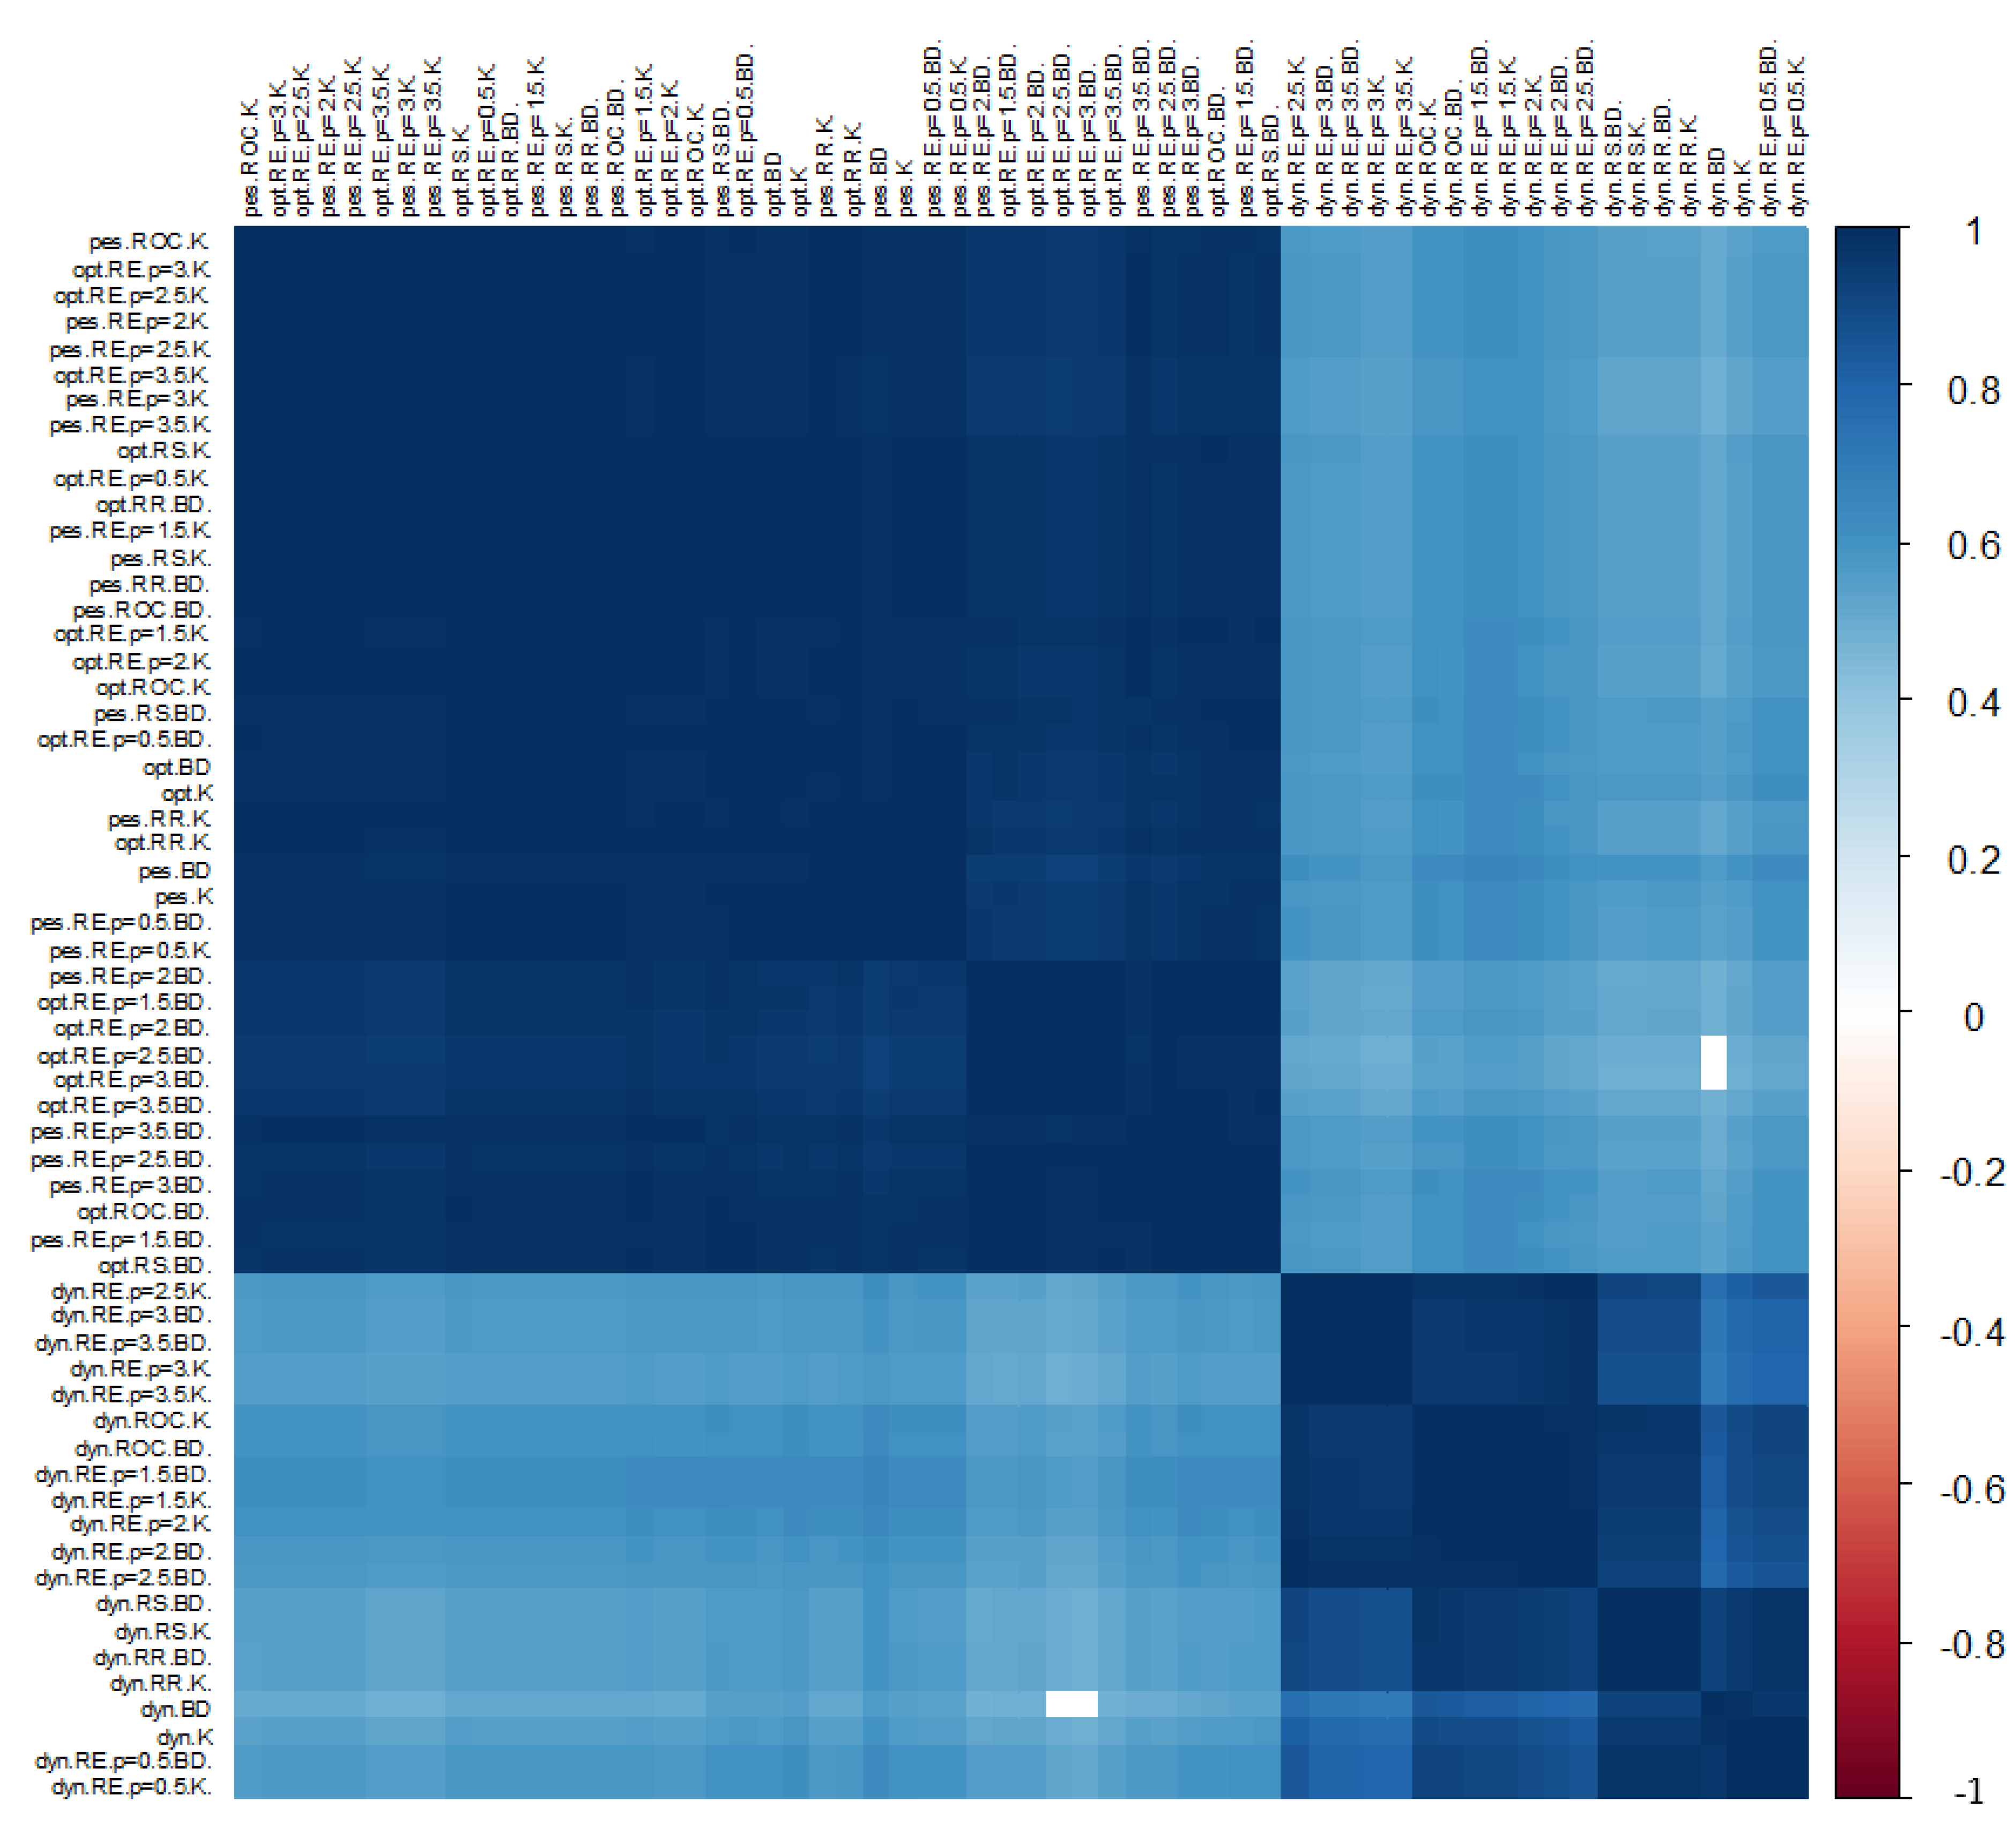
3. Results
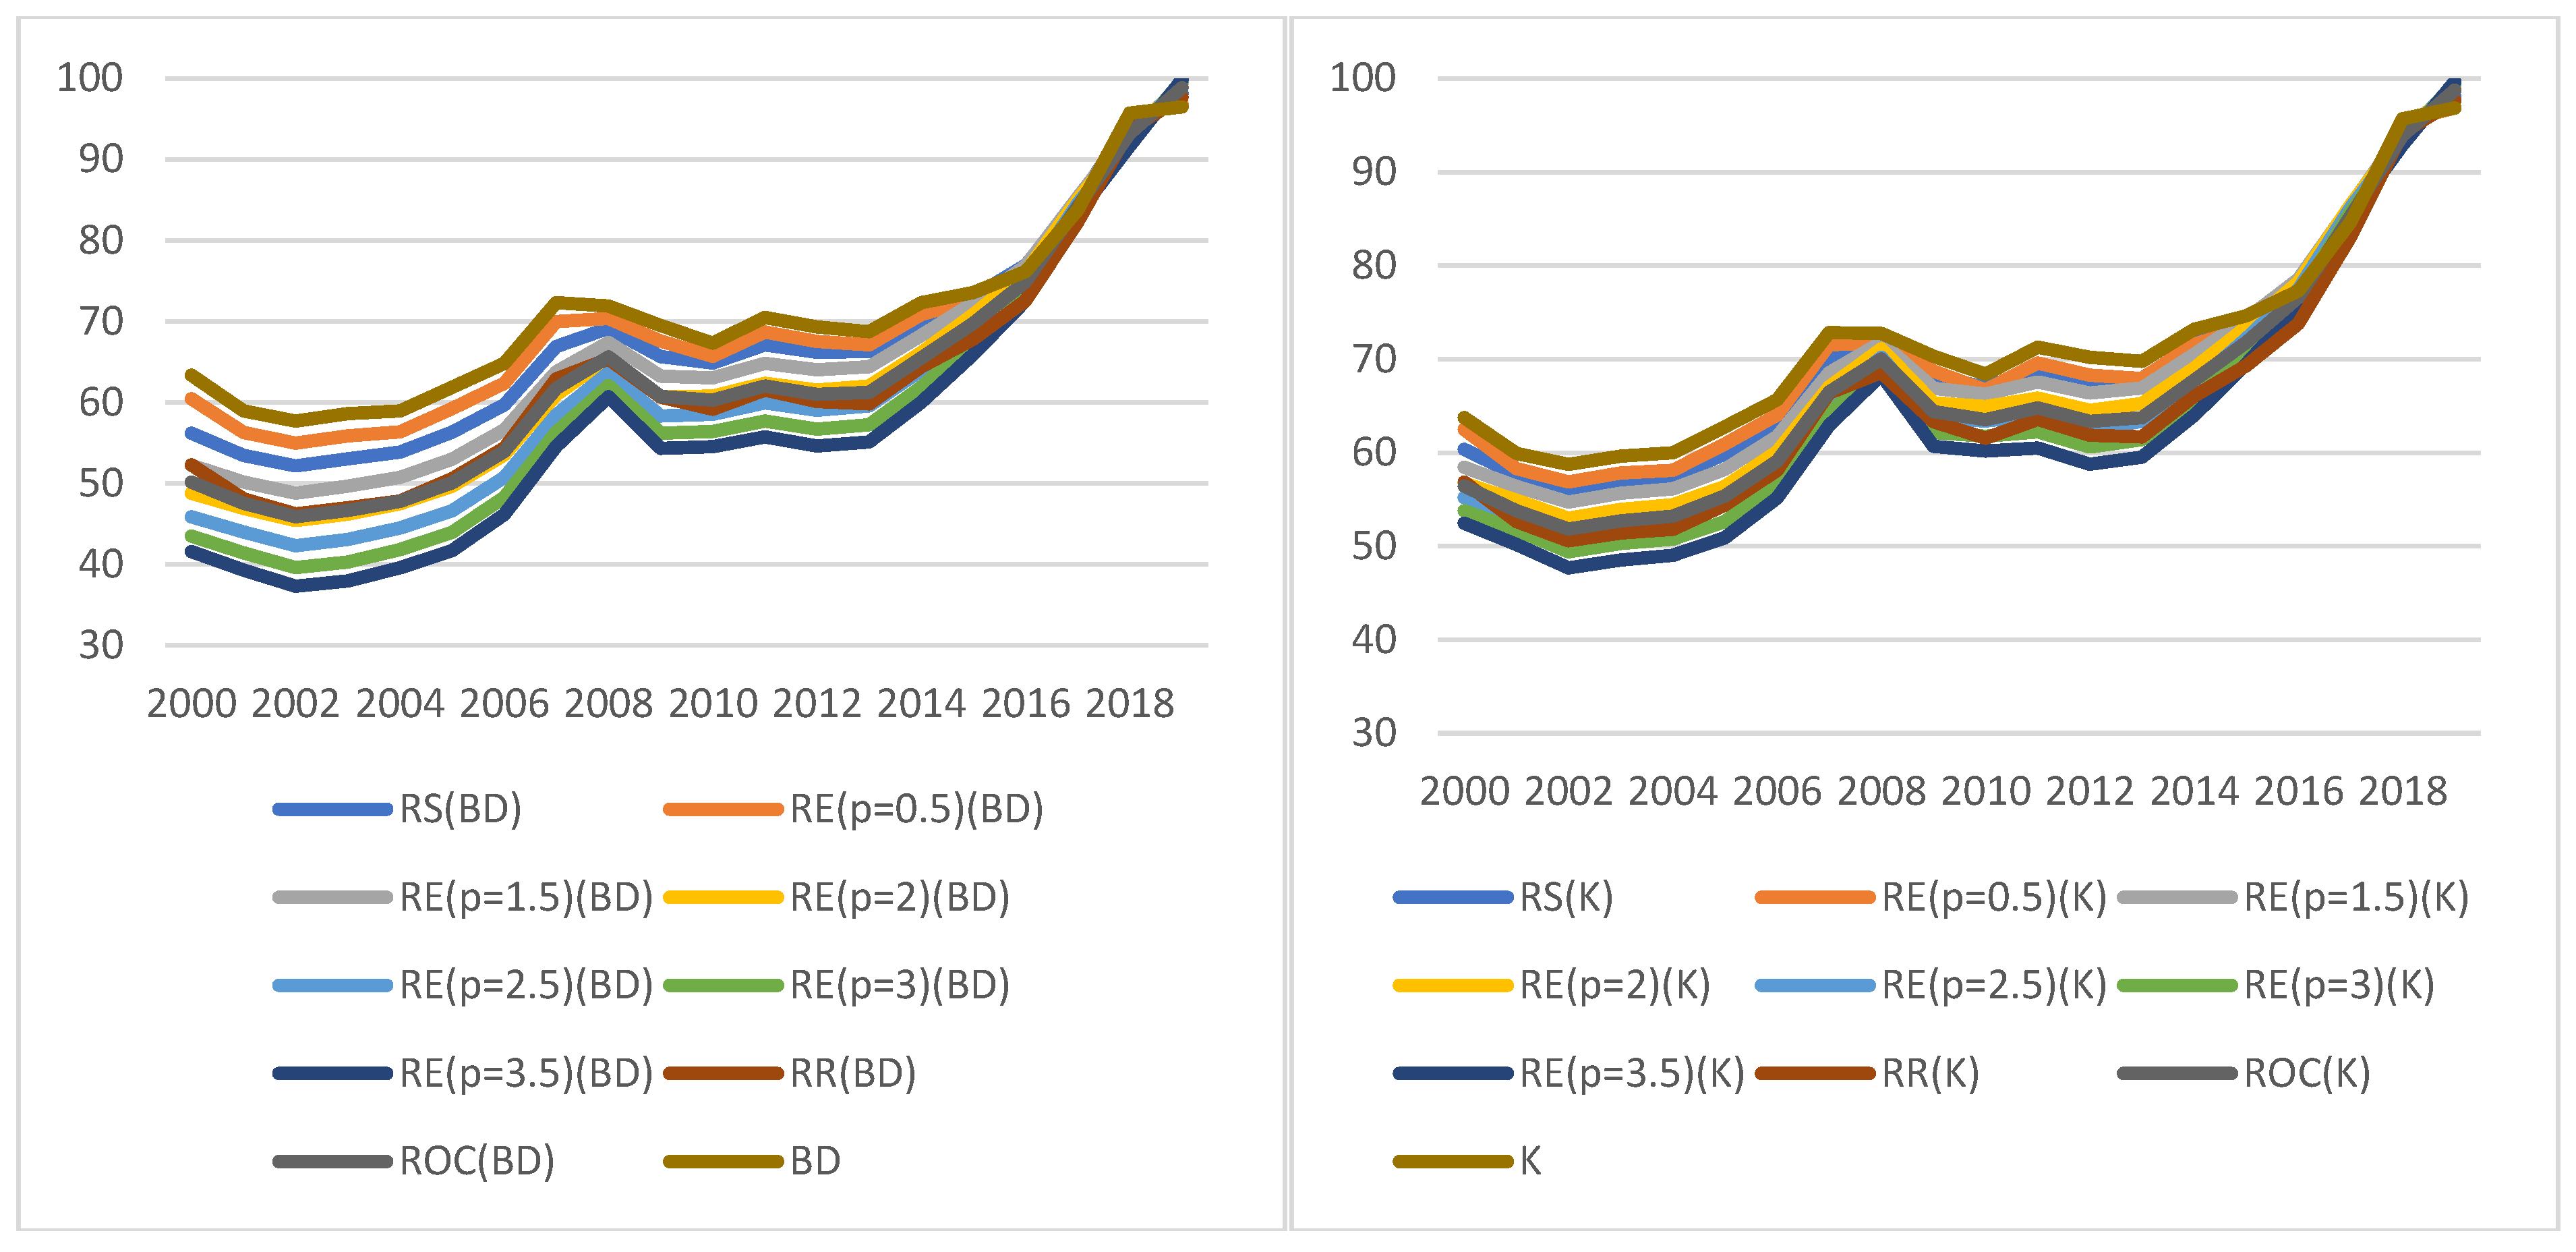
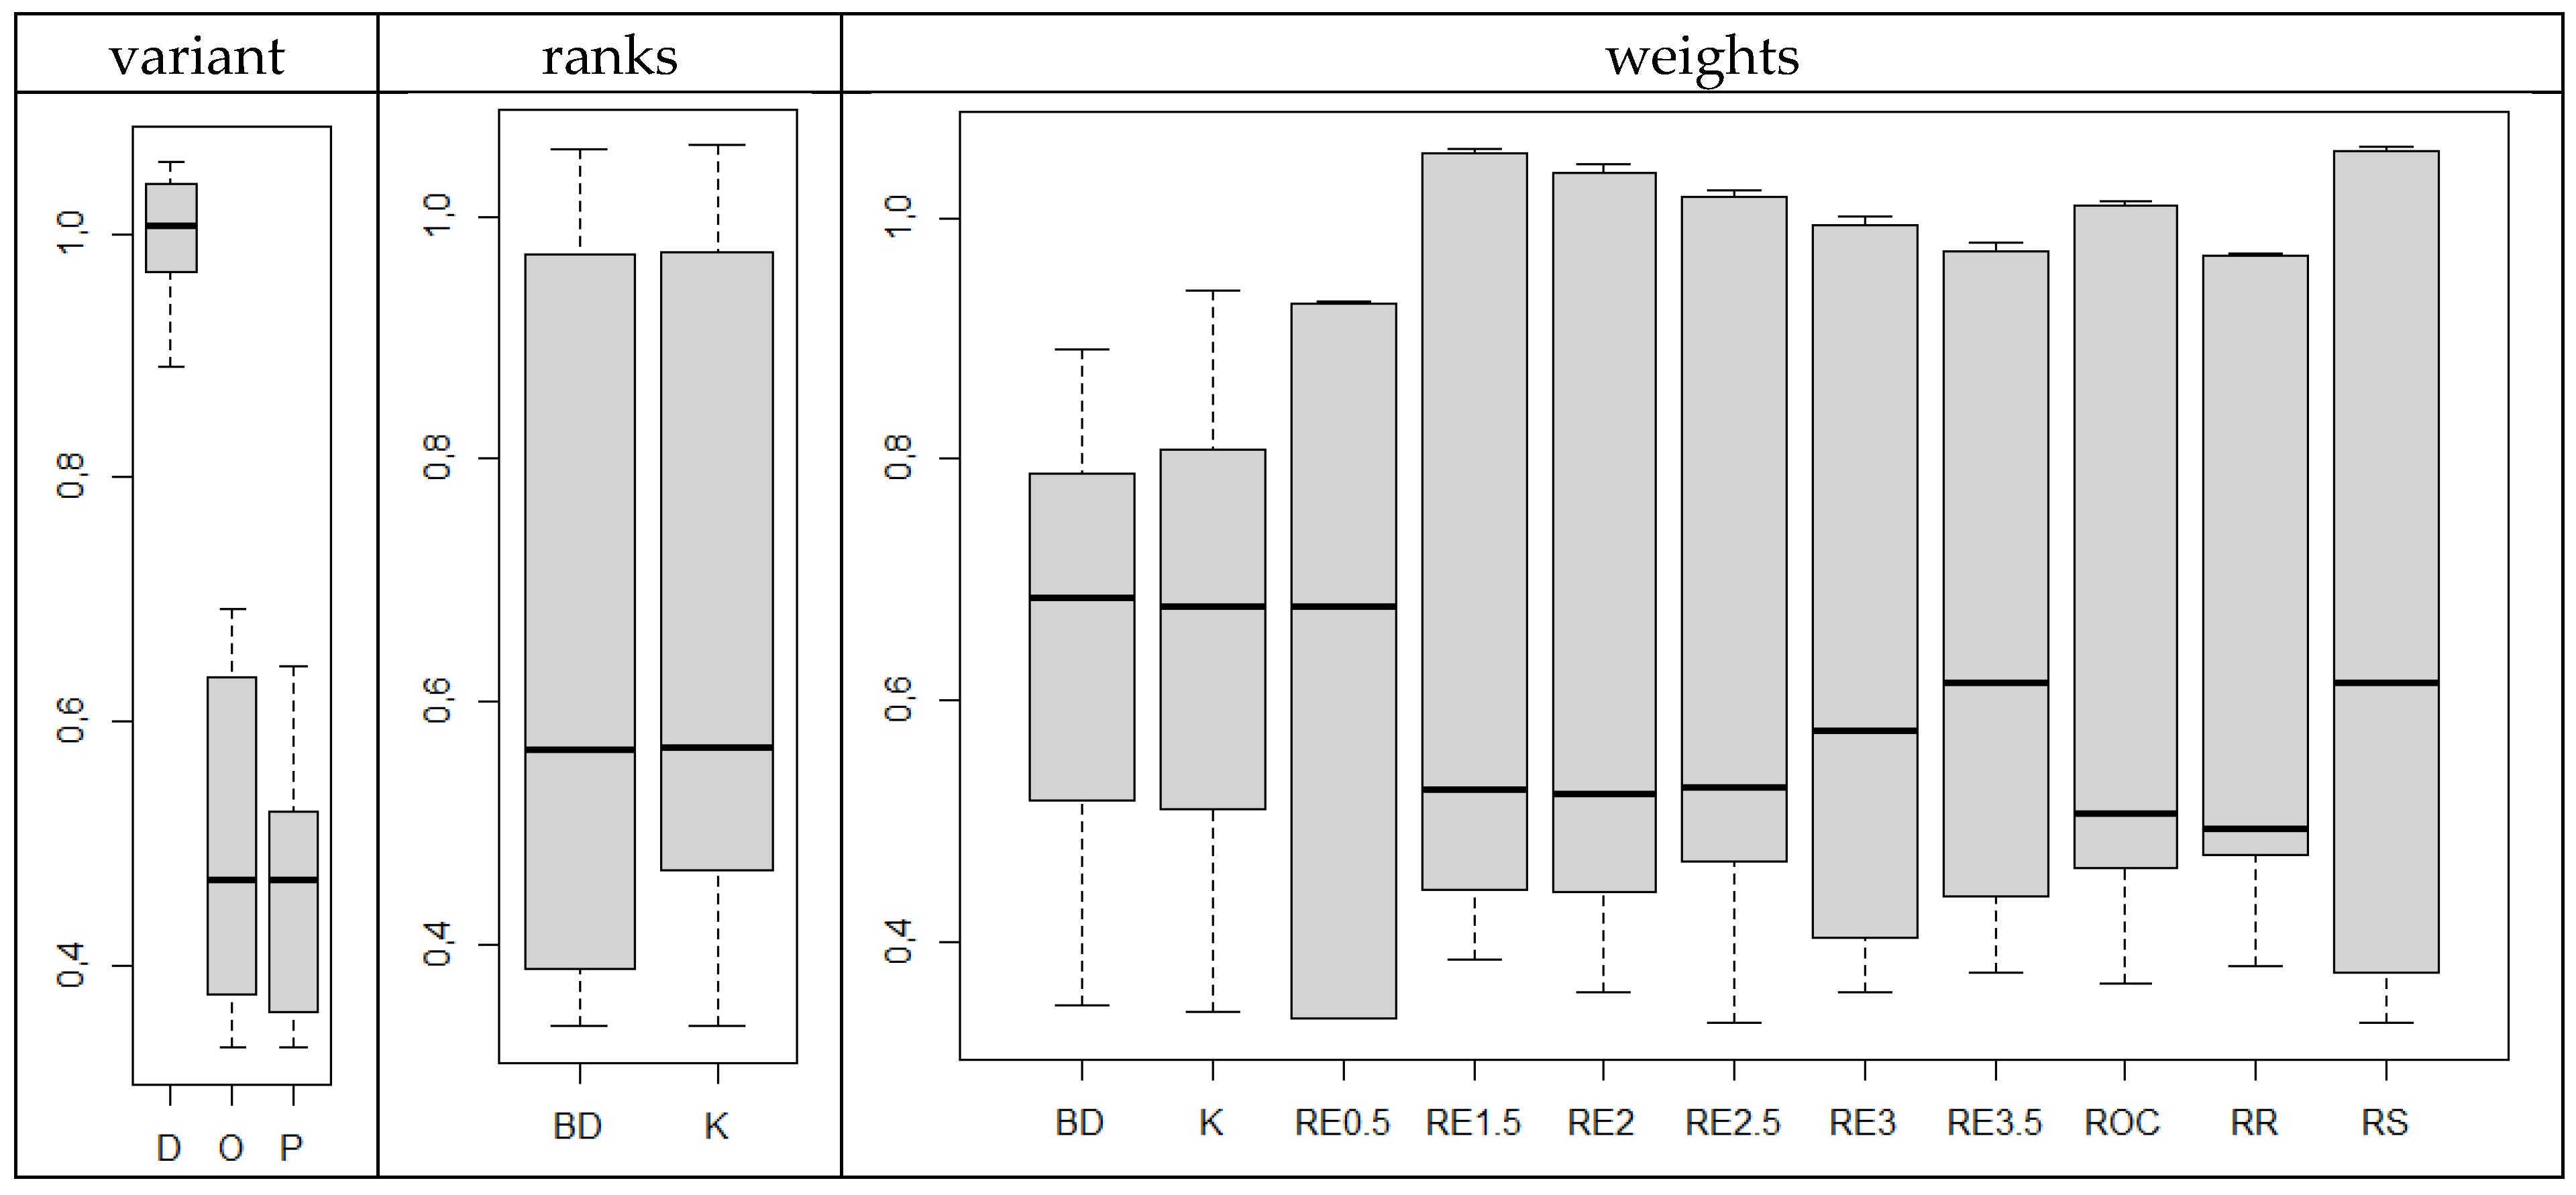
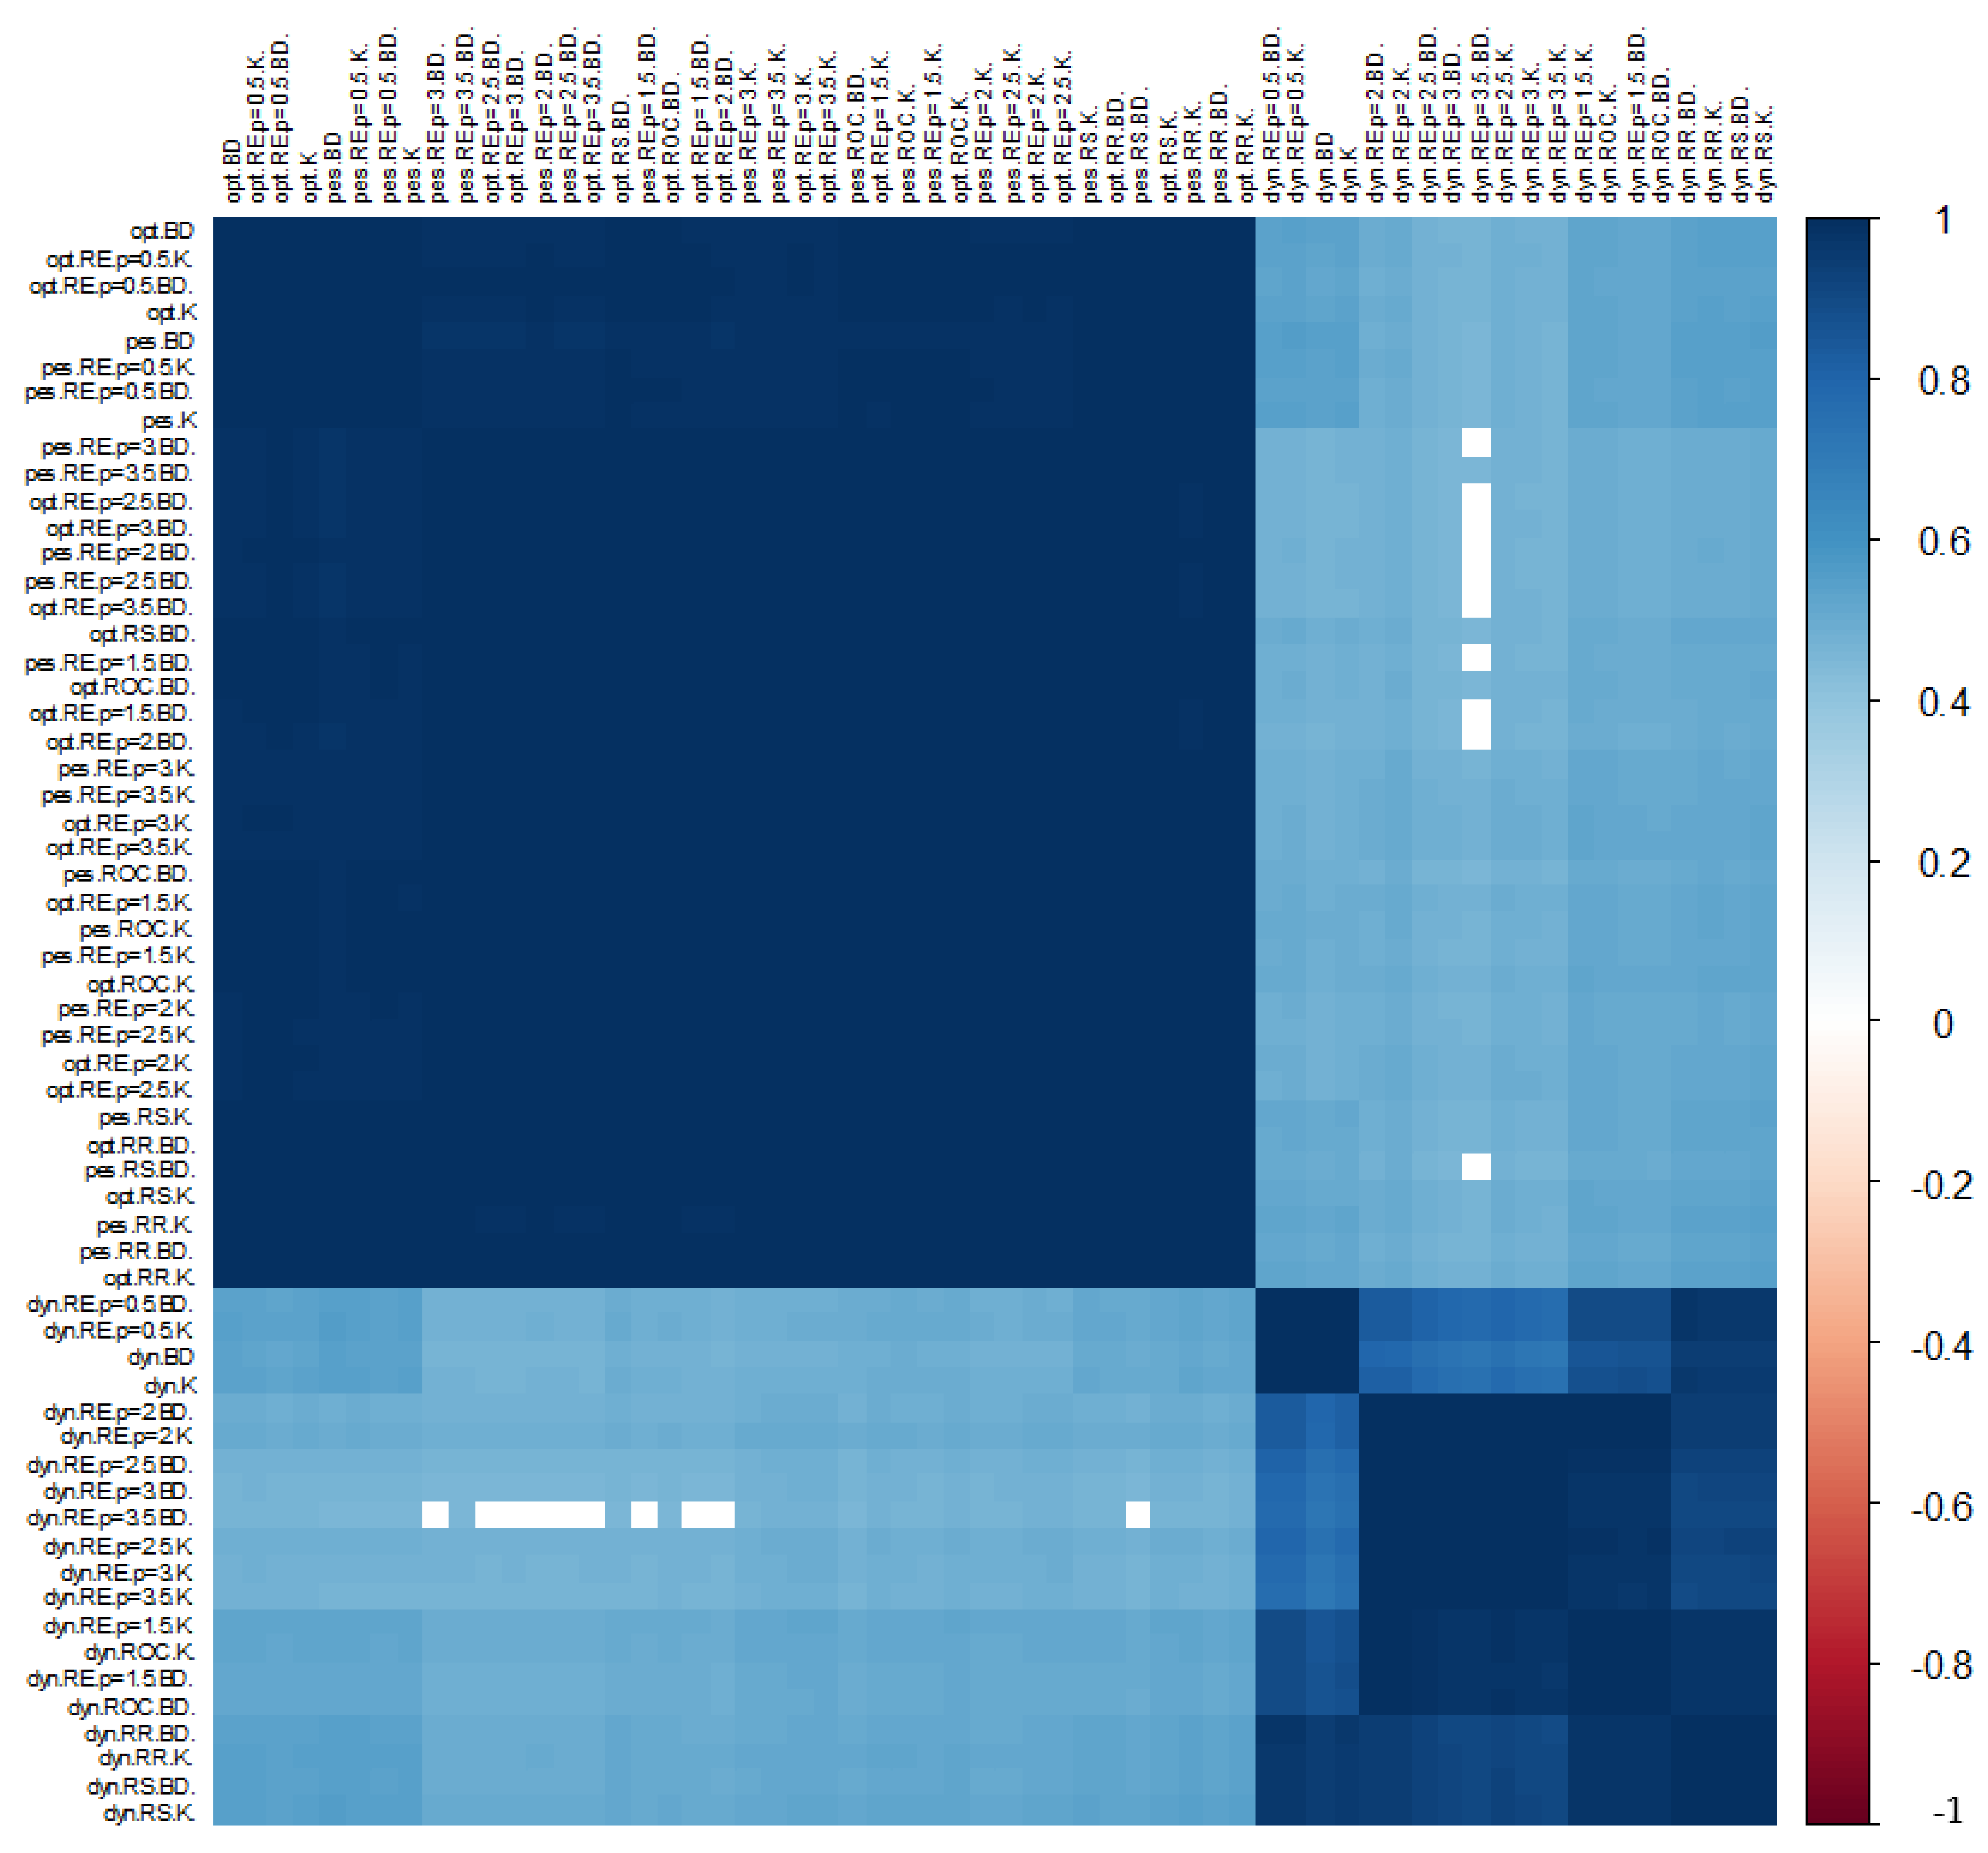
3.1. Significance of Each Variable for the Construction of KPIs
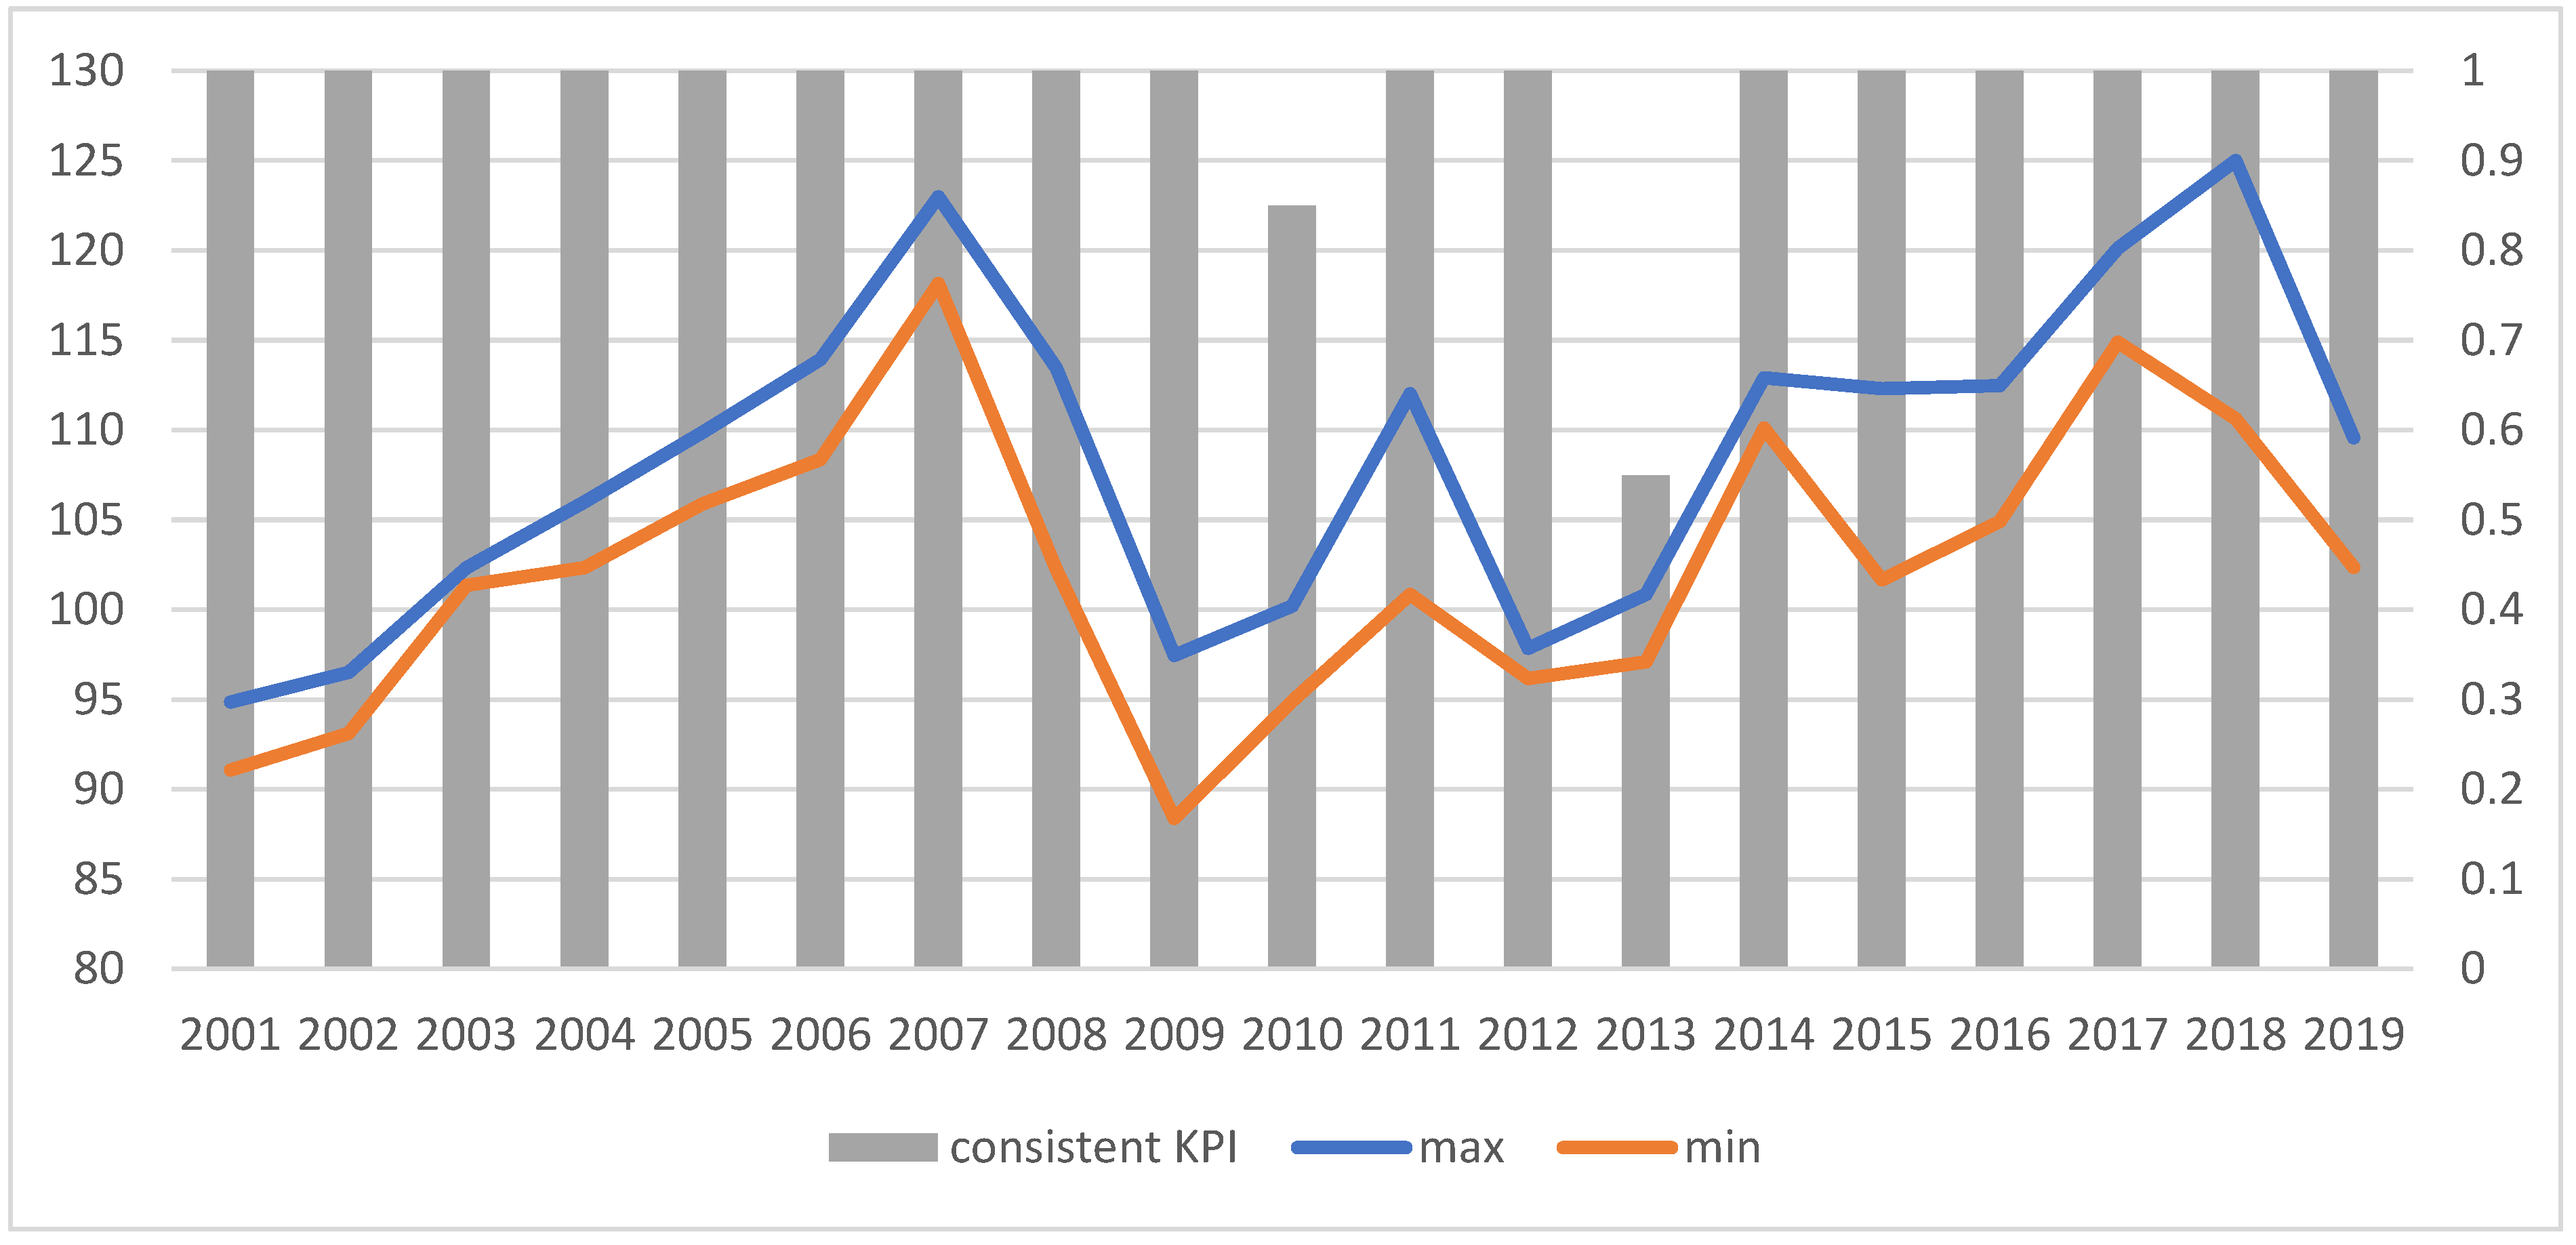
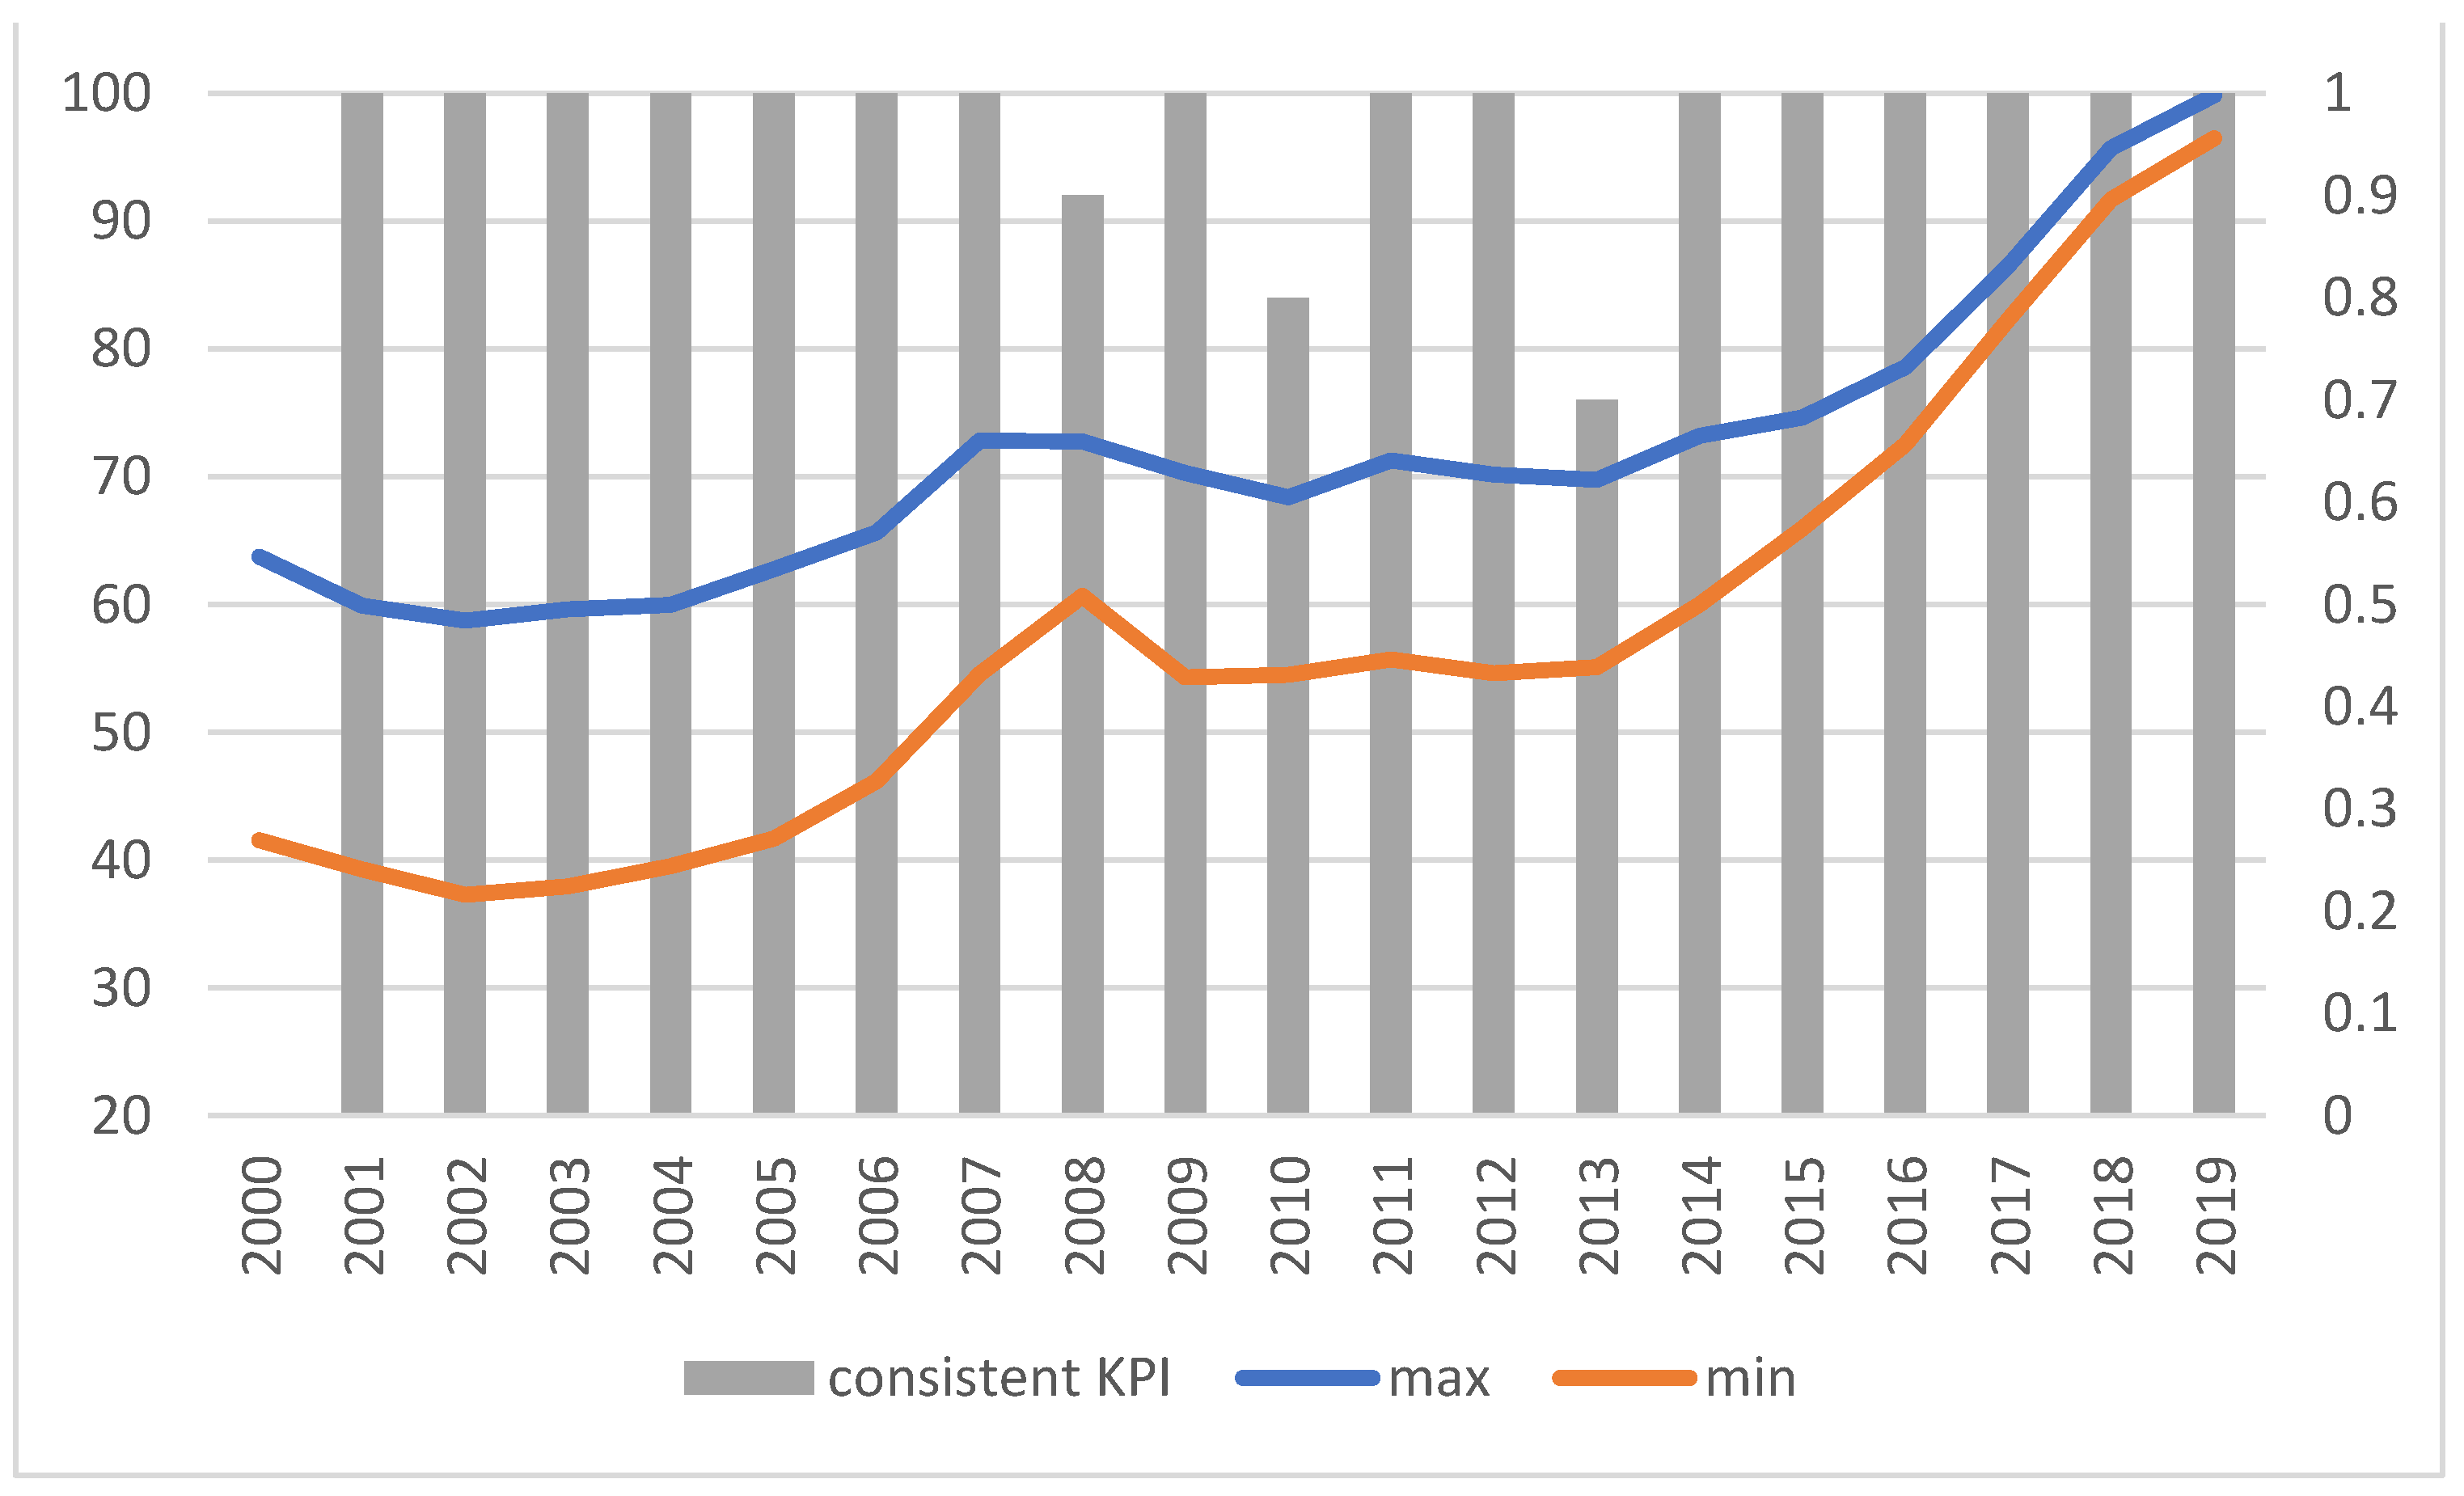
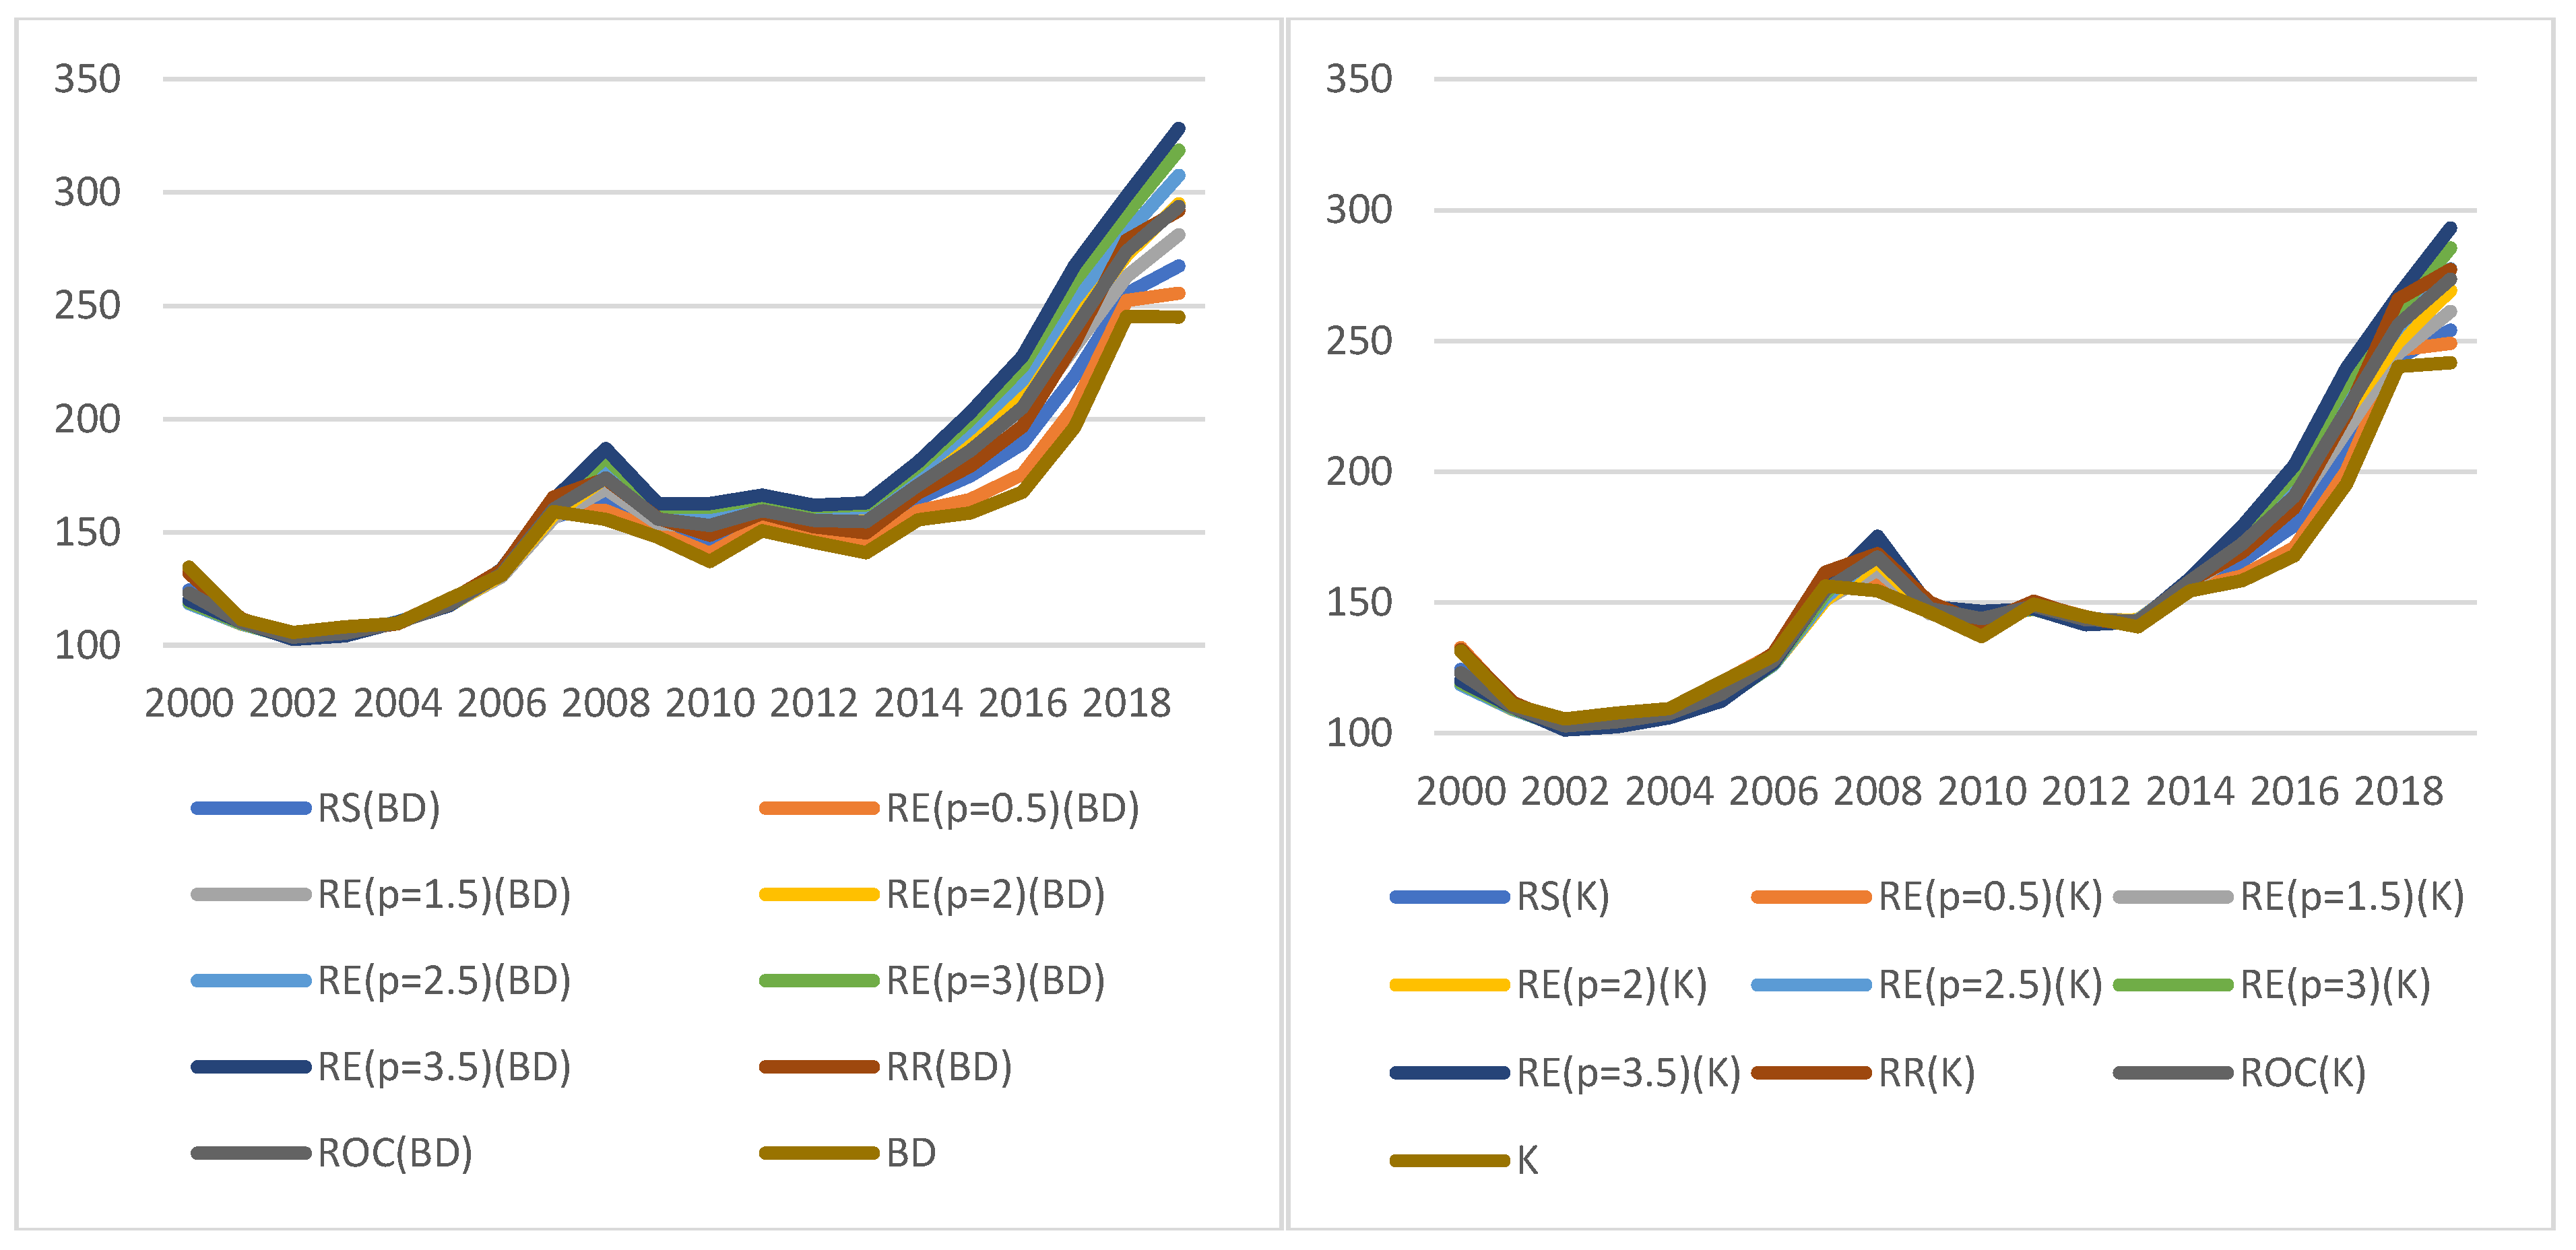
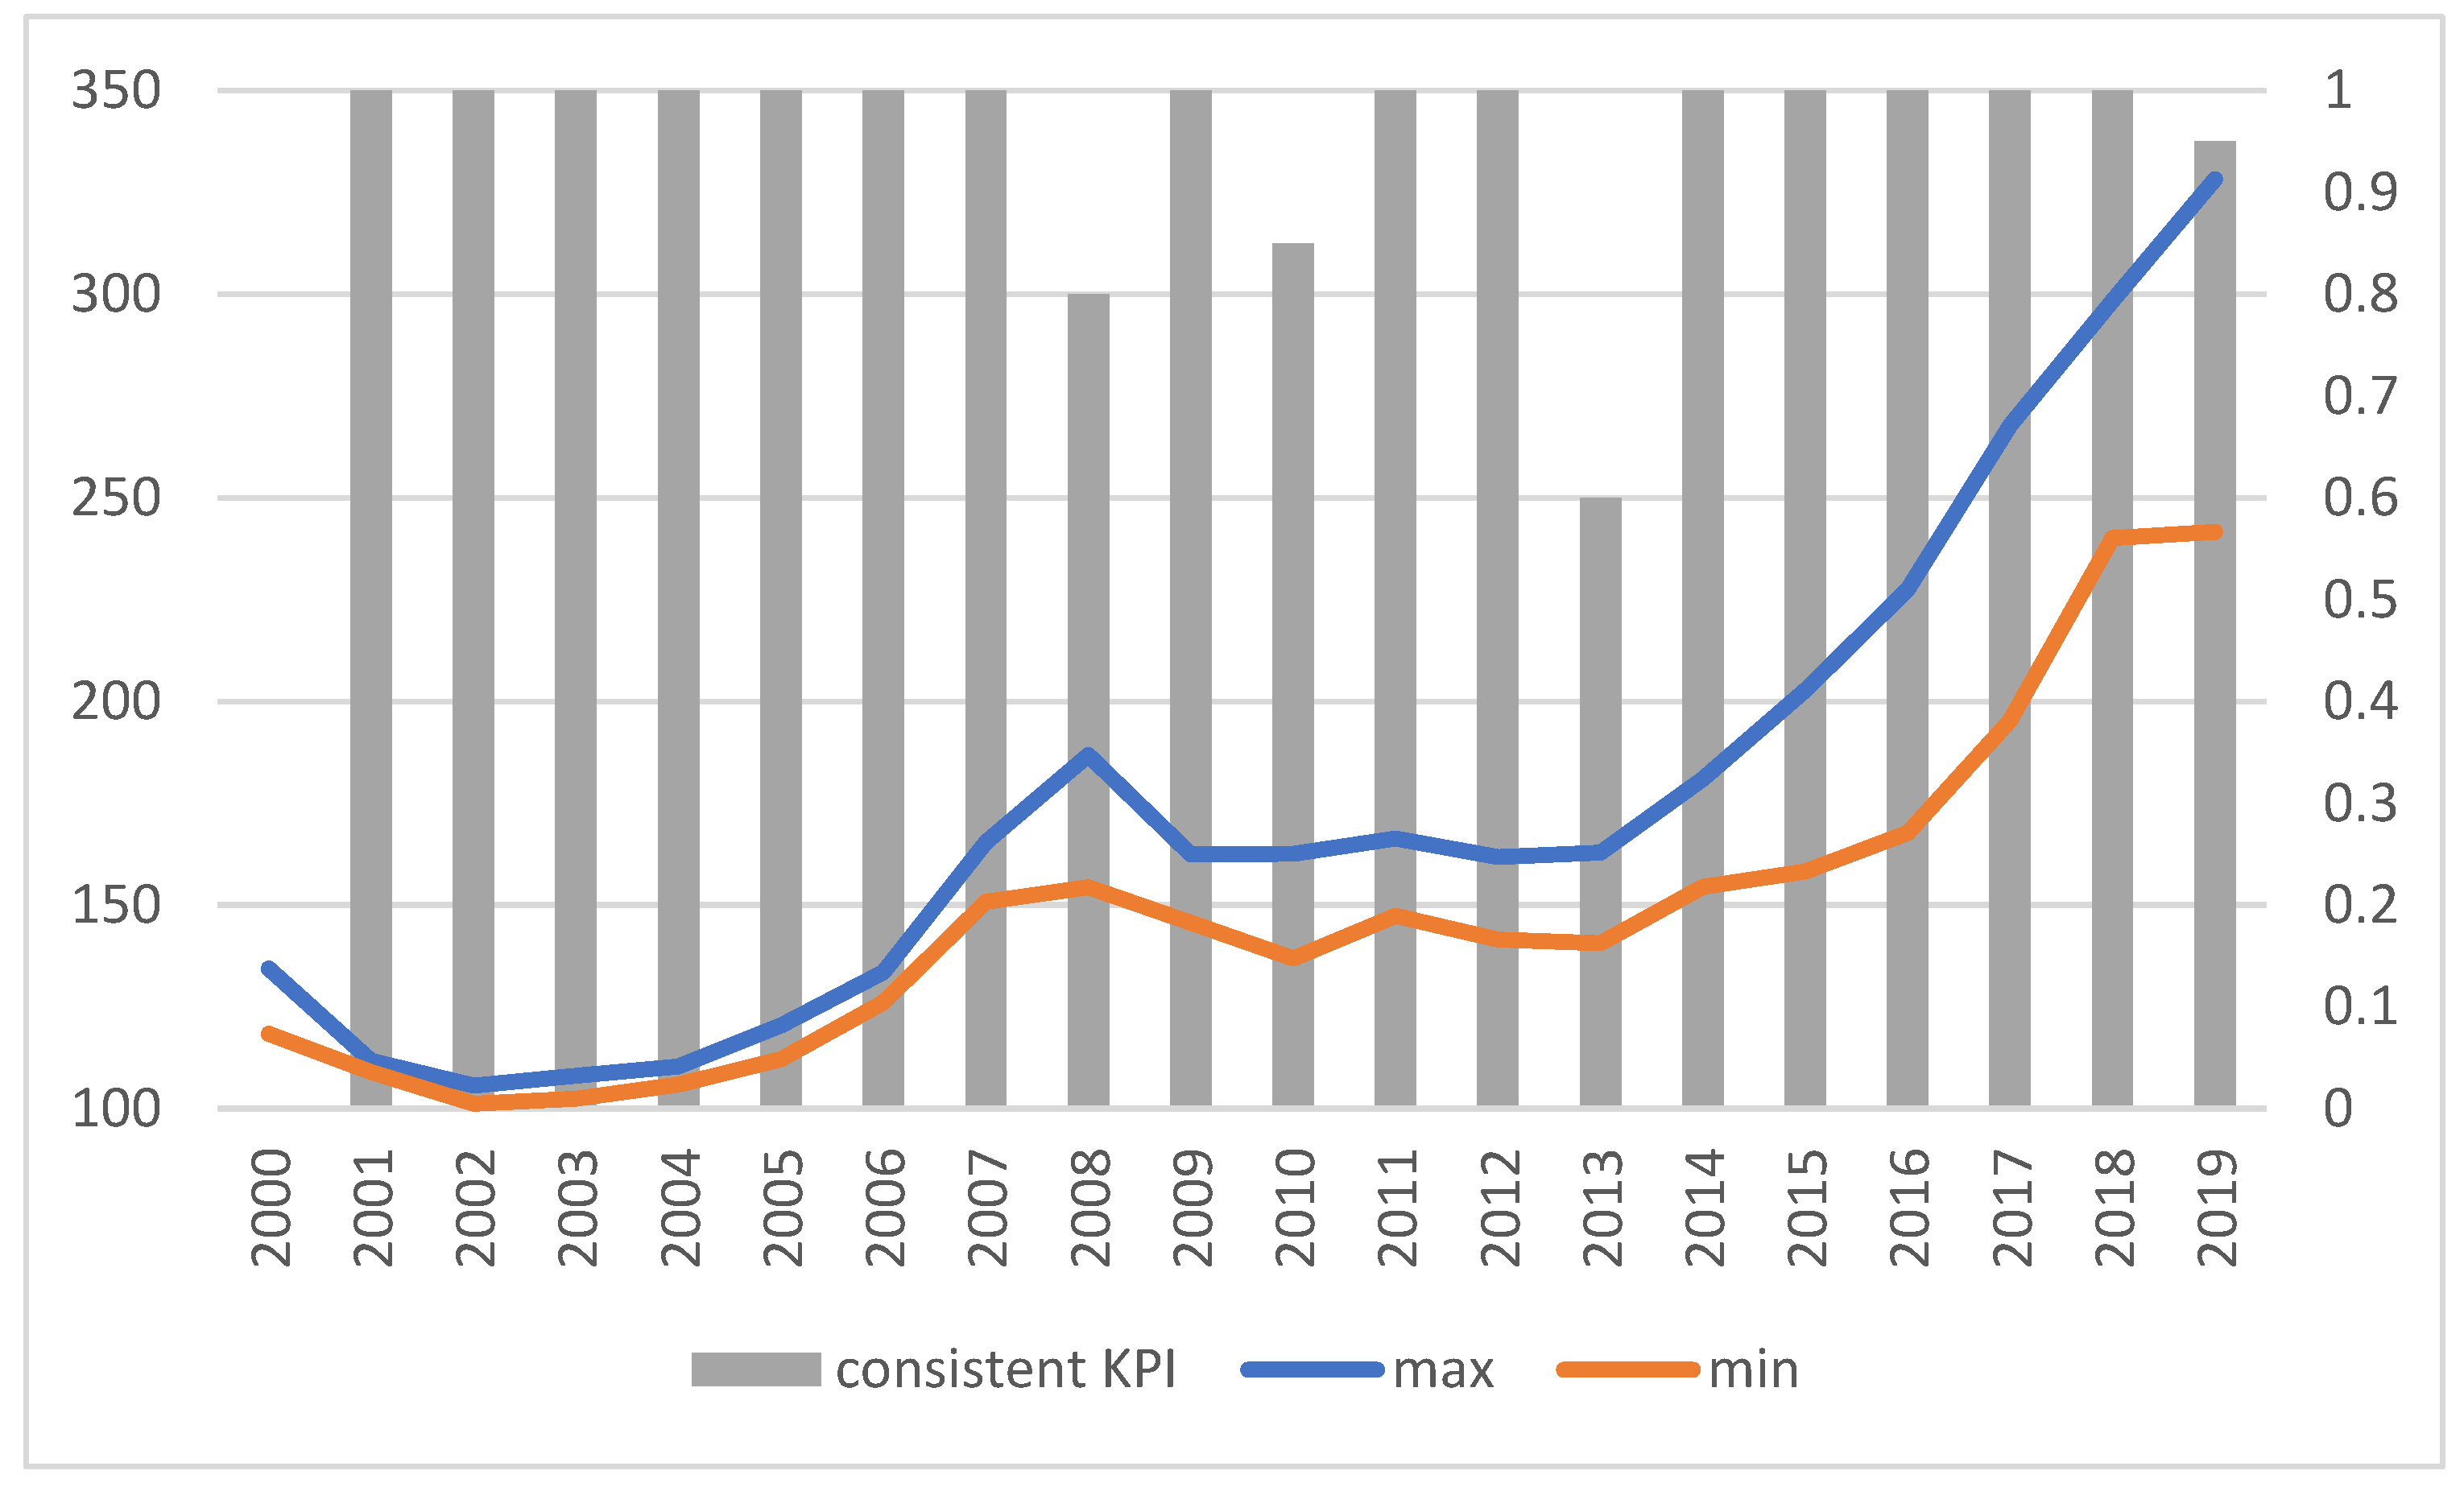
3.2. Dynamic Indicators ()
3.3. Optimistic Indicators ()
3.4. Pessimistic Indicators ()
4. Discussion
5. Conclusions
Author Contributions
Funding
Institutional Review Board Statement
Informed Consent Statement
Data Availability Statement
Conflicts of Interest
References
- Tackling Wasteful Spending on Health. 2017. Available online: https://www.oecd-ilibrary.org/social-issues-migration-health/tackling-wasteful-spending-on-health_9789264266414-en (accessed on 28 December 2021).
- Benchmarking Access to Healthcare in the EU. 2018. Available online: https://ec.europa.eu/health/sites/health/files/expert_panel/docs/opinion_benchmarking_healthcareaccess_en.pdf (accessed on 28 December 2021).
- Access to Health Services in the European Union. Available online: https://ec.europa.eu/health/sites/health/files/expert_panel/docs/015_access_healthservices_en.pdf (accessed on 28 December 2021).
- Innovative Payment Models for High-Cost Innovative Medicines. Available online: https://ec.europa.eu/health/sites/health/files/expert_panel/docs/opinion_innovative_medicines_en.pdf (accessed on 28 December 2021).
- Porter, M.E.; Tiseberg, E.O. Redefining Health Care: Creating Value-Based Competition on Results; Harvard Business School Press: Boston, MA, USA, 2006. [Google Scholar]
- Available online: https://ec.europa.eu/health/human-use/personalised-medicine_en (accessed on 28 December 2021).
- Eagle, C.J.; Davies, J.M. Current models of ‘quality—An introduction for anaesthetists. Can. J. Anaesth. 1993, 40, 851–862. [Google Scholar] [CrossRef] [PubMed] [Green Version]
- Porter, M. What is value in health care? N. Engl. J. Med. 2010, 363, 2477–2481. [Google Scholar] [CrossRef] [PubMed]
- Kuenen, W.; Luijs, J.; Grosch, B.; Kaplan, J.; Kent, J. The Practice Variation Opportunity for Health Care Payers; Boston Consulting Group: Boston, MA, USA, 2015; Available online: https://www.bcg.com/publications/2015/health-care-payers-providers-insurance-practice-variation-opportunity-for-health-care-payers (accessed on 28 December 2021).
- Value in Healthcare, Laying the Foundation for Health System transformation; World Economic Forum: Davos, Switzerland, 2017; p. 6. Available online: http://www3.weforum.org/docs/WEF_Insight_Report_Value_Healthcare_Laying_Foundation.pdf (accessed on 28 December 2021).
- Defining Value in “Value-Based Healthcare”; Publications Office of the European Union: Luxembourg, 2019; p. 7. Available online: https://ec.europa.eu/health/sites/health/files/expert_panel/docs/024_defining-value-vbhc_en.pdf (accessed on 28 December 2021).
- The Personalized Medicine Report, 2017—Opportunity, Challenges, and the Future, The Personalized Medicine Coalition. p. 6. Available online: http://personalizedmedicinecoalition.org/Userfiles/PMC-Corporate/file/The-Personalized-Medicine-Report1.pdf (accessed on 28 December 2021).
- Available online: https://ec.europa.eu/health/human-use/personalised-medicine_pl (accessed on 28 December 2021).
- EPFLIRGC. The Economics of Precision Medicine. A Risk-Governance Perspective; EPFL International Risk Governance Center: Lausanne, Switzerland, 2018; p. 6. Available online: https://infoscience.epfl.ch/record/256776 (accessed on 28 December 2021).
- Nelson, P. Information and Consumer Behavior. J. Politi-Econ. 1970, 78, 311–329. [Google Scholar] [CrossRef]
- Egan, M.; Philipson, T.J. Health Care Adherence and Personalized Medicine; Working Paper 20330; NBER: Cambridge, MA, USA, 2014; Available online: https://www.nber.org/system/files/working_papers/w20330/w20330.pdf (accessed on 28 December 2021).
- Ibrahim, J.E. Performance indicators from all perspectives. Int. J. Qual. Health Care 2001, 13, 431–432. [Google Scholar] [CrossRef] [PubMed] [Green Version]
- Thompson, B.L.; Harris, J.R. Performance measures: Are we measuring what matters? Am. J. Prev. Med. 2001, 20, 291–293. [Google Scholar] [CrossRef]
- Wolfson, M. Social Proprioception: Measurement, Data and Information from a Population Health Perspective. In Why Are Some People Healthy and Others Not? Evans, R.G., Barer, M.L., Marmor, T., Eds.; Aldine de Gruyter: New York, NY, USA, 1994; p. 309. [Google Scholar]
- Khalifa, M.; Khalid, P. Developing Strategic Health Care Key Performance Indicators: A Case Study on a Tertiary Care Hospital. Procedia Comput. Sci. 2015, 63, 459–466. [Google Scholar] [CrossRef] [Green Version]
- Available online: https://www.datapine.com/kpi-examples-and-templates/healthcare (accessed on 28 December 2021).
- Arah, O.A.; Klazinga, N.S.; Delnoij, D.M.; Asbroek, A.H.A.T.; Custers, T. Conceptual frameworks for health systems performance: A quest for effectiveness, quality, and improvement. Int. J. Qual. Health Care 2003, 15, 377–398. [Google Scholar] [CrossRef] [PubMed]
- Gabus, A.; Fontela, E. Perceptions of the World Problematique: Communication Procedure, Communicating with Those Bearing Collective Responsibility; Battelle Geneva Research Centre: Geneva, Switzerland, 1973. [Google Scholar]
- Buyukozkan, G.; Cifci, G. A novel hybrid MCDM approach based on fuzzy DEMATEL, fuzzy ANP and fuzzy TOPSIS to evaluate green suppliers. Expert Syst. Appl. 2011, 39, 3000–3011. [Google Scholar] [CrossRef]
- Zhang, Q.-Z.; Jiang, S.; Liu, R.; Liu, H.-C. An Integrated Decision-Making Model for Analyzing Key Performance Indicators in University Performance Management. Mathematics 2020, 8, 1729. [Google Scholar] [CrossRef]
- Si, S.-L.; You, X.-Y.; Liu, H.-C.; Huang, J. Identifying Key Performance Indicators for Holistic Hospital Management with a Modified DEMATEL Approach. Int. J. Environ. Res. Public Health 2017, 14, 934. [Google Scholar] [CrossRef] [PubMed]
- Baykasoglu, A.; Kaplanoglu, V.; Durmusoglu, Z.D.U.; Sahin, C. Integrating Fuzzy DEMATEL and Fuzzy Hierarchical TOPSIS Methods for Truck Selection. Expert Syst. Appl. 2013, 40, 899–907. [Google Scholar] [CrossRef]
- Dalalah, D.; Hajaneh, M.; Batieha, F. A Fuzzy Multi-criteria Decision Making Model for Supplier Selection. Expert Syst. Appl. 2011, 38, 8384–8391. [Google Scholar] [CrossRef]
- Kobryń, A. DEMATEL as a weighting method in multi-criteria decision analysis. Mult. Criter-Decis. Mak. 2017, 12, 153–167. [Google Scholar] [CrossRef] [Green Version]
- Roszkowska, E. Rank ordering criteria weighting methods—A comparative overview. Optimum. Studia Ekon. 2013, 5, 14–33. [Google Scholar] [CrossRef]
- R Core Team. R: A Language and Environment for Statistical Computing; R Foundation for Statistical Computing: Vienna, Austria, 2020; Available online: https://www.R-project.org (accessed on 20 July 2020).
- Wei, T.; Simko, V. R package “corrplot”: Visualization of a Correlation Matrix (Version 0.84). 2017. Available online: https://github.com/taiyun/corrplot (accessed on 20 July 2020).
- de Mendiburu, F. Agricolae: Statistical Procedures for Agricultural Research. R Package Version 1.3-3. 2020. Available online: https://CRAN.R-project.org/package=agricolae (accessed on 27 November 2020).


| S1 | S2 | S3 | S4 | S5 | ||
|---|---|---|---|---|---|---|
| System Assessment | Sense of Monetary Availability | “Social Capital” | Sense of Threat | Sense of Wealth | ||
| S1 | system assessment | 0 | 1 | 2 | 3 | 2 |
| S2 | sense of monetary availability | 0 | 0 | 2 | 3 | 3 |
| S3 | “social capital” | 3 | 2 | 0 | 3 | 2 |
| S4 | sense of threat | 3 | 2 | 2 | 0 | 2 |
| S5 | sense of wealth | 1 | 3 | 1 | 3 | 0 |
| GDP | Remuneration | Inflation | Employment | Budget Deficit | |
|---|---|---|---|---|---|
| GDP | 0 | 2 | 1 | 3 | 2 |
| remuneration | 2 | 0 | 3 | 2 | 1 |
| inflation | 2 | 2 | 0 | 2 | 1 |
| employment | 3 | 3 | 1 | 0 | 1 |
| budget deficit | 1 | 0 | 2 | 1 | 0 |
| Min | Q1 | Q2 | Mean | Q3 | Max | SD | ||
|---|---|---|---|---|---|---|---|---|
| E1 | GDP | 748,483 | 976,170 | 1409,435 | 1,404,239 | 1,733,711 | 2,287,738 | 474,686.4 |
| E2 | Remuneration | 100.1 | 101.4 | 103 | 103 | 104.3 | 105.9 | 1.778372 |
| E3 | Inflation (previous year = 100) | 99.1 | 101 | 102.2 | 102.5 | 103.5 | 110.1 | 2.439046 |
| E4 | Registered unemployment rate (%) | 5.2 | 9.65 | 12.45 | 12.77 | 15.7 | 20 | 4.52689 |
| E5 | Deficit | 10,406 | 24,221 | 28,669 | 29,637 | 39,906 | 46,160 | 10,895.31 |
| Sociological | |||||
| S1 | S2 | S3 | S4 | S5 | |
| System Assessment | Sense of Monetary Availability | “Social Capital” | Sense of Threat | Sense of Wealth | |
| 4.557 | 4.801 | 4.997 | 5.948 | 4.980 | |
| 0.230 | −0.019 | 0.760 | −0.709 | −0.262 | |
| Economic | |||||
| E1 | E2 | E3 | E4 | E5 | |
| GDP | Remuneration | Inflation | Employment | Budget Deficit | |
| 19.871 | 19.370 | 17.60061 | 20.308 | 11.899 | |
| −0.225 | 0.799 | 0.552995 | 0.212 | −1.339 | |
| Sociological KPI | Economic KPI | |||||||||
|---|---|---|---|---|---|---|---|---|---|---|
| S1 System Assessment | S2 Sense of Monetary Availability | S3 “Social Capital” | S4 Sense of Threat | S5 Sense of Wealth | E1 GDP | E2 Remuneration | E3 Inflation | E4 Employment | E5 Budget Deficit | |
| RS | 0.0667 | 0.1333 | 0.2667 | 0.3333 | 0.2000 | 0.2667 | 0.2000 | 0.1333 | 0.3333 | 0.066667 |
| RE(0.5) | 0.1193 | 0.1687 | 0.2386 | 0.2668 | 0.2066 | 0.2386 | 0.2066 | 0.1687 | 0.2668 | 0.119299 |
| RE(1.5) | 0.0355 | 0.1003 | 0.2836 | 0.3964 | 0.1842 | 0.2836 | 0.1842 | 0.1003 | 0.3964 | 0.035455 |
| RE(2) | 0.0182 | 0.0727 | 0.2909 | 0.4545 | 0.1636 | 0.2909 | 0.1636 | 0.0727 | 0.4545 | 0.018182 |
| RE(2.5) | 0.0091 | 0.0514 | 0.2905 | 0.5075 | 0.1415 | 0.2905 | 0.1415 | 0.0514 | 0.5075 | 0.009079 |
| RE(3) | 0.0044 | 0.0356 | 0.2844 | 0.5556 | 0.1200 | 0.2844 | 0.1200 | 0.0356 | 0.5556 | 0.004444 |
| RE(3.5) | 0.0021 | 0.0242 | 0.2743 | 0.5990 | 0.1002 | 0.2743 | 0.1002 | 0.0242 | 0.5990 | 0.002143 |
| RR | 0.0876 | 0.1095 | 0.2190 | 0.4380 | 0.1460 | 0.2190 | 0.1460 | 0.1095 | 0.4380 | 0.087591 |
| ROC | 0.0400 | 0.0900 | 0.2567 | 0.4567 | 0.1567 | 0.2567 | 0.1567 | 0.0900 | 0.4567 | 0.04 |
| RS | 0.2000 | 0.1333 | 0.3333 | 0.2667 | 0.0667 | 0.2000 | 0.2667 | 0.1333 | 0.3333 | 0.066667 |
| RE(0.5) | 0.2066 | 0.1687 | 0.2668 | 0.2386 | 0.1193 | 0.2066 | 0.2386 | 0.1687 | 0.2668 | 0.119299 |
| RE(1.5) | 0.1842 | 0.1003 | 0.3964 | 0.2836 | 0.0355 | 0.1842 | 0.2836 | 0.1003 | 0.3964 | 0.035455 |
| RE(2) | 0.1636 | 0.0727 | 0.4545 | 0.2909 | 0.0182 | 0.1636 | 0.2909 | 0.0727 | 0.4545 | 0.018182 |
| RE(2.5) | 0.1415 | 0.0514 | 0.5075 | 0.2905 | 0.0091 | 0.1415 | 0.2905 | 0.0514 | 0.5075 | 0.009079 |
| RE(3) | 0.1200 | 0.0356 | 0.5556 | 0.2844 | 0.0044 | 0.1200 | 0.2844 | 0.0356 | 0.5556 | 0.004444 |
| RE(3.5) | 0.1002 | 0.0242 | 0.5990 | 0.2743 | 0.0021 | 0.1002 | 0.2743 | 0.0242 | 0.5990 | 0.002143 |
| RR | 0.1460 | 0.1095 | 0.4380 | 0.2190 | 0.0876 | 0.1460 | 0.2190 | 0.1095 | 0.4380 | 0.087591 |
| ROC | 0.1567 | 0.0900 | 0.4567 | 0.2567 | 0.0400 | 0.1567 | 0.2567 | 0.0900 | 0.4567 | 0.04 |
| 0.1795 | 0.1891 | 0.1991 | 0.2359 | 0.1964 | 0.2229 | 0.2175 | 0.1975 | 0.2278 | 0.13431 | |
| 0.1894 | 0.1891 | 0.2277 | 0.2072 | 0.1866 | 0.2206 | 0.2265 | 0.2039 | 0.2304 | 0.119 | |
| RS | 0.0667 | 0.1333 | 0.2667 | 0.3333 | 0.2000 | 0.2667 | 0.2000 | 0.1333 | 0.3333 | 0.066667 |
| RE(0.5) | 0.1193 | 0.1687 | 0.2386 | 0.2668 | 0.2066 | 0.2386 | 0.2066 | 0.1687 | 0.2668 | 0.119299 |
| RE(1.5) | 0.0355 | 0.1003 | 0.2836 | 0.3964 | 0.1842 | 0.2836 | 0.1842 | 0.1003 | 0.3964 | 0.035455 |
| RE(2) | 0.0182 | 0.0727 | 0.2909 | 0.4545 | 0.1636 | 0.2909 | 0.1636 | 0.0727 | 0.4545 | 0.018182 |
| RE(2.5) | 0.0091 | 0.0514 | 0.2905 | 0.5075 | 0.1415 | 0.2905 | 0.1415 | 0.0514 | 0.5075 | 0.009079 |
| RE(3) | 0.0044 | 0.0356 | 0.2844 | 0.5556 | 0.1200 | 0.2844 | 0.1200 | 0.0356 | 0.5556 | 0.004444 |
| RE(3.5) | 0.0021 | 0.0242 | 0.2743 | 0.5990 | 0.1002 | 0.2743 | 0.1002 | 0.0242 | 0.5990 | 0.002143 |
| RR | 0.0876 | 0.1095 | 0.2190 | 0.4380 | 0.1460 | 0.2190 | 0.1460 | 0.1095 | 0.4380 | 0.087591 |
| ROC | 0.0400 | 0.0900 | 0.2567 | 0.4567 | 0.1567 | 0.2567 | 0.1567 | 0.0900 | 0.4567 | 0.04 |
| BD | K | |
|---|---|---|
| RS | 105.8897 | 105.8396 |
| RE (p = 0.5) | 103.2233 | 103.1181 |
| RE (p = 1.5) | 106.9213 | 106.4883 |
| RE (p = 2) | 106.5803 | 106.026 |
| RE (p = 2.5) | 106.528 | 105.879 |
| RE (p = 3) | 106.6115 | 105.8952 |
| RE (p = 3.5) | 106.7471 | 105.9887 |
| RR | 106.5819 | 106.527 |
| ROC | 107.1898 | 106.8607 |
| bez wag | 102.3405 | 102.7958 |
| BD | K | |
|---|---|---|
| RS | 66.2236 | 68.0211 |
| RE (p = 0.5) | 67.5448 | 68.5072 |
| RE (p = 1.5) | 63.8937 | 66.8734 |
| RE (p = 2) | 61.2202 | 65.2883 |
| RE (p = 2.5) | 58.7663 | 63.5575 |
| RE (p = 3) | 56.5474 | 61.9635 |
| RE (p = 3.5) | 54.5901 | 60.3429 |
| RR | 60.3829 | 62.5806 |
| ROC | 61.0858 | 64.0558 |
| no weights | 69.395 | 70.2309 |
| BD | K | |
|---|---|---|
| RS | 151.6572 | 145.0469 |
| RE (p = 0.5) | 149.0889 | 145.9193 |
| RE (p = 1.5) | 155.0524 | 144.6197 |
| RE (p = 2) | 157.7133 | 145.0635 |
| RE (p = 2.5) | 159.7628 | 145.8747 |
| RE (p = 3) | 161.566 | 146.6294 |
| RE (p = 3.5) | 162.742 | 147.0796 |
| RR | 154.1955 | 146.9581 |
| ROC | 155.4681 | 145.705 |
| Without weights | 146.569 | 145.3966 |
Publisher’s Note: MDPI stays neutral with regard to jurisdictional claims in published maps and institutional affiliations. |
© 2022 by the authors. Licensee MDPI, Basel, Switzerland. This article is an open access article distributed under the terms and conditions of the Creative Commons Attribution (CC BY) license (https://creativecommons.org/licenses/by/4.0/).
Share and Cite
Nojszewska, E.; Sielska, A. Macroeconomic and Social Indicators to Launch the PM-Based VBHC Model in the Healthcare System in Poland. Int. J. Environ. Res. Public Health 2022, 19, 1712. https://doi.org/10.3390/ijerph19031712
Nojszewska E, Sielska A. Macroeconomic and Social Indicators to Launch the PM-Based VBHC Model in the Healthcare System in Poland. International Journal of Environmental Research and Public Health. 2022; 19(3):1712. https://doi.org/10.3390/ijerph19031712
Chicago/Turabian StyleNojszewska, Ewelina, and Agata Sielska. 2022. "Macroeconomic and Social Indicators to Launch the PM-Based VBHC Model in the Healthcare System in Poland" International Journal of Environmental Research and Public Health 19, no. 3: 1712. https://doi.org/10.3390/ijerph19031712
APA StyleNojszewska, E., & Sielska, A. (2022). Macroeconomic and Social Indicators to Launch the PM-Based VBHC Model in the Healthcare System in Poland. International Journal of Environmental Research and Public Health, 19(3), 1712. https://doi.org/10.3390/ijerph19031712