Abstract
This paper investigated the health risks due to metal concentrations in soil and vegetables from the island province in the Philippines and the potential ecological risks. The concentrations of Cd, Cr, Cu, Fe, Mn, Ni, Pb, and Zn in vegetables and soil in six municipalities of the province were analyzed using the Inductively Coupled Plasma Optical Emission Spectrometry (ICP-OES) Perkin Elmer Optima 8000. It was recorded that all metal concentrations in the soil, except for Cd, exceeded the soil quality standard (SQS). The concentration of Fe and Mn was highest among other metals. The Nemerow synthetical pollution index (Pn) in all soil samples was under Class V which means severe pollution level. Likewise, the risk index (RI) of soil ranged from high to very high pollution risk. Most of the metal concentrations in the vegetables analyzed also exceeded the maximum permissible limit (MPL). All health hazard indices (HHIs) were less than 1, which means potential low non-carcinogenic risk to human population by vegetable consumption. However, it was found that concentration of Cr and Ni in vegetables is a potential health hazard having concentrations exceeding the maximum threshold limit. A 75% temporary consumption reduction of bitter melon, eggplant, sweet potato tops, and string beans produced from two municipalities may be helpful in reducing exposure to target metals. Additional studies are needed to confirm this recommendation. Spatial correlation analysis showed that six out of target metals had datasets that were more spatially clustered than would be expected. The recorded data are useful for creation of research direction, and aid in developing strategies for remediation, tools, and programs for improving environmental and vegetable quality monitoring.
1. Introduction
The island province of Marinduque in the Philippines, with farming as the major source of income of the population, had been recognized as one of the country’s largest copper reserves. Hence, copper mining operations were carried out in Marinduque since 1969 [1]. In 1964, the mining industry was established in the province [2]; however, the Maguilaguila siltation dam, a tailing pond, collapsed on 6 December 1993, allowing mine tailings to flow into the Mogpog River [3]. Mine tailings swamped the barangays along the river. On 24 March 1996, almost three years after the Maguilaguila mining disaster, the Tapian dam fell, flooding the 27-km-long Boac River with mine tailings [3]. The Boac River tailings deposits were thought to be a long-term source of acid and elevated concentrations of metals in the environment. Significant amounts of soluble salts have built up due to oxidation of sulfides in the tailings [4]. These salts retain acids and metals in a solid state that is easily soluble until the next rainfall. The cycle of salt formation and dissolution can be repeated each dry and wet season [5]. Currently, the two open mine pits, i.e., Maguilaguila and Tapian pits, that were abandoned when mining operation stopped in 1997 still exist in Marinduque and these are located at a higher elevation in the municipality of Sta. Cruz. Therefore, there is a serious concern that mine tailings will contaminate the biomass of plants and animals in the environment [6] and exacerbate health concerns [7].
Toxic metals have been related to a number of health problems [8]. Some of these metals are lead (Pb), nickel (Ni), arsenic (As), cadmium (Cd), and chromium (Cr) that have been classified as human carcinogens (known or probable) by the US Environmental Protection Agency (USEPA) [9] and the International Agency for Research on Cancer (IARC) [10]. Another condition that adds to the public concern is the nature of the geological profile of the island province of Marinduque. It is composed of volcanic and/or sedimentary rocks that are porous and can transmit contaminants from higher to lower elevations [11]. Environmental contamination has the capacity to migrate across land surface and underground porous media [12]. Due to the essential characteristics of heavy metals such as accumulation [13], bioavailability [14], and low mobility in soils [15], heavy metal pollution poses both potential ecological and health risks [16]. Hence, the quality of vegetables and edible crops produced in the island province has become a public concern [17]. Vegetables are an important dish and most often part of regular meals for the Philippine population and the global population. It has been noted that vegetables are an important dietary component for humans. Some vegetables contain metals and are important micronutrients for living organisms. Hence, giving attention to the quality of vegetables and soil is important.
Plants absorb metals from the soil and water through the roots, hence, the presence of elevated metal concentrations in these media affects the quality of plants [11]. Crops and vegetables grown in contaminated soils can accumulate significant levels of hazardous metals, posing serious health concerns to humans if consumed [18]. The most common pathway for human exposure to hazardous metals is through food consumption. Heavy metals are easily absorbed by vegetable roots and can build up to large levels in the edible sections of vegetables, even at low levels in the soil [19]. Moreover, low-level chronic exposure to heavy metals can have long-term health consequences [20].
There have been several studies on heavy metal contamination in water and sediment [21,22,23,24] in the island province; however, metal concentrations in soil and vegetables were not examined. Other studies focused on phytoremediation strategies and techniques [25,26,27,28,29]. These studies recorded the highest concentration of Zn in the roots, Cu in the stems, and Pb in the leaves [29]. Additionally, Cu accumulated in the roots more than twice the rate of other parts of the plants [30]. Moreover, heavy metal contaminations are frequently compounded with numerous metals in the field [31]. Hence, more research on the quality of various vegetables grown and consumed in the province is needed. These studies are possible toxicity [32], resistant nature [33], speciation [34], frequency of vegetable intake, safety and health issues [35], as well as uncertainty and variability analysis [36,37,38]. Most health risk assessments are made up of primary, secondary, processed data, and engineered models. These engineered models are under conditions of probability considering the significant contribution of relative uncertainty and variability [36,37,38]. Hence, health risk assessment approaches incorporated the correlation and statistical analysis techniques to address uncertainties and variability. In this paper, the levels and trends of metal concentrations in soil and vegetables from the island province in the Philippines, the potential health risks associated with their daily use, and how the soil and vegetables are spatially correlated are presented.
2. Materials and Methods
2.1. Study Area and Collection of Samples
Marinduque is an island province, with about 53,344 households in the Republic of the Philippines with coordinates of 13.4767° N, 121.9032° E. This island province has a tropical climate with annual mean temperature of 27 °C. The island does not have a distinct wet and dry season as precipitation occurs all year.
The vegetable and soil samples were collected from six municipalities of Marinduque, namely Boac (B), Buenavista (BV), Gasan (G), Mogpog (M), Sta. Cruz (S), and Torrijos (T). Sampling locations were distributed spatially over the six municipalities of the island province. Coordinates of every sampling point were recorded and plotted using Geographic Information Systems as shown in Figure 1. Generally, the land use of the sampling points from the island province is mainly agricultural [39,40].
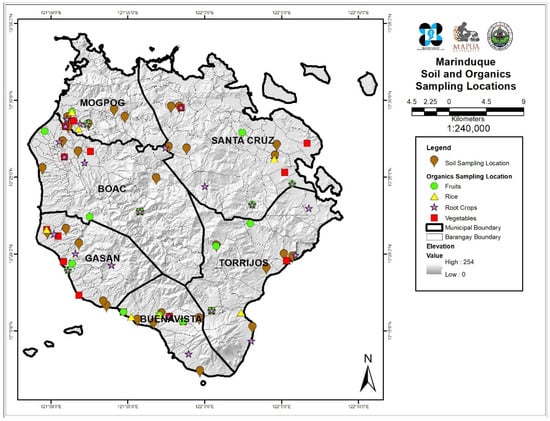
Figure 1.
Map of the study area and locations of sampling sites.
Four types of vegetables samples were collected in the individual towns’ public markets and household farmyards. A total of 96 samples were assessed, analyzed, and evaluated in triplicates. The vegetables were chosen from the top produced and consumed vegetables in Marinduque, namely string beans (Vigna unguiculata), sweet potato tops (Ipomoea batatas), bitter melon (Momordica charantia), and eggplant (Solanum melongena). Likewise, composite soil samples were collected from each municipality across the province with a stainless-steel auger at 0–30 cm depths. The selection of sites was undertaken on the basis of where vegetables farms are located. Coordinates were recorded using a handheld Garmin global positioning system (GPS) model Montana 650. All vegetable and soil samples were put in a zipper bag, labeled, and transported to the laboratory for treatment and analysis. Sample collection started in 2018 and ended in 2019 completing one year season.
2.2. Samples Preparation and Analysis
Vegetable samples were washed, thinly cut/sliced, and dried in a dehydrator at 68 °C for 7–8 h at the MSC-Mapua joint research laboratory in Boac, Marinduque. Dried samples were pulverized into fine particles and stored at room temperature in a properly labeled disposable Petri dish until digestion. Utensils and laboratory equipment were cleaned with soap and water, then rinsed with 1.5% v/v nitric acid and distilled water every use per sample. Additionally, the soil samples were dried at 68 °C for 3 h, ground to a fine powder using an agate mortar and pestle, homogenized, and passed through a 10-mesh sieve before analysis. The concentration of metals such as cadmium (Cd), chromium (Cr), copper (Cu), iron (Fe), lead (Pb), manganese (Mn), nickel (Ni), and zinc (Zn) was analyzed in triplicates using an Inductively Coupled Plasma Optical Emission Spectrometer (ICP-OES) Perkin Elmer Optima 8000. The ICP-OES used in this analysis has detection limits of 0.05, 0.1, 0.1, 0.5, 0.07, 0.5, 0.1, 0.04, and 2.0 for Cd, Cr, Cu, Fe, Hg, Mn, Ni, Pb, and Zn, respectively. The EPA Method 3050B [41], 200.3 [42], and 6010c [43] were followed in the digestion and analysis of samples. The digestion and analysis were conducted at Mapua University’s Yuchengco Innovation Center’s Wet Laboratory in Manila, Philippines.
2.3. Evaluation of Metal Pollution in Soil
The level of soil pollution was assessed by the single-factor (Pi) and the Nemerow synthetical pollution index () [44]. The Pi is a useful tool for determining the pollution degree of a certain heavy metal in soil using Equation (1).
where is the concentration of metal i, and is the soil quality standard value [45,46]. A higher value of indicates more serious pollution, and soil is considered as polluted when is greater than 1 (Table 1).

Table 1.
The grading standards for pollution indices [44].
To better describe the level of soil pollution when Pi is less than 1, the can evaluate a range of heavy metal toxicity levels, as shown in Equation (2).
where is the maximum value of the Pi and is the average value of the Pi. The grading standard for Pi is shown in Table 1.
2.4. Potential Ecological Risk Index (pERI)
To measure the adverse effects of soil contamination, the risk index (RI) approach established by Hakanson [47] was used. The approach requires four hypotheses elaborated by the work of Agarin et al. [3]. The potential ecological risk index (pERI) considers the concentrations of metals, their environmental impact, and biotoxicity. The RI is computed by following Equation (3).
where is the toxic response factor for metal i [44]. The grading standard for pERI is also categorized in Table 1.
2.5. Potential Human Health Risk Assessment
The potential human health risk from the consumption of vegetables was estimated by calculating the estimated daily intake (EDI) of metals, health hazard index (HHI), and target cancer risk (TCR) [3]. The EDI in Equation (4) was used to calculate the level of exposure to a particular metal in vegetables via ingestion/oral route [48].
where, is exposure frequency (365 days/year); is the exposure duration (years); is the metal concentration (mg kg−1); is the daily average vegetable consumption (g person−1 day−1) [49,50]; is the conversion factor for fresh vegetable weight to dry weight (0.085) [51,52]; is the reference body weight for an adult (kg); and is the average exposure time. The exposure duration considered was 70 years [53,54,55]. This is based on the average life expectancy of the Philippine population [53,54]. The Philippine population for bitter melon, eggplant, string beans, and sweet potato tops are 7.42, 14, 6.99, and 7.78 g person−1 day−1 [49,50], respectively.
The target hazard quotient (THQ) provides an estimate of the amount of risk associated with pollutant exposure [56]. It was used to evaluate the potential health risks of metal consumption through vegetables [19]. Equation (5) was used to estimate the THQ values of the population as a result of consuming contaminated vegetables as described by Chen et al. [57] and Ezemonye et al. [58].
where, is the oral reference dose (mg kg−1 day−1) [56,59]. The RfD is an estimate with uncertainty spanning an order of magnitude of a daily oral exposure to the human population that is likely to be without an appreciable risk of deleterious effects during a lifetime [60]. This number was based on the no-observed adverse effect level (NOAEL) with the consideration of uncertainty factor. If the estimated daily intake of contaminated vegetables of a population is greater than the RfD, then the occurrence of associated health risks increases. Should the THQ be less than one, it is considered safe or has non-carcinogenic consequences. Should THQ be larger than one, the probability of danger increases [19,56].
The HHI [3] was determined by adding the individual metal target hazard quotient values [61] using Equation (6).
Carcinogenic risk assessment, on the other hand, is an estimation of the cumulative probability of developing cancer throughout a lifetime by exposure to a unit dose of a probable carcinogen [34]. The possibility of cancer risks in the studied vegetables through intake of carcinogenic heavy metals was estimated using the cancer risk (CR) [62] as shown in Equation (7). Then, the TCR from heavy metals intake, which can have a carcinogenic effect depending on the exposure level [63], was calculated using Equation (8).
where, CSF is the cancer slope factor and defined as the risk generated by a lifetime average amount of 1 mg kg−1 day−1 of carcinogen chemical and is contaminant specific [63,64,65,66]. Therefore, cancer risk was expressed in terms of incremental lifetime cancer risk, i.e., the probability of developing cancer over a 70-year lifetime period due to a 24 h exposure to a potential carcinogen [55]. The values of CSF for Cd, Cr, Ni, and Pb are 0.38, 0.5, 1.7, and 0.0085 mg kg−1 day−1 [63], respectively. In contrast, if the TCR exceeds the maximum threshold value of there is a high risk of carcinogen exposure [63,65,66,67].
2.6. Spatial Correlation Analysis
ArcGis Desktop 10.8.1 ArcPro 2.8 [68] was employed to create spatial distribution maps and spatial correlation analysis. Moran’s I (index) was used to determine the autocorrelation of datasets to produce spatial distribution maps of metal concentrations in soil and vegetables. Moran’s I is classified as positive, negative, and no-spatial autocorrelation. Positive autocorrelation occurs when values clustered together or appear near to each other. Negative spatial autocorrelation occurs when datasets are dispersed, i.e., dissimilar values occur next or near to each other. Should similar and dissimilar values appear randomly, then no spatial autocorrelation occurred.
2.7. Statistical Analysis
Pearson’s correlation and hierarchical cluster analysis (HCA) was used using IBM SPSS Statistics Version 26.0 to look at the specific relationships between the various metals found in soil and vegetables as well as how certain metals influence their concentration.
3. Results and Discussion
Subsequent sections elaborate and discuss the results and the potential health implications of recorded concentrations of metals. Data presented below are helpful in determining research directions, creating strategies in soil remediation, soil quality monitoring programs for vegetable quality monitoring, creation of in situ detection tools for metals specific for vegetables and crops, and among other related techniques helpful for reducing health risks.
3.1. Concentration of Metals in Soil
The soil samples recorded concentrations of Cr (854–2465.86), Cu (1711.27–17,712.23), Fe (759,560.17–1,083,607.03), Mn (25,596.87–60,549.73), Ni (536.43–3216.47), Pb (393.27–1291.13), and Zn (2291.37–6160.83) mg kg−1. All the metal concentrations in the soil, except for Cd, from the six municipalities exceeded the soil quality standards (SQS). There are very limited related studies in the area; however, results are comparable to the work of Marges et al. [7], Senoro et al. [69], and Sanchez et al. [70]. The work of Marges et al. and Sanchez et al. in 2009 and 2015 at the Calancan Bay of Marinduque published in March 2011 and January 2018, respectively, showed no recorded Cd concentration in soil. The non-detection of Cd in soil in this study has been attributed to the soil acidity and uptake of some plants [71]. The study of Usman [71] specifically mentioned that plants remediate Cd by phytoextraction and it accumulates in the shoot. Phytoremediation activities in Marinduque were recorded during the period of 2006–2017 [25,26,27,28,29,30]. Other studies in Vietnam [72], Malaysia [73], and Indonesia [74] where there were mining activities recorded an elevated concentration of Cr in soil with no record of Cd concentration.
It shows that Fe and Mn had the highest concentration of metals in soil across the six municipalities. The high concentration of Fe in the soil can be attributed to the mine tailings from the previous milling of sulfide ores, i.e., copper and zinc, which may have high levels of pyrite (iron sulfide) [75,76]. Likewise, continuous subsurface flow of metals within the island are associated to the two abandoned open mine pits that are located at the higher elevation of the island province [3]. Metal concentration varies spatially as illustrated in Appendix A. Table 2 shows the mean concentrations of metals in the soil samples highlighting the SQS [45,77]. The trend of metal concentrations across the island province is shown in Table 3.
Table 2.
Mean concentrations of metals in soil () with soil quality standards (SQS), n = 90.
Table 3.
Trend of metal concentrations in the soil across the province.
3.2. Evaluation of Metal Pollution in Soil
In order to obtain the status of soil pollution from each municipality, the values of and were calculated using the Nemerow pollution index (NPI). The NPI illustrates the degree of probable pollution a metal contributes, and/or how several metals probably pollute a target environmental medium. As illustrated in Figure 2, all mean values of soil from each municipality were greater than five except for Cd which was not detected. This implies that the soil from all municipalities belongs to Class V with severe pollution level (Table 1) and is quite alarming [78]. Heavy metal pollution of soil is a serious environmental hazard, particularly in locations where soils intended for agricultural practices are adjacent to sources of pollution such as mining [44].
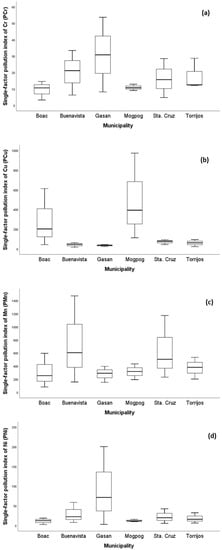
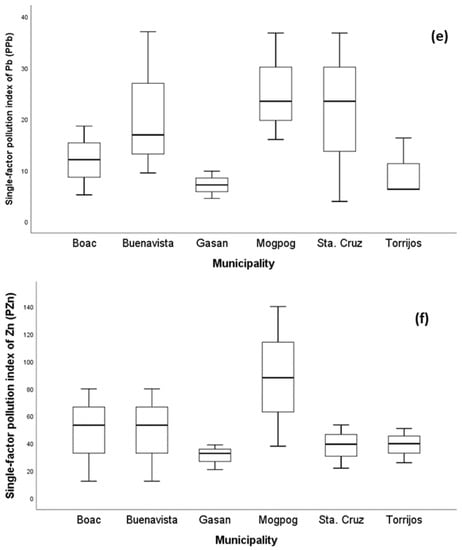
Figure 2.
The single-factor pollution index () of soil per municipality of the island province. The of (a) Cr, (b) Cu, (c) Mn, (d) Ni, (e) Pb, and (f) Zn in soil from all municipalities across the province.
As illustrated in Figure 3a, the values in all soil from each municipality ranged from 61.35 to 1055.83, which are greater than three indicating that all soil samples were under Class V with severe pollution level (Table 1). The of soil in all municipalities had the following order: BV > S > M > T > G > B. In Figure 3b, the higher pERI was found in the soil of Boac and Mogpog in comparison with Buenavista, Gasan, Sta. Cruz, and Torrijos. More specifically, in Mogpog, the single ecological risk index () of Cu was greater than 1200, ( = 1968.03), indicating a higher contribution of Cu to RI. The RI of soil in Boac, Buenavista, and Mogpog exceeded 1200; hence, there is very high pollution risk. On the other hand, the RIs of Gasan, Sta. Cruz, and Torrijos were between 600 and 1200 indicating a high pollution risk too. The high pollution risk of the soil due to metal pollution can adversely impact plant growth [79], microbial diversity [80], biota [81], and humans whose exposure includes incidental ingestion, inhalation, and dermal contact [82].
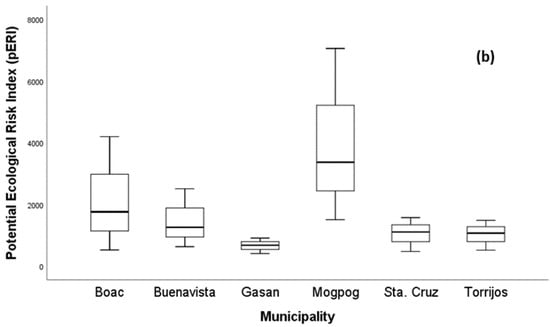
Figure 3.
Boxplot of (a) the Nemerow synthetical pollution index and (b) risk index of metal in soil.
3.3. Concentration of Metals in Vegetables
Firstly, it must be emphasized that metals such as Fe and Zn are essential micronutrients for human health and other living organisms. The degree of concentrations of metals in vegetables presented below are useful in making strategies, epidemiological studies, further research on edible agricultural yields, and creating more tools for vegetable quality monitoring to protect human health. It will also aid comprehensive soil and vegetable quality monitoring.
The mean concentrations (mg kg−1) of metals in the vegetable samples collected from Marinduque are shown in Figure 4a–h with a red horizontal line representing the maximum permissible limits (MPL) set by World Health Organization, Food and Agriculture Organization and International Food Standards [82]. Metal concentrations in vegetables are represented by Y-coordinates and illustrated by vertical bars. The MPL (mg kg−1) for Cd, Cr, Cu, Fe, Mn, Ni, Pb and Zn concentrations illustrated in Figure 4a–h are 0.1, 2.3, 40, 425, 11, 10, 0.2 and 50, respectively [63,67,82,83,84,85]. The string bean samples had concentrations (mg kg−1) of Cd (0.004–4.581), Cr (0.0005–6.968), Cu (48.34–68.50), Fe (48.40–68.58), Mn (16.72–35.75), Ni (0.001–13.978), Pb (0.012–5.986), and Zn (155.98–275.50). Metal concentrations in sweet potato tops ranged from 0.004 to 4.531 Cd, 0.0005–9.323 Cr, 11.13–24.99 Cu, 70.84–625.35 Fe, 28.21–52.84 Mn, 0.001–11.022 Ni, 0.012–6.581 Pb, and 107.73–157.99 Zn. The bitter melon samples had concentrations of Cd (0.004–4.541), Cr (0.0005–6.9625), Cu (7.95–16.44), Fe (37.70–47.76), Mn (11.26–37.54), Ni (0.001–7.811), Pb (0.01–5.74), and Zn (138.54–190.24). Metal concentrations in eggplant range from 0.004 to 4.675 Cd, 0.0005–6.9128 Cr, 10.433–17.822 Cu, 3.20–39.57 Fe, 1.86–23.94 Mn, 0.001–6.494 Ni, 0.012–6.533 Pb, and 0.001–157.630 Zn. It was recorded that Zn concentration in all types of vegetables across the island province exceeded the MPL except for the eggplant collected from Boac. The Fe in sweet potato tops collected from Gasan municipality exceeded the MPL. Additionally, the concentration of Mn in all types of vegetables, except for the eggplant collected from Mogpog, exceeded the MPL. Likewise, Cd and Cr concentrations in most types of vegetables from Buenavista and Gasan exceeded the MPL. It was also recorded that concentration of Pb in most types of vegetables from Buenavista, Gasan, and Sta. Cruz exceeded the MPL. Only the string beans from Buenavista and Gasan and the sweet potato tops from Gasan exceeded the MPL for Ni. The spatial distribution map of metal concentrations in soil and vegetables is illustrated in Appendix A to further visualize the potential distribution of metal concentrations across the island province.
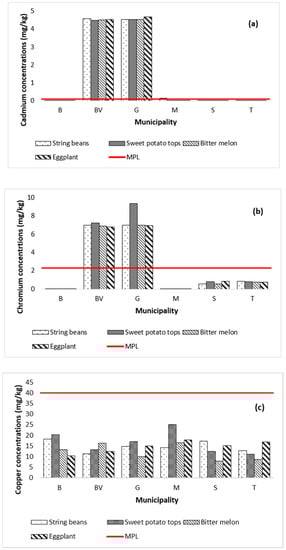
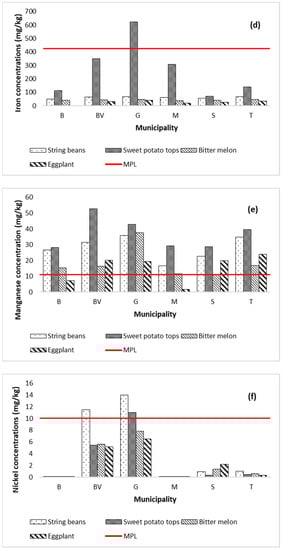
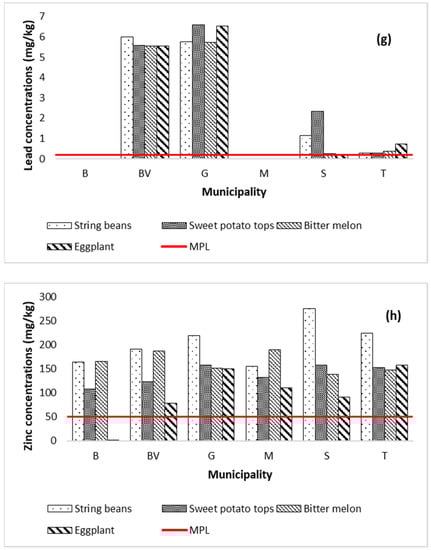
Figure 4.
Metal concentrations in vegetables by municipality in the island province. The concentration of Cd (a) in all vegetables from BV and G was above MPL. The concentration of Cr (b) in vegetables from BV and G was above the MPL. The Cu concentration (c) in all vegetables was below MPL in all six municipalities. The Fe concentration (d) in all vegetables of the six municipalities except for the sweet potato tops of G was below MPL. The Mn concentration (e) in all vegetables from the six municipalities except the eggplant from B and M was beyond MPL. The Ni concentration (f) in string beans from BV and G and the sweet potato tops from Gasan exceeded the MPL. The Pb concentration (g) in all vegetables from BV, G, S, and T was beyond MPL. The Zn concentration (h) in all vegetables from the six municipalities except for the eggplant of B was above the MPL.
It is useful to note that the leafy vegetable (sweet potato tops) had accumulated the highest metal concentrations. Similar findings have been reported by Luo et al. [86], indicating that leafy vegetables accumulate metals more than non-leafy vegetables. The distribution trend of metal concentration in vegetables is shown in Table 4. It shows that Zn had the highest concentration, among target metals in all vegetables across the six municipalities.
Table 4.
Distribution trend of metal concentration in vegetables.
3.4. Potential Human Health Risk of Metals by Ingestion
The EDI of metals through consumption/oral intake of vegetables by the population in Marinduque is presented in Table 5. The eggplant contributed most to the population EDI given that it has the highest among the vegetables tested. It was followed by sweet potato tops then string beans and lastly bitter melon as illustrated in Figure 5. The metals of concern in vegetables were Cd, Cr, Fe, Mn, Pb, Zn, and Cu. The EDI of individual metals as a result of vegetable consumption was in the order of Zn > Fe > Mn > Cu > Ni > Cr > Pb > Cd. Bar plots are illustrated in Figure 5 and Figure 6 to visualize the concentration of metals in each vegetable type and the potential contribution of specific vegetables to the HHI of each municipality.
Table 5.
The estimated daily intake (EDI) of metals through vegetables.
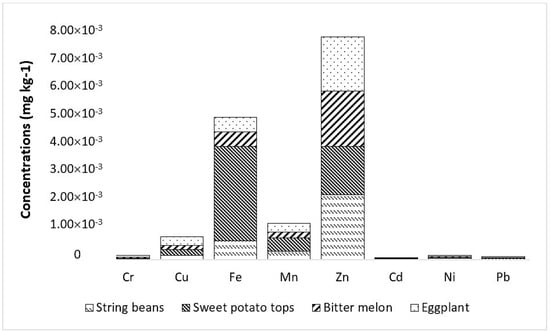
Figure 5.
Contribution of vegetables to the average estimated daily intake (EDI) of metals.
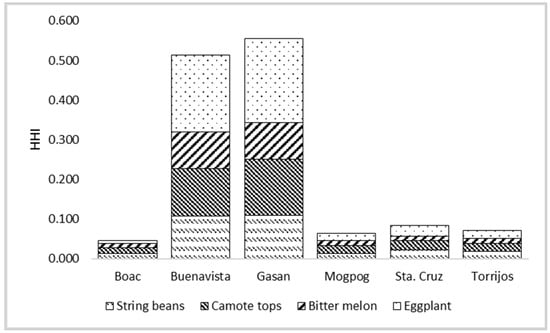
Figure 6.
Potential health hazard index (HHI) by ingestion of vegetables from Marinduque.
The TCR associated with exposure to heavy metals such as Cr, Cd, Ni, and Pb from vegetable consumption was calculated using EDI data (Table 5), CSF [63,78,79], and TCR data shown in Table 6.
Table 6.
Target cancer risk due to the consumption of vegetables with elevated heavy metal concentrations.
The computed EDI ranges for various vegetables were – Cd, – Cr, – Fe, – Mn, – Ni, – Pb, – Zn, and – Cu.
The THQ and HHI values were used to interpret the metals’ possible health hazards. The computed potential HHI of metals present in vegetables is shown in Table 7 which evaluated the cumulative effect of ingesting a variety of potentially harmful metals from several vegetables [63]. Ingestion of the vegetable samples recorded to have THQ values ranged from to Cd, – Cr, – Fe, – Mn, – Ni, – Pb, – Zn, and – Cu. All of the HHI values were less than 1, hence, there is a potential low non-carcinogenic human health risk to the human population from vegetable consumption [87]. Further, it was found that the highest HHI values in vegetables were in Buenavista and Gasan. It is being emphasized that THQ and HHI were significantly affected by the EDI and RfD values. These values are estimated values with uncertainty.
Table 7.
The target cancer risk at 75% reduction of vegetable consumption.
It can be seen from Table 6 that the TCR of Ni due to vegetable consumption in Buenavista (), Gasan (), and Sta. Cruz () exceeded the maximum threshold value of [66,67,83,84]. This indicates potential risk of developing cancer if the population has a daily intake of vegetables shown in Table 5. The corresponding TCR of Cr in Buenavista () and Gasan () is also higher than the maximum threshold value. It was observed that ingestion of Cr and Ni in vegetables may pose a cancer risk to the population of Marinduque. This recorded result is similar to the findings of Gebeyehu et al. [63]. Chronic exposure to high amounts of Cr causes malignancies of the gastrointestinal tract, respiratory and central nervous systems [74,76]. However, it is considered that the ingested dose of vegetable with elevated concentration of metals is not always equal to the absorbed metal concentration dose as a fraction could potentially be excreted from the body [88]. Hence, regular excretion is important. Additionally, it is noted that the TCR was based on EDI shown in Table 5, CSF, body weight, and 365 days a year of exposure frequency. Therefore, these variables significantly affect the potential to acquire carcinogens and the likelihood of cancer risk during a lifetime exposure. These elevated metal concentrations in the vegetables that posed HHR to the population were associated to the existence of two abandoned open mine pits which are located at the higher elevation of Marinduque [69]. Groundwater flow [21] through porous media, and runoff overflow in the island province potentially caused the elevated concentration of metals in soil that the vegetables may have absorbed from the soil. Given the above information, it is advised to exercise a 75% temporary consumption reduction of bitter melon, eggplant, string beans, and sweet potato tops produced in the municipalities of Buenavista and Gasan. This is to avoid Cr and Ni TCR. Therefore, the proposed monthly average consumption of bitter melon, eggplant, string beans, and sweet potato tops is 6.9, 7.8, 7.4, and 14 g person−1, respectively. This is to reduce exposure and the probability of cancer occurrence by vegetable ingestion. The TCR at 75% reduction is shown in Table 7. The TCR of Ni in Buenavista and Gasan still exceeds the threshold value despite a 75% consumption reduction. Hence, a comprehensive study covering quality of other vegetables produced in the island will be helpful to identify the location and types of vegetables that must be consumed by the public without posing TCR.
Based on the calculated TCR estimation, a 75% reduction of vegetable consumption would leave Ni alone as concern in the municipalities of Buenavista and Gasan. The TCR of Ni in Buenavista and Gasan at 75% reduction of vegetables consumption is 1.52 × 10⁻⁴ and 2.13 × 10⁻⁴, respectively. The recommended 75% consumption reduction is temporary as mentioned above. This recommendation, apart from being temporary, is only for bitter melon, eggplant, string beans, and sweet potato tops produced specifically from the municipalities of Buenavista and Gasan. Hence, the effects of the 75% reduction (referred above) do not violate the “food security (FS)” goal defined by the United Nations’ Committee on World Food Security. The FS definition states that “all people, at all times, have physical social, and economic access to sufficient, safe, and nutritious food that meets their food preferences and dietary needs for an active and healthy life.” The vegetables produced by the above-mentioned municipalities were not safe based on the detected metal concentrations that were beyond the maximum permissible limit [62,66,82,83,84].
3.5. Relationships of Metals in Soil and Vegetables
Pearson correlation analysis was carried out to determine the degree of interrelation and association of the metals in soil and vegetables [89]. As shown in Table 8, the correlation coefficients of Ni-Cr, Zn-Pb, and Cu-Zn were 0.917, 0.940, and 0.921 (p < 0.01), respectively. The value of (p < 0.01) expresses statistical significance of the relationship and association of metals in soil and vegetables.
Table 8.
Correlation matrix of metals in the soil.
HCA was further used to determine the affinity and behavior of metal in the soil across the province. Figure 7 shows the dendrogram results generated by HCA for metals. The following two primary clusters were identified: (1) Cr-Ni-Cd-Pb-Zn-Cu-Mn and (2) Fe. It produced results that were similar to those of the Pearson correlation analysis.
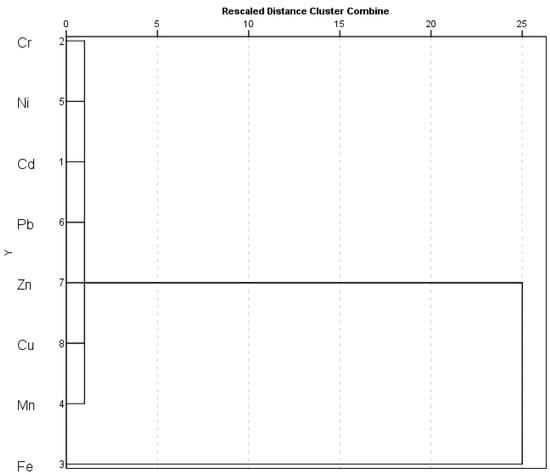
Figure 7.
Cluster analysis of metals in soil across the province.
As shown in Table 9, the correlation coefficients of Cr-Cd, Mn-Fe, Ni-Fe, Ni-Mn, Pb-Cd, and Pb-Cr were 0.986, 0.629, 0.605, 0.852, 0.977, and 0.977 (p < 0.01), respectively. These positive significant correlations between these various metals in soil and vegetables demonstrated that they commonly interact, cooperate with each other to promote potential uptake of vegetables from soil, and are a common source of pollution [41,74,75].
Table 9.
Correlation matrix of metals in the vegetables.
Furthermore, spatial correlation technique was employed to analyze further the relationship of metal concentrations in vegetables that were collected in proximity to where the soil samples originated. Table 10 elaborates the generated Moran’s Index that measures the spatial autocorrelation of soil and vegetables. This table illustrates that the concentration of Cr, Ni, Pb, and Zn in the soil is spatially correlated with concentration in vegetables. In addition, though Cd was not detected in soil, the Cd concentration in vegetables shows that it is spatially correlated to nearby environmental media having a Moran’s I and p-value of 0.668301 and 0.004269, respectively. This is attributed to the groundwater [21,65] and runoff quality [65].
Table 10.
The spatial autocorrelation and its interpretation.
4. Conclusions
In this study, the trends of metals in soil and vegetables across the island province in the Philippines were investigated. Soil and vegetable samples were collected from the six municipalities of Marinduque island province and vegetables chosen were among the top produced and consumed in the province, namely string beans, sweet potato tops, bitter melon, and eggplant. All samples were analyzed for the presence of Cd, Cr, Cu, Fe, Mn, Ni, Pb, and Zn and assessed for potential ecological and human health risks. It was recorded that all metal concentrations in the soil, except for Cd, from the six municipalities exceeded the SQS. The concentrations of Fe and Mn in soil were the highest among other target metals. The Pn values in all soil samples from each municipality were under Class V which means severe pollution level. Likewise, the pERI of soil in Boac, Buenavista, and Mogpog was considered to have a very high pollution risk while for Gasan, Sta. Cruz, and Torrijos, a high pollution risk was found.
Most of the metal concentrations in the vegetables exceeded the MPL. The sweet potato tops, a leafy vegetable, had accumulated the most metals among the vegetables. Eggplant more likely contributed the greatest TCR to the population. Moreover, all HHI values were less than 1 which means that there is a potential low non-carcinogenic human health risk to the population from the consumption of vegetables. The concentrations of Cr and Ni in target vegetables have the potential risk of cancer occurrence to the population. The TCR of Cr and Ni exceeded the maximum threshold value of 1.00 × 10⁻⁴. It is further stressed that values of TCR were based on estimated EDI and RfD with uncertainty though addressed by engineering models. Hence, more focused and deeper study is useful.
Based on this record, it is advised to exercise a 75% temporary consumption reduction of bitter melon, eggplant, string beans, sweet potato tops produced from the municipalities of Buenavista and Gasan. Therefore, the proposed temporary monthly average consumption of bitter melon, eggplant, string beans, and sweet potato tops is 6.9, 7.8, 7.4 and 14 g person−1, respectively. However, more studies are necessary to identify more vegetables and from which area they should be produced in order to sustain the dietary and vegetable preference needs of the population.
The datasets were subjected to an autocorrelation analysis using Moran’s Index of the GIS. Records showed that the datasets were more spatially correlated and clustered than would be expected. This means that metal concentrations in soil and nearby vegetables are correlated with each other. Further, the Pearson correlation and hierarchical cluster analyses, on the other hand, revealed that the positive significant correlation between the grouped metals in soil and vegetables demonstrated affinity, promoted potential uptake of vegetables from soil, and a common source of pollution. Hence, expanding the current research to include determining which part of a vegetable stores Ni, contaminant transport analysis, biomonitoring of Cr and Ni, different routes of metal exposure such as eating other foods (root crops, fruits, and cereals), drinking water, and air contact, uncertainty and variability analyses, is crucial to further the understanding of the risks associated with the elevated metal concentrations in the soil and its produce on human health, especially targeting carcinogenic risk. Further, the result of this study is useful for the development of more focused studies for more specific contaminants and edible agricultural yields that are consumed by the public. In addition, epidemiological studies specific to cancer risks are useful to help health authorities and relevant government agencies to create necessary programs to protect public health.
Author Contributions
Conceptualization, D.B.S.; methodology, D.B.S.; software, C.J.M.A.; validation, R.C.N., C.J.M.A. and M.Y.R.D.; formal analysis, D.B.S., E.B.C., P.B.B. and R.C.N.; investigation, D.R.M., P.B.B., M.Y.R.D., R.C.N., C.J.M.A. and D.B.S.; resources, D.B.S.; data curation, R.C.N., P.B.B., D.B.S. and M.Y.R.D.; writing—original draft preparation, R.C.N.; writing—review and editing, D.B.S., C.J.M.A., D.R.M. and E.B.C.; visualization, D.B.S.; supervision, D.B.S.; project administration, D.B.S.; funding acquisition, D.B.S. All authors have read and agreed to the published version of the manuscript.
Funding
This research was funded by the Philippine Council for Health Research and Development of the Department of Science and Technology, Philippines. Title of research project is “Development of Health Index and Vulnerability Reduction System.
Data Availability Statement
All data are contained in the manuscript.
Acknowledgments
We wish to acknowledge the support “in kind” of Mapua University, Manila Philippines, the Marinduque State College, Boac, Marinduque, Philippines, and the local government units for their cooperation.
Conflicts of Interest
The authors declare no conflict of interest.
Appendix A


Figure A1.
Spatial distribution maps of metal concentrations in soil and vegetables. (a) Soil–Cd; (b) Vegetables–Cd; (c) Soil–Cr; (d) Vegetables–Cd; (e) Soil–Cu; (f) Vegetables–Cu; (g) Soil–Fe; (h) Vegetables–Fe; (i) Soil–Mn; (j) Vegetables–Mn; (k) Soil–Ni; (l) Vegetables–Ni; (m) Soil–Pb; (n) Vegetables–Pb; (o) Soil–Zn; (p) Vegetables–Zn.
References
- Ragragio, E.M.; Belleza, C.P.; Narciso, M.C.; Su, G.L.S. Assessment of Micronucleus Frequency in Exfoliated Buccal Epithelial Cells among Fisher Folks Exposed to Mine Tailings in Marinduque Island, Philippines. Asian Pac. J. Trop. Med. 2010, 3, 315–317. [Google Scholar] [CrossRef]
- Coumans, C. Placer Dome Case Study: Marcopper Mines. 2002. Available online: https://miningwatch.ca/sites/default/files/pd_case_study_marcopper.pdf (accessed on 19 June 2021).
- Agarin, C.J.M.; Mascareñas, D.R.; Nolos, R.; Chan, E.; Senoro, D.B. Transition Metals in Freshwater Crustaceans, Tilapia, and Inland Water: Hazardous to the Population of the Small Island Province. Toxics 2021, 9, 71. [Google Scholar] [CrossRef] [PubMed]
- Plumlee, G.S.; Morton, R.A.; Boyle, T.P.; Medlin, J.H.; Centeno, J.A. An Overview of Mining-Related Environmental and Human Health Issues, Marinduque Island, Philippines: Observations From a Joint U.S. Geological Survey; U.S. Department of the Interior, U.S. Geological Survey: Washington, DC, USA, 2000; pp. 1–46.
- Dold, B. Evolution of Acid Mine Drainage Formation in Sulphidic Mine Tailings. Minerals 2014, 4, 621–641. [Google Scholar] [CrossRef]
- Masindi, V.; Muedi, K.L. Environmental Contamination by Heavy Metals. In Heavy Metals; InTech: London, UK, 2018. [Google Scholar] [CrossRef]
- Marges, M.; Su, G.; Ragragio, E. Assessing Heavy Metals in the Waters and Soils of Calancan Bay, Marinduque Island, Philippines. J. Appl. Sci. Environ. Sanit 2011, 6, 45–49. [Google Scholar]
- Jaishankar, M.; Tseten, T.; Anbalagan, N.; Mathew, B.B.; Beeregowda, K.N. Toxicity, Mechanism and Health Effects of Some Heavy Metals. Interdiscip. Toxicol. 2014, 7, 60–72. [Google Scholar] [CrossRef]
- USEPA. CADDIS Volume 2—Metals; USEPA: Washington, DC, USA, 2021.
- International Agency for Research on Cancer. List of Classifications by Cancer Sites with Sufficient or Limited Evidence in Humans, IARC Monographs Volumes 1–130; WHO: Geneva, Switzerland, 2021. [Google Scholar]
- Senoro, D.B.; Bonifacio, P.B.; Mascareñas, D.R.; Tabelin, C.B.; Ney, F.P.; Lamac, M.R.L.; Tan, F.J. Spatial Distribution of Agricultural Yields with Elevated Metal Concentration of the Island Exposed to Acid Mine Drainage. J. Degrad. Min. Lands Manag. 2021, 8, 2551–2558. [Google Scholar] [CrossRef]
- You, X.; Liu, S.; Dai, C.; Guo, Y.; Zhong, G.; Duan, Y. Contaminant Occurrence and Migration between High- and Low-Permeability Zones in Groundwater Systems: A Review. Sci. Total Environ. 2020, 743, 140703. [Google Scholar] [CrossRef]
- Latif, A.; Bilal, M.; Asghar, W.; Azeem, M.; Ahmad, M.I.; Abbas, A.; Ahmad, M.Z.; Shahzad, T. Heavy Metal Accumulation in Vegetables and Assessment of Their Potential Health Risk. J. Environ. Anal. Chem. 2018, 5, 234. [Google Scholar] [CrossRef]
- Stančić, Z.; Vujević, D.; Gomaz, A.; Bogdan, S.; Vincek, D. Detection of Heavy Metals in Common Vegetables at Varaždin City Market. Arh. Za Hig. Rada I Toksikol. 2016, 67, 340–350. [Google Scholar] [CrossRef]
- Intawongse, M.; Dean, J.R. Uptake of Heavy Metals by Vegetable Plants Grown on Contaminated Soil and Their Bioavailability in the Human Gastrointestinal Tract. Food Addit. Contam. 2006, 23, 36–48. [Google Scholar] [CrossRef]
- Pan, L.; Ma, J.; Hu, Y.; Su, B.; Fang, G.; Wang, Y.; Wang, Z.; Wang, L.; Xiang, B. Assessments of Levels, Potential Ecological Risk, and Human Health Risk of Heavy Metals in the Soils from a Typical County in Shanxi Province, China. Environ. Sci. Pollut. Res. 2016, 23, 19330–19340. [Google Scholar] [CrossRef]
- Jabeen, F.; Aslam, A.; Salman, M. Heavy Metals Toxicity and Associated Health Risks in Vegetables Grown under Soil Irrigated with Sewage Water. Univers. J. Agric. Res. 2018, 6, 173–180. [Google Scholar] [CrossRef][Green Version]
- Adedokun, A.H.; Njoku, K.L.; Akinola, M.O.; Adesuyi, A.A.; Jolaoso, A.O. Potential Human Health Risk Assessment of Heavy Metals Intake via Consumption of Some Leafy Vegetables Obtained from Four Market in Lagos Metropolis, Nigeria. J. Appl. Sci. Environ. Manag. 2016, 20, 530. [Google Scholar] [CrossRef][Green Version]
- Zhou, H.; Yang, W.T.; Zhou, X.; Liu, L.; Gu, J.F.; Wang, W.L.; Zou, J.L.; Tian, T.; Peng, P.Q.; Liao, B.H. Accumulation of Heavy Metals in Vegetable Species Planted in Contaminated Soils and the Health Risk Assessment. Int. J. Environ. Res. Public Health 2016, 13, 289. [Google Scholar] [CrossRef]
- Tchounwou, P.B.; Yedjou, C.G.; Patlolla, A.K.; Sutton, D.J. Heavy Metal Toxicity and the Environment. Mol. Clin. Environ. Toxicol. 2012, 101, 133–164. [Google Scholar] [CrossRef]
- De Jesus, K.L.M.; Senoro, D.B.; Dela Cruz, J.C.; Chan, E.B. A Hybrid Neural Network–Particle Swarm Optimization Informed Spatial Interpolation Technique for Groundwater Quality Mapping in a Small Island Province of the Philippines. Toxics 2021, 9, 273. [Google Scholar] [CrossRef] [PubMed]
- Gigantone, C.B.; Sobremisana, M.J.; Trinidad, L.C.; Migo, V.P. Impact of Abandoned Mining Facility Wastes on the Aquatic Ecosystem of the Mogpog River, Marinduque, Philippines. J. Health Pollut. 2020, 10, 200611. [Google Scholar] [CrossRef]
- Lanot, J.L.; Ann Lawig, J.L.; Lecaros, J.A.; John Malagotnot, P.L.; Labay, P.M.; Samaniego, J.O. Physico-Chemical Properties and Heavy Metal Contents of Ino-Capayang Mine-Made Lake in Marinduque, Philippines. Int. J. Eng. Res. Technol. 2020, 13, 1493–1496. [Google Scholar] [CrossRef]
- Mariano, L.; Ian, B. Health Risk Assessment of Heavy Metals via Ingestion and Dermal Absorption of Water in Mogpog and Boac Rivers. Int. J. Multidiscip. Res. Publ. 2019, 1, 43–50. [Google Scholar]
- Aggangan, N.; Aggangan, B. Selection of Ectomycorrhizal Fungi and Tree Species for Rehabilitation of Cu Mine Tailings in the Philippines. J. Environ. Sci. Manag. 2012, 15, 59–71. [Google Scholar]
- Aggangan, N.; Cadiz, N.; Llamado, A.; Raymundo, A. Enhanced Rhizosphere Bacterial Population in an Abandoned Copper Mined-out Area Planted with Jatropha Interspersed with Selected Indigenous Tree Species. J. Environ. Sci. Manag. 2013, 16, 45–55. [Google Scholar]
- Aggangan, N.; Cadiz, N.; Llamado, A.; Raymundo, A. Jatropha Curcas for Bioenergy and Bioremediation in Mine Tailing Area in Mogpog, Marinduque, Philippines. Energy Procedia 2017, 110, 471–478. [Google Scholar] [CrossRef]
- Borja, K.P.; Luzano, C.R.; Chang, A.; Su, G.; Banez, G.; Agoo, E. Growth and Morphology of the Rhizome and Rhizoid of Pityrogramma Calomelanos (L.) Link (Pteridaceae) at Varying Copper Sulfate Concentrations. ARPN J. Agric. Biol. Sci. 2016, 11, 6. [Google Scholar]
- Cadiz, N.M.; Aggangan Nelly, S.; Pampolina, N.M.; Llamado, A.; Zarate, J.T.; Livelo, S.; Raymundo, A.K. Bioremediation Efforts in an Abandoned Mine Area: The Mogpog, Marinduque Experience. NAST Monogr. Addressing Probl. Solut. Environ. Pollut. Bioremediat. 2012, 18, 33–39. [Google Scholar]
- Fontanilla, C.S.; Cuevas, V.C. Growth of Jatropha Curcas L. Seedlings in Copper-Contaminated Soils Amended with Compost and Trichoderma Pseudokoningii Rifai. Philipp. Agric. Sci. 2010, 93, 384–391. [Google Scholar]
- Lu, Y.; Zhu, F.; Chen, J.; Gan, H.; Guo, Y. Chemical Fractionation of Heavy Metals in Urban Soils of Guangzhou, China. Environ. Monit. Assess. 2007, 134, 429–439. [Google Scholar] [CrossRef] [PubMed]
- Islam, M.; Ahmed, M.; Proshad, R.; Ahmed, S. Assessment of Toxic Metals in Vegetables with the Health Implications in Bangladesh. Adv. Environ. Res. 2017, 6, 241–254. [Google Scholar] [CrossRef]
- Ahmed, S.; Siddique, M.A.; Rahman, M.; Bari, M.L.; Ferdousi, S. A Study on the Prevalence of Heavy Metals, Pesticides, and Microbial Contaminants and Antibiotics Resistance Pathogens in Raw Salad Vegetables Sold in Dhaka, Bangladesh. Heliyon 2019, 5, e01205. [Google Scholar] [CrossRef]
- Quispe, N.; Zanabria, D.; Chavez, E.; Cuadros, F.; Carling, G.; Paredes, B. Health Risk Assessment of Heavy Metals (Hg, Pb, Cd, Cr and As) via Consumption of Vegetables Cultured in Agricultural Sites in Arequipa, Peru. Chem. Data Collect. 2021, 33, 100723. [Google Scholar] [CrossRef]
- Meng, M.; Yang, L.; Wei, B.; Cao, Z.; Yu, J.; Liao, X. Plastic Shed Production Systems: The Migration of Heavy Metals from Soil to Vegetables and Human Health Risk Assessment. Ecotoxicol. Environ. Saf. 2021, 215, 112106. [Google Scholar] [CrossRef]
- Finkel, A.M. Uncertainty in Risk Management: A Guide for Decision Makers; Center for Risk Management, Resources for the Future: Washington, DC, USA, 1990; p. 1616. [Google Scholar]
- Morgan, M.G.; Henrion, M. Uncertainty: A Guide to Dealing with Uncertainty in Quantitative Risk and Policy Analysis; Cambridge University Press: Cambridge, UK, 1990. [Google Scholar]
- Covello, V.T.; Merkhofer, M.W. Risk Assessment Methods: Approaches for Assessing Health and Environmental Risks; Plenum Press: New York, NY, USA, 1993. [Google Scholar]
- Salvacion, A.R. Terrain Characterization of Small Island Using Publicly Available Data and Open- Source Software: A Case Study of Marinduque, Philippines. Model. Earth Syst. Environ. 2016, 2, 31. [Google Scholar] [CrossRef]
- Salvacion, A.R. Mapping Land Limitations for Agricultural Land Use Planning Using Fuzzy Logic Approach: A Case Study for Marinduque Island, Philippines. GeoJournal 2021, 86, 915–925. [Google Scholar] [CrossRef]
- USEPA. EPA Method 3050B: Acid Digestion of Sediments, Sludges; USEPA: Washington, DC, USA, 1996.
- USEPA. USEPA Method 200.3. Methods for the Determination of Metals in Environmental Samples; USEPA: Washington, DC, USA, 1991.
- USEPA. EPA Method 6010C (SW-846): Inductively Coupled Plasma—Atomic Emission Spectrometry; USEPA: Washington, DC, USA, 2000.
- Wang, Z.; Bao, J.; Wang, T.; Moryani, H.T.; Kang, W.; Zheng, J.; Zhan, C.; Xiao, W. Hazardous Heavy Metals Accumulation and Health Risk Assessment of Different Vegetable Species in Contaminated Soils from a Typical Mining City, Central China. Int. J. Environ. Res. Public Health 2021, 18, 2617. [Google Scholar] [CrossRef] [PubMed]
- Semenkov, I.N.; Koroleva, T.V.; Sharapova, A.V.; Terskaya, E.V. Standard Rates of Content of Chemical Elements in the Soil: International Experience and Use for Western Siberia. Geogr. Nat. Resour. 2020, 41, 9–17. [Google Scholar] [CrossRef]
- Zarcinas, B.A.; Ishak, C.F.; McLaughlin, M.J.; Cozens, G. Heavy Metals in Soils and Crops in Southeast Asia. Environ. Geochem. Health 2004, 26, 359–371. [Google Scholar] [CrossRef]
- Håkanson, L.; Jansson, M. Principles of Lake Sedimentology; Springer: Berlin/Heidelberg, Germany, 1983. [Google Scholar]
- USEPA. Guidelines for Exposure Assessment; USEPA: Washington, DC, USA, 1992.
- Philippine Statistics Authority. Per Capita Consumption of Selected Commodities. In Consumption of Selected Agricultural Commodities in the Philippines by Classification of Barangays; Philippine Statistics Authority: Quezon City, Philippine, 2017; Volume 1. [Google Scholar]
- Philippine Statistics Authority. Regional Consumption of Selected Agricultural Commodities by Province and by Classification of Barangays. In Consumption of Selected Agricultural Commodities in the Philippines by Classification of Barangays; Philippine Statistics Authority: Quezon City, Philippine, 2017; Volume 2. [Google Scholar]
- Arora, M.; Kiran, B.; Rani, S.; Rani, A.; Kaur, B.; Mittal, N. Heavy Metal Accumulation in Vegetables Irrigated with Water from Different Sources. Food Chem. 2008, 111, 811–815. [Google Scholar] [CrossRef]
- Harmanescu, M.; Alda, L.M.; Bordean, D.M.; Gogoasa, I.; Gergen, I. Heavy Metals Health Risk Assessment for Population via Consumption of Vegetables Grown in Old Mining Area; a Case Study: Banat County, Romania. Chem. Cent. J. 2011, 5, 64. [Google Scholar] [CrossRef]
- PSA. Philippine Statistics Authority. Available online: https://psa.gov.ph/ (accessed on 30 November 2021).
- USEPA. Exposure Factors Handbook 2011 Edition (Final Report); USEPA: Washington, DC, USA, 2011.
- Salihu, N.; Yau, M.; Babandi, A. Heavy Metals Concentration and Human Health Risk Assessment in Groundwater and Table Water Sold in Tudun Murtala Area, Nassarawa Local Government Area, Kano State, Nigeria. J. Appl. Sci. Environ. Manag. 2019, 23, 1445–1448. [Google Scholar] [CrossRef]
- Storelli, M.M. Potential Human Health Risks from Metals (Hg, Cd, and Pb) and Polychlorinated Biphenyls (PCBs) via Seafood Consumption: Estimation of Target Hazard Quotients (THQs) and Toxic Equivalents (TEQs). Food Chem. Toxicol. 2008, 46, 2782–2788. [Google Scholar] [CrossRef]
- Chen, C.; Qian, Y.; Chen, Q.; Li, C. Assessment of Daily Intake of Toxic Elements Due to Consumption of Vegetables, Fruits, Meat, and Seafood by Inhabitants of Xiamen, China. J. Food Sci. 2011, 76, T181–T188. [Google Scholar] [CrossRef]
- Ezemonye, L.I.; Adebayo, P.O.; Enuneku, A.A.; Tongo, I.; Ogbomida, E. Potential Health Risk Consequences of Heavy Metal Concentrations in Surface Water, Shrimp (Macrobrachium Macrobrachion) and Fish (Brycinus Longipinnis) from Benin River, Nigeria. Toxicol. Rep. 2019, 6, 1–9. [Google Scholar] [CrossRef]
- Mahmood, A.; Malik, R.N. Human Health Risk Assessment of Heavy Metals via Consumption of Contaminated Vegetables Collected from Different Irrigation Sources in Lahore, Pakistan. Arab. J. Chem. 2014, 7, 91–99. [Google Scholar] [CrossRef]
- USEPA. Integrated Risk Information System (IRIS) Glossary; USEPA: Washington, DC, USA, 2021.
- Islam, R.; Kumar, S.; Rahman, A.; Karmoker, J.; Ali, S.; Islam, S.; Saiful Islam, M. Trace Metals Concentration in Vegetables of a Sub-Urban Industrial Area of Bangladesh and Associated Health Risk Assessment. AIMS Environ. Sci. 2018, 5, 130–142. [Google Scholar] [CrossRef]
- Sultana, M.S.; Rana, S.; Yamazaki, S.; Aono, T.; Yoshida, S. Health Risk Assessment for Carcinogenic and Non-Carcinogenic Heavy Metal Exposures from Vegetables and Fruits of Bangladesh. Cogent Environ. Sci. 2017, 3, 1291107. [Google Scholar] [CrossRef]
- Gebeyehu, H.R.; Bayissa, L.D. Levels of Heavy Metals in Soil and Vegetables and Associated Health Risks in Mojo Area, Ethiopia. PLoS ONE 2020, 15, e0227883. [Google Scholar] [CrossRef] [PubMed]
- Kortei, N.K.; Heymann, M.E.; Essuman, E.K.; Kpodo, F.M.; Akonor, P.T.; Lokpo, S.Y.; Boadi, N.O.; Ayim-Akonor, M.; Tettey, C. Health Risk Assessment and Levels of Toxic Metals in Fishes (Oreochromis Noliticus and Clarias Anguillaris) from Ankobrah and Pra Basins: Impact of Illegal Mining Activities on Food Safety. Toxicol. Rep. 2020, 7, 360–369. [Google Scholar] [CrossRef] [PubMed]
- Yuswir, N.S.; Praveena, S.M.; Aris, A.Z.; Syed Ismail, S.N.; de Burbure, C.; Hashim, Z. Heavy Metal Contamination in Urban Surface Soil of Klang District (Malaysia). Soil Sediment Contam. 2015, 24, 865–881. [Google Scholar] [CrossRef]
- Zeng, F.; Wei, W.; Li, M.; Huang, R.; Yang, F.; Duan, Y. Heavy Metal Contamination in Rice-Producing Soils of Hunan Province, China and Potential Health Risks. Int. J. Environ. Res. Public Health 2015, 12, 15584–15593. [Google Scholar] [CrossRef]
- Kamunda, C.; Mathuthu, M.; Madhuku, M. Health Risk Assessment of Heavy Metals in Soils from Witwatersrand Gold Mining Basin, South Africa. Int. J. Environ. Res. Public Health 2016, 13, 663. [Google Scholar] [CrossRef]
- ESRI. GIS Mapping Software, Location Intelligence & Spatial Analytics|Esri. Available online: https://www.esri.com/en-us/home (accessed on 29 November 2021).
- Senoro, D.B.; de Jesus, K.L.M.; Yanuaria, C.A.; Bonifacio, P.B.; Manuel, M.T.; Wang, B.-N.; Kao, C.-C.; Wu, T.-N.; Ney, F.P.; Natal, P. Rapid Site Assessment in a Small Island of the Philippines Contaminated with Mine Tailings Using Ground and Areal Technique: The Environmental Quality after Twenty Years. IOP Conf. Ser. Earth Environ. Sci. 2019, 351, 012022. [Google Scholar] [CrossRef]
- Sanchez, M.S.; Paller, V.G.V.; Flavier, M.E.; Alcantara, A.J.; Rebancos, C.M.; Sanchez, R.D.; Pelegrina Daisy, V. Heavy Metals in Feathers and Soils and Prevalence of Blood Parasites in Free Range Domestic Chicken in Brgy. Ipil-Calancan Bay, Sta. Cruz, Marinduque Island, Philippines. Pollut. Res. 2018, 37, 624–629. [Google Scholar]
- Usman, K.; Al-Ghouti, M.A.; Abu-Dieyeh, M.H. The Assessment of Cadmium, Chromium, Copper, and Nickel Tolerance and Bioaccumulation by Shrub Plant Tetraena Qataranse. Sci. Rep. 2019, 9, 5658. [Google Scholar] [CrossRef]
- Kien, C.N.; Noi, N.V.; Son, L.T.; Ngoc, H.M.; Tanaka, S.; Nishina, T.; Iwasaki, K. Heavy Metal Contamination of Agricultural Soils around a Chromite Mine in Vietnam. Soil Sci. Plant Nutr. 2010, 56, 344–356. [Google Scholar] [CrossRef]
- Ismail, S.N.S.; Abidin, E.Z.; Praveena, S.M.; Rasdi, I.; Mohamad, S.; Ismail, W.M.I.W. Heavy Metals in Soil of the Tropical Climate Bauxite Mining Area in Malaysia. J. Phys. Sci. 2018, 29, 7–14. [Google Scholar] [CrossRef]
- Prematuri, R.; Turjaman, M.; Sato, T.; Tawaraya, K. The Impact of Nickel Mining on Soil Properties and Growth of Two Fast-Growing Tropical Trees Species. Int. J. For. Res. 2020, 2020, 8837590. [Google Scholar] [CrossRef]
- American Geosciences Institute. Available online: https://www.americangeosciences.org/critical-issues/faq/how-can-metal-mining-impact-environment (accessed on 6 September 2021).
- Simón, M.; Martın, F.; Ortiz, I.; Garcıa, I.; Fernández, J.; Fernández, E.; Aguilar, J. Soil Pollution by Oxidation of Tailings from Toxic Spill of a Pyrite Mine. Sci. Total Environ. 2001, 279, 63–74. [Google Scholar] [CrossRef]
- Chen, S.B.; Wang, M.; Li, S.S.; Zhao, Z.Q.; di Wen, E. Overview on Current Criteria for Heavy Metals and Its Hint for the Revision of Soil Environmental Quality Standards in China. J. Integr. Agric. 2018, 17, 765–774. [Google Scholar] [CrossRef]
- Chai, L.; Wang, Y.; Wang, X.; Ma, L.; Cheng, Z.; Su, L. Pollution Characteristics, Spatial Distributions, and Source Apportionment of Heavy Metals in Cultivated Soil in Lanzhou, China. Ecol. Indic. 2021, 125, 107507. [Google Scholar] [CrossRef]
- Chibuike, G.U.; Obiora, S.C. Heavy Metal Polluted Soils: Effect on Plants and Bioremediation Methods. Appl. Environ. Soil Sci. 2014, 2014, 752708. [Google Scholar] [CrossRef]
- Xie, Y.; Fan, J.; Zhu, W.; Amombo, E.; Lou, Y.; Chen, L.; Fu, J. Effect of Heavy Metals Pollution on Soil Microbial Diversity and Bermudagrass Genetic Variation. Front. Plant Sci. 2016, 7, 755. [Google Scholar] [CrossRef]
- Ali, H.; Khan, E.; Ilahi, I. Environmental Chemistry and Ecotoxicology of Hazardous Heavy Metals: Environmental Persistence, Toxicity, and Bioaccumulation. J. Chem. 2019, 2019, 6730305. [Google Scholar] [CrossRef]
- International Food Standards. Joint FAO/WHO Food Standards Programme Codex Committee on Contaminants in Foods. 2019. Available online: https://www.fao.org/fao-who-codexalimentarius/codex-texts/list-standards/de/ (accessed on 10 July 2021).
- Robson, M. Methodologies for Assessing Exposures to Metals: Human Host Factors. Ecotoxicol. Environ. Saf. 2003, 56, 104–109. [Google Scholar] [CrossRef]
- Mohammadi, A.A.; Zarei, A.; Majidi, S.; Ghaderpoury, A.; Hashempour, Y.; Saghi, M.H.; Alinejad, A.; Yousefi, M.; Hosseingholizadeh, N.; Ghaderpoori, M. Carcinogenic and Non-Carcinogenic Health Risk Assessment of Heavy Metals in Drinking Water of Khorramabad, Iran. MethodsX 2019, 6, 1642–1651. [Google Scholar] [CrossRef] [PubMed]
- Yang, J.; Ma, S.; Zhou, J.; Song, Y.; Li, F. Heavy Metal Contamination in Soils and Vegetables and Health Risk Assessment of Inhabitants in Daye, China. J. Int. Med. Res. 2018, 46, 3374–3387. [Google Scholar] [CrossRef] [PubMed]
- Luo, C.; Liu, C.; Wang, Y.; Liu, X.; Li, F.; Zhang, G.; Li, X. Heavy Metal Contamination in Soils and Vegetables near an E-Waste Processing Site, South China. J. Hazard. Mater. 2011, 186, 481–490. [Google Scholar] [CrossRef] [PubMed]
- Antoine, J.M.R.; Fung, L.A.H.; Grant, C.N. Assessment of the Potential Health Risks Associated with the Aluminium, Arsenic, Cadmium and Lead Content in Selected Fruits and Vegetables Grown in Jamaica. Toxicol. Rep. 2017, 4, 181–187. [Google Scholar] [CrossRef] [PubMed]
- Bempah, K.C.; Ewusi, A. Heavy Metals Contamination and Human Health Risk Assessment around Obuasi Gold Mine in Ghana. Environ. Monit. Assess. 2016, 188, 261. [Google Scholar] [CrossRef]
- Wu, Q.; Hu, W.; Wang, H.; Liu, P.; Wang, X.; Huang, B. Spatial Distribution, Ecological Risk and Sources of Heavy Metals in Soils from a Typical Economic Development Area, Southeastern China. Sci. Total Environ. 2021, 780, 146557. [Google Scholar] [CrossRef]
Publisher’s Note: MDPI stays neutral with regard to jurisdictional claims in published maps and institutional affiliations. |
© 2022 by the authors. Licensee MDPI, Basel, Switzerland. This article is an open access article distributed under the terms and conditions of the Creative Commons Attribution (CC BY) license (https://creativecommons.org/licenses/by/4.0/).