
Drivers’ Decelerating Behaviors in Expressway Accident Segments under Different Speed Limit Schemes


Abstract
1. Introduction
2. Literature Review
2.1. Safety Management in Expressway Accident Segments
2.2. Speed Limits in Expressway Accident Segments
2.3. Drivers’ Decelerating Behaviors on Expressways
3. Methodology
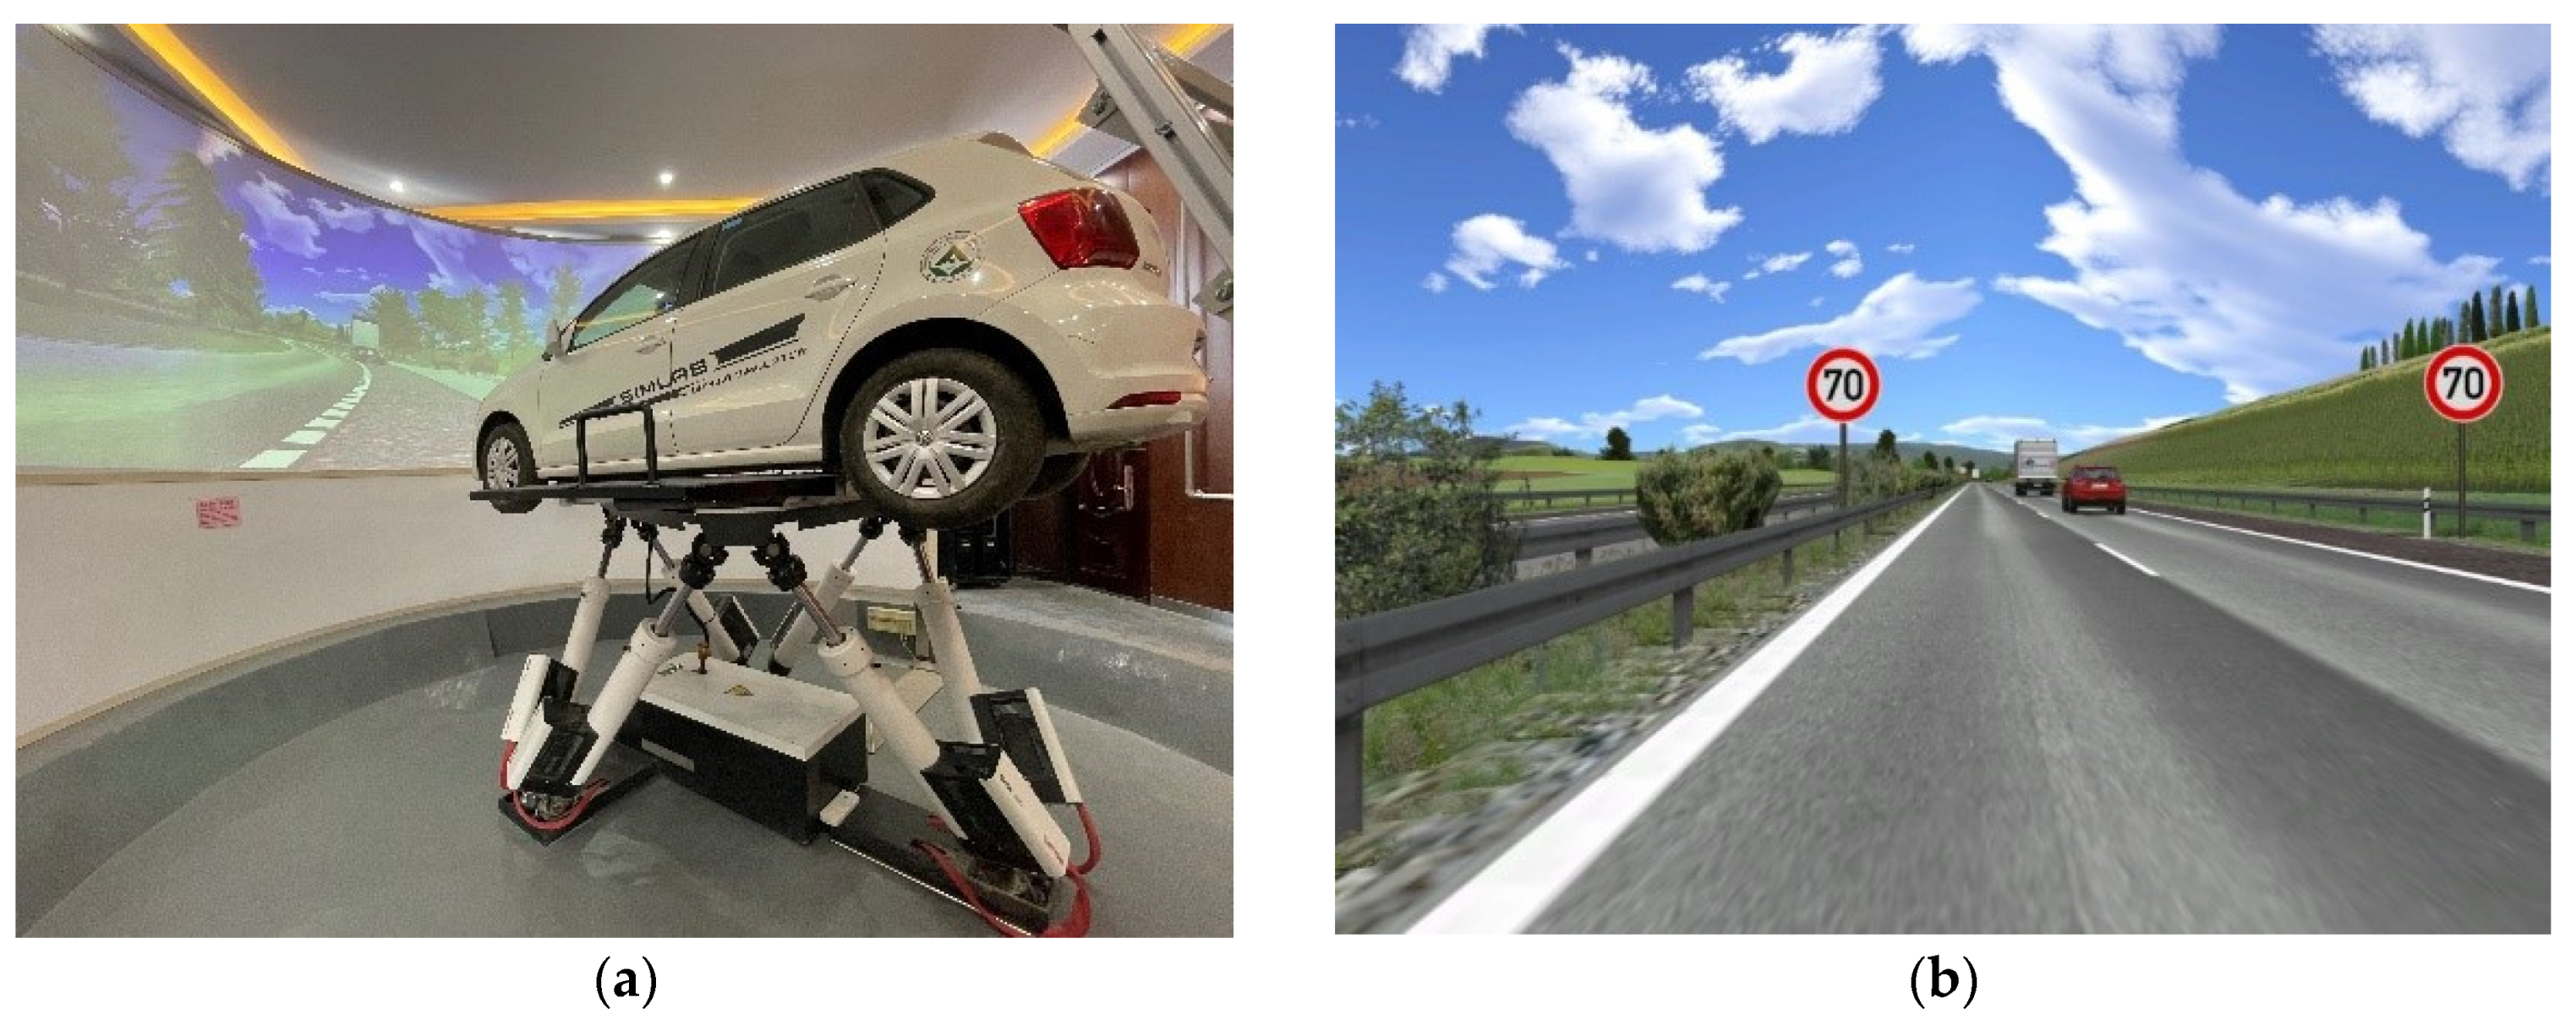
3.1. Apparatus
3.2. Scenario
3.3. Subjects
3.4. Experimental Procedure
- The subjects were asked to fill out a questionnaire about age, driver’s license validity and driving mileage after arriving at the driving simulation laboratory;
- A member of the research team introduced the driving simulator and the driving tasks to be completed by the subjects;
- The researchers guided the subjects in performing exercises before the experiments and ensured that they were familiar with the simulated environment and vehicle control. The experiments had to be stopped if the subjects were found to feel unwell during the experiments;
- The subjects were asked to formally carry out the driving tasks. The data were stored and named after the experiments.
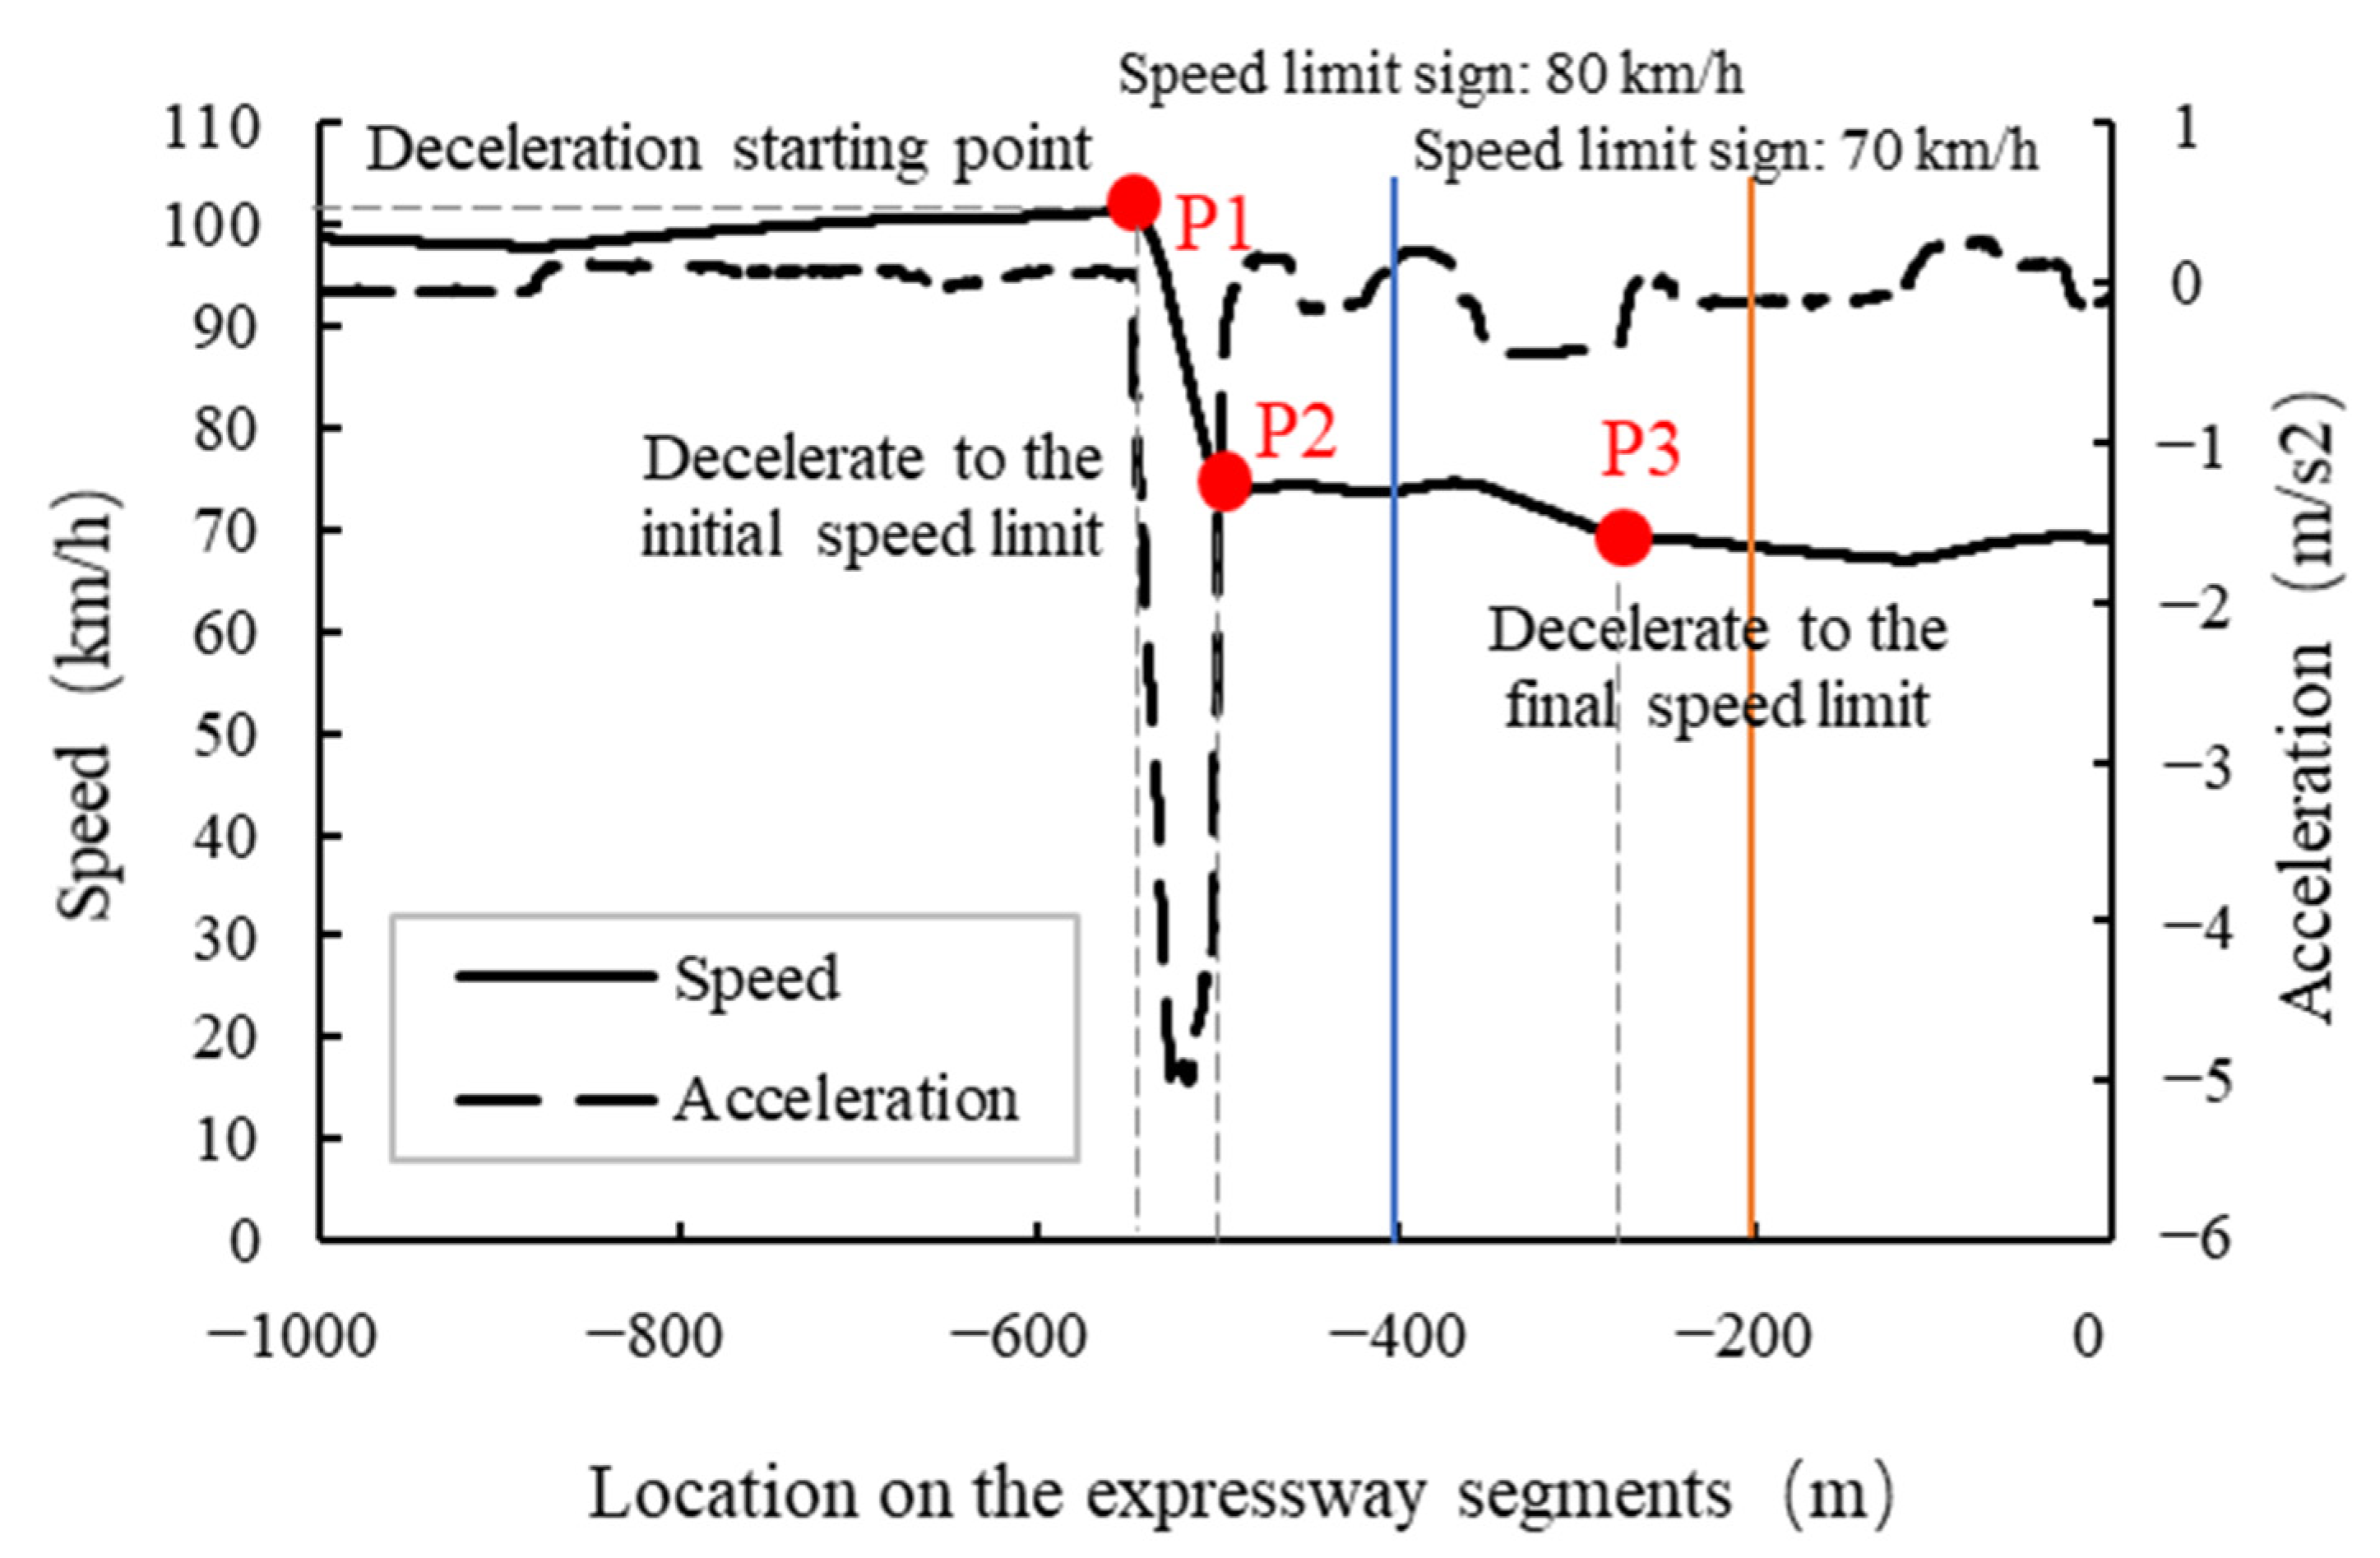
3.5. Decelerating Parameters
- Speed at the deceleration starting point (vDS) (km/h): the speed corresponding to the deceleration starting point;
- Location of the deceleration starting point (lD1) (m): The difference between the location coordinate of the first speed limit sign and the location coordinate corresponding to the deceleration starting point. For example, −400 minus the abscissa corresponding to point P1, which is generally a positive value;
- Location of decelerating to the initial speed limit (lD2) (m): the difference between the location coordinate of the first speed limit sign and the location coordinate of decelerating to the initial speed limit;
- Location of decelerating to the final speed limit (lD3) (m): The difference between the location coordinate of the last speed limit sign and the location coordinate of decelerating to the final speed limit. For example, −200 minus the abscissa corresponding to point P3;
- Average deceleration () (m/s2): The average deceleration from the deceleration starting point to the final speed limit. For example, the average value of deceleration during the process from point P1 to point P3.
4. Results
4.1. Speed Distribution of the Upstream and Downstream of the Accident Segments
- Figure 5a showed that the drivers remained at a basically stable speed in the range of 80 km/h to 120 km/h at 500 m away from the accident segment when there was no speed limit sign. When driving to the location in the range of 200 m to 500 m away from the accident segment, they had varying degrees of decelerating behaviors;
- From Figure 5b–d, the drivers’ speeds remained stable before seeing the speed limit signs. A total of 90% of drivers maintained speeds in the range of 90 km/h to 120 km/h. There were certain differences in drivers’ speed from the time they saw the speed limit signs to the time they started to decelerate;
- The settings of the speed limit sign in different scenarios had significant impacts on drivers’ speed control. From Scenario 2 to Scenario 4, the speed profile of the drivers gradually flattened out. It could be seen that, as the speed limit signs increased, the drivers would decelerate gently in advance;
- From Figure 5b–d, the drivers’ decelerating behaviors were earlier when there were more speed limit signs.
4.2. Speed at the Deceleration Starting Point
4.3. Location of the Deceleration Starting Point
4.4. Deceleration
4.5. Location of Decelerating to the Initial Speed Limit
4.5.1. Drivers’ Compliance with the Speed Limits
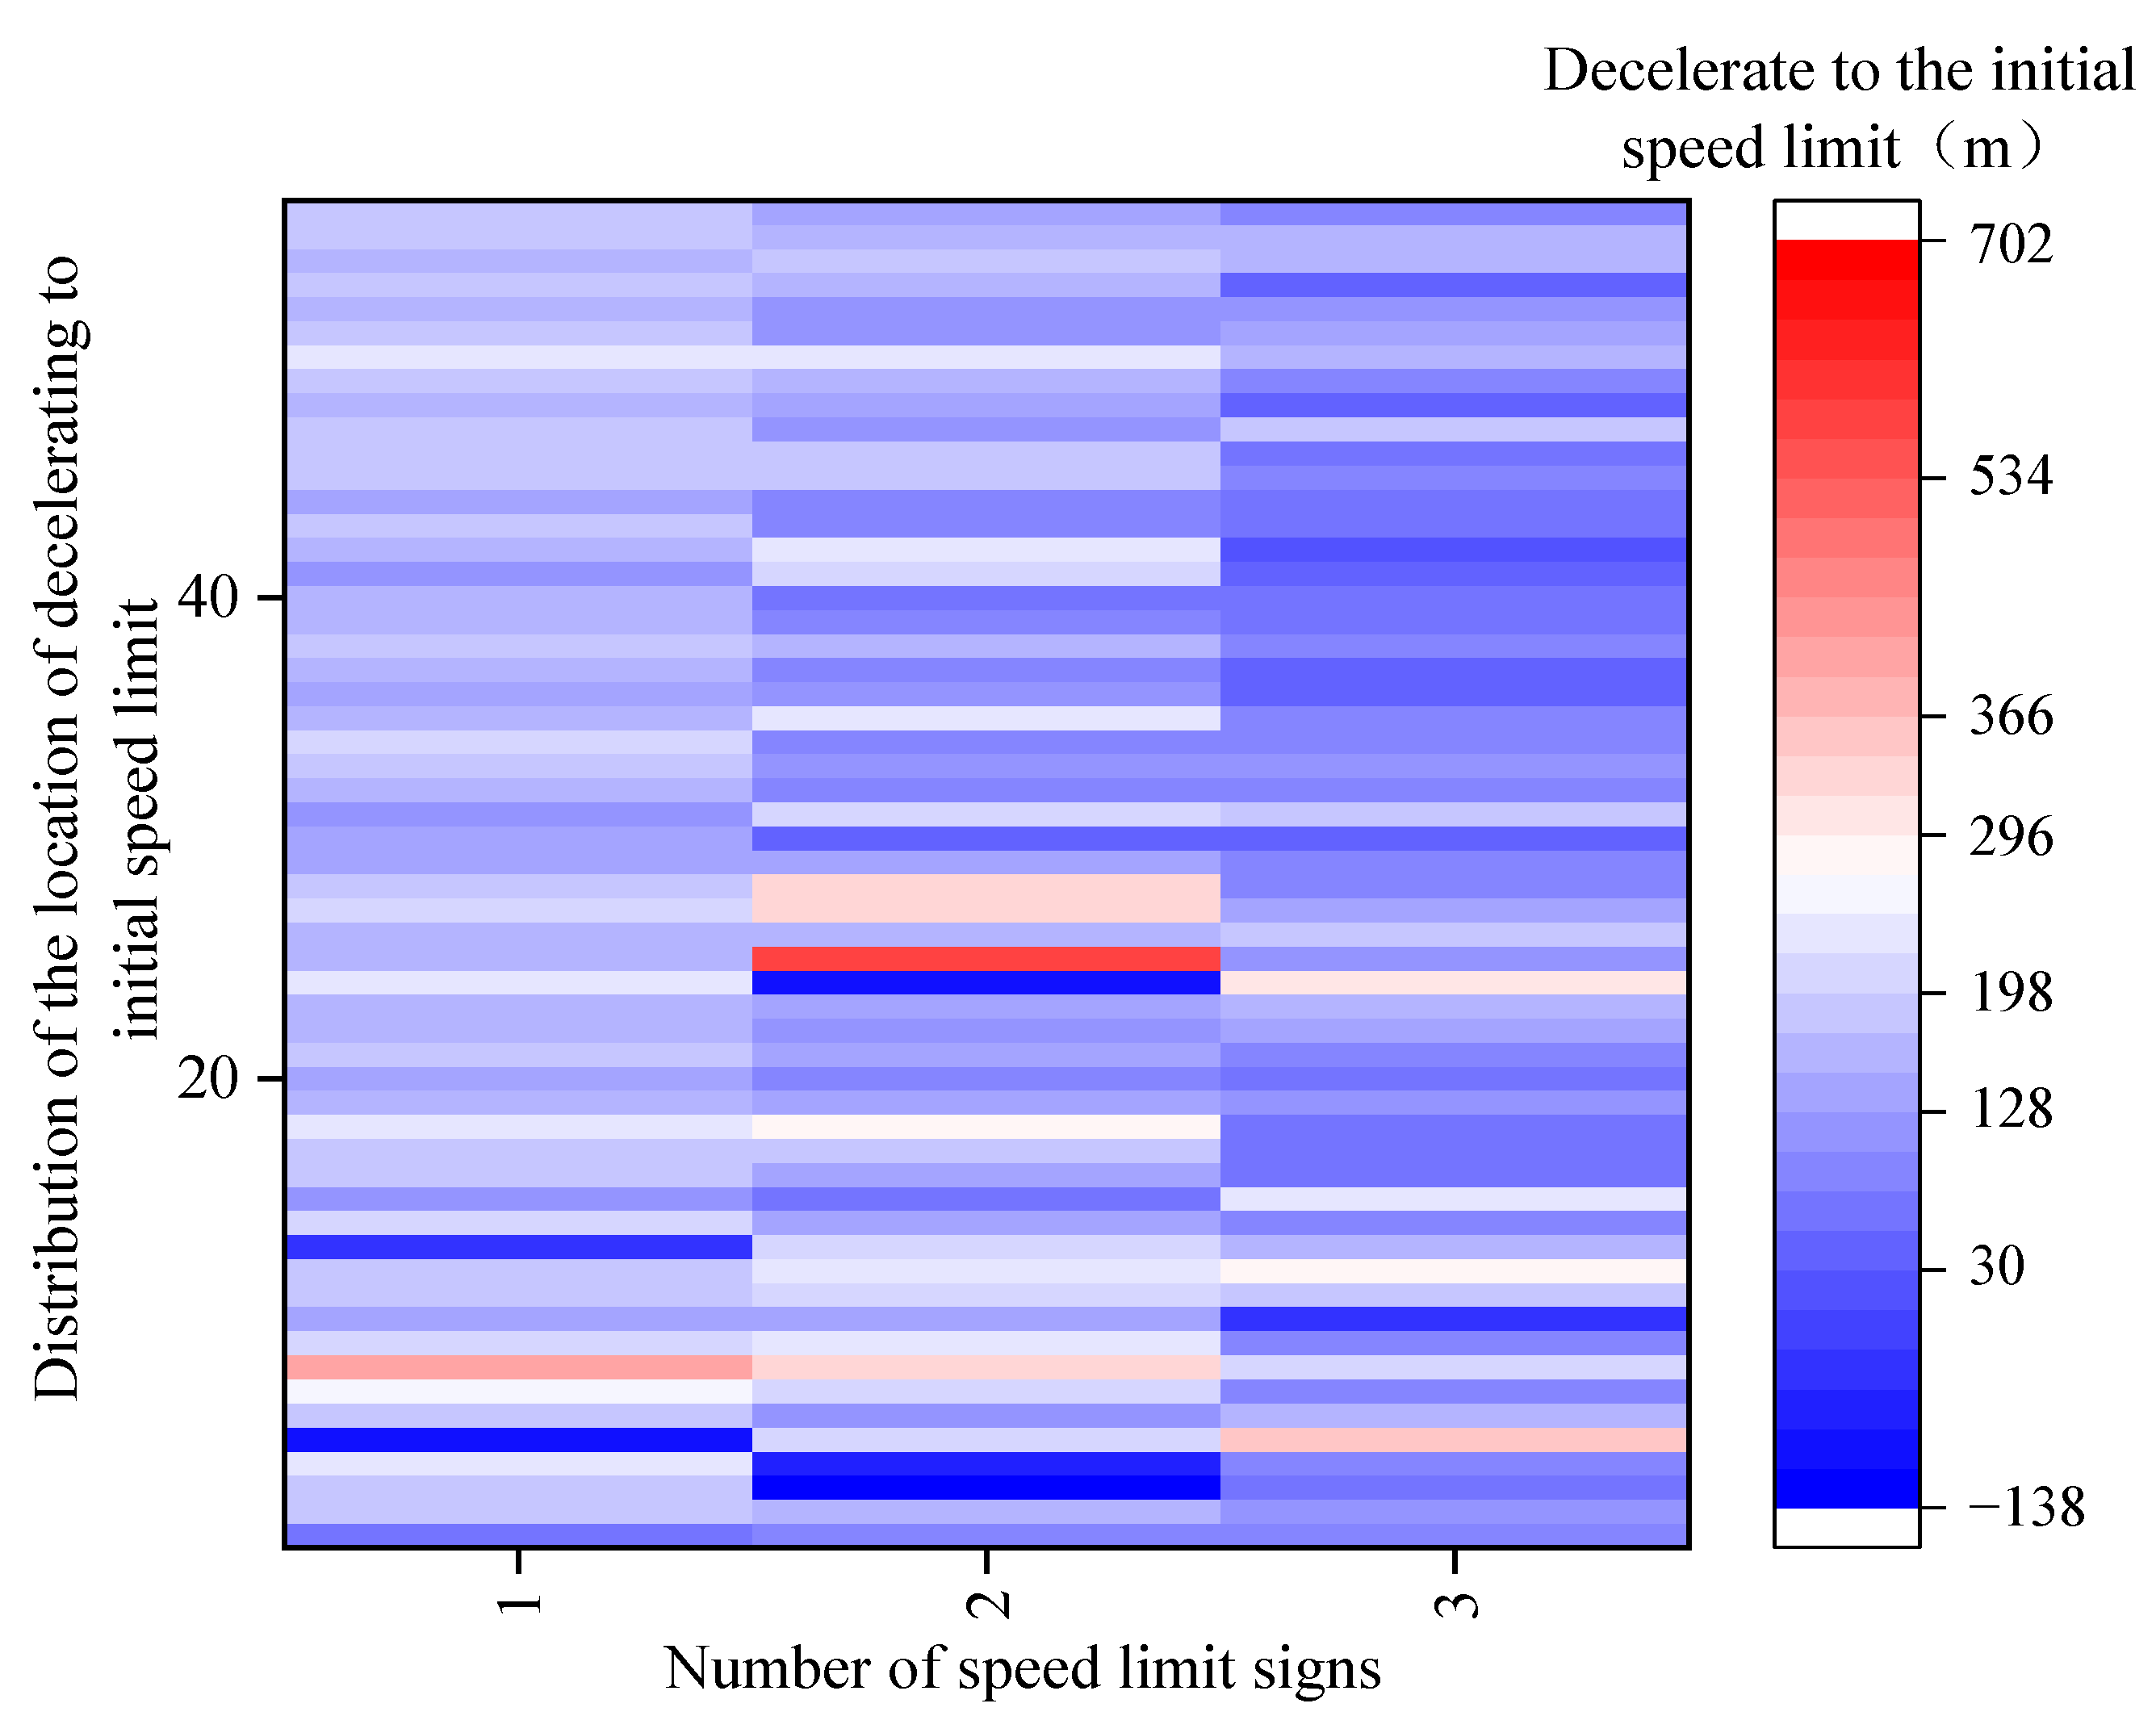
4.5.2. Drivers’ Location when Decelerating to the Initial Speed Limit
4.6. Location of Decelerating to the Final Speed Limit
5. Discussion
5.1. Analysis of Speed Limit Schemes
5.2. Analysis of Decelerating Behavior
6. Conclusions
- Installation of step by step speed limit signs in expressway accident segments. Speed limit signs of 60 km/h, 70 km/h and 80 km/h can be, respectively, placed 200 m, 400 m and 600 m in front of the accident segments to ensure that drivers can decelerate in time according to the speed limit values before approaching the accident segments, which also plays a warning role. The probability of secondary accidents can be decreased and drivers’ safety can be improved;
- Management of driving behaviors in expressway accident segments. When there is no speed limit sign, drivers are advised to decelerate 200–500 m in front of the accident segments. When there are speed limit signs, drivers are advised to decelerate when seeing the signs. However, experienced drivers should be advised to decelerate 100–200 m earlier than novice drivers. To ensure a smooth decelerating process, drivers’ average deceleration should not be higher than 1 m/s2 and drivers’ speed should preferably be kept at 90 km/h before decelerating;
- Training of the driver’s operation. Drivers can be recruited to carry out simulated operation using a driving simulator. It is possible to check if the parameters of the driving behavior are within safety limits and the operation is standardized. If so, the drivers’ operation is proven to be safe, otherwise the drivers’ operation needs to be corrected and trained until it is up to the safety standard.
Author Contributions
Funding
Institutional Review Board Statement
Informed Consent Statement
Data Availability Statement
Conflicts of Interest
References
- National Bureau of Statistics of China. China Statistical Yearbook; China Statistics Press: Beijing, China, 2021; Volume 24, p. 5.
- Owens, N.; Armstrong, A.; Sullivan, P. Traffic Incident Management Handbook; Federal Highway Administration: Washington, DC, USA, 2010.
- What Are the Reasons for “Secondary Accidents Occurring Frequently” on Expressways? What Can be Done to Avoid Them? Available online: https://www.toutiao.com/i6961071553387758112/ (accessed on 12 May 2021).
- Gowat, R.C.; Gabauer, D.J. Secondary collisions revisited: Real-world crash data and relationship to crash test criteria. Traffic Inj. Prev. 2013, 14, 46–55. [Google Scholar] [CrossRef] [PubMed]
- Zovak, G.; Kos, G.; Huzjan, B. The Driver Behaviour and Impact of Speed on Road Safety on the Motorways in Croatia. Promet-Zagreb 2017, 29, 155–164. [Google Scholar] [CrossRef]
- Codur, M.Y.; Kaplan, N.H. Increasing the visibility of traffic signs in foggy weather. Fresen. Environ. Bull. 2019, 28, 705–709. [Google Scholar]
- Rosey, F.; Aillerie, I.; Espie, S.; Vienne, F. Driver behaviour in fog is not only a question of degraded visibility—A simulator study. Saf. Sci. 2017, 95, 50–61. [Google Scholar] [CrossRef]
- Chang, X.; Li, H.J.; Qin, L.Q.; Rong, J.; Lu, Y.; Chen, X.X. Evaluation of cooperative systems on driver behavior in heavy fog condition based on a driving simulator. Accid. Anal. Prev. 2019, 128, 197–205. [Google Scholar] [CrossRef] [PubMed]
- Shangguan, Q.Q.; Fu, T.; Liu, S. Investigating rear-end collision avoidance behavior under varied foggy weather conditions: A study using advanced driving simulator and survival analysis. Accid. Anal. Prev. 2020, 139, 105499. [Google Scholar] [CrossRef] [PubMed]
- Mamcic, S.; Sivilevicius, H. The analysis of traffic accidents on Lithuanin regional gravel roads. Transport 2013, 28, 108–115. [Google Scholar] [CrossRef]
- Rifaat, S.M.; Chin, H.C. Accident severity analysis using ordered probit model. J. Adv. Trans. 2007, 41, 91–114. [Google Scholar] [CrossRef]
- De Oliveira, R.P.; Achcar, J.A. Victims of road accidents with serious injuries and dependence on some individual, climatic and infrastructure factors on federal highways in Brazil. Int. J. Inj. Control Saf. 2020, 27, 355–361. [Google Scholar] [CrossRef]
- Omidi, L.; Mousavi, S.; Moradi, G.; Taheri, F. Traffic climate, driver behaviour and dangerous driving among taxi drivers. Int. J. Occup. Saf. Ergon. 2021; in press. [Google Scholar] [CrossRef]
- In-Depth Analysis of Driver Behavior and Training and Testing Countermeasures Based on Accident Data. Available online: https://new.qq.com/omn/20200706/20200706A0D6RZ00.html (accessed on 6 July 2020).
- Ge, Y.; Zhang, Q.; Zhao, W.G.; Zhang, K.; Qu, W.N. Effects of trait anger, driving anger, and driving experience on dangerous driving behavior: A moderated mediation analysis. Aggress. Behav. 2017, 43, 544–552. [Google Scholar] [CrossRef] [PubMed]
- Yun, M.P.; Zhao, J.; Zhao, J.Z.; Weng, X.Y.; Yang, X.G. Impact of in-vehicle navigation information on lane-change behavior in urban expressway diverge segments. Accid. Anal. Prev. 2017, 106, 53–66. [Google Scholar] [CrossRef] [PubMed]
- Kopitch, L.; Saphores, J.-D.M. Assessing effectiveness of changeable message signs on secondary crashes. In Proceedings of the Transportation Research Board 90th Annual Meeting, Washington, DC, USA, 23–27 January 2011. [Google Scholar]
- Lee, C.; Abdel-Aty, M. Testing Effects of Warning Messages and Variable Speed Limits on Driver Behavior Using Driving Simulator. Transp. Res. Rec. 2008, 2069, 55–64. [Google Scholar] [CrossRef]
- Gaweesh, S.M.; Bakhshi, A.K.; Ahmed, M.M. Safety Performance Assessment of Connected Vehicles in Mitigating the Risk of Secondary Crashes: A Driving Simulator Study. Transp. Res. Rec. 2021, 2675, 117–129. [Google Scholar] [CrossRef]
- Mishra, K.N. A novel integration of smart vehicles and secure clouds for supervising vehicle accidents on roads/highways. Sadhana-Acad. P Eng. S. 2020, 45, 88. [Google Scholar] [CrossRef]
- Sarker, A.A.; Paleti, R.; Mishra, S.; Golias, M.M.; Freeze, P.B. Prediction of secondary crash frequency on highway networks. Accid. Anal. Prev. 2017, 98, 108–117. [Google Scholar] [CrossRef] [PubMed]
- Xu, C.C.; Liu, P.; Yang, B.; Wang, W. Real-time estimation of secondary crash likelihood on freeways using high-resolution loop detector data. Transp. Res. Part C Emerg. Technol. 2016, 71, 406–418. [Google Scholar] [CrossRef]
- Almoshaogeh, M.; Abdulrehman, R.; Haider, H.; Alharbi, F.; Jamal, A.; Alarifi, S.; Shafiquzzaman, M. Traffic Accident Risk Assessment Framework for Qassim, Saudi Arabia: Evaluating the Impact of Speed Cameras. Appl. Sci. 2021, 11, 6682. [Google Scholar] [CrossRef]
- Li, Z.; Li, Y.; Liu, P.; Wang, W.; Xu, C.C. Development of a variable speed limit strategy to reduce secondary collision risks during inclement weathers. Accid. Anal. Prev. 2014, 72, 134–145. [Google Scholar] [CrossRef]
- Peng, C.; Xu, C.C. Combined variable speed limit and lane change guidance for secondary crash prevention using distributed deep reinforcement learning. J. Transp. Saf. Secur. 2021; in press. [Google Scholar] [CrossRef]
- Chen, D.J.; Ahn, S. Variable speed limit control for severe non-recurrent freeway bottlenecks. Transp. Res. Part C Emerg. Technol. 2015, 51, 210–230. [Google Scholar] [CrossRef]
- Wu, Y.N.; Abdel-Aty, M.; Wang, L.; Rahman, M.S. Combined connected vehicles and variable speed limit strategies to reduce rear-end crash risk under fog conditions. J. Intell. Transp. Syst. 2020, 24, 494–513. [Google Scholar] [CrossRef]
- Xu, C.C.; Li, Z.B.; Pu, Z.Y.; Guo, Y.Y.; Liu, P. Procedure for Determining the Deployment Locations of Variable Speed Limit Signs to Reduce Crash Risks at Freeway Recurrent Bottlenecks. IEEE Access 2019, 7, 47856–47863. [Google Scholar] [CrossRef]
- Cheng, G.Z.; Cheng, R. Optimizing Speed Limits Upstream of Freeway Reconstruction and Expansion Work Zones Based on Driver Characteristics. J. Transp. Eng. A-Syst. 2020, 146, 04020066. [Google Scholar] [CrossRef]
- Finley, M.D.; Jenkins, J.; Mcavoy, D.S. Motorists’ Speed Response to Non-variable and Variable Work Zone Speed Limits and Other Work Zone Conditions. Transp. Res. Rec. 2015, 2485, 70–77. [Google Scholar] [CrossRef]
- Domenichini, L.; La Torre, F.; Branzi, V.; Nocentini, A. Speed behaviour in work zone crossovers. A driving simulator study. Accid. Anal. Prev. 2017, 98, 10–24. [Google Scholar] [CrossRef]
- Varotto, S.F.; Jansen, R.J.; Bijleveld, F.; van Nes, N. Adaptations in driver deceleration behaviour with automatic incident detection: A naturalistic driving study. Transp. Res. Part F Traffic Psychol. Behav. 2021, 78, 164–179. [Google Scholar] [CrossRef]
- Lyu, N.C.; Cao, Y.; Wu, C.Z.; Xu, J.; Xie, L. The effect of gender, occupation and experience on behavior while driving on a freeway deceleration lane based on field operational test data. Accid. Anal. Prev. 2018, 121, 82–93. [Google Scholar] [CrossRef]
- Lyu, N.C.; Wang, Y.G.; Wu, C.Z.; Wu, H.R.; Wen, J.Q. Exploring longitudinal driving behaviour on a freeway deceleration lane using field operational test data. IET Intell. Transp. Syst. 2021, 15, 1401–1413. [Google Scholar] [CrossRef]
- State Council of the People’s Republic of China. Regulation on the Implementation of the Road Traffic Safety Law of the People’s Republic of China; China Democratic Legal System Press: Beijing, China, 2004.
- Road Bureau of Ministry of Transport. Technical Standard of Highway Engineering JTG B01-2014; China Communications Press: Beijing, China, 2014.
- Lerman, J. Study design in clinical research: Sample size estimation and power analysis. Can. J. Anesth. 1996, 43, 184–191. [Google Scholar] [CrossRef]
- Chow, S.C.; Shao, J.; Wang, H. Sample Size Calculations in Clinical Research; CRC Press: Boca Raton, FL, USA, 2017. [Google Scholar]
- Filtness, A.J.; Larue, G.; Schramm, A.; Fuller, J.; Rakotonirainy, A.; Han, C.; Cairney, P. Safety implications of co-locating road signs: A driving simulator investigation. Transp. Res. Part F Traffic Psychol. Behav. 2017, 47, 187–198. [Google Scholar] [CrossRef]
- Yang, Z.; Yu, Q.Y.; Zhang, W.H.; Shen, H.X. A comparison of experienced and novice drivers’ rear-end collision avoidance maneuvers under urgent decelerating events. Transp. Res. Part F Traffic Psychol. Behav. 2021, 76, 353–368. [Google Scholar] [CrossRef]


| Driver Type | Novice | Experienced | Total |
|---|---|---|---|
| Male | 21 | 24 | 45 |
| Female | 7 | 4 | 11 |
| Total | 28 | 28 | 56 |
| Data Classification | Decelerating Parameters |
|---|---|
| Speed (km/h) | Driving speed before accident area; speed at the deceleration starting point; |
| Acceleration (m/s2) | Acceleration in the decelerating process |
| Vehicle trajectory (m) | Location of the deceleration starting point; location of decelerating to the initial speed limit; location of decelerating to the final speed limit |
| Variables | Class III Sum of Squares | df | Square of the Mean | F | Significance |
|---|---|---|---|---|---|
| E | 87.414 | 1 | 87.414 | 1.200 | 0.275 |
| L | 1271.753 | 2 | 635.877 | 8.731 | 0.000 |
| E*L | 323.605 | 2 | 161.802 | 2.222 | 0.112 |
| Scenarios | Scenarios | Average Difference | Standard Error | Significance | 95% Confidence Interval of Difference | |
|---|---|---|---|---|---|---|
| Lower Limit | Upper Limit | |||||
| L3 | L4 | 2.704 | 1.642 | 0.102 | −0.540 | 5.948 |
| L2 | −4.111 * | 1.642 | 0.013 | −7.355 | −0.867 | |
| L4 | L3 | −2.704 | 1.642 | 0.102 | −5.948 | 0.540 |
| L2 | −6.815 * | 1.642 | 0.000 | −10.059 | −3.571 | |
| L2 | L3 | 4.111 * | 1.642 | 0.013 | 0.867 | 7.355 |
| L4 | 6.815 * | 1.642 | 0.000 | 3.571 | 10.059 | |
| Variables | Class III Sum of Squares | df | Square of the Mean | F | Significance |
|---|---|---|---|---|---|
| E | 1,278,736.006 | 1 | 1,278,736.006 | 35.737 | 0.000 |
| L | 498,118.583 | 2 | 249,059.292 | 6.960 | 0.001 |
| E*L | 27,793.655 | 2 | 13,896.827 | 0.388 | 0.679 |
| Scenarios | Scenarios | Average Difference | Standard Error | Significance | 95% Confidence Interval of Difference | |
|---|---|---|---|---|---|---|
| Lower Limit | Upper Limit | |||||
| L3 | L4 | −96.429 * | 35.748 | 0.008 | −167.021 | −25.836 |
| L2 | −128.018 * | 35.748 | 0.000 | −198.610 | −57.426 | |
| L4 | L3 | 96.429 * | 35.748 | 0.008 | 25.836 | 167.021 |
| L2 | −31.589 | 35.748 | 0.378 | −102.182 | 39.003 | |
| L2 | L3 | 128.018 * | 35.748 | 0.000 | 57.426 | 198.610 |
| L4 | 31.589 | 35.748 | 0.378 | −39.003 | 102.182 | |
| Variables | Class III Sum of Squares | df | Square of the Mean | F | Significance |
|---|---|---|---|---|---|
| E | 4.901 | 1 | 4.901 | 4.786 | 0.030 |
| L | 43.289 | 2 | 21.644 | 21.136 | 0.000 |
| E*L | 9.050 | 2 | 4.525 | 4.419 | 0.014 |
| Scenarios | Scenarios | Average Difference | Standard Error | Significance | 95% Confidence Interval of Difference | |
|---|---|---|---|---|---|---|
| Lower Limit | Upper Limit | |||||
| L3 | L4 | −0.486 * | 0.191 | 0.012 | −0.864 | −0.108 |
| L2 | 0.748 * | 0.191 | 0.000 | 0.370 | 1.126 | |
| L4 | L3 | 0.486 * | 0.191 | 0.012 | 0.108 | 0.864 |
| L2 | 1.234 * | 0.191 | 0.000 | 0.857 | 1.612 | |
| L2 | L3 | −0.748 * | 0.191 | 0.000 | −1.126 | −0.370 |
| L4 | −1.234 * | 0.191 | 0.000 | −1.612 | −0.857 | |
| Driver Type | L2 | L3 | L4 | |||
|---|---|---|---|---|---|---|
| Compliance | Noncompliance | Compliance | Noncompliance | Compliance | Noncompliance | |
| N1 | 54 | 1 | 53 | 3 | 55 | 1 |
| E1 | 56 | 1 | 56 | 0 | 56 | 0 |
| total | 110 | 2 | 109 | 3 | 111 | 1 |
| Variables | Class III Sum of Squares | df | Square of the Mean | F | Significance |
|---|---|---|---|---|---|
| E | 26,373.389 | 1 | 26,373.389 | 5.127 | 0.025 |
| L | 129,409.864 | 2 | 64,704.932 | 12.579 | 0.000 |
| E*L | 1765.444 | 2 | 882.722 | 0.172 | 0.842 |
| Scenarios | Scenarios | Average Difference | Standard Error | Significance | 95% Confidence Interval of Difference | |
|---|---|---|---|---|---|---|
| Lower Limit | Upper Limit | |||||
| L3 | L4 | 39.018 * | 15.144 | 0.011 | 9.113 | 68.922 |
| L2 | −13.018 | 15.144 | 0.391 | −42.922 | 16.887 | |
| L4 | L3 | −39.018 * | 15.144 | 0.011 | −68.922 | −9.113 |
| L2 | −52.036 * | 15.144 | 0.001 | −81.940 | −22.131 | |
| L2 | L3 | 13.018 | 15.144 | 0.391 | −16.887 | 42.922 |
| L4 | 52.036 * | 15.144 | 0.001 | 22.131 | 81.940 | |
| Variables | Class III Sum of Squares | df | Square of the Mean | F | Significance |
|---|---|---|---|---|---|
| E | 394,368.893 | 1 | 394,368.893 | 25.508 | 0.000 |
| L | 94,889.286 | 1 | 94,889.286 | 6.138 | 0.015 |
| E*L | 6851.571 | 1 | 6851.571 | 0.443 | 0.507 |
Publisher’s Note: MDPI stays neutral with regard to jurisdictional claims in published maps and institutional affiliations. |
© 2022 by the authors. Licensee MDPI, Basel, Switzerland. This article is an open access article distributed under the terms and conditions of the Creative Commons Attribution (CC BY) license (https://creativecommons.org/licenses/by/4.0/).
Share and Cite
Zhang, W.; Yi, J.; Zhou, G.; Liu, T. Drivers’ Decelerating Behaviors in Expressway Accident Segments under Different Speed Limit Schemes. Int. J. Environ. Res. Public Health 2022, 19, 1590. https://doi.org/10.3390/ijerph19031590
Zhang W, Yi J, Zhou G, Liu T. Drivers’ Decelerating Behaviors in Expressway Accident Segments under Different Speed Limit Schemes. International Journal of Environmental Research and Public Health. 2022; 19(3):1590. https://doi.org/10.3390/ijerph19031590
Chicago/Turabian StyleZhang, Wenhui, Jing Yi, Ge Zhou, and Tuo Liu. 2022. "Drivers’ Decelerating Behaviors in Expressway Accident Segments under Different Speed Limit Schemes" International Journal of Environmental Research and Public Health 19, no. 3: 1590. https://doi.org/10.3390/ijerph19031590
APA StyleZhang, W., Yi, J., Zhou, G., & Liu, T. (2022). Drivers’ Decelerating Behaviors in Expressway Accident Segments under Different Speed Limit Schemes. International Journal of Environmental Research and Public Health, 19(3), 1590. https://doi.org/10.3390/ijerph19031590