1. Introduction
Rapid industrialization has created hurdles on the way to achieving sustainable development. According to United Nations (UN), developed and developing nations are striving to address climate problems but industrialization is making their efforts fruitless. To accomplish the economic targets of various countries, different resources are being shared across borders. These trade activities have been possible through globalization. Globalization affects the process of production, which ultimately affects environmental quality [
1,
2,
3,
4].
Today, different economies are creating economic targets by enhancing cross border trade. Most countries, however, overlooked the factors that could affect environmental quality when pursuing their economic goals [
4]. The group of 11 (G-11) countries was formed on 20 September 2006, when most of the countries were in their developing stages. This group was established to enhance their economic progress by cooperation. Since its formation, the G-11 countries have shown remarkable economic progress [
5]. After joining the Paris agreement, the (G-11) nations have shown a strong commitment to reduce environmental pollution and they are revising their current economic and demographic policies. This includes environmental actions, usage of clean energy, and improved living standards.
Due to improving health facilities, the ageing population is increasing and the rise in the ageing population may have environmental consequences. According to the World Bank, the ageing population in G-11 countries has seen a rapid increase. This population is projected to reach 923 million by 2050 [
6], and the governments of these countries are not well prepared for this demographic change. In an economic context, a labour supply shortage might be created by an upsurge in ageing people [
7]. However, in the context of environmental quality, ecological degradation is caused by moving ageing people, household pattern variations, and building of separate homes for such people. Ageing people have environmental awareness but their preferences for a cleaner environment may vary. Ageing people have less preference for the use of private vehicles to move from one place to another. At the same time, they may need additional energy in terms of health-related facilities and if the energy is coming from non-renewable energy resources, it will degrade the environment. Therefore, it is essential to probe the linkages of ageing people with emissions of CO
2.
The objective of the current study is to evaluate the influence of the ageing population on CO2 emissions in G-11 nations. Furthermore, considering the importance of other socio-economic variables, this work includes energy use, globalization, economic growth, energy innovations, and natural resources on CO2 emissions. To the best of the author’s knowledge, there is a gap in literature, and very few studies have investigated the factors of environmental degradation in the context of SDGs for G-11 countries. Also, for the analytical framework, the environmental Kuznets curve (EKC) has not been addressed. EKC proposes that after reaching a threshold level, economic activity may reduce environmental pollution. This may be due to environmental awareness or the use of efficient means of energy. This work probes the EKC among globalization, natural resources, economic growth, and ageing populations in G-11 nations.
For effective policy instruments, this work utilizes the second-generation methods because the first-generation methods may not incorporate the cross-sectional heterogeneities, which the study seeks to address. Therefore, the present study uses the cross-sectional autoregressive distributed lag (CS-ARDL) technique. This method controls the structural similarities to provide the effects of independent parameters on the dependent parameters. Considering these advantages, this work uses the CS-ARDL instead of the traditional autoregressive distributed lag (ARDL) [
8].
To capture the evolutionary impacts on CO
2 emissions, a suitable theoretical model is required. Hence, the EKC by Grossman and Krueger [
9] has been employed to determine the evolutionary associations among the variables. The paper is structured as follows: a literature background is described in
Section 2, the methodology and data are described in
Section 3, the fourth section comprises an analysis of the results, and the last section outlines the conclusions of the study.
3. Data and Empirical Estimation
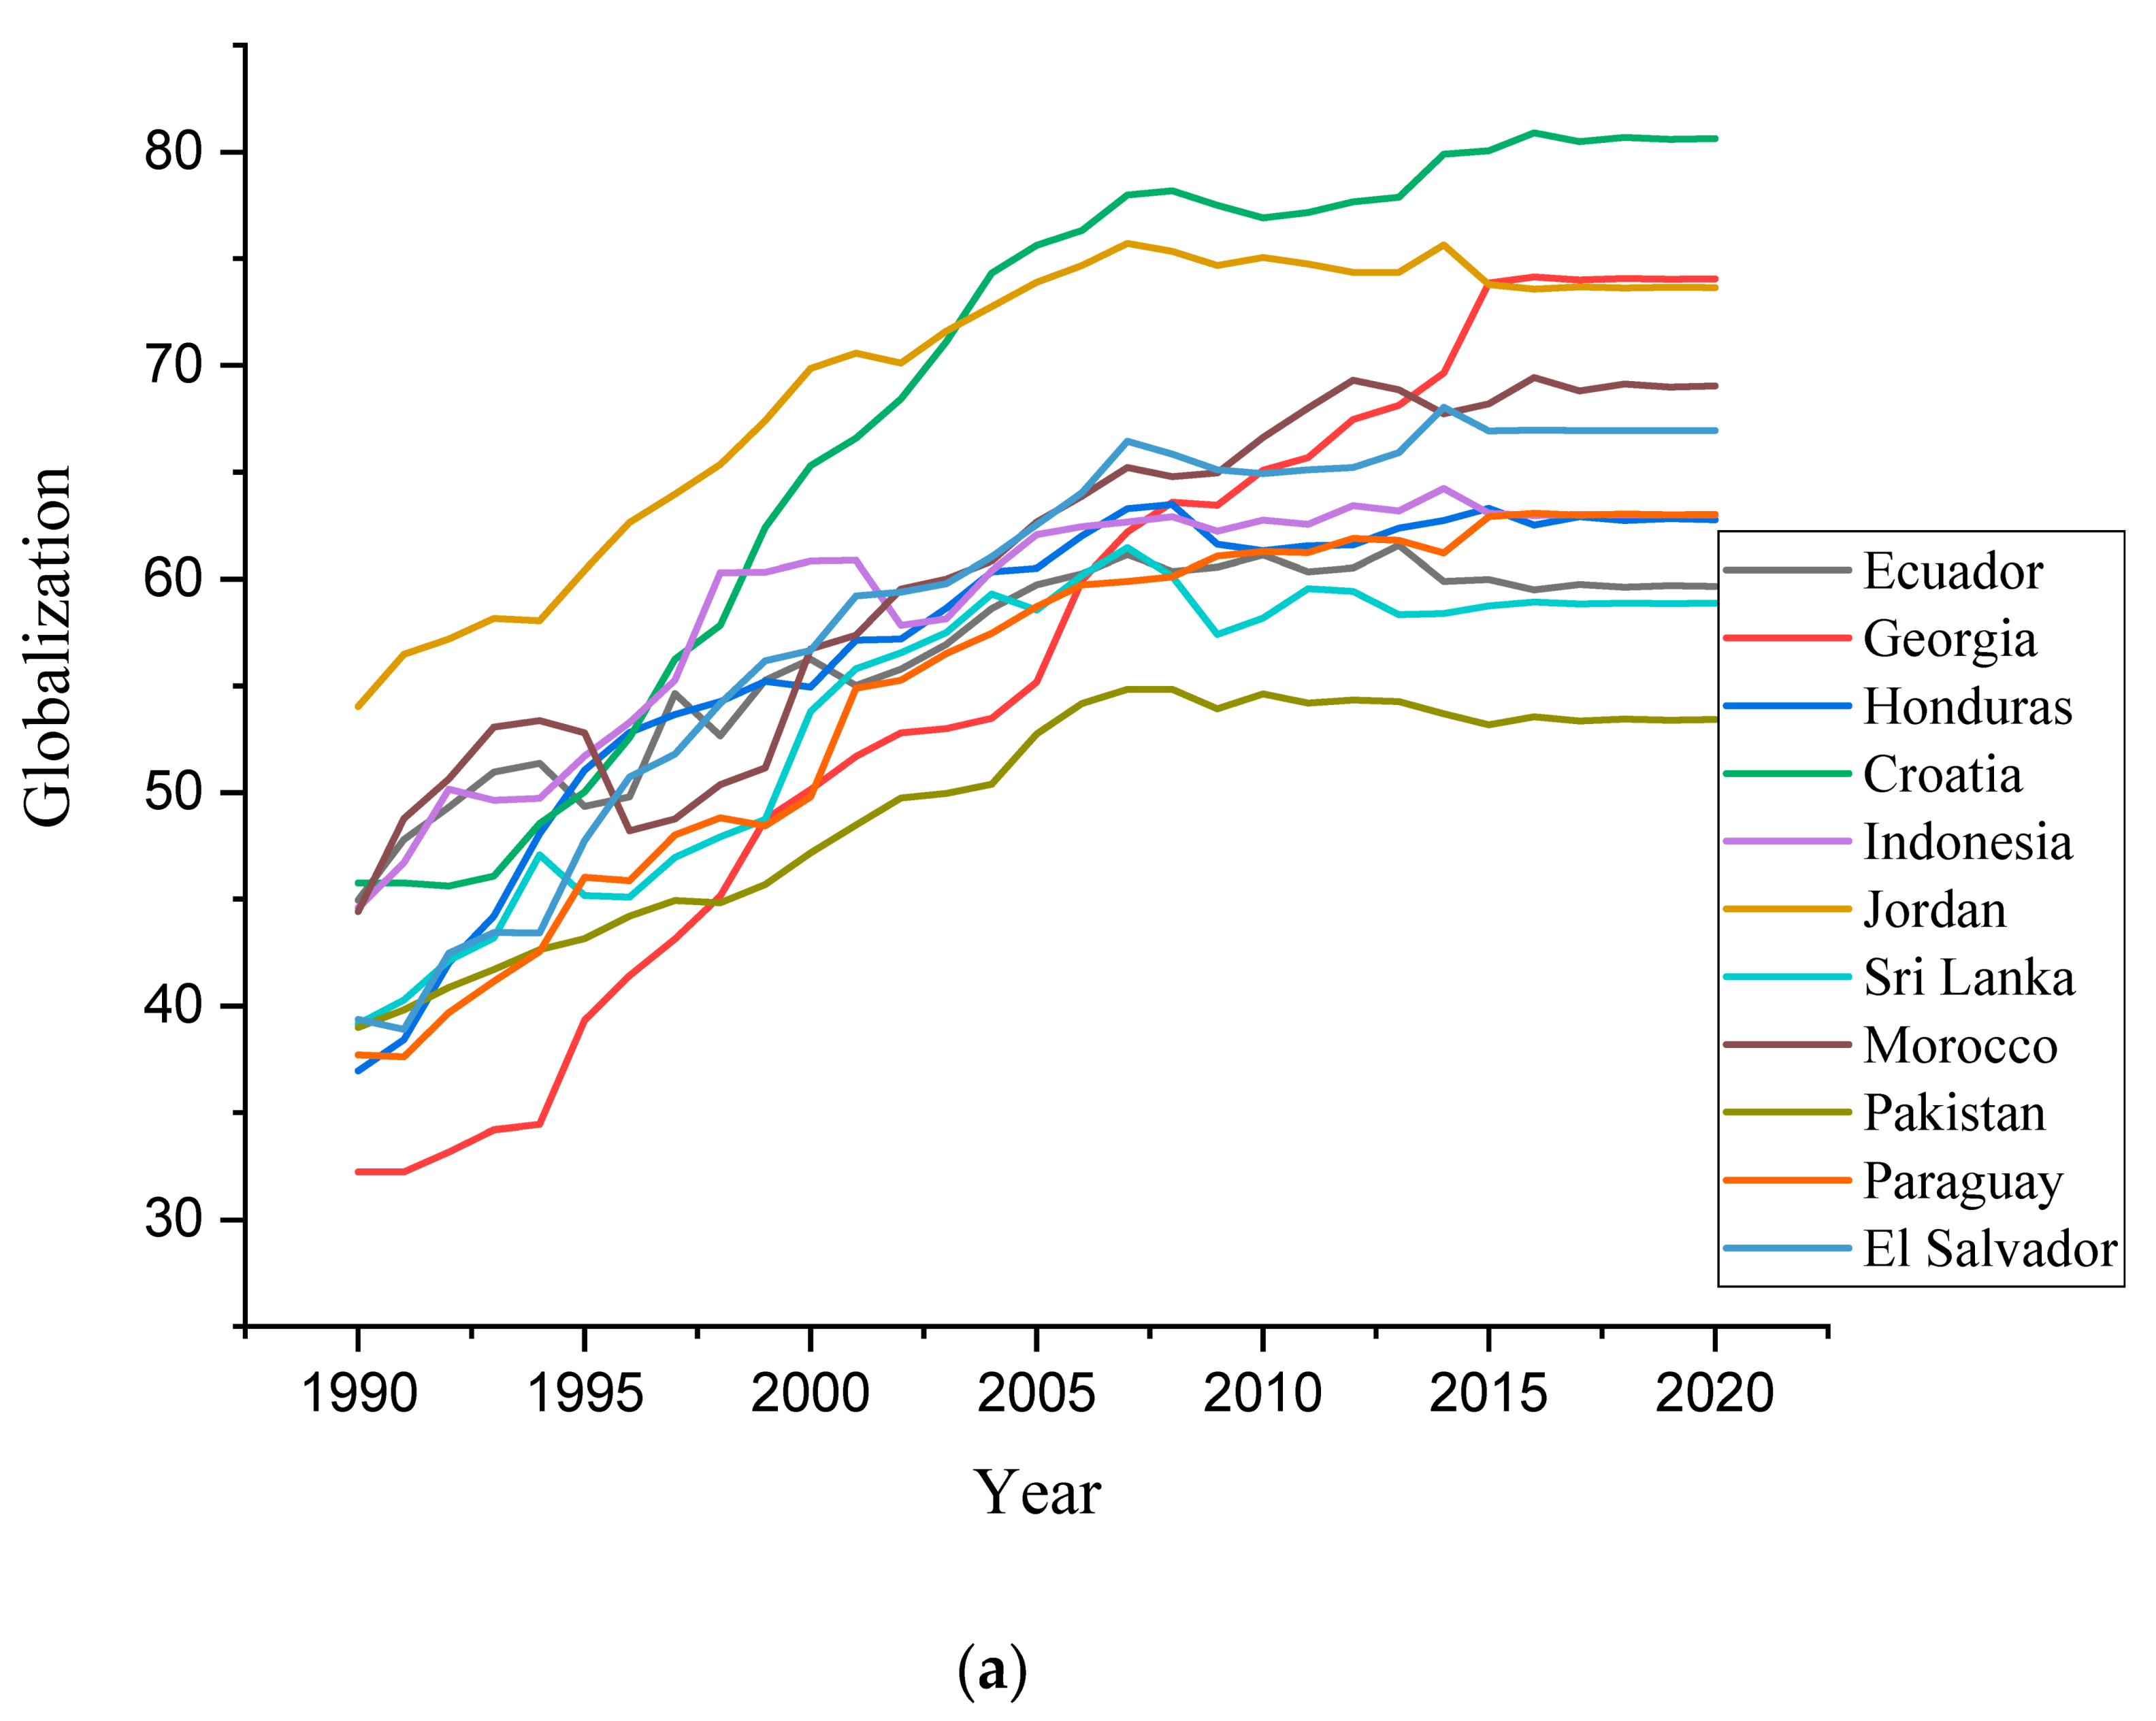
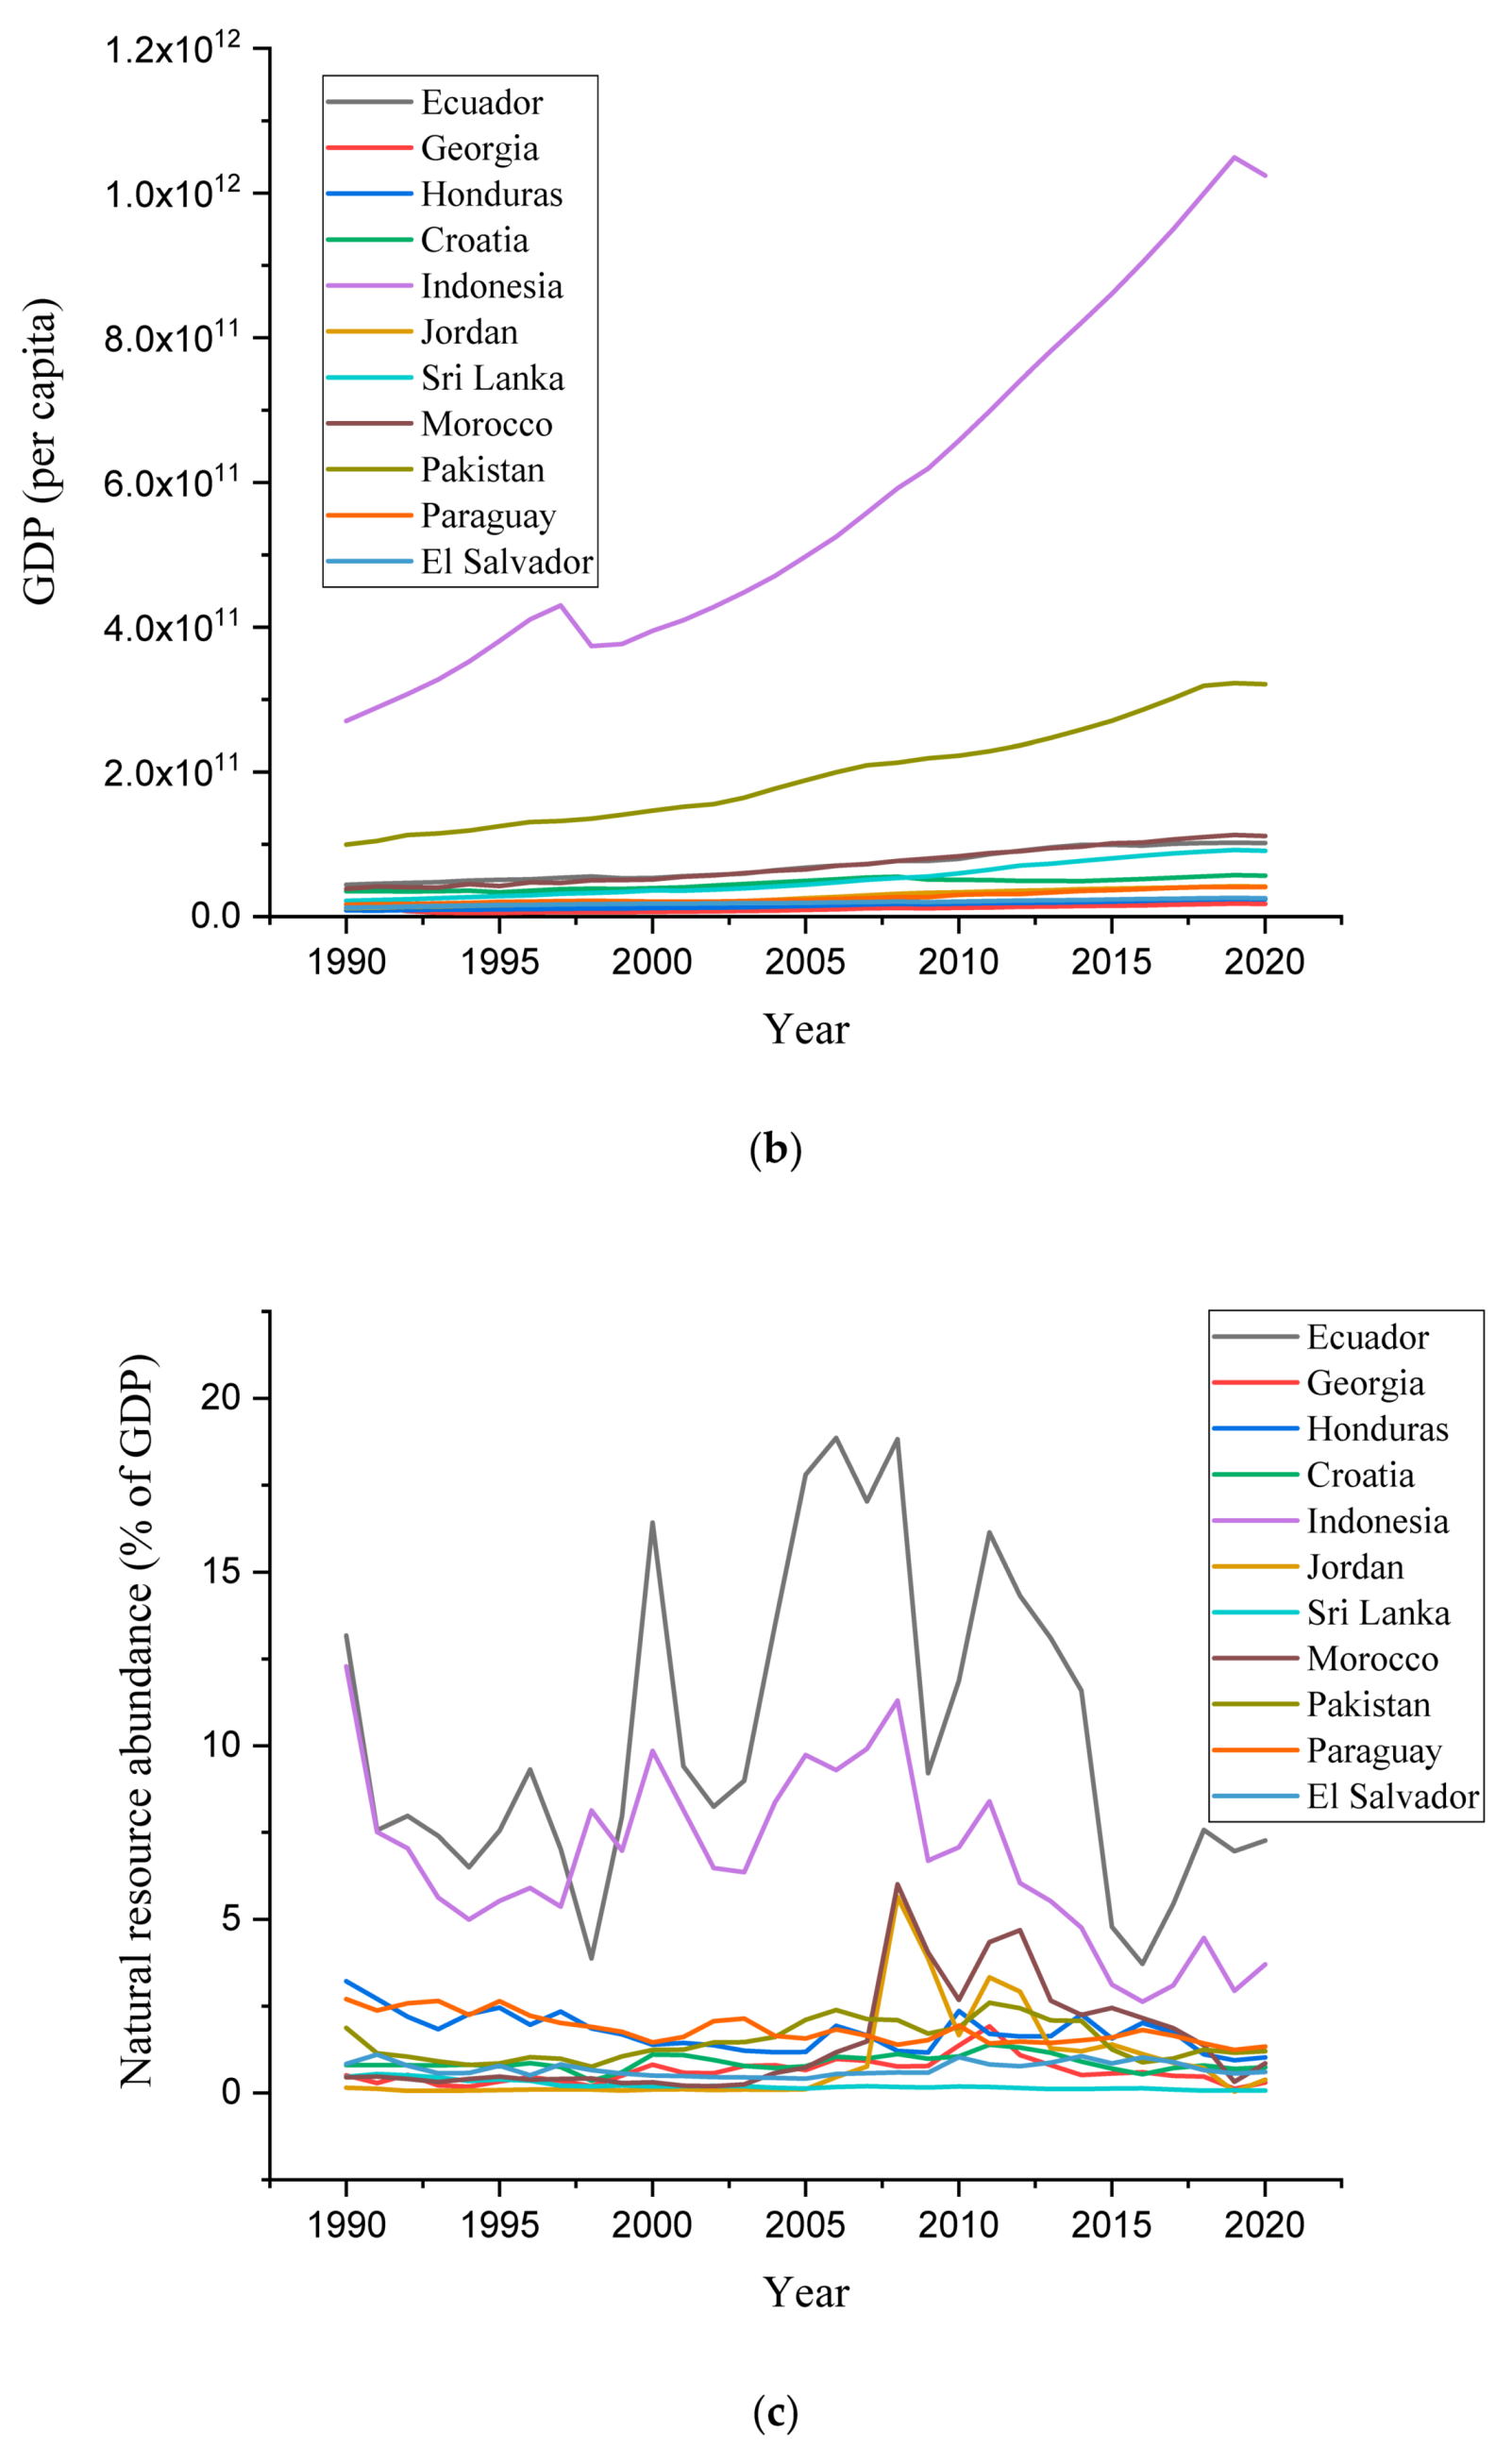
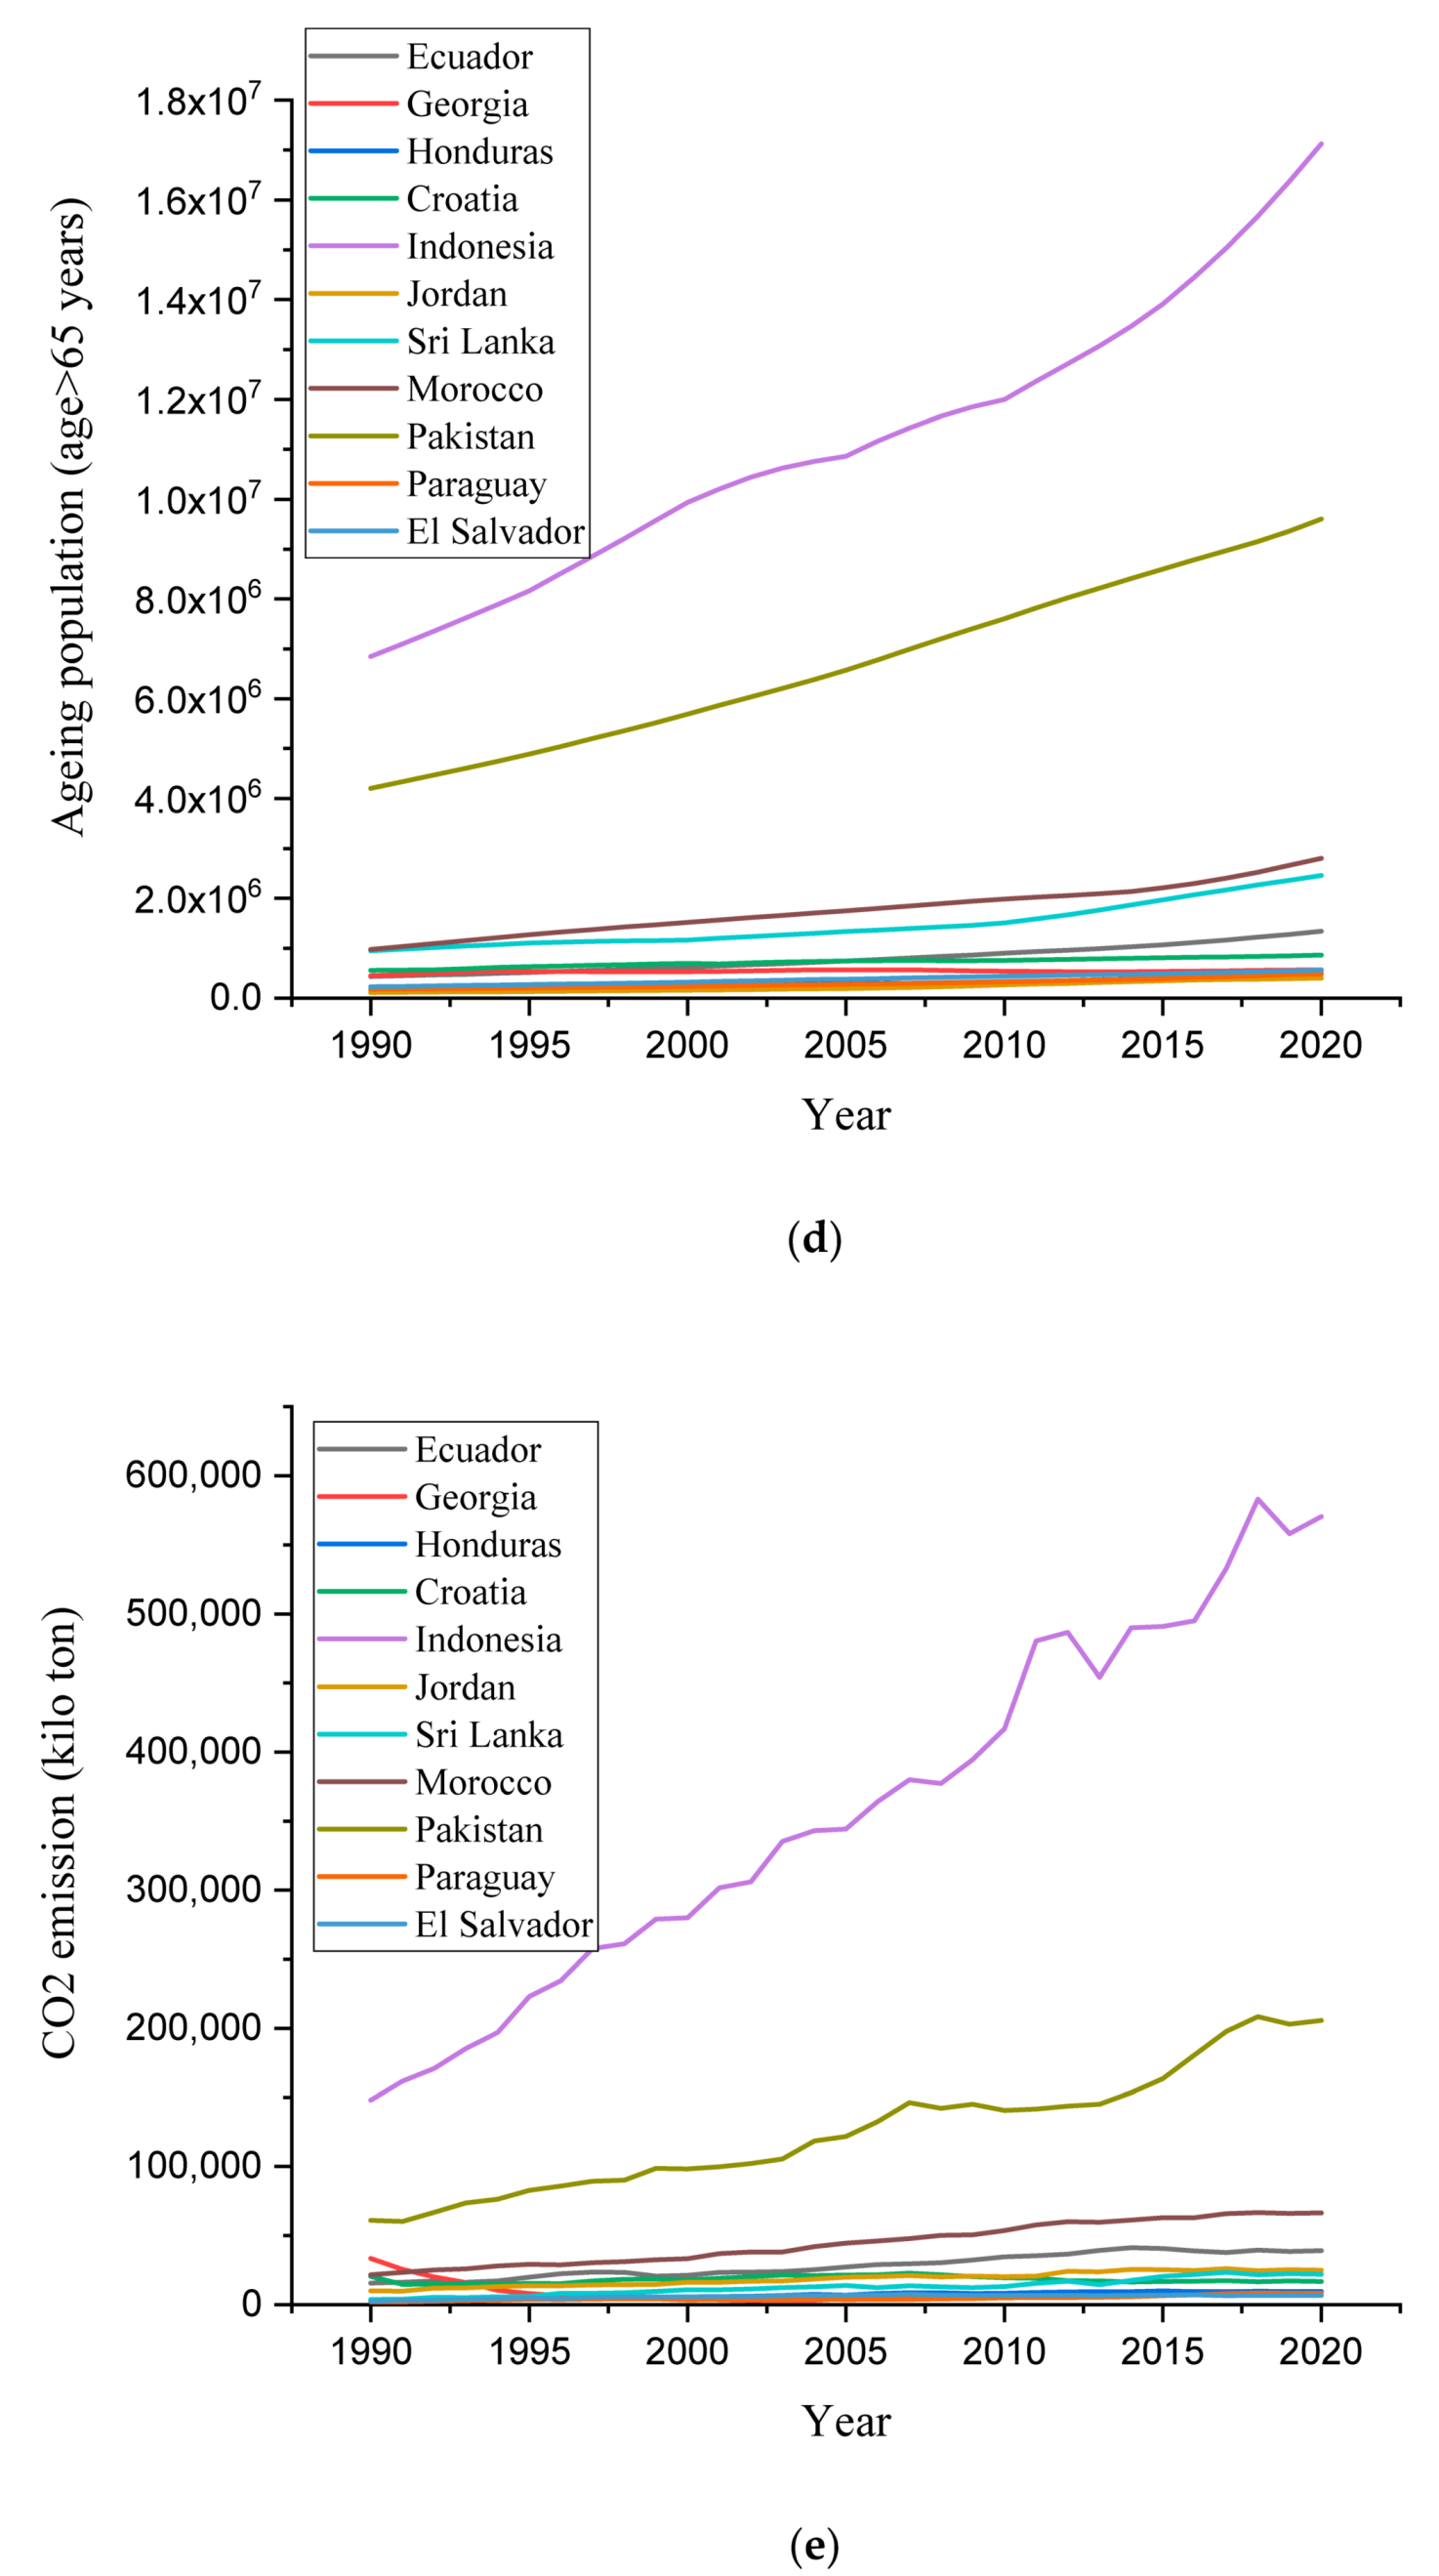
This work attempts to probe the impact of ageing people on CO
2 emissions by controlling the other socio-economic factors of globalization, natural resources, GDP, and energy use. In doing so, this work utilizes the annual data of 1990–2020 for G-11 nations of Croatia, Jordan, Ecuador, El Salvador, Georgia, Honduras, Morocco, Indonesia, Paraguay, Pakistan, and Sri Lanka. The data for GDP per capita (constant terms), CO
2 emissions (kilo tons), natural resources (% of GDP), energy use (kg of oil equivalent per capita), research, and development (number of patents), and the ageing population 65 and above were used. All the data were obtained from the World Bank [
39] except the data for globalization, which was obtained from the KOF Economic Institute [
40].
Figure 1a–e illustrates an increasing trend in globalization, GDP per capita, natural resource abundance, research and development, ageing population, and CO
2 emissions in G-11 countries. Croatia showed the highest globalization during 1990 to 2020. Similarly, Indonesia had the highest economic growth among the G-11 countries during the study period. The highest natural resource was in Ecuador. Indonesia had the highest number of ageing people during the study period.
Before the econometric analysis, all data were transformed into their natural logarithms. This form eliminates the problems of multicollinearity and provides robust findings [
41,
42,
43]. This work follows the study of Balsalobre-Lorente et al. [
44] in applying the empirical model, which is as follows:
where, CO
2, GL, GDP, NAT, AG, EN, and RD represent the CO
2 emissions (kilo ton), the overall index of globalization, GDP per capita (constant term), natural resource abundance (% of GDP), ageing population 65 years and above, energy use (kg of oil equivalent per capita), and research and development (number of patents).
Table 1 presents the descriptive statistics of the variables, which shows that GDP, globalization, and number of ageing people in the population have the highest values.
Table 2 shows the description and sources of data. For econometric analysis, this work adopts the second-generation methodology. There is a reason to use second-generation methods because the datasets obtained for South Asian countries may suffer from cross-section dependence (CD) due to common traditional methods, social norms, and economic policies. It might not be able to provide robust results. A second-generation unit root test is applied to find the order of integration among the panel data. The CS-generation technique is applied to present the values of long- and short-run coefficients.
Cross-Sectional Autoregressive Distributed Lag (CS-ARDL)
This work seeks to probe the linkages between economic growth, natural resources, energy use, globalization, ageing people, and CO
2 emissions for a panel of G-11 nations. Panel estimations can generate unreliable results because of the existence of cross-section dependence and slope heterogeneity issues. These issues are not considered by the traditional estimation techniques of FMOL and DOLS [
45]. The issue of slope heterogeneity and CD is efficiently handled by the CS-ARDL approach, which is not catered for by the FMOL and DOLS techniques. Therefore, the current study used the CS-ARDL method to calculate the values of long- and short-run coefficients. This method caters for heterogeneity and CD problems by applying dynamic common correlated impact predictors [
46,
47]. Equation (1) represents the mathematical form of the CS-ARDL:
Equation (1) represents the ARDL model; if we use Equation (5), by taking CD, it will produce uncertain results. Equation (4) is revised using averages of CS one by one repressor parameters. This will permit us to remove inappropriate interpretations concerning the existence of the threshold effect generated by CD [
8].
where the average value of dependent and independent parameters can be calculated by using the following equation:
Existing lags among all the variables are denoted by
aw,
ax and
az.
denotes emission of carbon per capita depending upon its utilization and
represents all the independent variables. Furthermore,
X denote the average of CS (disregarding the trends) to overwhelm the spillover issues [
48]. The CS-ARDL method estimates the long-run coefficients by using short-run coefficients as its input. Equations (4)–(6) represent the mean group (MG) predictor and the value of long-run and short-run coefficients, respectively:
where
,
In the CS-ARDL approach, the economy achieves an equilibrium state as soon as the value of the error correction mechanism (ECM) approaches −1.
4. Results and Discussion
For panel data analysis, it is important to be sure of the CD. For this purpose,
Table 3 shows the results that reject the null hypothesis of CD among the selected variables, i.e., CO
2, GL, GDP, AG, NAT, and RD, which confirms that the entire data have a CD at a 1% level. Thus, the results imply that a shock in one country will spill over to the other countries as well. These empirical findings agree with that of Mehmood et al. [
49] and Musah at al. [
50].
Before the application of long-run analysis, it is required to know the integration order of the data. Therefore, this work applies the CIPS unit root test.
Table 4 indicates the results of the unit root test which reveals that the panel data are integrated at the first difference. The results shows that in the CIPS unit root test almost all variables are integrated at the first difference except NAT, which is also integrated at this level. This indicates that except NAT, all remaining variables of interest acquired stationarity after the first difference indicating the integration sequence among the data. The findings are supported by the following studies of Musah et al. [
50] and Adamu et al. [
51].
After the CD and unit root test, the Hashem Pesaran and Yamagata [
52] test was incorporated. A slope heterogeneity test was done to examine the slope heterogeneity between the selected variables.
Table 5 depicts the analysis of heterogeneity of slope as measured by Pesaran and Yamagata [
52]. This test was used to assess the coefficients of heterogeneous and homogenous slopes from the study. This test confirms the heterogeneity at the 1% significance level.
The findings of Westerlund and Edgerton [
53] are presented in
Table 6, which depicts the null hypotheses of no co-integration between the parameters in the existence of serial correlation, CD, and heterogeneity. The findings reject the null hypotheses with no mean shift and regime shift. This verifies the existence of a co-integrating association among the CO
2, GL, GDP, NAT, AG, EN, and RD at a 1% significance level. The results are consistent with Menz and Welsch [
34].
Table 7 shows the findings of the CS-ARDL, which shows different insights. The findings are presented sequentially considering the influence of globalization on the emissions of CO
2. In both short- and long-run estimations, the coefficient of globalization is positive and statistically significant. It is evident that globalization is exerting a positive impact on CO
2 emissions, but the square of globalization is negatively correlated with CO
2 emissions. This means that the evolutionary impact of globalization is inverted in the U-shape of CO
2 emissions in G-11 countries. Globalization increases economic opportunities and also makes room for importing efficient technologies to produce clean energy. This result is similar to the results of Sinha et al. [
54]. The coefficient of GDP is positive having a value of 9.75% at a 5% significance level, whereas the square of the GDP is negatively associated with environmental degradation. This implies that the evolutionary impact of economic growth is also inverted in the U-shape, which means that recent economic growth is contaminating the environment. In the future, economic growth will improve air quality. Empirical findings by Balsalobre-Lorente et al. [
7], Mehmood and Tariq [
55] and Qayyum et al. [
56] align with the findings of the study. The finding from the study also indicates that G-11 countries are spending on non-renewable resources in the energy sector but in the future, the ratio of renewable energy to the final energy output will increase which will lead to an improvement in air quality. The findings align with that of Mehmood et al. [
55] and Abid et al. [
57].
The evolutionary effect of natural resources on the emissions of CO2 is an inverted U-shape. This means that dependence on natural resources is lowering air quality, but less consumption of natural resources is improving air quality in G-11 countries. The influence of natural resources on the emissions of CO2 can be better explained if the joint effects of innovations in the energy sector and the use of energy on the emissions of CO2 are examined. It can be observed that the impact of research and development on the emissions of CO2 are negative. This means that research and development are lowering CO2 emissions in G-11 countries.
Lastly, the effect of the ageing population on CO
2 emissions shows that, currently, elderly people positively improve the air quality but in the future this association becomes inverse. This outcome rejects the existence of EKC between ageing population and CO
2 emissions. This confirms that the current changing demographic patterns in the G-11 countries are environmentally friendly. However, in the future, due to the ageing population growth, they will negatively affect air quality. This outcome is similar to the findings of Hamza et al. [
58].
5. Conclusions
During the last few years, the G-11 countries have made commitments to lower the concentration of CO2 emissions and to improve air quality. These commitments require a comprehensive environmental policy. Therefore, considering the importance of SDGs in the G-11 countries, this work incorporates globalization and the ageing population to present some important recommendations. This work will be helpful for policymakers to achieve SDGs 13, 8, and 7. This study has proposed a comprehensive policy recommendation by analyzing the role of globalization, research and development, and ageing people. The study shows that the G-11 countries are spending on non-renewable resources in the energy sector but, in the future, the ratio of renewable energy to the final energy output will increase which will lead to an improvement in air quality. This work also revealed the need for policymakers to improve the ratio of renewable energy to the final energy output utilized in the industrial sectors. In increasing the ratio of renewable energy, the governments of these countries need to give special attention to employment opportunities because this aspect can be a hurdle in achieving sustainable development. The impacts of research and development on the emissions of CO2 are negative. This means that research and development are lowering CO2 emissions in the G-11 countries. Research and development will help invent renewable energy technologies. Currently, ageing people are environmentally friendly but in the future ageing people will start to contaminate air quality by increasing the CO2 emissions. This result is important for policymakers, and they should divert their attention towards the environmental awareness of ageing people.
The role of natural resources is very important for achieving sustainable development. The evolutionary effect of natural resources on the emissions of CO2 is not an inverted U-shape. Currently, natural resources are environmentally friendly but in future due to mismanagement resources will also contaminate the environmental quality by increasing CO2 emissions. This result has also highlighted the policy instruments to preserve and use natural resources sustainably. The abundance of natural resources helps to reduce greenhouse gases and also serves as a catalyst for sustainable growth. Therefore, nations should be aware of the need to conserve natural resources.
This work validates the existence of EKC between globalization, GDP, and environmental quality. This means that globalization is currently creating environmental problems but, in the future, will start to improve air quality by reducing CO2 emissions. This finding sheds light on the importance of globalization for the G-11 nations. It is expected that the G-11 nations should explore more markets to export their products, especially to the developed nations. This will provide the nations with the opportunities to import cleaner technologies to deal with CO2 emissions.
Apart from the contribution of this study, future research can be applied to highly globalized and developed countries. Moreover, future works can be undertaken by utilizing the other panel data analysis.


 ,
, 
