
The Unequal Effect of the COVID-19 Pandemic on the Labour Market and Income Inequality in China: A Multisectoral CGE Model Analysis Coupled with a Micro-Simulation Approach

 , ,
, ,
Abstract
:1. Introduction
2. Literature Review
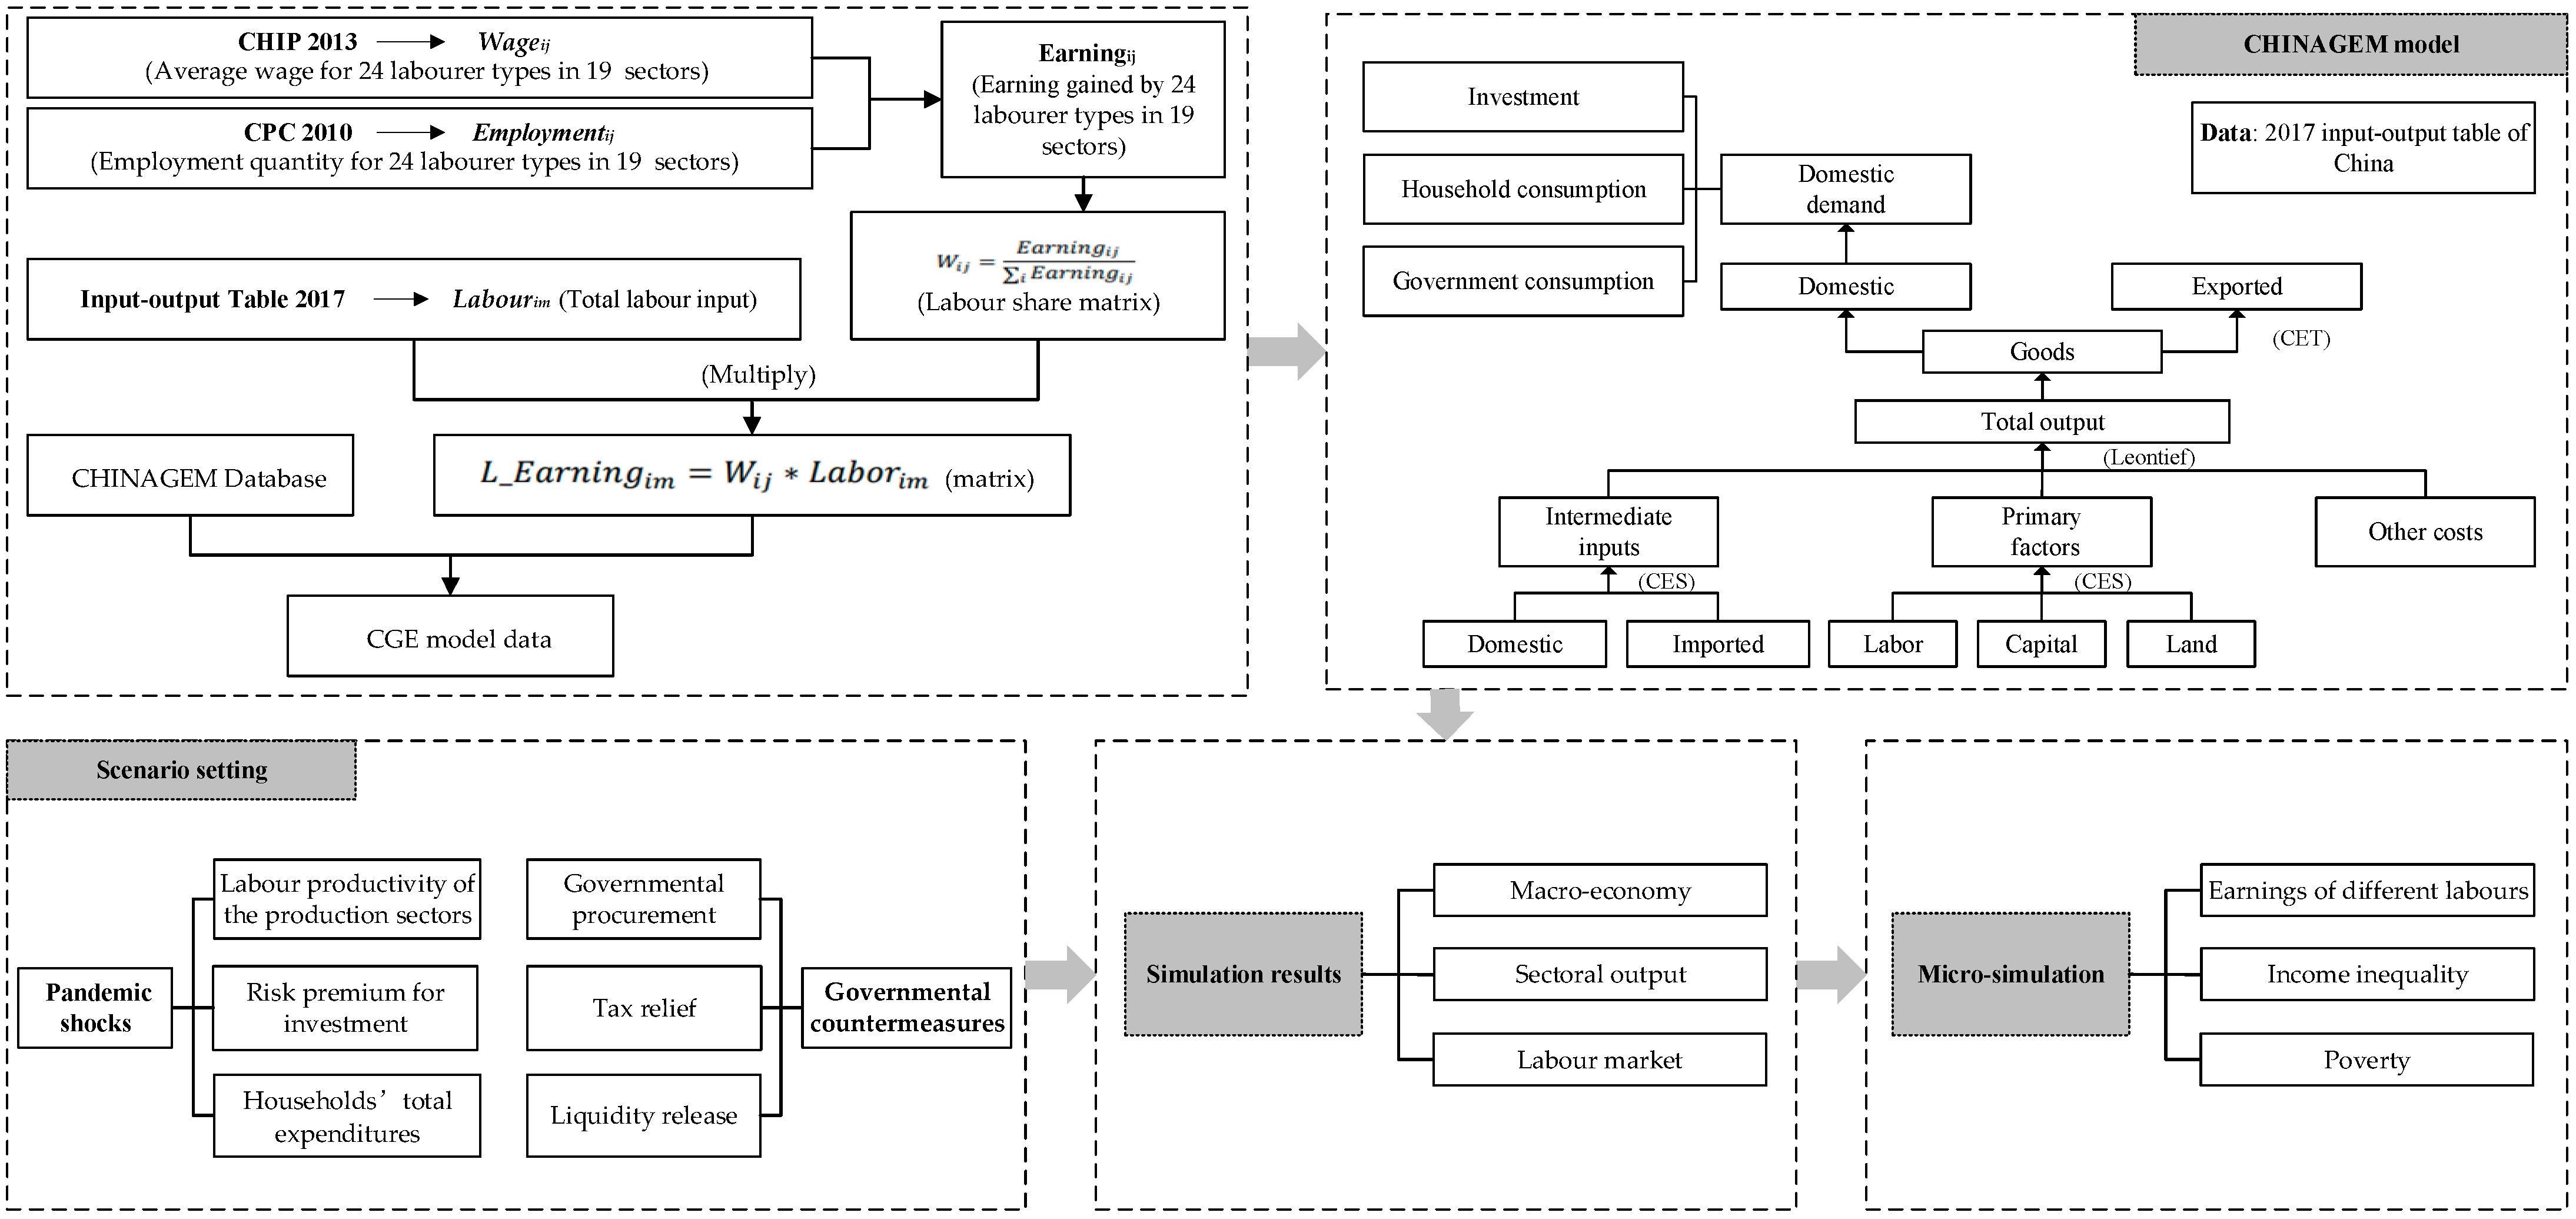
3. Methodology
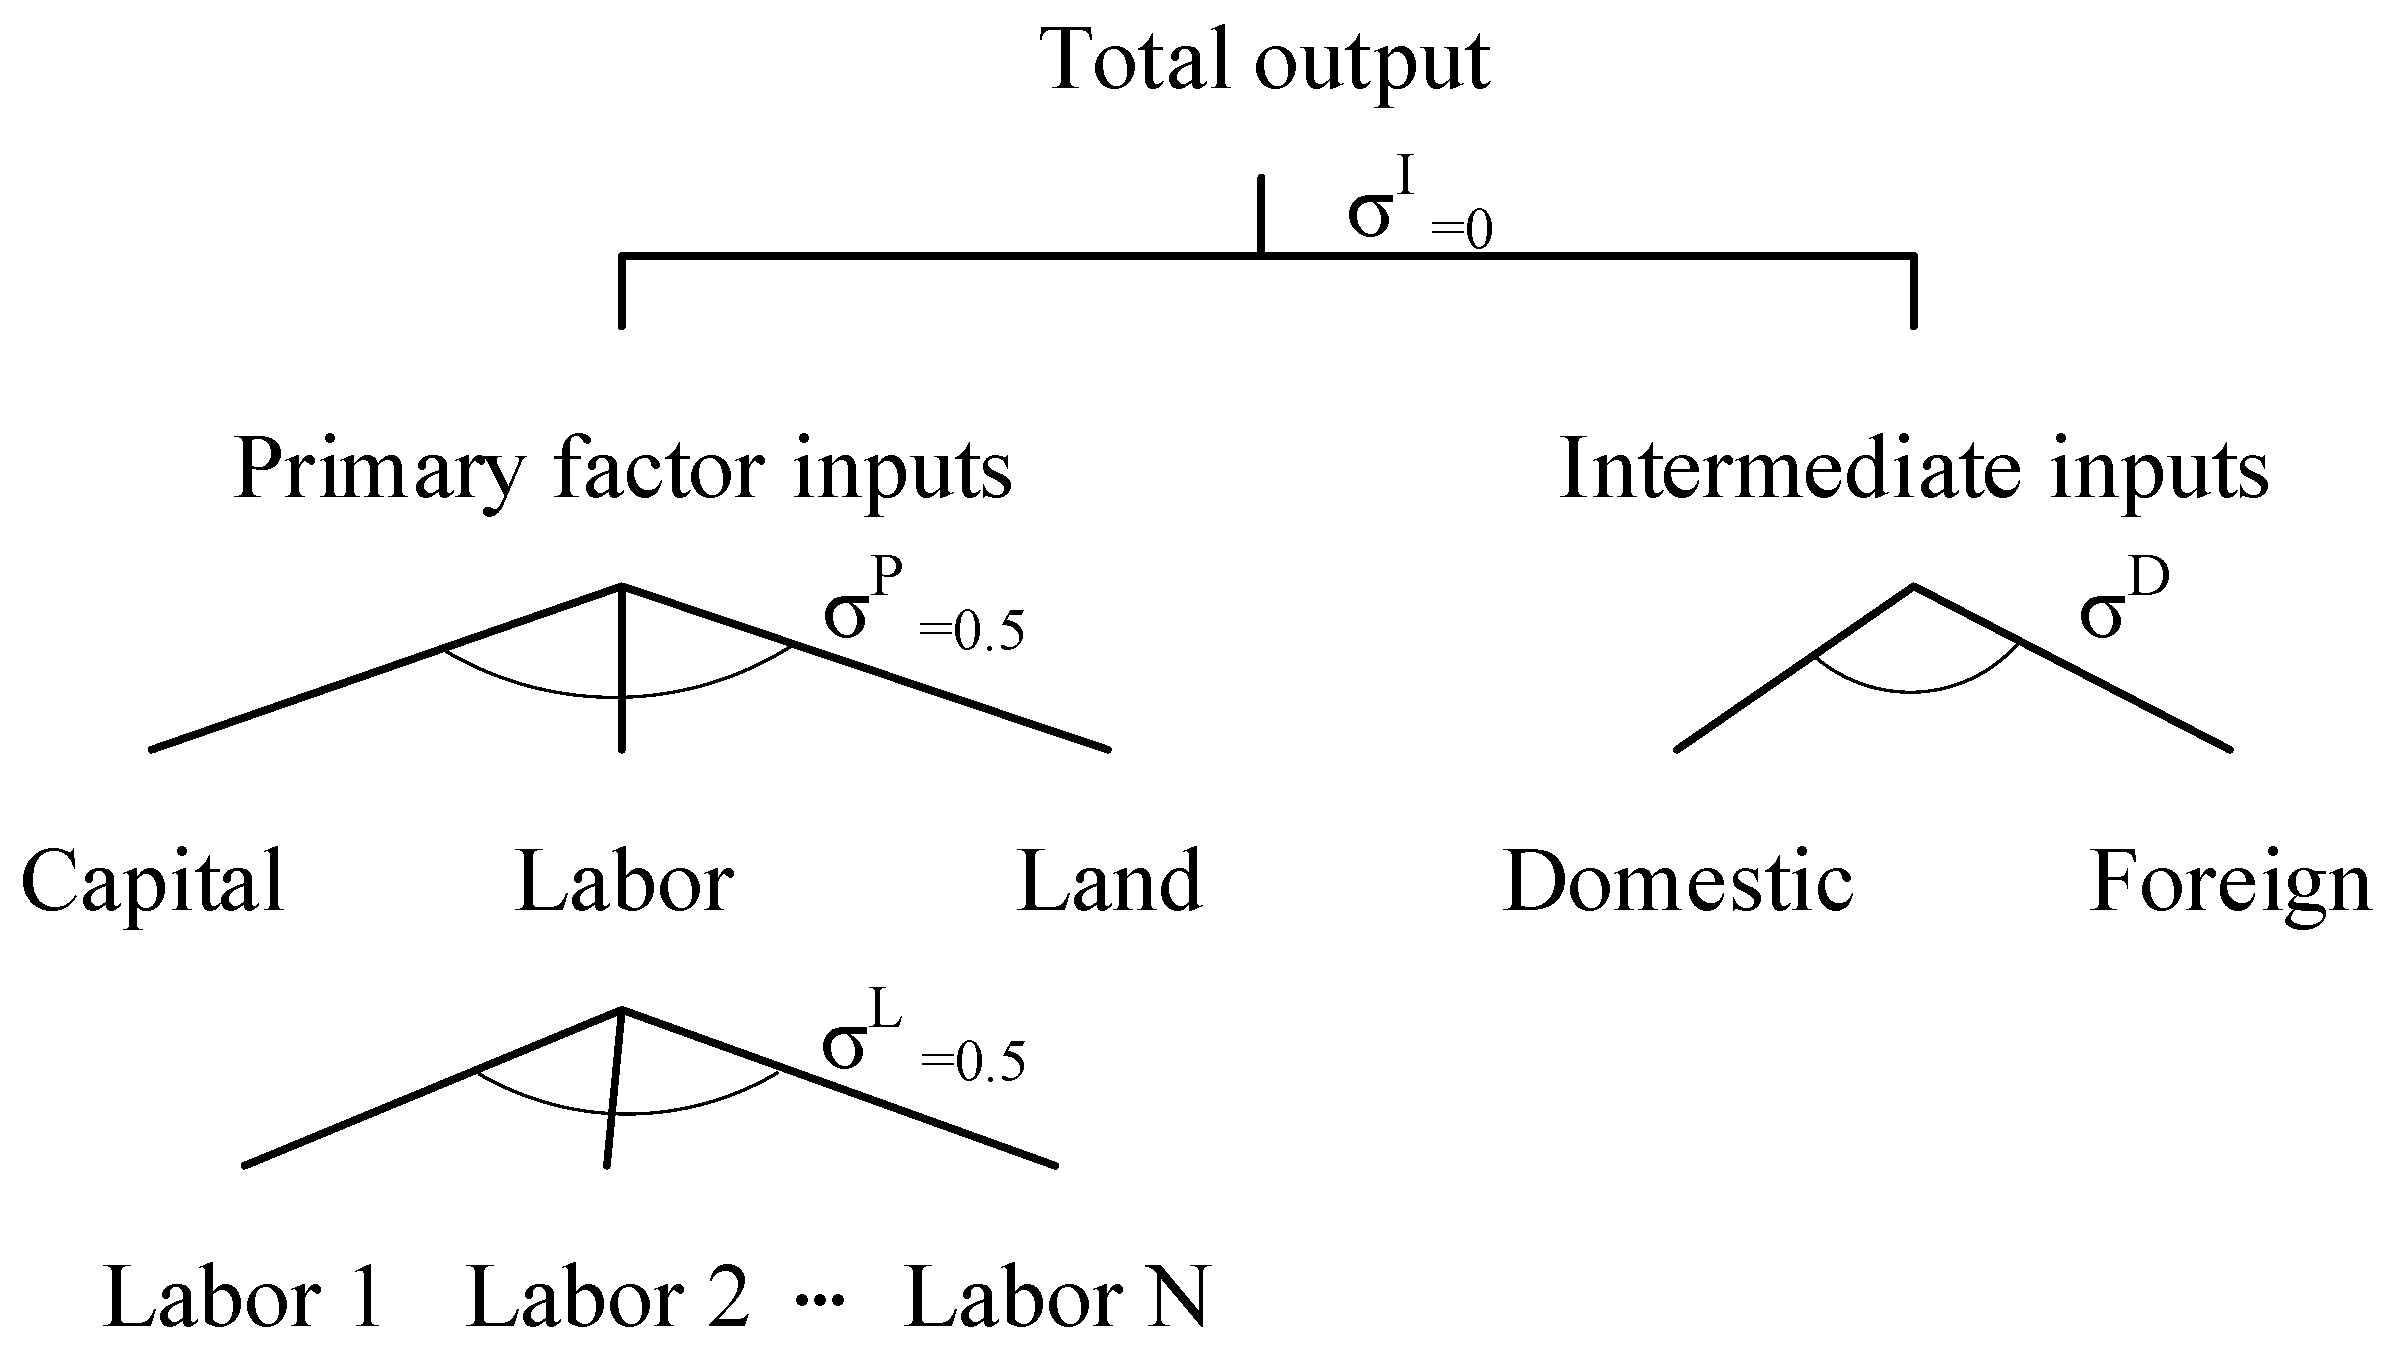
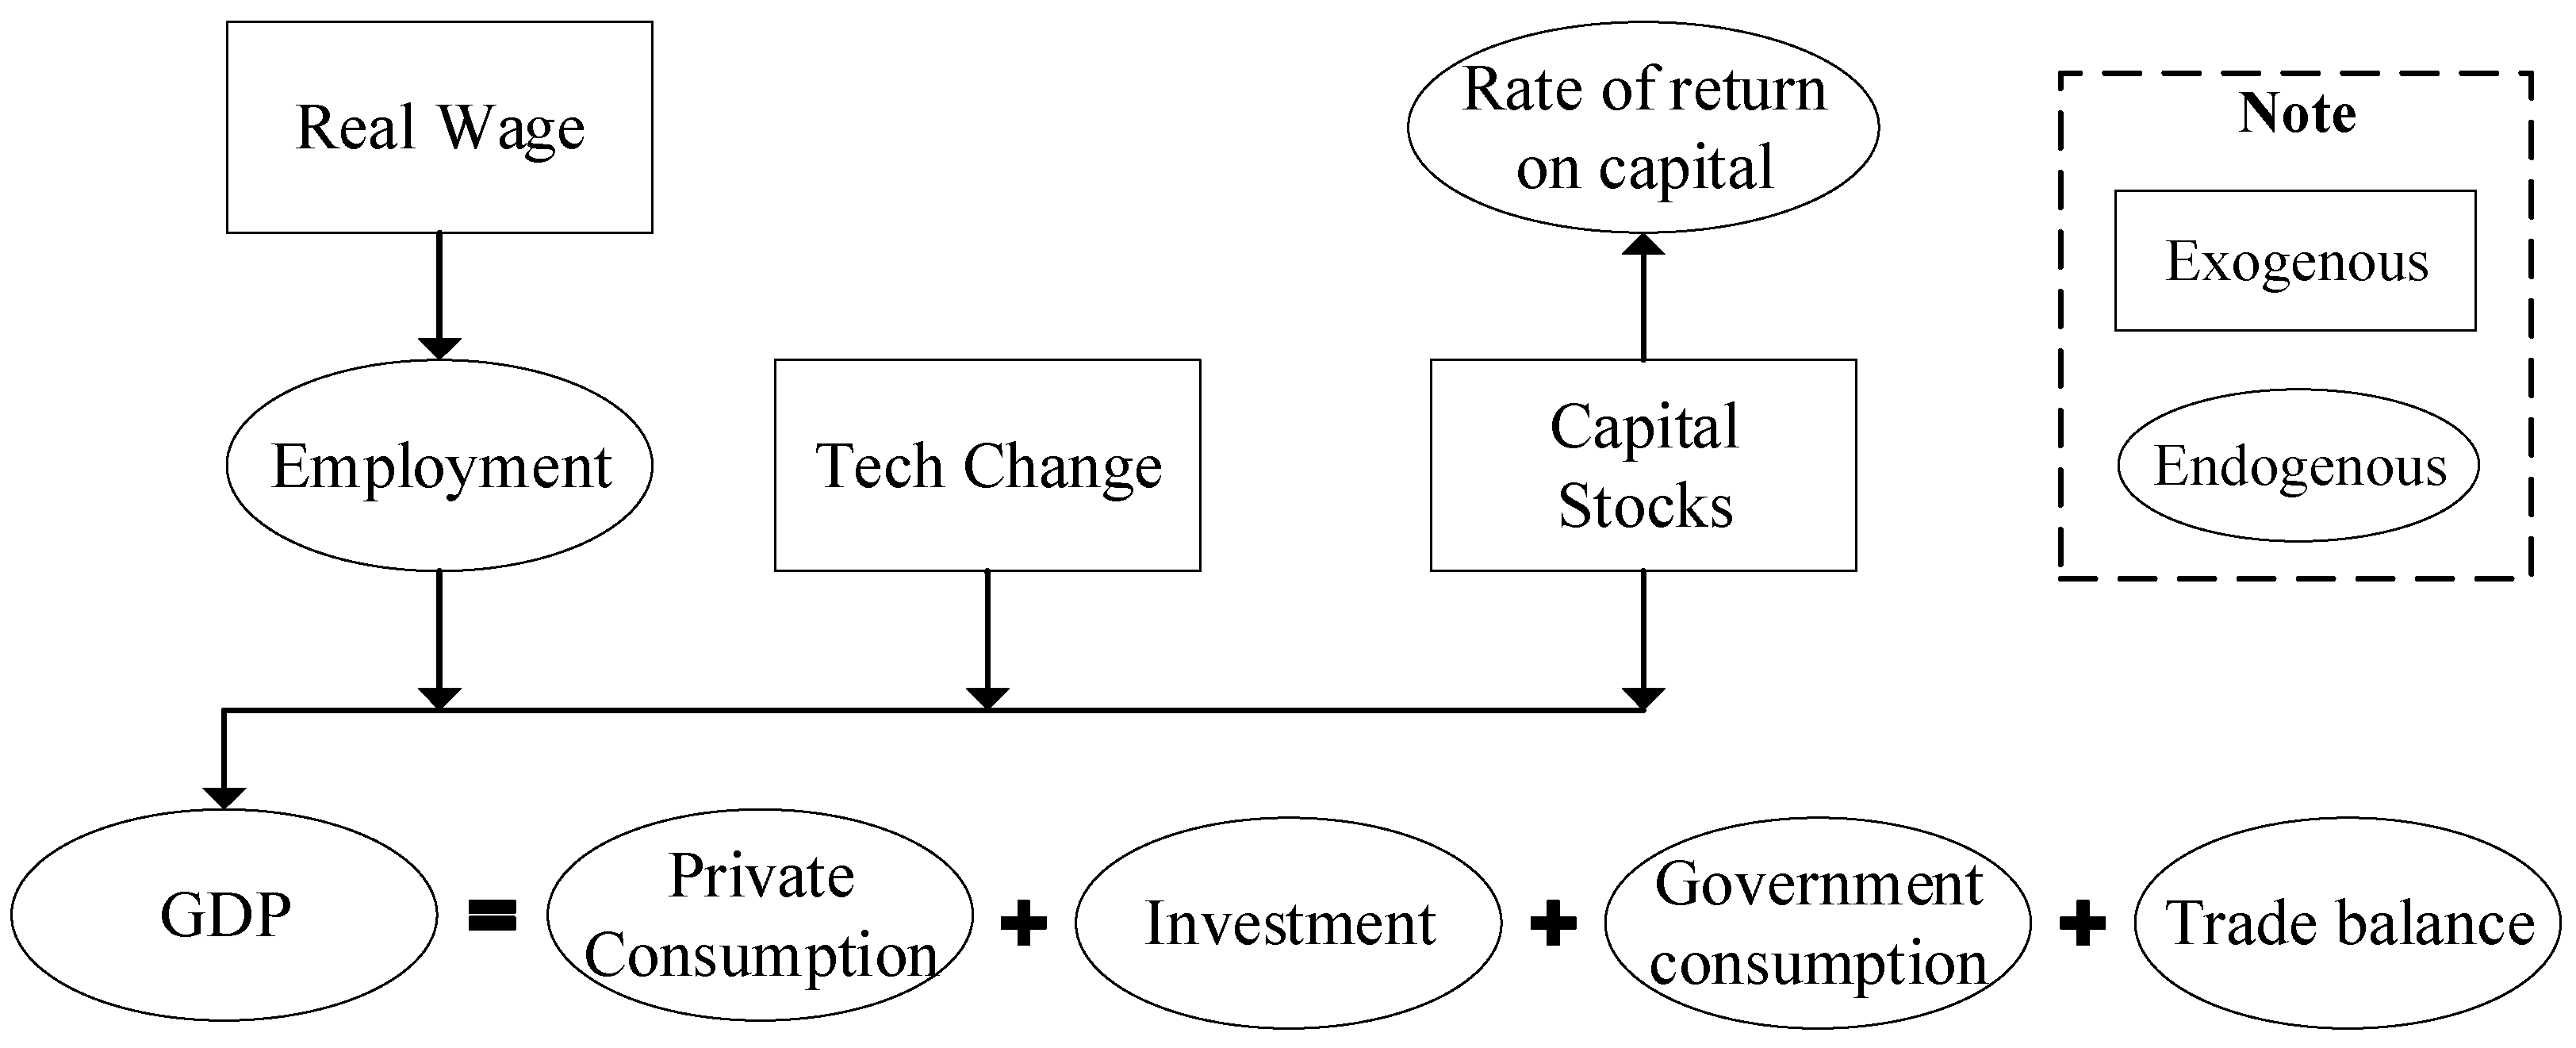
3.1. CHINAGEM Model
3.2. The Micro-Simulation Approach
3.3. Scenario Setting
4. Results
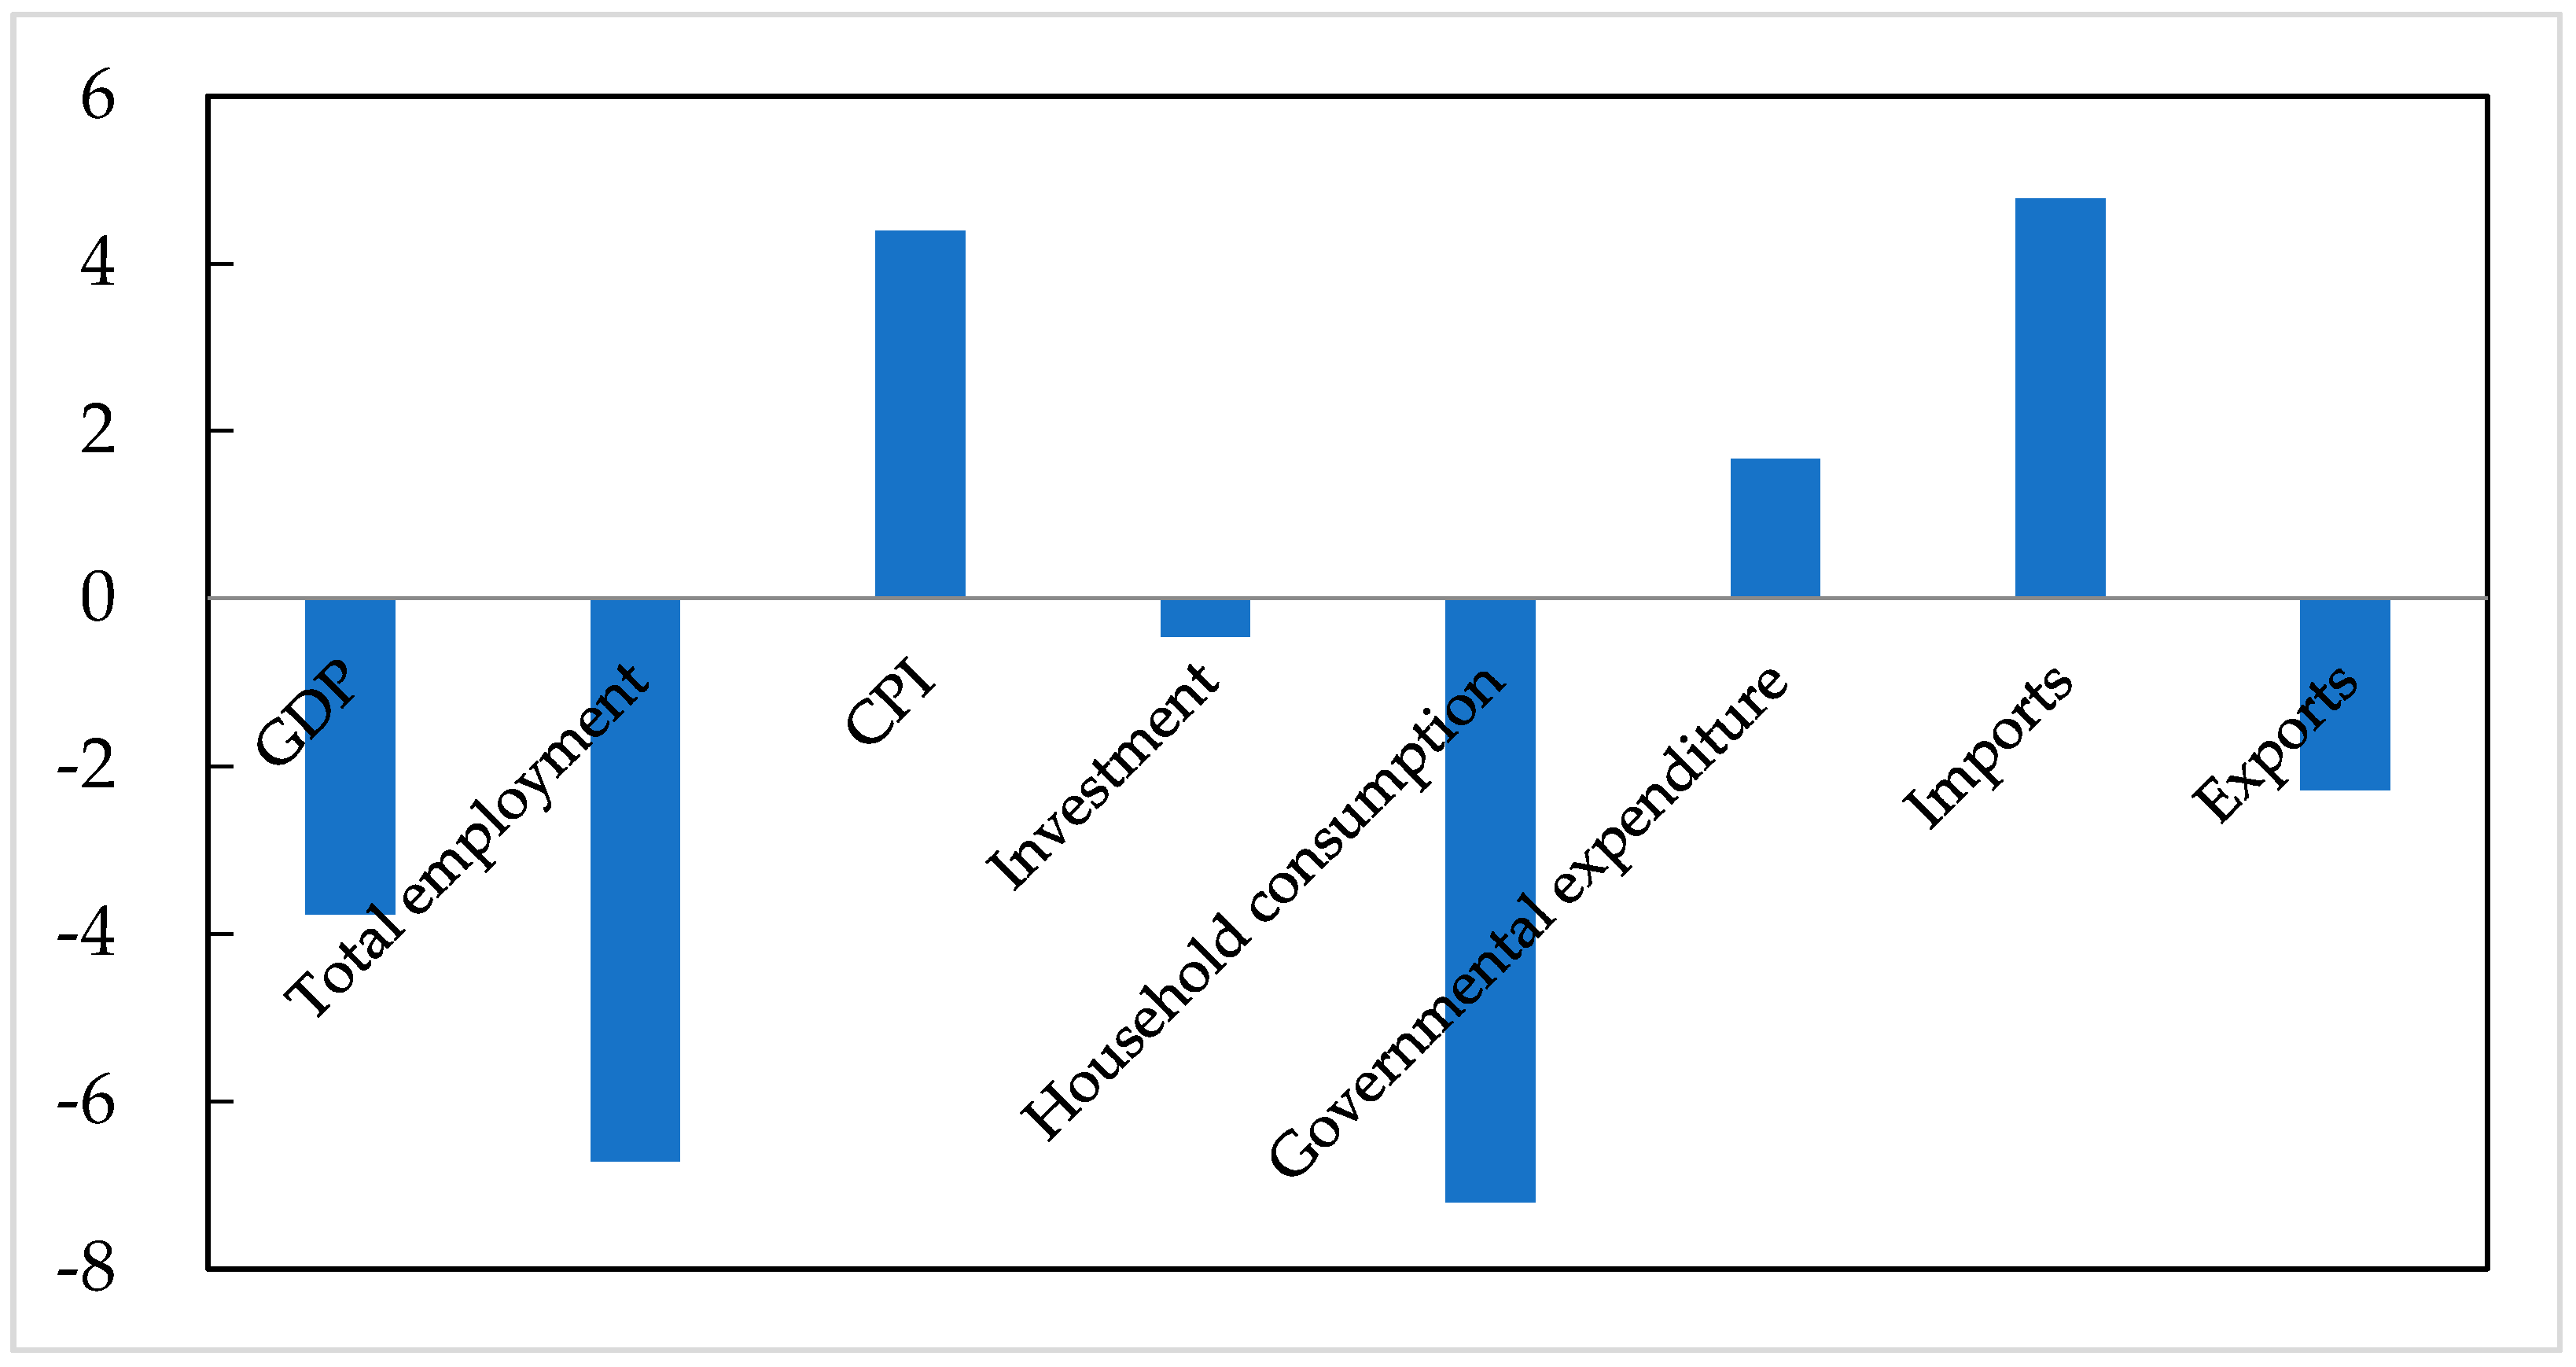
4.1. The Impact on China’s Macro-Economy
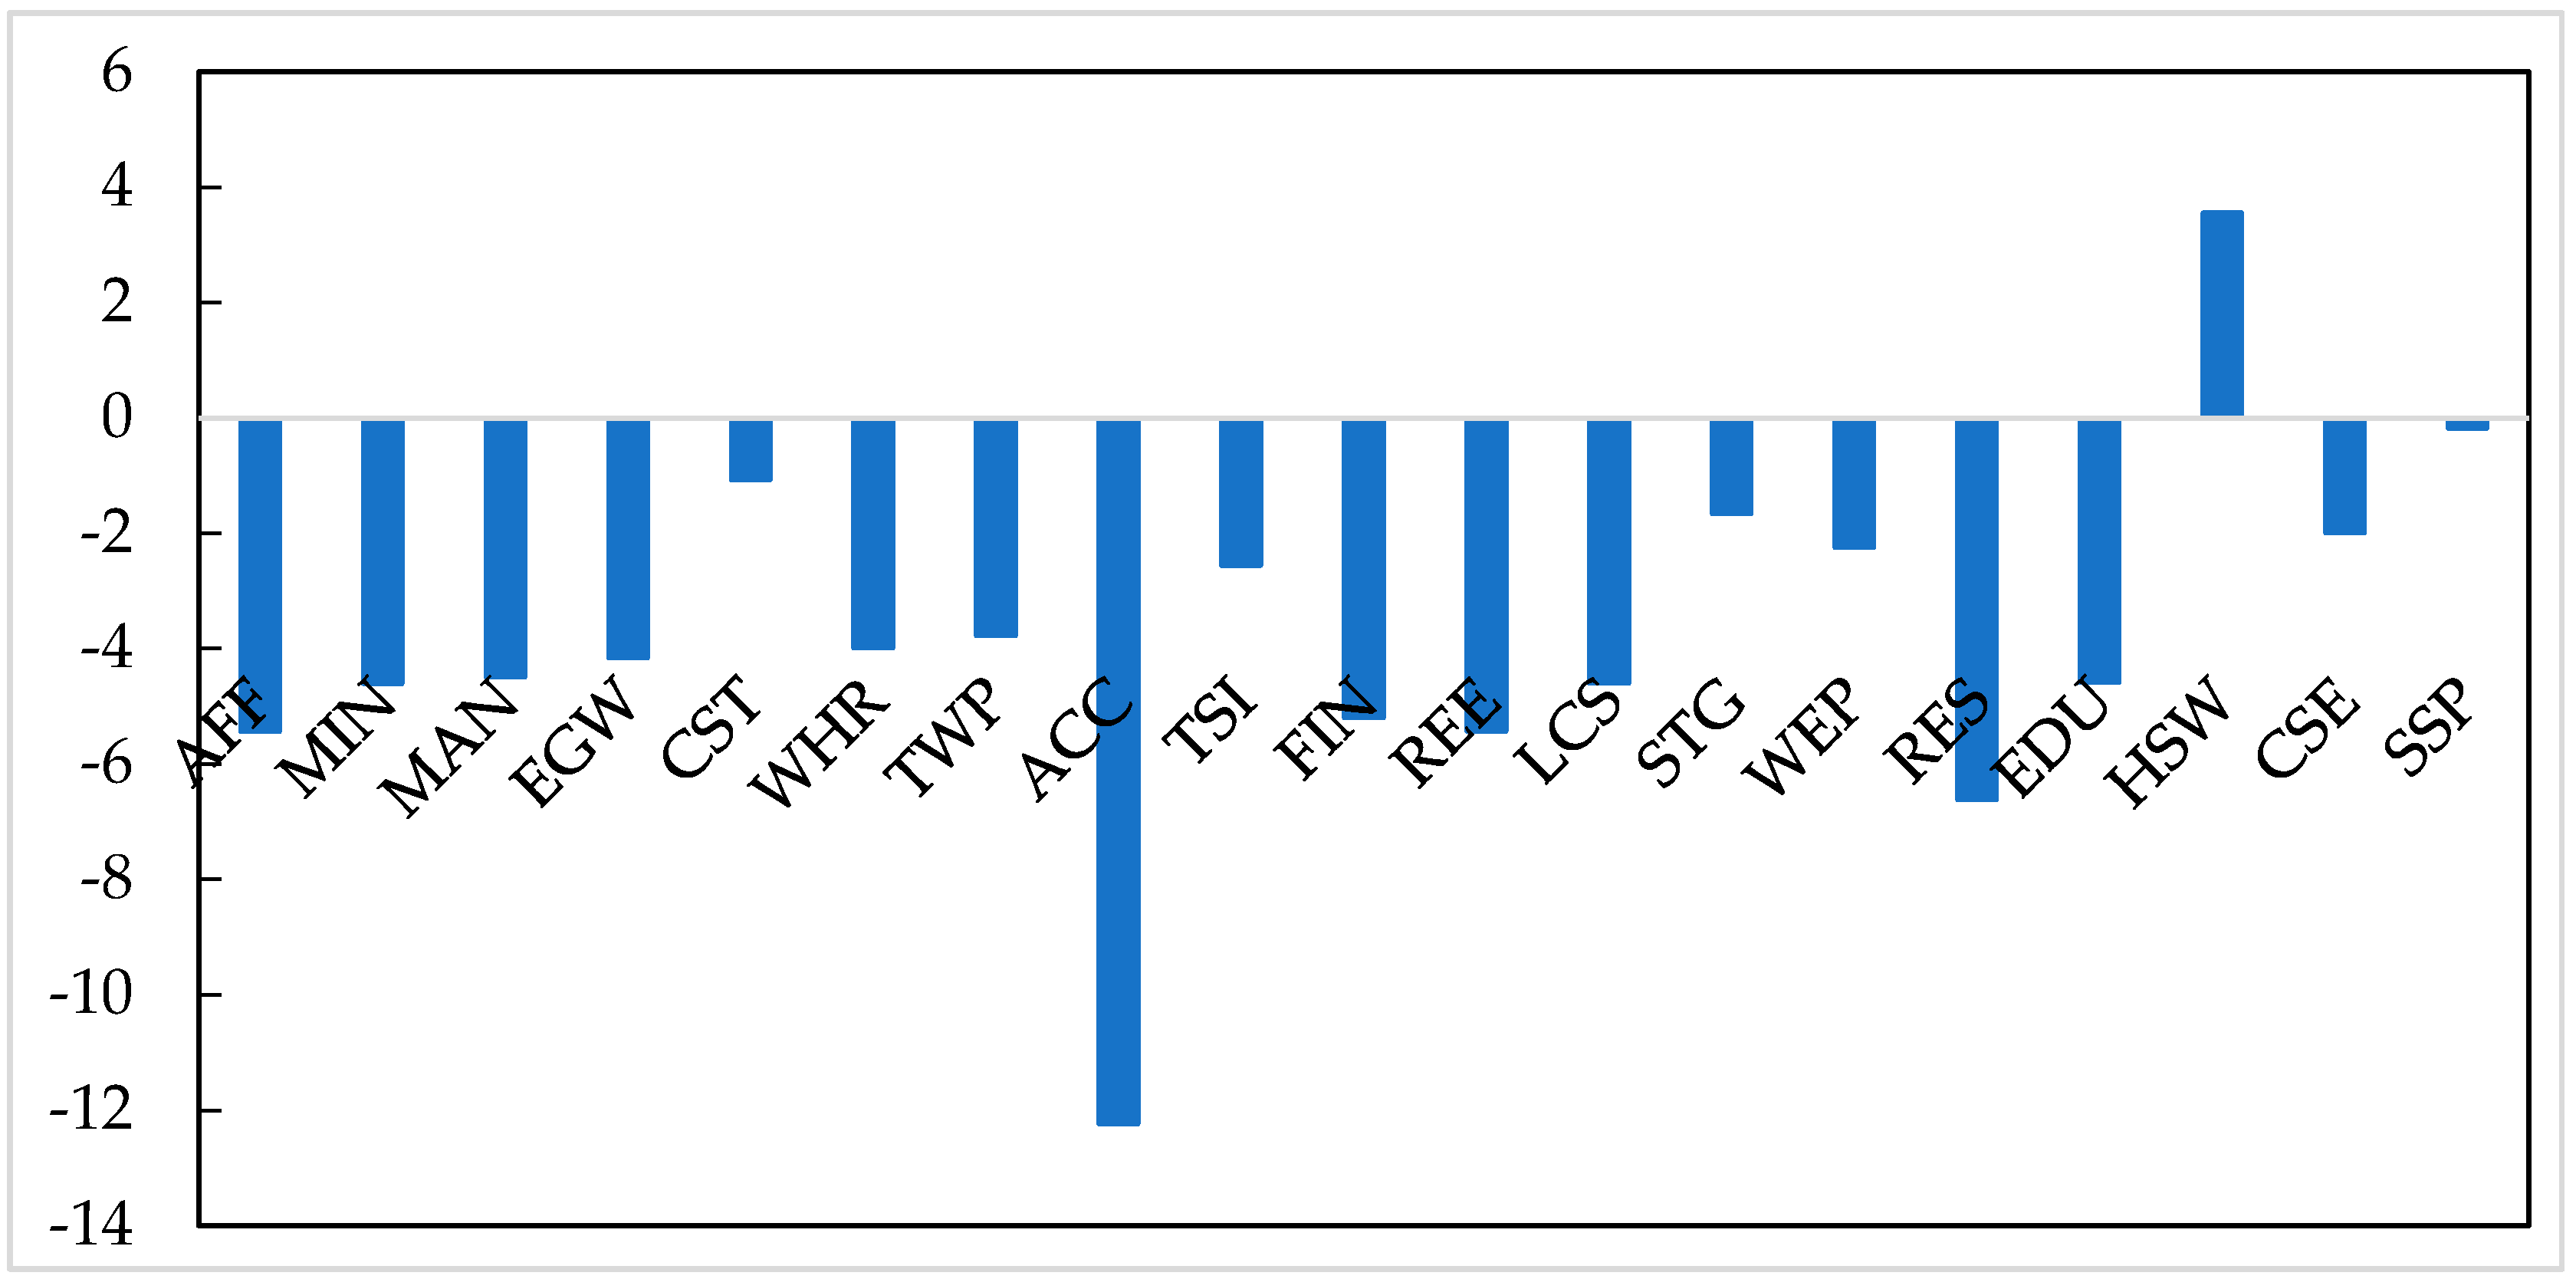
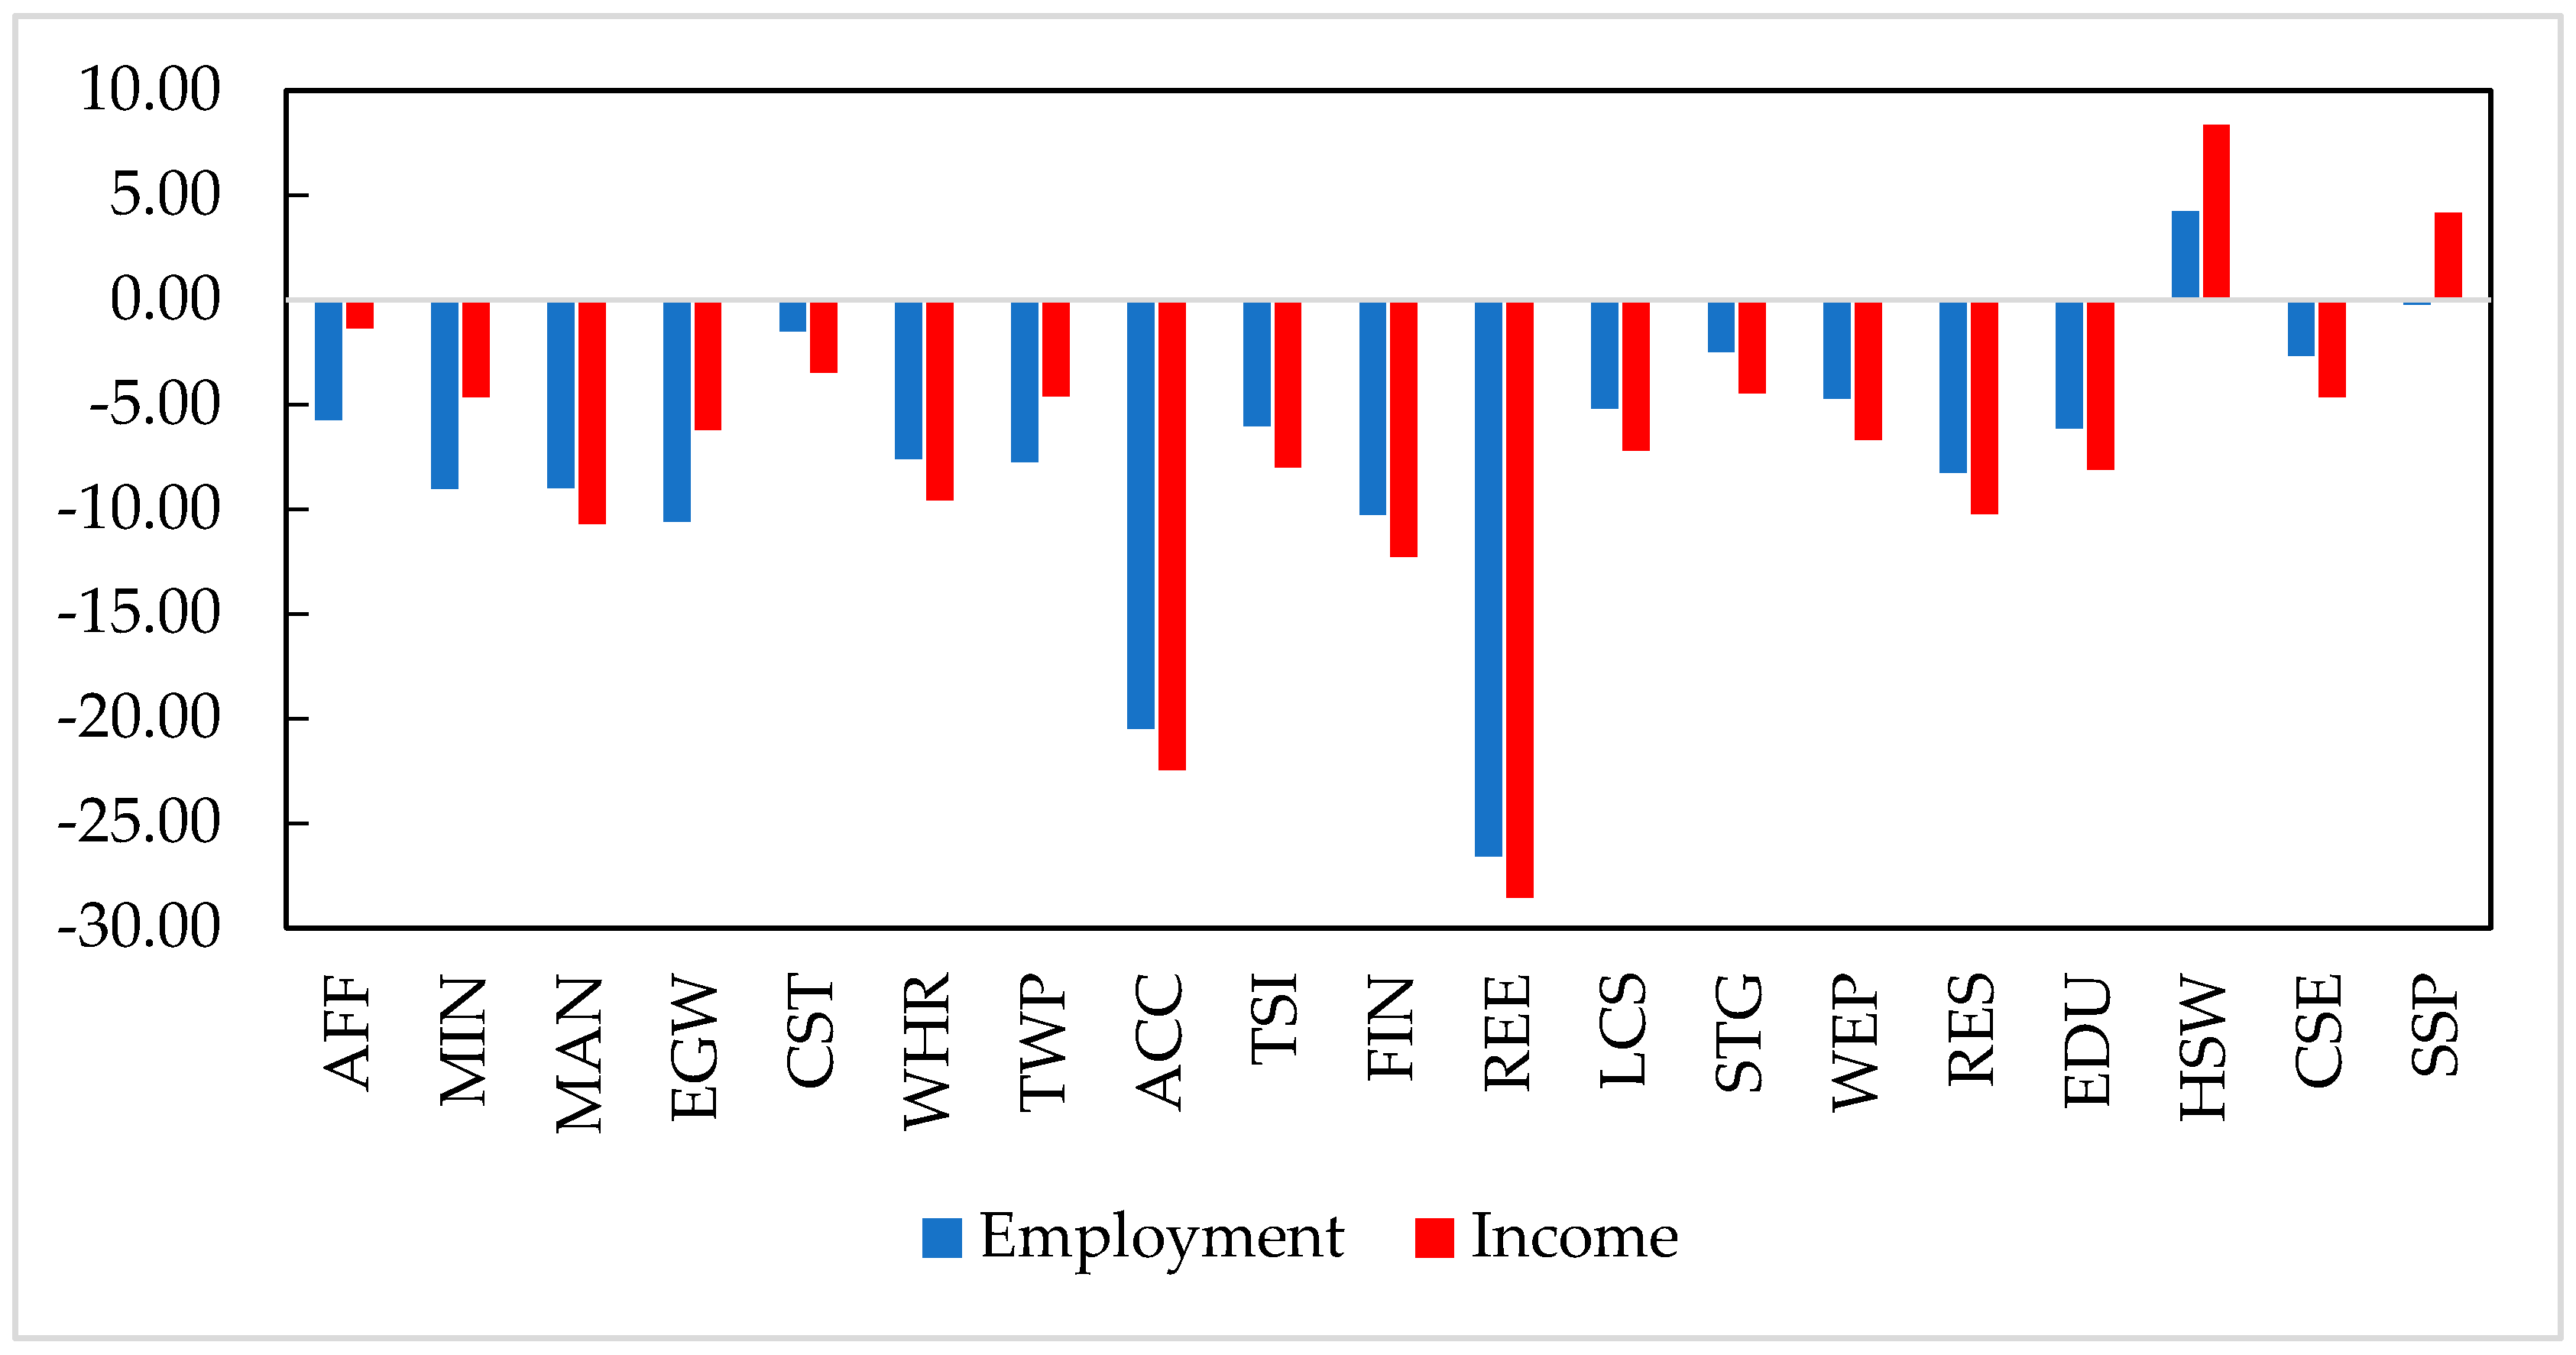
4.2. The Impact on Labourer Employment and Earnings of Different Sectors
4.3. The Impact on the Employment and Earnings of Different Labourers
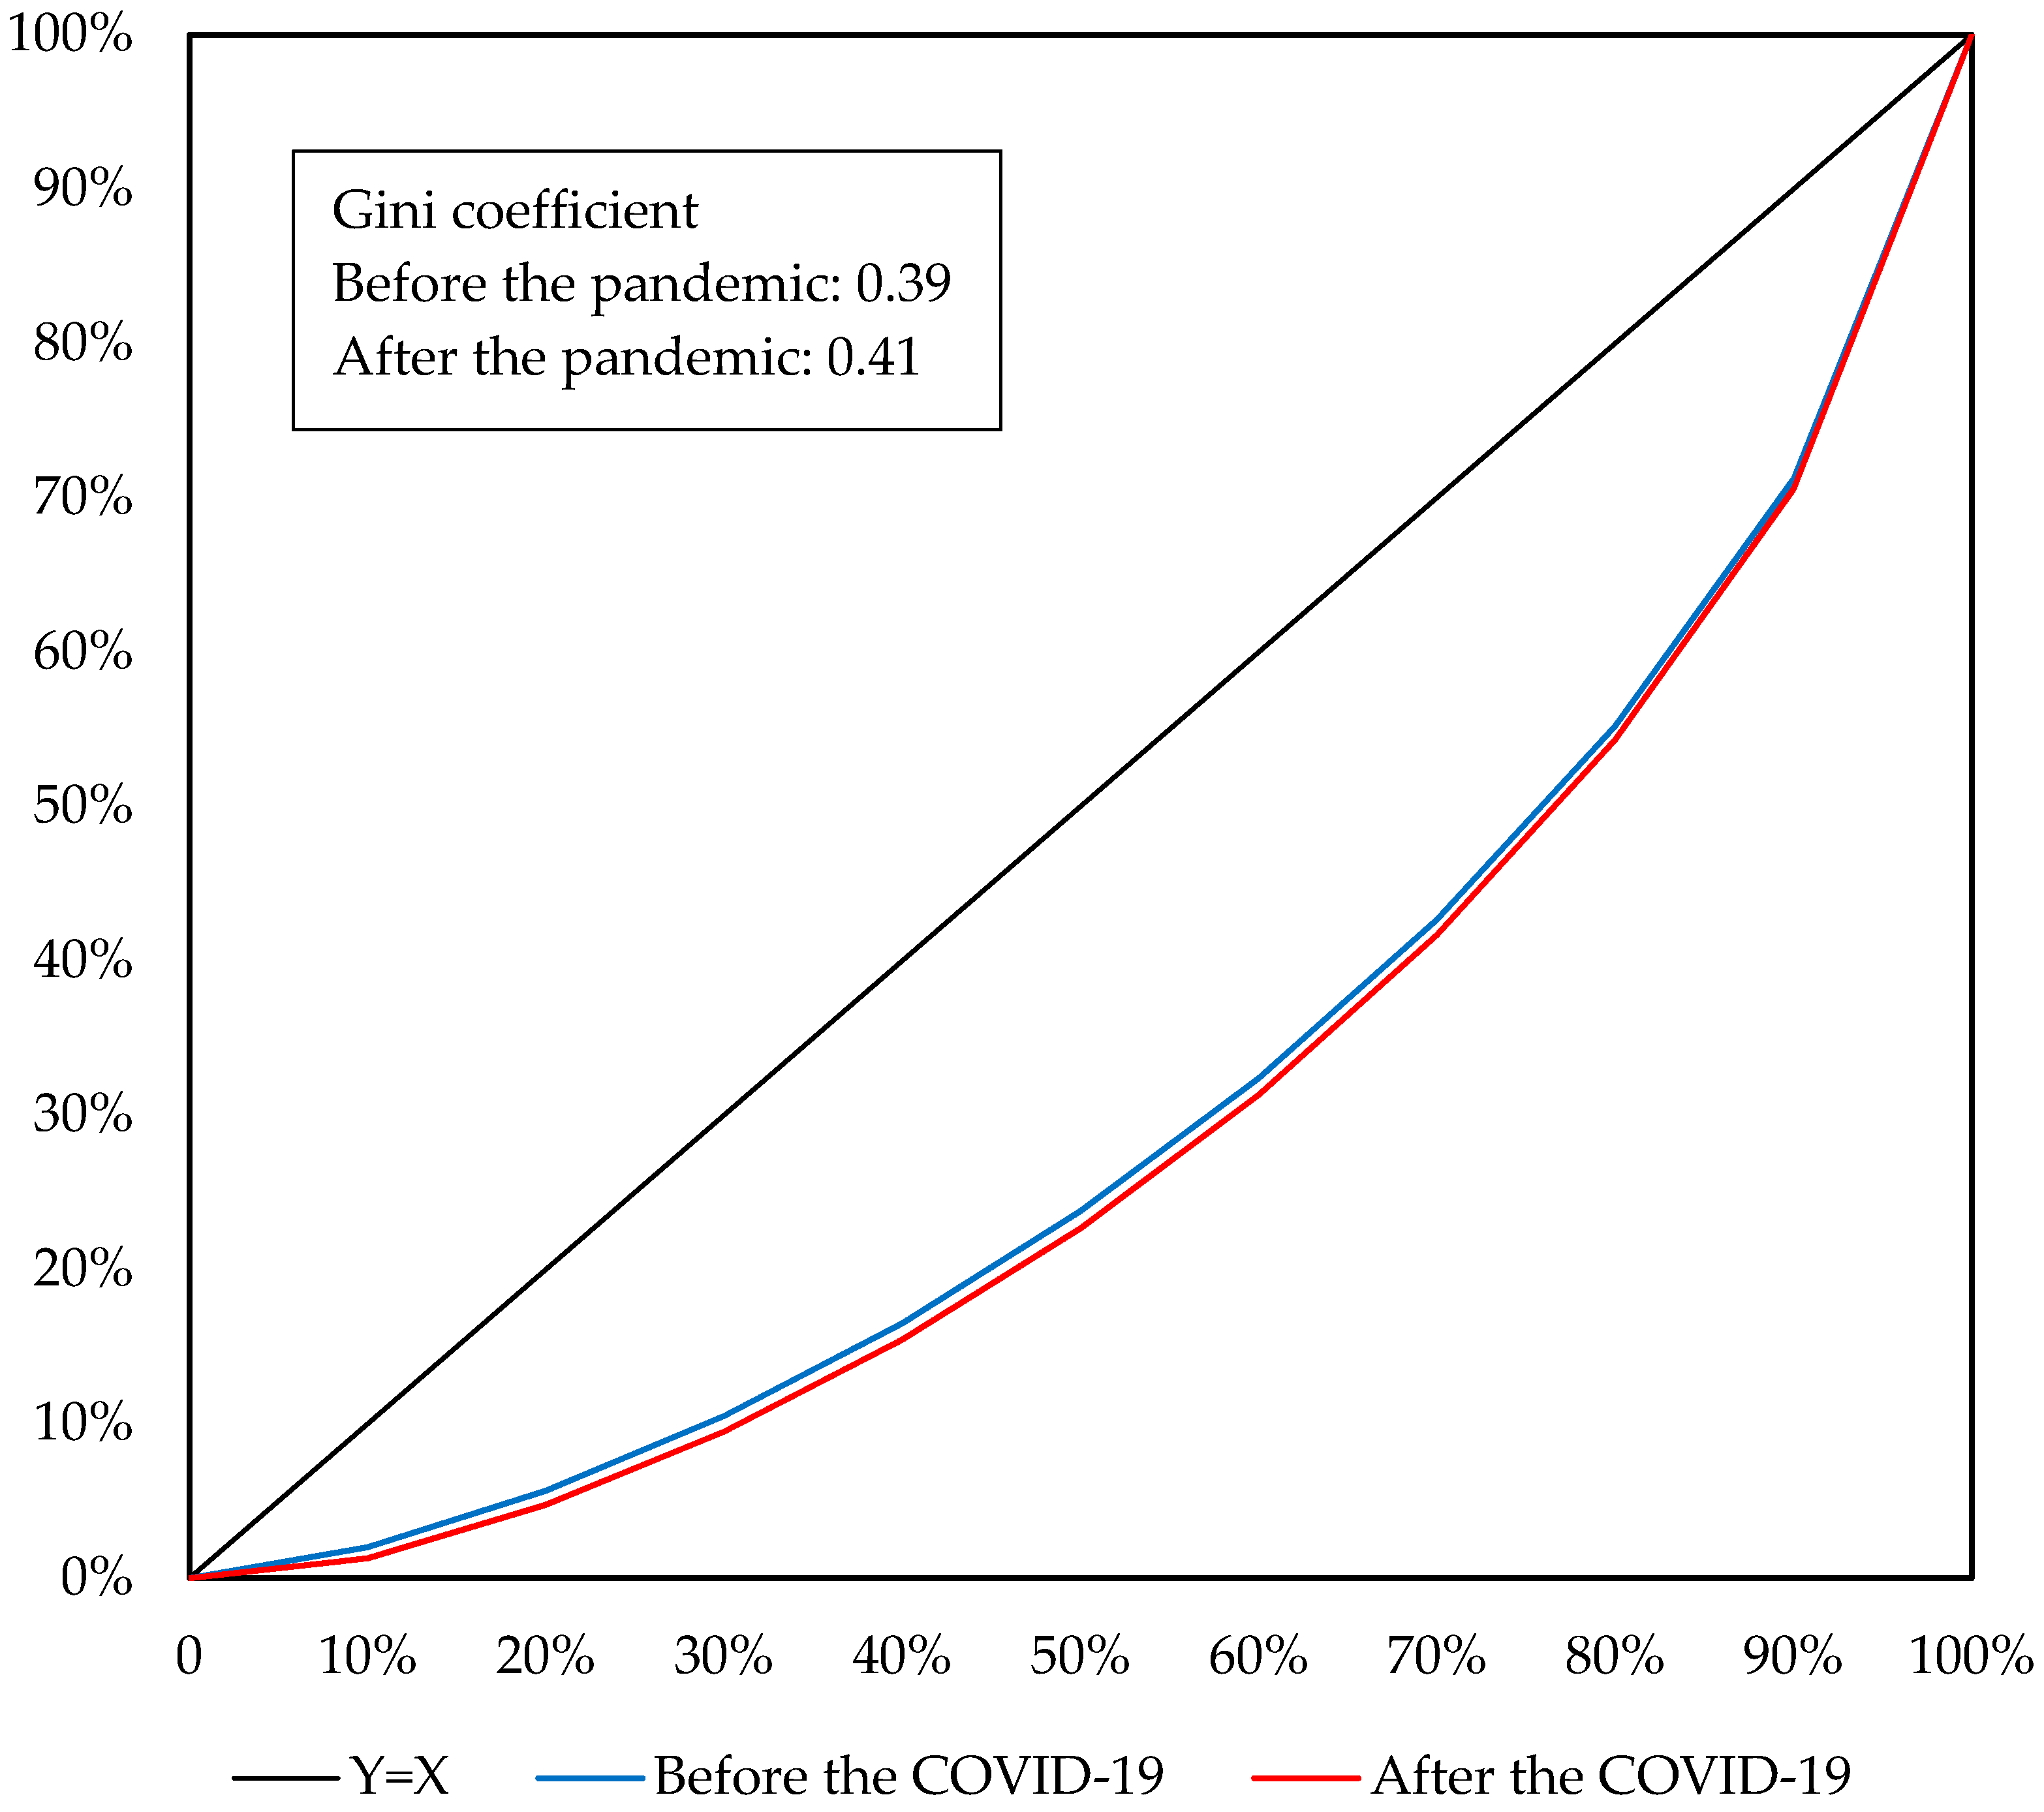
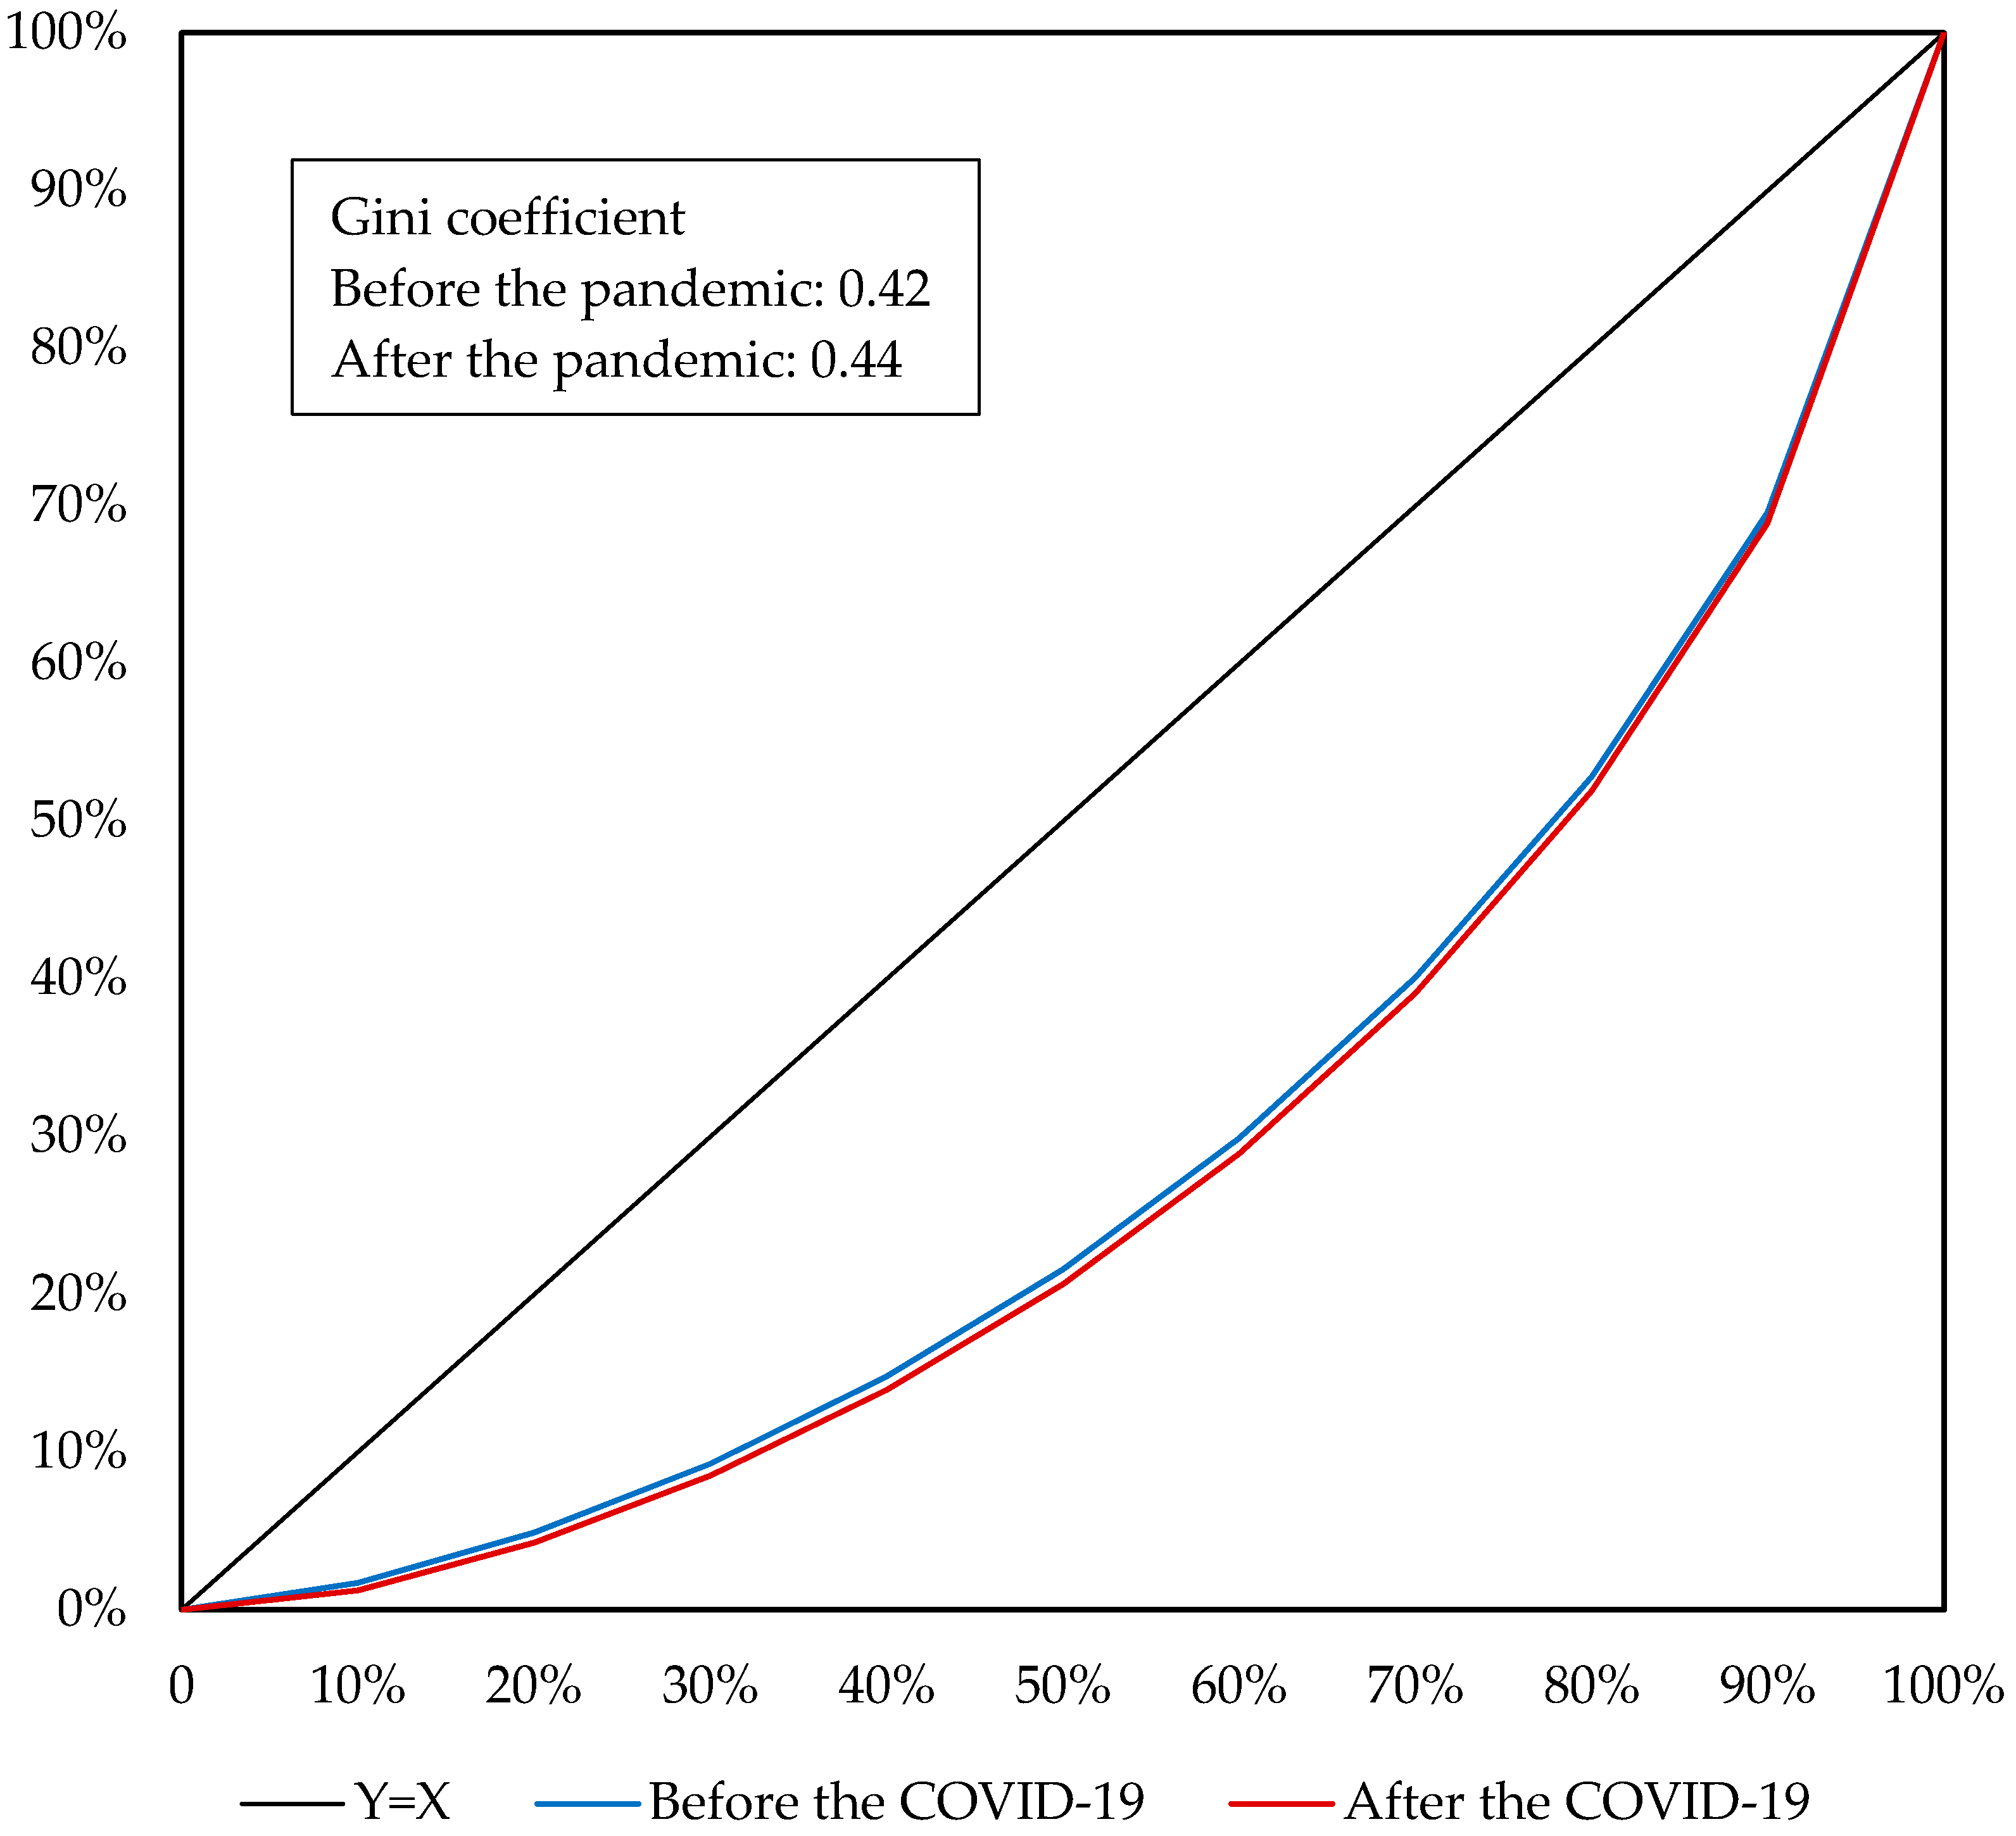
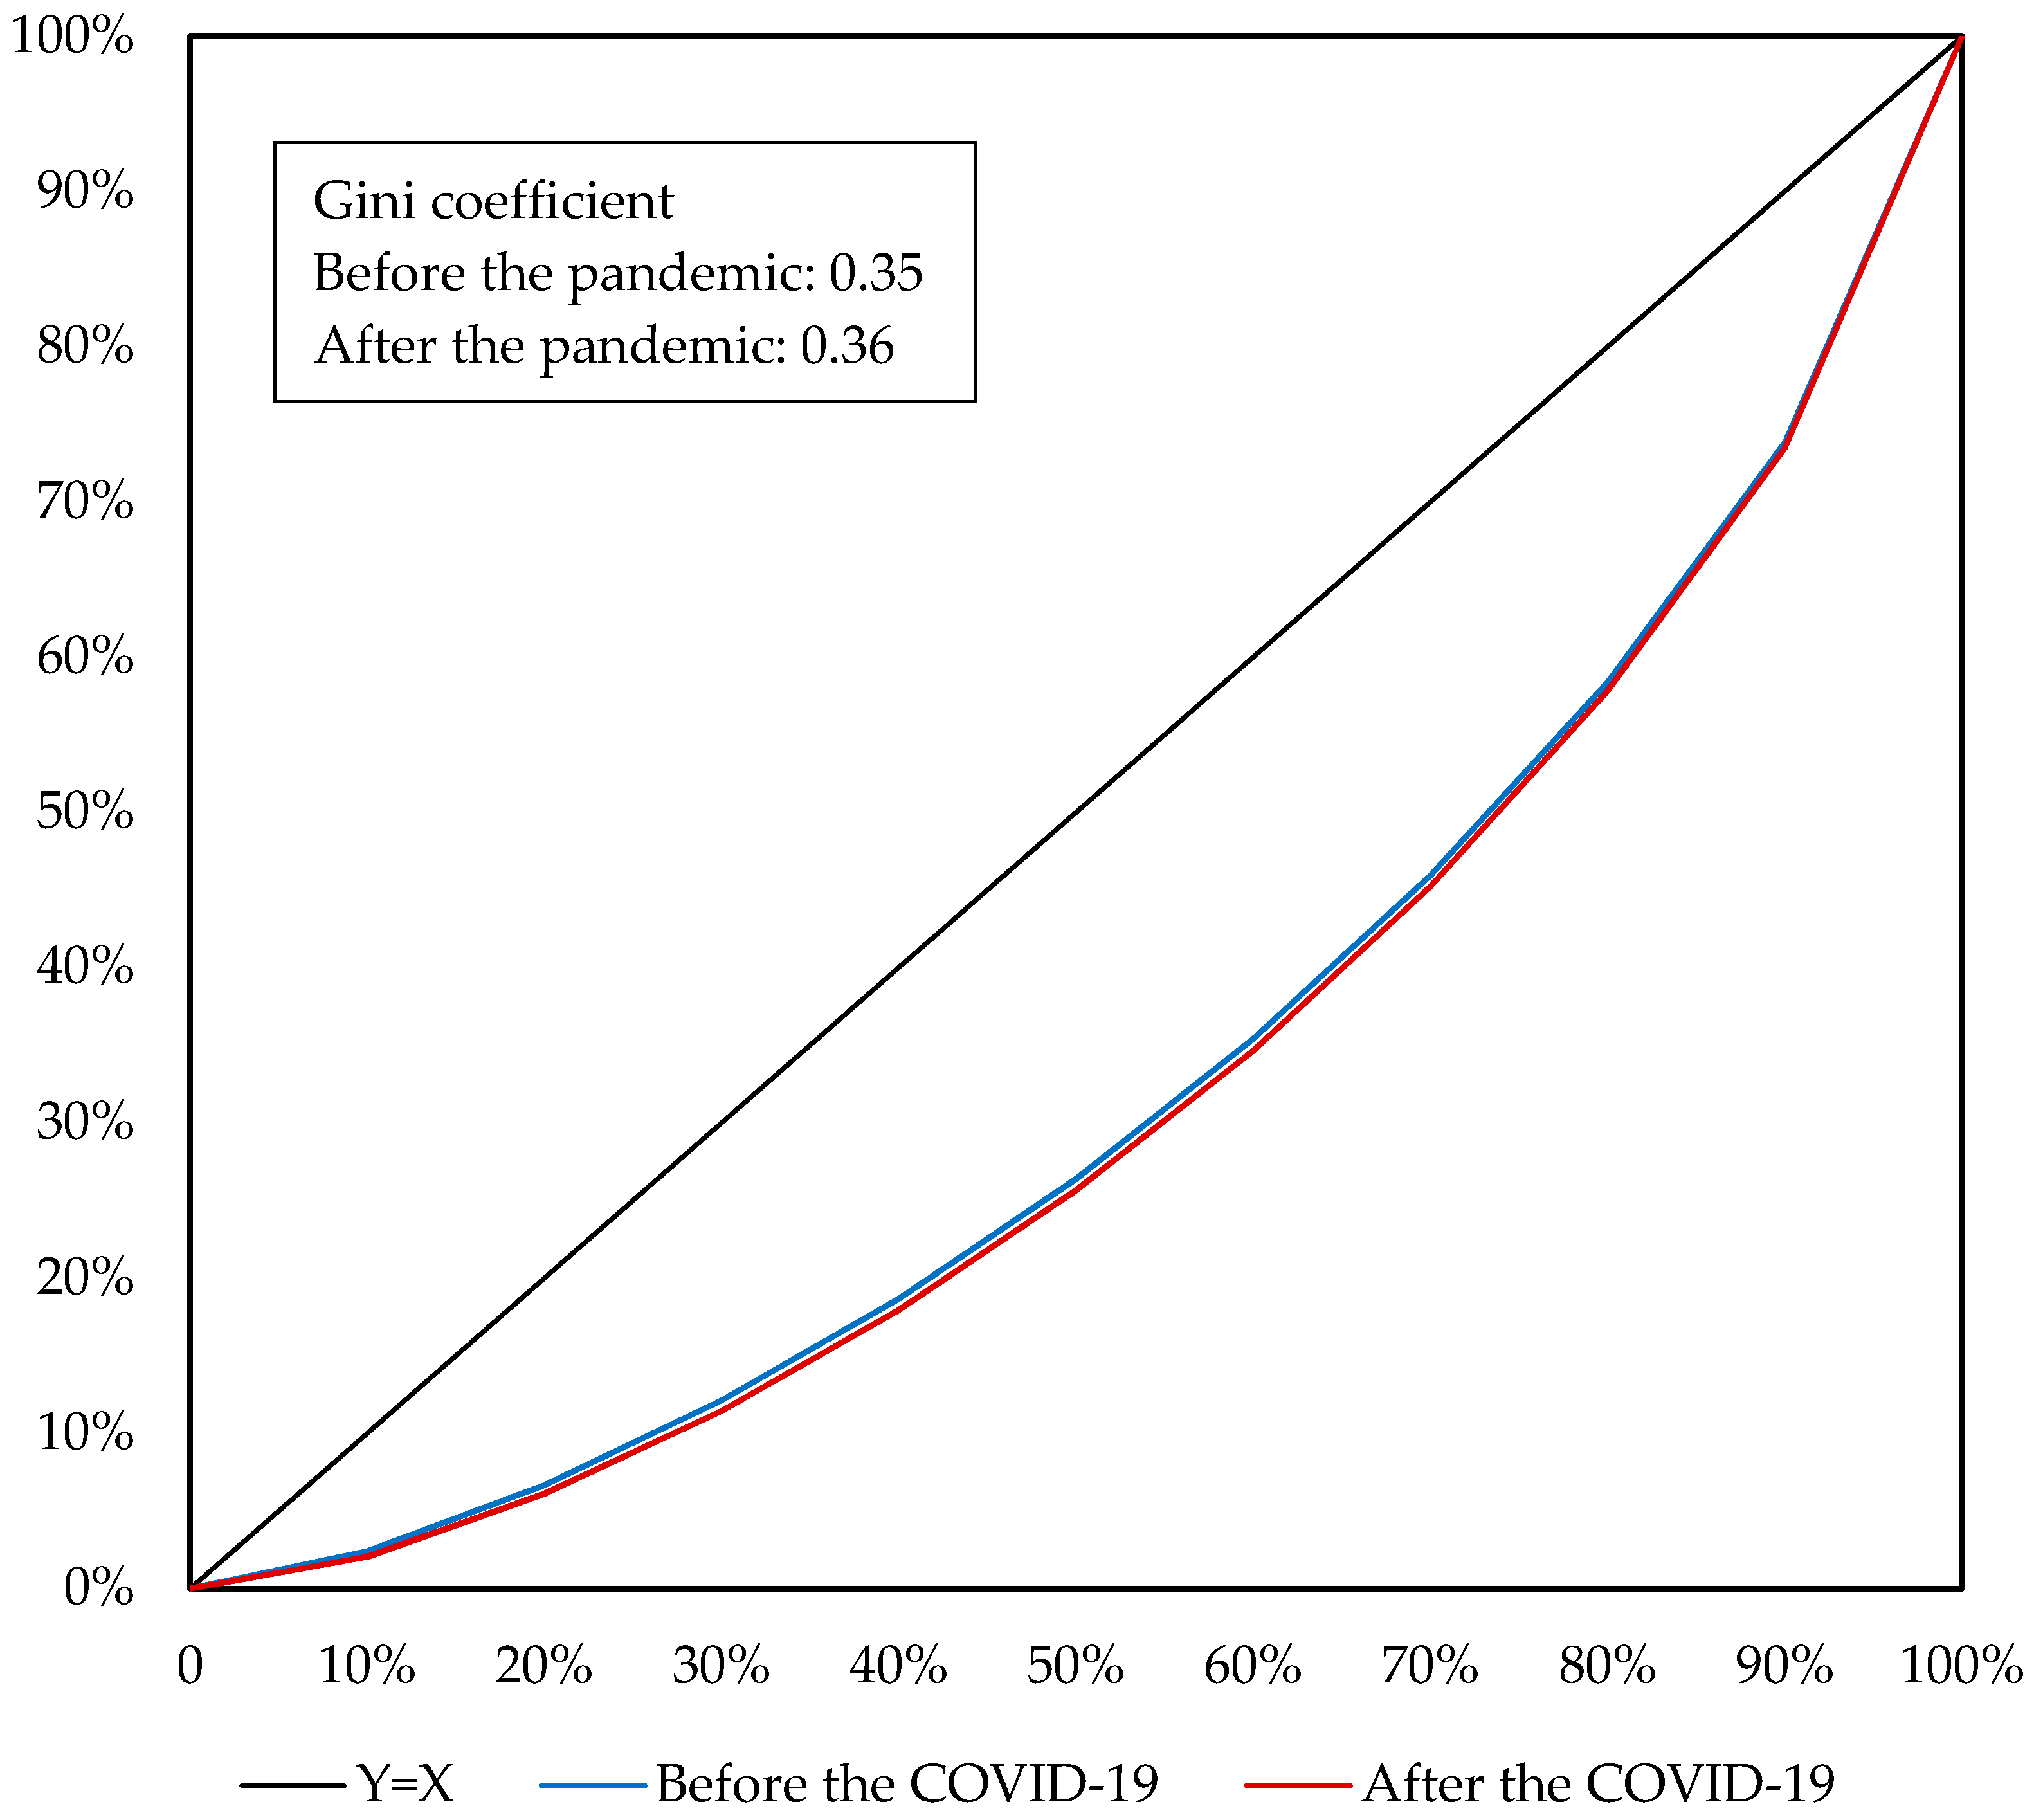
4.4. The Impact on Household Income and the Income Inequality
5. Conclusions and Discussions
Author Contributions
Funding
Informed Consent Statement
Data Availability Statement
Conflicts of Interest
Abbreviations
| COVID-19 | Coronavirus disease 2019 |
| CGE model | Computable general equilibrium model |
| GDP | Gross domestic product |
| CES | Constant elasticity of substitution |
| CPC 2010 | 6th Chinese Population Census |
| CHIP 2013 | Chinese Household Income Project 2013 |
| IMF | International Monetary Fund |
| CPI | Consumer price index |
Appendix A

| No. | Abbreviation | Aggregated Sectors |
|---|---|---|
| 1 | AFF | Agriculture |
| 2 | MIN | Mining |
| 3 | MAN | Manufacturing |
| 4 | EGW | Energy and water supply |
| 5 | CST | Construction |
| 6 | WHR | Trade |
| 7 | TWP | Transportation, storage, and post |
| 8 | ACC | Accommodation and food services |
| 9 | TSI | Information and technology services |
| 10 | FIN | Finance |
| 11 | REE | Real estate |
| 12 | LCS | Leasing and business services |
| 13 | STG | Scientific research and development |
| 14 | WEP | Water and environment administration |
| 15 | RES | Residential services |
| 16 | EDU | Education |
| 17 | HSW | Health and social welfare |
| 18 | CSE | Culture and entertainment |
| 19 | SSP | Public administration |
| No. | Original Sectors | Aggregated Sectors | No. | Original Sectors | Aggregated Sectors |
|---|---|---|---|---|---|
| 1 | Farming | AFF | 76 | Special-purpose machinery | MAN |
| 2 | Forestry | AFF | 77 | Vehicles | MAN |
| 3 | Livestock | AFF | 78 | Vehicle parts and accessories | MAN |
| 4 | Fishery | AFF | 79 | Railway transport equipment | MAN |
| 5 | Agricultural services | AFF | 80 | Boats and ships | MAN |
| 6 | Coal mining | MIN | 81 | Other transport equipment | MAN |
| 7 | Crude petroleum and natural gas | MIN | 82 | Generators | MAN |
| 8 | Ferrous metal ores mining | MIN | 83 | Power transmission equipment | MAN |
| 9 | Non-ferrous metal ores mining | MIN | 84 | Wire and electrical goods | MAN |
| 10 | Nonmetallic mineral mining | MIN | 85 | Batteries | MAN |
| 11 | Mining services | MIN | 86 | Household appliances | MAN |
| 12 | Grain processing | MAN | 87 | Other electrical equipment | MAN |
| 13 | Feed processing | MAN | 88 | Computer | MAN |
| 14 | Vegetable oil processing | MAN | 89 | Communication equipment | MAN |
| 15 | Sugar processing | MAN | 90 | Broadcasting and television equipment | MAN |
| 16 | Meat processing | MAN | 91 | Audiovisual apparatus | MAN |
| 17 | Aquatic processing | MAN | 92 | Electronic parts | MAN |
| 18 | Other food processing | MAN | 93 | Other electronic equipment | MAN |
| 19 | Convenience food products | MAN | 94 | Measuring instruments | MAN |
| 20 | Dairy products | MAN | 95 | Other manufacture | MAN |
| 21 | Flavouring products | MAN | 96 | Waste recycling | MAN |
| 22 | Other foods | MAN | 97 | Machinery and equipment repair | MAN |
| 23 | Alcohol | MAN | 98 | Electricity and steam supply | EGW |
| 24 | Soft drinks | MAN | 99 | Gas supply | EGW |
| 25 | Tea | MAN | 100 | Water supply | EGW |
| 26 | Tobacco | MAN | 101 | Construction of buildings | CST |
| 27 | Cotton and chemical fibre spinning | MAN | 102 | Civil engineering | CST |
| 28 | Wool spinning | MAN | 103 | Construction installation | CST |
| 29 | Silk fibre spinning | MAN | 104 | Construction decoration | CST |
| 30 | Knitted fabrics | MAN | 105 | Wholesale | WHR |
| 31 | Textile products | MAN | 106 | Retail | WHR |
| 32 | Textile wearing apparel | MAN | 107 | Railway passenger transport | TWP |
| 33 | Leather products | MAN | 108 | Railway freight transport | TWP |
| 34 | Footwear | MAN | 109 | Road passenger transport | TWP |
| 35 | Timber processing | MAN | 110 | Road freight transport | TWP |
| 36 | Furniture | MAN | 111 | Water passenger transport | TWP |
| 37 | Paper | MAN | 112 | Water cargo transport | TWP |
| 38 | Printing | MAN | 113 | Air passenger transport | TWP |
| 39 | Art and craft product | MAN | 114 | Air cargo transport | TWP |
| 40 | Culture and sport goods | MAN | 115 | Pipeline transport | TWP |
| 41 | Petroleum Products | MAN | 116 | Transport services | TWP |
| 42 | Coking | MAN | 117 | Storage | TWP |
| 43 | Basic chemicals | MAN | 118 | Post | TWP |
| 44 | Fertilizers | MAN | 119 | Accommodation | ACC |
| 45 | Pesticides | MAN | 120 | Food and Beverage Services | ACC |
| 46 | Paints | MAN | 121 | Telecommunication | TSI |
| 47 | Synthetic materials | MAN | 122 | Radio and television services | TSI |
| 48 | Special chemical products | MAN | 123 | Internet services | TSI |
| 49 | Daily-use chemical products | MAN | 124 | Software services | TSI |
| 50 | Pharmaceutical products | MAN | 125 | Information technology services | TSI |
| 51 | Chemical fibres | MAN | 126 | Financial services | FIN |
| 52 | Rubber products | MAN | 127 | Capital market services | FIN |
| 53 | Plastic products | MAN | 128 | Insurance | FIN |
| 54 | Cement and plaster | MAN | 129 | Real estate | REE |
| 55 | Plaster and cement products | MAN | 130 | Renting and leasing | LCS |
| 56 | Building materials | MAN | 131 | Business services | LCS |
| 57 | Glass | MAN | 132 | Research and development | STG |
| 58 | Porcelain products | MAN | 133 | Professional technique services | STG |
| 59 | Refractory products | MAN | 134 | Technique promotion services | STG |
| 60 | Nonmetallic mineral products | MAN | 135 | Water management | WEP |
| 61 | Steel casting | MAN | 136 | Environmental management | WEP |
| 62 | Steel products | MAN | 137 | Public facilities management | WEP |
| 63 | Iron products | MAN | 138 | Residential services | RES |
| 64 | Non-ferrous metal casting | MAN | 139 | Other services | RES |
| 65 | Non-ferrous metal products | MAN | 140 | Education | EDU |
| 66 | Metal products | MAN | 141 | Health care | HSW |
| 67 | Boiler | MAN | 142 | Social work | HSW |
| 68 | Metalworking machinery | MAN | 143 | Journalism and publishing | CSE |
| 69 | Lifting and handling equipment | MAN | 144 | Televisions and movies | CSE |
| 70 | Pump, valve, and compressor | MAN | 145 | Culture, art, and entertainment | CSE |
| 71 | Culture and office equipment | MAN | 146 | Sports | CSE |
| 72 | General-purpose machinery | MAN | 147 | Recreation | CSE |
| 73 | Mining and metallurgy machinery | MAN | 148 | Social Security | SSP |
| 74 | Chemical industry machinery | MAN | 149 | Public management | SSP |
| 75 | Agriculture machinery | MAN |
References
- Duan, H.; Wang, S.; Yang, C. Coronavirus: Limit Economic Damage. Nature 2020, 578, 515. [Google Scholar] [CrossRef] [PubMed] [Green Version]
- Guerrieri, V.; Lorenzoni, G.; Straub, L.; Werning, I. Macroeconomic Implications of COVID-19: Can Negative Supply Shocks Cause Demand Shortages? 1 April 2020. NBER Working Paper No. 26918. Available online: https://www.nber.org/papers/w26918 (accessed on 31 May 2021).
- Tan, L.; Wu, X.; Guo, J.; Santibanez-Gonzalez, E. Assessing the Impacts of COVID-19 on the Industrial Sectors and Economy of China. Risk Anal. 2021, 1–9. [Google Scholar] [CrossRef] [PubMed]
- NBSC (National Bureau of Statistics of China). Statistical Communique of the People’s Republic of China on the 2020 National Economic and Social Development. 28 February 2021. Available online: http://www.stats.gov.cn/tjsj/zxfb/202102/t20210227_1814154.html (accessed on 20 May 2021). (In Chinese)
- IMF (International Monetary Fund). World Economic Outlook Database. 11 October 2019. Available online: https://www.imf.org/en/Data#data (accessed on 20 May 2021).
- Bhandari, N.; Batra, K.; Upadhyay, S.; Cochran, C. Impact of COVID-19 on Healthcare Labor Market in the United States: Lower Paid Workers Experienced Higher Vulnerability and Slower Recovery. Int. J. Environ. Res. Public Health 2021, 18, 3894. [Google Scholar] [CrossRef] [PubMed]
- Bellotti, L.; Zaniboni, S.; Balducci, C.; Grote, G. Rapid Review on COVID-19, Work-Related Aspects, and Age Differences. Int. J. Environ. Res. Public Health 2021, 18, 5166. [Google Scholar] [CrossRef] [PubMed]
- Wang, H.; Dill, S.; Zhou, H.; Ma, Y.; Xue, S.; Smith, K.; Bowell, M.; Medina, A.; Lotalka, P.; Abby, C. Health, Economic, and Social Implications of COVID-19 for China’s Rural Population. Agric. Econ. 2021, 52, 495–504. [Google Scholar] [CrossRef]
- Imad, A.M. The effectiveness of social distancing in containing COVID-19. Appl. Econ. 2020, 52, 6292–6305. [Google Scholar] [CrossRef]
- Mongey, S.; Pilossoph, L.; Weinberg, A. Which Workers Bear the Burden of Social Distancing? 1 May 2020. NBER Working Paper No. 27085. Available online: https://www.nber.org/papers/w27085 (accessed on 20 May 2021).
- Hoehn-Velasco, L.; Silverio-Murillo, A.; Miyar, J. The long downturn: The impact of the great lockdown on formal employment. J. Bus. Econ. Manag. 2021, 115, 105983. [Google Scholar] [CrossRef]
- Graeber, D.; Kritikos, A.S.; Seebauer, J. COVID-19: A Crisis of the Female Self-Employed. J. Popul. Econ. 2021, 34, 1141–1187. [Google Scholar] [CrossRef]
- Mohapatra, S. Gender differentiated economic responses to crises in developing countries: Insights for COVID-19 recovery policies. Rev. Econ. Househ. 2021, 19, 291–306. [Google Scholar] [CrossRef]
- Ham, S. Explaining Gender Gaps in the South Korean Labor Market During the COVID-19 Pandemic. Fem Econ. 2021, 27, 133–151. [Google Scholar] [CrossRef]
- Albanesi, S.; Kim, J. Effects of the COVID-19 Recession on the US Labor Market: Occupation, Family, and Gender. J. Econ. Perspect. 2021, 35, 3–24. [Google Scholar] [CrossRef]
- Che, L.; Du, H.; Chan, K. Unequal Pain: A Sketch of the Impact of the COVID-19 Pandemic on Migrants’ Employment in China. Eurasian Geogr. Econ. 2020, 61, 448–463. [Google Scholar] [CrossRef]
- Qian, Y.; Fan, W. Who Loses Income During the COVID-19 Outbreak? Evidence from China. Res. Soc. Strat. Mobil. 2020, 68, 100522. [Google Scholar] [CrossRef]
- Brewer, M.; Tasseva, I.V. Did the UK Policy Response to COVID-19 Protect Household Incomes? J. Econ. Inequal. 2021, 19, 433–458. [Google Scholar] [CrossRef]
- Almeida, V.; Barrios, S.; Christl, M.; Poli, S.D.; Wielen, W. The Impact of COVID-19 on Households Income in the EU. J. Econ. Inequal. 2021, 19, 413–431. [Google Scholar] [CrossRef]
- Mara-José, G.; Belén, I.; Susan, O. Distributional impact of COVID-19: Regional inequalities in cases and deaths in Spain during the first wave. Appl. Econ. 2021, 53, 3636–3657. [Google Scholar] [CrossRef]
- FAO (Food and Agriculture Organization of the United Nations). Migrant Workers and the COVID-19 Pandemic. 7 April 2020. Available online: http://www.fao.org/3/ca8559en/CA8559EN.pdf (accessed on 31 May 2021).
- Zhang, D. The Impact of Lockdown Policies on Labor Market Outcomes of the Chinese Labor Force in 2020: Evidence Based on an Employee Tracking Survey. China Econ. Q. Int. 2021, 1, 344–360. [Google Scholar] [CrossRef]
- Coibion, O.; Gorodnichenko, Y.; Michael, W. Labor Markets during the COVID-19 Crisis: A Preliminary View. 16 April 2020. NBER Working Paper No. w27017. Available online: https://www.nber.org/papers/w27017 (accessed on 2 January 2022).
- Fang, H.; Ge, C.; Huang, H.; Li, H. Pandemics, Global Supply Chains, and Local Labor Demand: Evidence from 100 Million Posted Jobs in China. 1 November 2020. NBER Working Paper No. 28072. Available online: https://www.nber.org/papers/w28072 (accessed on 31 May 2021).
- Cai, F.; Zhang, D.; Liu, Y. The Impact of COVID-19 on the Chinese Labor Market—A Comprehensive Analysis Based on the Individual Tracking Survey. Econ. Res. J. 2021, 56, 4–21. (In Chinese) [Google Scholar]
- Cui, Q.; He, L.; Liu, Y.; Zheng, Y.; Zhou, M. The impacts of COVID-19 pandemic on China’s transport sectors based on the CGE model coupled with a decomposition analysis approach. Transp. Policy 2021, 103, 103–115. [Google Scholar] [CrossRef]
- Boukar, M.A.; Mbock, O.; Kilolo, J.M.M. The impacts of the COVID-19 pandemic on employment in Cameroon: A general equilibrium analysis. Afr. Dev. Rev. 2021, 33, 88–101. [Google Scholar] [CrossRef]
- Nguyen, H.; Nguyen, T.; Dam, V.; Long, H.; Le, H. COVID-19 Employment Crisis in Vietnam: Global Issue, National Solutions. Front. Public Health 2020, 8, 590074. [Google Scholar] [CrossRef] [PubMed]
- Zhang, Y.; Diao, X.; Chen, K.; Robinson, S.; Fan, S. Impact of COVID-19 on China’s Macroeconomy and Agri-Food System- an Economy-Wide Multiplier Model Analysis. China Agric. Econ. Rev. 2020, 12, 387–407. [Google Scholar] [CrossRef]
- Shen, J.; Shum, W.Y.; Cheong, T.S.; Wang, L. COVID-19 and Regional Income Inequality in China. Front. Public Health 2021, 9, 687152. [Google Scholar] [CrossRef]
- Hoshi, K.; Kasahara, H.; Makioka, R.; Suzuki, M.; Tanaka, S. The Heterogeneous Effects of COVID-19 on Labor Markets: People’s Movement and Non-Pharmaceutical Interventions. J. Jpn. Inst. Econ. 2022, 63, 101170. [Google Scholar] [CrossRef] [PubMed]
- Adam-Prassl, A.; Boneva, T.; Golin, M.; Rauh, C. Inequality in the Impact of the Coronavirus Shock: Evidence from Real Time Surveys. J. Public Econ. 2020, 189, 104245. [Google Scholar] [CrossRef]
- Ranchhod, V.; Daniels, R.C. Labour Market Dynamics in South Africa at the Onset of the COVID-19 Pandemic. S. Afr. J. Econ. 2021, 89, 44–62. [Google Scholar] [CrossRef] [PubMed]
- Kikuchi, S.; Kitao, S.; Mikoshiba, M. Who Suffers From the COVID-19 Shocks? Labor Market Heterogeneity and Welfare Consequences in Japan. J. Jpn. Inst. Econ. 2021, 59, 101117. [Google Scholar] [CrossRef]
- Gupta, A.; Zhu, H.; Doan, M.K.; Michuda, A.; Michuda, B. Economic Impacts of the COVID-19 Lockdown in a Remittance-Dependent Region. Am. J. Agr. Econ. 2021, 103, 466–485. [Google Scholar] [CrossRef]
- Dang, H.A.; Huynh, T.L.D.; Nguyen, M.H. Does the COVID-19 Pandemic Disproportionately Affect the Poor? Evidence from a Six-Country Survey. 18 November 2021. SSRN Working Paper No. 3627054. Available online: https://papers.ssrn.com/sol3/papers.cfm?abstract_id=3627054 (accessed on 2 January 2022).
- Delaporte, I.; Escobar, J.; Pea, W. The Distributional Consequences of Social Distancing on Poverty and Labour Income Inequality in Latin America and the Caribbean. J. Popul. Econ. 2021, 34, 1385–1443. [Google Scholar] [CrossRef]
- Luo, R.F.; Liu, C.F.; Gao, J.J.; Wang, T.Y.; Zhi, H.Y.; Shi, P.F. Impacts of the COVID-19 Pandemic on Rural Poverty and Policy Responses in China. J. Integr. Agric. 2020, 19, 2946–2964. [Google Scholar] [CrossRef]
- Pauw, K.; Leibbrandt, M. Minimum Wages and Household Poverty: General Equilibrium Macro–Micro Simulations for South Africa. World Dev. 2012, 40, 771–783. [Google Scholar] [CrossRef]
- Wang, X.; Chen, K.; Robinson, S.; Huang, Z. Will China’s Demographic Transition Exacerbate its Income Inequality? A CGE Modeling with Top-Down Microsimulation. 29 September 2016. IFPRI Discussion Paper 01560. Available online: https://ssrn.com/abstract=2847263 (accessed on 20 May 2021).
- Ahmed, A.; Bussolo, M.; Cruz, M.; Go, D.; Osorio-Rodarte, I. Global Inequality in a more educated world. J. Econ. Inequal. 2020, 18, 585–616. [Google Scholar] [CrossRef]
- Heyndrickx, C.; Vanheukelom, T.; Proost, S. Distributional impact of a regional road pricing scheme in Flanders. Transp. Res. Part A Policy Pract. 2021, 148, 116–139. [Google Scholar] [CrossRef]
- Bourguignon, F.; Robilliard, A.S.; Robinson, S. Representative versus real households in the macroeconomic modeling of inequality. In Frontiers in Applied General Equilibrium Modeling: In Honor of Herbert Scarf, 10th ed.; Cambridge University Press: Cambridge, UK, 2005; pp. 219–254. ISBN 9780511614330. [Google Scholar]
- van Ruijven, B.J.; O’Neill, B.C.; Chateau, J. Methods for including income distribution in global CGE models for long-term climate change research. Energy Econ. 2015, 51, 530–543. [Google Scholar] [CrossRef]
- Laborde, D.; Martin, W.; Vos, R. Impacts of COVID-19 on Global Poverty, Food security, and Diets: Insights from Global Model Scenario Analysis. Agric. Econ. 2021, 52, 375–390. [Google Scholar] [CrossRef]
- Duan, H.; Bao, Q.; Tian, K.; Wang, S.; Cai, Z. The Hit of the Novel Coronavirus Outbreak to China’s Economy. China Econ. Rev. 2021, 67, 101606. [Google Scholar] [CrossRef]
- Horridge, M. ORANI-G: A Generic Single-Country Computable General Equilibrium Model. 1 January 2005. COPS/IMPACT Working Paper No. OP-93OP-93. Available online: http://www.usp.br/nereus/wp-content/uploads/oranig06.pdf (accessed on 20 May 2021).
- Dixon, P.; Rimmer, M. Explaining a Dynamic CGE Simulation with a Trade-Focused Back-of-the-Envelope Analysis: The Effects of Ecommerce on Australia. 1 December 2002. COPS/ IMPACT General Paper G-136. Available online: https://www.copsmodels.com/ftp/workpapr/g-136.pdf (accessed on 20 May 2021).
- Cui, Q.; Liu, Y.; Ali, T.; Gao, J.; Chen, H. Economic and Climate Impacts of Reducing China’s Renewable Electricity Curtailment: A Comparison between CGE Models with Alternative Nesting Structures of Electricity. Energy Econ. 2020, 91, 104892. [Google Scholar] [CrossRef]
- Mu, Y.; Cai, W.; Evans, S.; Wang, C.; Roland-Holst, D. Employment Impacts of Renewable Energy Policies in China: A Decomposition Analysis Based on A CGE Modeling Framework. Appl. Energy 2018, 210, 256–267. [Google Scholar] [CrossRef]
- NBSC (National Bureau of Statistics of China). Input-Output Table of 2017. 1 December 2019. Available online: https://data.stats.gov.cn/ifnormal.htm?u=/files/html/quickSearch/trcc/trcc01.html&h=740 (accessed on 20 March 2021). (In Chinese)
- Savard, L. Poverty and Inequality Analysis within a CGE Framework: A Comparative Analysis of the Representative Agent and Micro-simulation Approaches. Dev. Policy Rev. 2005, 23, 313–322. [Google Scholar] [CrossRef]
- Debowicz, D. Poverty, Income Distribution and CGE Micro-simulation Modelling: Does Individual Behaviour Matter? 13 October 2012. SSRN Working Paper No. 2161403. Available online: https://ssrn.com/abstract=2161403 (accessed on 20 May 2021).
- McKibbin, W.; Fernando, R. The Global Macroeconomic Impacts of COVID-19: Seven Scenarios. Asian Econ. Pap. 2021, 20, 1–30. [Google Scholar] [CrossRef]
- Zheng, L.; Fan, Y.; Hu, B.; Cui, Q. The Aggregate and Structural Impacts of Public Health Event on Employment and Wage. Financ. Trade Econ. 2021, 4, 115–129. (In Chinese) [Google Scholar] [CrossRef]
- Zhou, M.; Liu, Y.; Zhang, J.; Cui, Q. COVID-19 and Its Macroeconomic Countermeasures in China: Impact and Effectiveness. J. Quant. Tech. Econ. 2021, 37, 24–41. (In Chinese) [Google Scholar] [CrossRef]
- Gimeno-Miguel, A.; Bliek-Bueno, K.; Poblador-Plou, B.; Carmona-Pírez, J.; Poncel-Falcó, A.; González-Rubio, F.; Ioakeim-Skoufa, I.; Pico-Soler, V.; Aza-Pascual-Salcedo, M.; Prados-Torres, A.; et al. Chronic Diseases Associated with Increased Likelihood of Hospitalization and Mortality in 68,913 COVID-19 Confirmed Cases in Spain: A population-based cohort study. PLoS ONE 2021, 16, e0259822. [Google Scholar] [CrossRef] [PubMed]
- NBSC (National Bureau of Statistics of China). Poverty Monitoring Report of Rural China; China Statistics Press: Beijing, China, 2021; pp. 1–12. ISBN 9787503793974. (In Chinese)
- Long, W.; Zeng, J.; Sun, T. Who Lost Most Wages and Household Income during the COVID-19 Pandemic in Poor Rural China? China World Econ. 2021, 29, 95–116. [Google Scholar] [CrossRef]
- Liu, Y.; Cui, Q.; Liu, Y.; Zhang, J.; Zhou, M.; Tariq, A.; Yang, L.; Feng, K.; Klaus, H.; Li, X. Countermeasures against economic crisis from COVID-19 pandemic in China: An analysis of effectiveness and trade-offs. Struct. Chang. Econ. Dyn. 2021, 59, 482–495. [Google Scholar] [CrossRef]
- Chen, Y.; Tan, Y.; Andreas, G. Rural Vulnerability, Migration, and Relocation in Mountain Areas of Western China: An Overview of Key Issues and Policy Interventions. Chin. J. Popul. Resour. Environ. 2021, 19, 110–116. [Google Scholar] [CrossRef]
- Jiao, W. Analyzing multidimensional measures of poverty and their influences in China’s Qinba Mountains. Chin. J. Popul. Resour. Environ. 2020, 18, 214–221. [Google Scholar] [CrossRef]


| Region | Gender | Education | Employment | Earnings | Region | Gender | Education | Employment | Earnings |
|---|---|---|---|---|---|---|---|---|---|
| Urban | Male | E1 | −7.00 | −7.26 | Rural | Male | E1 | −6.02 | −3.79 |
| E2 | −7.48 | −8.02 | E2 | −6.39 | −5.33 | ||||
| E3 | −7.14 | −7.46 | E3 | −6.49 | −6.00 | ||||
| E4 | −6.02 | −5.94 | E4 | −5.70 | −5.51 | ||||
| E5 | −5.47 | −5.54 | E5 | −5.53 | −5.45 | ||||
| E6 | −5.25 | −6.22 | E6 | −6.03 | −6.14 | ||||
| Female | E1 | −8.00 | −8.16 | Female | E1 | −6.51 | −3.74 | ||
| E2 | −8.57 | −9.45 | E2 | −7.36 | −5.91 | ||||
| E3 | −7.62 | −8.11 | E3 | −6.86 | −6.02 | ||||
| E4 | −5.72 | −5.82 | E4 | −5.71 | −5.67 | ||||
| E5 | −5.56 | −5.94 | E5 | −5.40 | −5.60 | ||||
| E6 | −5.32 | −6.40 | E6 | −6.01 | −6.21 |
| Income Groups | Nation | Urban Residents | Rural Residents |
|---|---|---|---|
| [0%, 10%) | −17.48 | −11.84 | −20.11 |
| [10%, 20%) | −9.79 | −8.14 | −10.31 |
| [20%, 30%) | −7.94 | −6.39 | −9.24 |
| [30%, 40%) | −7.01 | −6.21 | −7.51 |
| [40%, 50%) | −7.45 | −5.39 | −7.01 |
| [50%, 60%) | −6.76 | −5.12 | −6.93 |
| [60%, 70%) | −6.56 | −4.50 | −7.23 |
| [70%, 80%) | −5.78 | −4.37 | −6.91 |
| [80%, 90%) | −5.12 | −4.55 | −6.50 |
| [90%, 100%] | −4.78 | −4.81 | −5.70 |
| Average | −7.87 | −6.13 | −8.75 |
Publisher’s Note: MDPI stays neutral with regard to jurisdictional claims in published maps and institutional affiliations. |
© 2022 by the authors. Licensee MDPI, Basel, Switzerland. This article is an open access article distributed under the terms and conditions of the Creative Commons Attribution (CC BY) license (https://creativecommons.org/licenses/by/4.0/).
Share and Cite
Zhang, Q.; Zhang, X.; Cui, Q.; Cao, W.; He, L.; Zhou, Y.; Li, X.; Fan, Y. The Unequal Effect of the COVID-19 Pandemic on the Labour Market and Income Inequality in China: A Multisectoral CGE Model Analysis Coupled with a Micro-Simulation Approach. Int. J. Environ. Res. Public Health 2022, 19, 1320. https://doi.org/10.3390/ijerph19031320
Zhang Q, Zhang X, Cui Q, Cao W, He L, Zhou Y, Li X, Fan Y. The Unequal Effect of the COVID-19 Pandemic on the Labour Market and Income Inequality in China: A Multisectoral CGE Model Analysis Coupled with a Micro-Simulation Approach. International Journal of Environmental Research and Public Health. 2022; 19(3):1320. https://doi.org/10.3390/ijerph19031320
Chicago/Turabian StyleZhang, Qi, Xinxin Zhang, Qi Cui, Weining Cao, Ling He, Yexin Zhou, Xiaofan Li, and Yunpeng Fan. 2022. "The Unequal Effect of the COVID-19 Pandemic on the Labour Market and Income Inequality in China: A Multisectoral CGE Model Analysis Coupled with a Micro-Simulation Approach" International Journal of Environmental Research and Public Health 19, no. 3: 1320. https://doi.org/10.3390/ijerph19031320
APA StyleZhang, Q., Zhang, X., Cui, Q., Cao, W., He, L., Zhou, Y., Li, X., & Fan, Y. (2022). The Unequal Effect of the COVID-19 Pandemic on the Labour Market and Income Inequality in China: A Multisectoral CGE Model Analysis Coupled with a Micro-Simulation Approach. International Journal of Environmental Research and Public Health, 19(3), 1320. https://doi.org/10.3390/ijerph19031320