Article

Social Group Differences in the Exposure Risk of COVID-19: A Case Study in Beijing, China

1
School of Public Policy and Management, University of Chinese Academy of Sciences, Beijing 100190, China
2
Sino-Danish College, University of Chinese Academy of Sciences, Beijing 100190, China
*
Author to whom correspondence should be addressed.
Int. J. Environ. Res. Public Health 2022, 19(3), 1121; https://doi.org/10.3390/ijerph19031121
Submission received: 18 November 2021 / Revised: 27 December 2021 / Accepted: 11 January 2022 / Published: 20 January 2022
(This article belongs to the Topic Burden of COVID-19 in Different Countries)

Abstract

:
Taking Beijing as a case, this paper conducted a survey to collect the characteristics of residents’ daily activities, including the mode of frequency and duration of travel, the type and environment of activities, and the duration and frequency of activities. We calculated the COVID-19 exposure risk of residents in different activities based on the exposure risk formula; the influencing factors of residents’ exposure risk were analyzed by regression analysis. The variance of residents’ COVID-19 exposure risk was calculated by coefficient of variation. The main conclusions are as follows: (1) There are differences in activity types of COVID-19 exposure risk, which are survival activity, daily activity and leisure activity from high to low. (2) There are differences in populations of COVID-19 exposure risk. Education level, occupation and income are the main factors affecting residents’ COVID-19 exposure risk. (3) There is internal inequity in the risk of COVID-19 exposure. The exposure risk was higher on work days than on rest days. Health inequities at work are highest on both work days and rest days. Among the different population characteristics, male, 31–40 years old, married, with a high school education, income level of 20,001–25,000 yuan, with a non-local rural hukou, rental housing, farmers, three generations or more living together have a greater degree of COVID-19 exposure risk.

1. Introduction

1.1. Research Background

Since December 2019, the COVID-19 epidemic has become a world public health event, threatening the safety of human lives and bringing an unprecedented impact on the economic and social development of various countries [1]. In China, although COVID-19 has been under control overall, sporadic cases are still occurring, and the risk of localized outbreaks is of great concerns [2]. As the capital of China, Beijing is the center of national transportation. With more than 20 million permanent residents and a large scale of floating population, Beijing is under great pressure in the epidemic prevention. High density of population allocation makes the control situation more serious and complicated.
Studies show that the main route of transmission of novel coronavirus is respiratory droplet transmission and close contact transmission, and such transmission characteristics and asymptomatic infection have exposed everyone to the risk of COVID-19 infection [3]. However, because the disparity between different social group, individuals differ in their demographic characteristics and daily activity behaviors, which may also cause stratification phenomenon of the exposure risk for COVID-19. In other words, in the context of COVID-19, there may be social problems of health inequity among individuals.

1.2. Literature Review

Exposure refers to the factors that affect and may affect the occurrence of diseases and people’s health status, including individual characteristics, living habits, and various micro and macro environments on which human beings depend for survival [4]. Research on COVID-19 exposure has focused on healthcare workers, a high-risk exposure group [5,6,7,8]. Factors affecting COVID-19 exposure in healthcare workers include the nature of work, workplace, distance of contact with patients, and duration of exposure [5]. Among hospital workers, staff in isolation wards and fever clinics are at high risk for COVID-19 exposure, while administrative logistics staff and other positions in hospitals are generally at low risk for COVID-19 exposure. Overall, people engaged in COVID-19 related work are at higher risk [8,9,10]. In addition, studies have confirmed that having a health care worker in the family is associated with a higher risk of exposure [6].
As the focus of urban geography study, the research of residents’ spatiotemporal behavior fully considers the impact of daily human activities on urban planning and management [11]. In terms of the research content, spatiotemporal behavior research mainly focusses on activities such as residents’ commuting [12], shopping [13,14], leisure [15], and migration [16].
Margaret Whitehead believes that health equity refers to creating equal health opportunities to reduce health differences to the lowest possible level, namely, reflecting the goal of social justice in terms of population health [17]. The factors affecting health equity are very wide, mainly including income [18,19,20,21], occupation [22,23], education level [21,22], living conditions [23]. Furthermore, sociodemographic characteristics such as gender and age were also considered [18,24]. For measuring health inequality, there are mainly range method [25,26], Lorenz curve and Gini coefficient method [25], difference coefficient method [25]. During COVID-19, research on health inequities indicates that ethnic minorities are suffering higher rates of infection and death [26,27,28,29,30,31,32]. In addition, studies have shown that some vulnerable groups have suffered more social impact from COVID-19, such as unemployment [33,34].
Focusing research on COVID-19, while some have studied the risk of exposure to COVID-19 among healthcare workers, few have studied the risk of exposure to COVID-19 among the general public. Studies of the public have focused more on their rates of infection, death, or impact from COVID-19. Compared to the studies of globally influenced COVID-19, the studies of other epidemics such as SARS are less. When tracing the literature of other types of infectious diseases and exposure risks, we found rare studies about the exposure risk of the public. In fact, paying more attention to the exposure risk of public before infection can prevent more infections beforehand. Therefore, it is necessary to acknowledge which group of people has the most possibility to become infected before we take the anti-epidemic measurement and arrange limited resources. Previous studies focus either on particular group of people in the background of infectious disease, or on the inequity of social and economic status and public resource arrangement. The study of inequity of exposure risks to infectious diseases among different groups is rare. The varied exposure risk caused by different kinds of daily activities also deserve exploration.
Taking Beijing as an example, this paper aims to explore the risk of exposure to COVID-19 among different groups of peoples under the condition of uncertainty, and further study the inequities among different social groups concerning the health security. Firstly, we investigated the features of different daily activities among different social groups, which is also separately analyzed on work days and rest days. Secondly, we calculated the exposure risk of different activities by combining the residents’ spatiotemporal behavior and the surrounding environmental features. Thirdly, we calculated and compared the equity of the exposure risk to COVID-19 between different social groups. Our research may reveal the inequity of different social groups when it comes to the exposure risk to COVID-19 under uncertainty, and offer policymakers a reference when they are allocating anti-epidemic resources.

1.3. Study Area

This paper takes Beijing as a research city and uses questionnaire method to collect data of spatio-temporal behavior and social demographic information of Beijing residents.
Beijing is the world’s most populous national capital city, with over 21 million residents within an administrative area of 16,410.5 km2 [35]. It is located in Northern China and is governed as a municipality under the direct administration of the State Council with 16 urban, suburban, and rural districts. In 2020, Beijing’s annual GDP reached 3610.26 billion yuan [36].
Study have shown that inhalation is often the most relevant transmission mode in indoor environments [37]. Therefore, indoor COVID-19 prevention and control is particularly important. In February 2020, five government departments in Beijing jointly issued an epidemic prevention policy in public places, requiring people entering public places to wear masks and scan a health code to register [38]. This rule is strictly enforced in any indoor public place in Beijing. People will not be allowed to enter any indoor spaces without masks and a health code (a QR code that indicates whether people have visited high-risk areas).

2. Method

The method used in this paper is questionnaire survey, using firsthand data to reveal the inequity in COVID-19. The calculation methods of some core indicators are as follows.

2.1. Measure of Risk of Exposure to COVID-19

C E x = i Φ w f i x u , θ , μ i x , t i x , ω i x + f i y u , θ , v , t i y , μ i y , ω i y + j Φ r f j x u , θ , μ j x , t j x , ω j x + f j y u , θ , v , t j y , μ j y , ω j y
f i x u , θ , μ i x , t i x , ω i x = c i , x u u c i , x θ θ μ i x t i x ω i x
f i y u , θ , v , t i y , μ i y , ω i y = c i , y u u c i , y θ θ c i , y ν ν μ i y t i y ω i y
In the above formula, the first half of the summation formula calculates the risk of exposure on work days, and the second half represents the risk of exposure on rest days, both of which consist of activity exposure and travel exposure. Among them, u : activity venue/coefficient of the environment during travel process, namely indoor/outdoor; θ : activity venue/coefficient of the number of surrounding people in the travel environment; μ : coefficient of the mobility of people around the activity venue; t i x represents the length of time residents stay at the activity venue; ω i x represents the frequency with which residents engage in a particular activity during work days or rest days; v : The mode residents travel to engage in a certain activity; t i y represents the amount of time that residents spend on a certain mode of travel; μ i y represents the coefficient of mobility of people in a certain mode of travel; ω i y represents the travel frequency, which is the same as the activity frequency in the research.
In the activity section, residents’ exposure risk is measured according to the nature of the environment in the activity, population density, mobility, time of duration, and frequency of activity. According to a study in Korea which compares the COVID-19 risk differences between the indoor activities and the outdoor activities, the risk of becoming COVID-19 infected of indoor activities is 19 times of that of outdoor activities without wearing any masks [39]. However, the real situation is more complex in Beijing because of the coercive mask-wearing policies. Study have shown that wearing a mask can reduce the risk of COVID-19 infection by 53% [40]. It is testified that if all the people wear masks, the risk of COVID-19 transmission is only 1.5%, and it rise to 5% when the virus carrier is wearing a mask and other people do not. The risk is 30% if the virus carries does not wear a mask and other people keep wearing the masks [41]. Due to Beijing’s strict indoor mask-wearing policy, we assume that nearly all people keep wearing masks according to the government’s requirement and only one third of them keep wearing mask outside. Then, in the situation of uncertainty, the weights of the risk of indoor activities and outdoor activities are 1 and 2, respectively. During activity, if mobility of people exists, there is a higher probability of infection, and the value is 2. If there is no mobility of the surrounding people, the risk is low, and the assigned value is 1. Population density and time of duration are assigned by the median value of the option data. In a constantly mobile environment, commuting activity belongs to outdoor environment by default and it has 100% mobility. Based on the actual situation in Beijing, the activity of picking up children belongs to outdoor environment by default, while the dining environment belongs to indoor environment.
In the travel section, residents’ exposure risk is determined by the modes of travel, travel time, nature of the environment, population density, mobility, and frequency. All travel processes are outdoor activities with mobility and are assigned a value of 2. Given the characteristics of COVID-19, the greater the population density, the greater the risk of infection. The number of people gathered around residents varies among different travel modes. About the population density (within a radius of 1.5 m), we conducted field investigation and averaged the data. Under normal circumstances, the population density on the subway is about 4 people; the population density on buses and company shuttle buses is about 3 people. However, commuting activity generally occurs during the morning and evening rush hours. The population density is greater during the ride process compared to other times. At this time, the population density on the subway is 8 people; the population density on buses and company shuttle buses is 6 people. In most cases, there are 2 people in private cars and taxis. The population density is usually 1 person for those who travel by bicycle, on foot, or by electric bicycle. The median value of the option data is directly taken as the calculation criteria for other factors such as travel time and frequency.

2.2. Measure of Inequity

Firstly, a concise statistical table is used to group the amount of COVID-19 exposure by demographic characteristics to present the distribution of the exposure risk of COVID-19 among different populations in the form of mean values, which reveals the characteristics of population differences. Secondly, the coefficient of variation, namely standard deviation/mean value, is used to reveal the specific status of inequity of COVID-19 exposure. In this section, we will calculate the coefficients of variation for the overall population, different demographic characteristics (gender, age), work days/rest days, and different activity types, respectively.
The formula of coefficient of variation is:
Coefficient of Variation = (standard deviation/mean value) × 100%

2.3. Data Collection

According to the purpose of the study, we designed a structured questionnaire to collect data about daily activities of Beijing residents including those who live, work or study in Beijing.
The questionnaire mainly includes four parts: (1) demographic characteristics of residents, including gender, age, education level, marital status, occupation, income, hukou (hukou is a system of household registration used in China. A household registration record officially identifies a person as a permanent resident of an area and includes identifying information such as name, birthplace, gender. There are two types of Hukou: agricultural hukou and non-agricultural hukou), ownership of the house, family structure. (2) Residents’ activity types. In the survey, we divided the time of a week into Monday to Friday (work days) and Saturday to Sunday (rest days), and collected information related to residents’ activities from the above two dimensions. We analyzed the two parts separately. Residents’ daily activities are mainly divided into 8 types, including commuting, dining out, work, personal affairs, shopping, picking up kids, leisure, socializing. In addition, on rest days, home activities were added to the questionnaire to reflect the real-life status of residents. Although home activities can reflect the activity status of residents, they are not outdoor activities and will not be considered in the later calculation. (3) Systematic characteristics of activities. Systematic characteristics of activities include activity time, location, activity environment (indoor or outdoor, population density, personnel mobility), activity duration and activity frequency. (4) Systematic characteristics of travel. In this study, travel originates from activity needs, so travel system belongs to activity system. The systematic characteristics of travel include travel time, travel mode and travel duration. The frequency of travel is consistent with the frequency of activity. It should be noted that travel environment (indoor or outdoor, population density, mobility) and other data were not asked in the questionnaire but were obtained through practical tests and common sense.
We conducted questionnaires in November 2020 by both online interview and onsite interview. There are 756 interviewees, and finally, 754 valid questionnaires were obtained.
In terms of the number of questionnaires issued, we took the proportion of residents’ occupation distribution as a reference standard. From the Beijing Statistical Yearbook, the National Bureau of Statistics and relevant literature, we found information on the number of civil servants, employees in public institutions, employees in state-owned enterprises, employees in private enterprises, employees in foreign enterprises, individual business, freelancer, students, farmers, unemployed in Beijing in 2018 [42,43]. Based on the above data, we can obtain the proportion distribution of Beijing residents in these occupations. as According to the reference standard, we found the target population in proportion for targeted distribution and collection of questionnaires.

2.4. Sample Characteristics

Descriptive statistics of the sample are shown in 
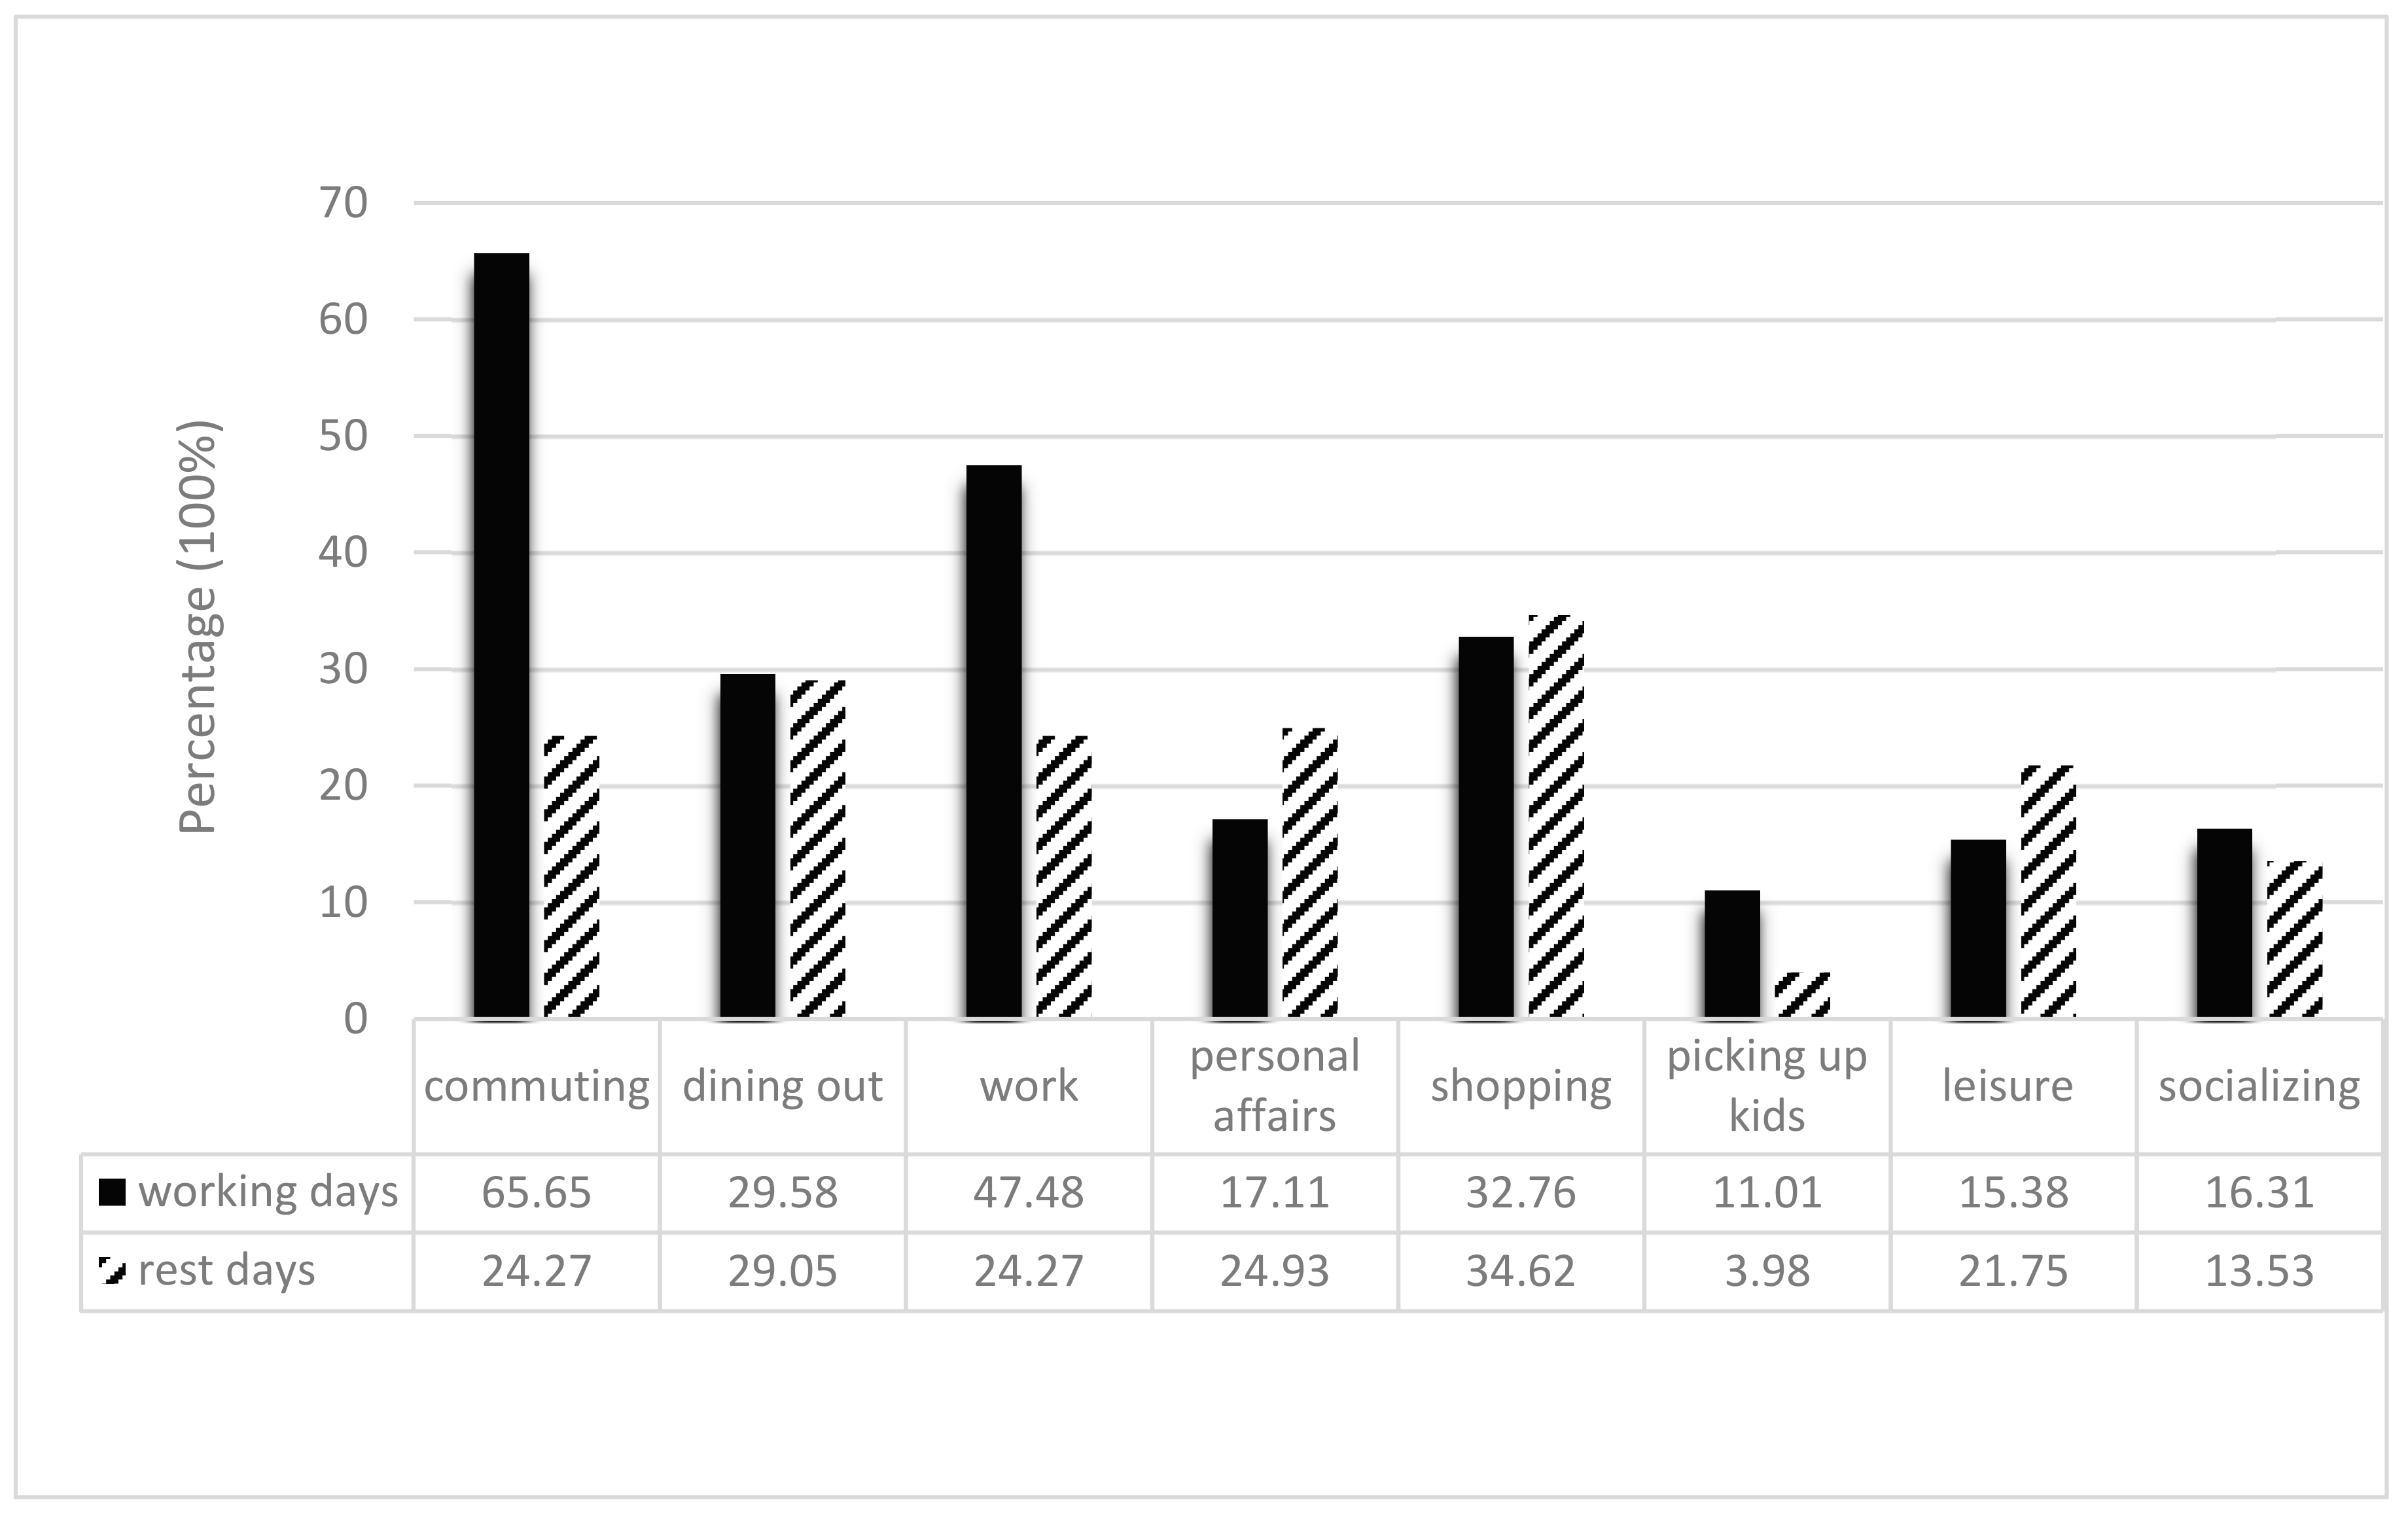
Table 1. The activity types of residents are shown in Figure 1. Commuting and work are the primary activities of residents on work days. Life activities such as shopping, dining out and personal affairs are the main contents of the rest days.

3. Results

3.1. Differences in COVID-19 Exposure Risk Stem from Different Activities

The difference of activity exposure risk on weekdays and rest days with and without activity frequency is shown in Table 2. By adding the exposure risk values for work days and rest days (considering the frequency of activity), we can obtain the total exposure risk for each activity over a week (see Table 3). Working and commuting activities composite the highest COVID-19 exposure risk during work days. Working and leisure activities contribute to the most exposure risk in rest days. In a whole week, working, commuting, and dining out activities are the top three activities that lead to exposure risks.
Different types of activities could be summarized into three categories, according to the nature of each activity. Based on the total exposure value of each activity in one week, the exposure risk of residents’ activities has the following characteristics: Survival activities had the highest exposure risk, followed by life activities and leisure activities. And the exposure risks for the three activity types are shown in Table 4.

3.2. Differences in COVID-19 Exposure Risk of Different Social Groups

The exposure risk levels of different social groups are shown in Table 5. It shows that residents in Beijing present varying characteristics of COVID-19 exposure risks among different social groups.
Based on the statistical results of different social groups, we further applied one-way ANOVA after winsorization to analyze whether the above sociodemographic characteristics have statistically significant differences in their impact on exposure risk. The results in Table 6 showed that, among the above demographic attributes, only education level, occupation and income had statistical significance on exposure risk level.
We took the total exposure risk of residents as the dependent variable, and the education level, occupation and income that passed the single factor analysis as the independent variables and applied multiple linear regression to analyze the relationship between the above three factors and the exposure risk of residents. Through a statistical test, the variance inflation factor (VIF) of these independent variables is less than 10, so there is no serious collinearity. The regression results are shown in Table 7.
Those with education levels of high school (p < 0.01), junior college (p < 0.1) and undergraduate (p < 0.05) were at higher risk of COVID-19 exposure compared to those with education levels of junior high school and below. Compared to civil servants, the student group was at greater risk of exposure (p < 0.05). Other occupational groups failed the significance test. Those with a monthly income level of ≥30,001 yuan were at greater risk of exposure compared to those with a monthly income of ≤2000 yuan (p < 0.01).

3.3. Inequity of Exposure Risk

We further analyzed inequity of COVID-19 exposure risk using coefficient of variation. Coefficient of variation less than 0.1 represents weak variation, between 0.1 to 1 is moderate variation, and ≥1 means strong variation [44]. The total coefficient of variation is 1.46, which means there are huge differences of COVID-19 exposure risk among different social groups. The detailed inequity results in each group are shown in Table 8.
The degree of health inequality on work days (1.64) is higher than that on rest days (1.31). There are health inequalities between different activities. From the perspective of activity type, on work days, the degree of health inequity at work is the highest (1.94), while the degree of inequity at dining out is the lowest (0.79). On rest days, the degree of health inequity at work is the highest (1.34), while the degree of inequity at personal affairs is the lowest (0.92). The coefficient of variation for all activities are shown in Figure 2.
Health inequality also varies among people with different socioeconomic status. Specifically, the health inequality is larger when the social groups present the following characteristics: male, people aged 31–40 years old, married, with non-local rural hukou, renting a house, farmers, three generations of people living together.

3.4. Robustness Test

In the analysis above, we report the basic result under the scenario that nearly all people keep wearing masks indoors according to the Government’s requirement and only one third of them keep wearing mask outdoors. However, there may be other scenarios which we could not ignore. It is also possible that not all people strictly comply with the rules and maybe less people wear mask outdoors. Therefore, we assume that when the compliance rate of wearing mask indoors is around one third and combing the situation of activities outdoors and circumstance differences, we calculate another risk weights of indoor activities and outdoor activities as 1 and 0.76, respectively. The risk of indoor activities is higher than that of outdoor activities in this condition. The result of this scenario is reported in the Appendix A. Comparing the results of two different scenarios with different weights settings, we find that the results of one-way ANOVA and regression models are consistent. The education level, income and vocation are still the statistically significant factors which have influence on the COVID19 exposure risk. The CV of the scenario in the robustness test is 1.49, which also shows great inequity. It means the basic discovery and conclusion are robust in this study.

4. Discussion

It is self-evident that the risks of exposure to COVID-19 are different for different activities and days. However, whether people with different social characteristics are at different risks of exposure to COVID-19 and the health inequities behind these differences are worth discussing.
Studies have shown that vulnerable groups, ethnic minorities and other groups in society have higher infection rates, less medical assistance and higher mortality rates after contracting COVID-19 [26,27,28,29,30,31,32]. Studies have also shown that these vulnerable and minority groups are hardest hit by COVID-19 [33,34]. This inequality is not a matter of chance. This structural inequality has caused widespread concern, and more and more people are calling for attention to these groups. That is, existing studies have focused strongly on pre- and post-infection inequalities. Now, our research shows that going back a step further, there are also some groups that are relatively at higher risk in terms of exposure. However, the groups at higher risk of COVID-19 exposure are different from these studies: they are not traditionally vulnerable groups.
On the whole, different groups of people demonstrate different activity patterns, leading to different exposure levels. However, when it comes to a specific influencing mechanism, the logic behind it needs further explanation.
People with higher education had higher levels of exposure risk than those with less than a junior high school education. Research showed that education level is negatively correlated with fear of being infected, which is consistent with our results to some extent [45,46]. The higher the level of education, the lower the fear of infection and the less likely they are to be afraid to go out, leading to a relatively high level of exposure. Coincidentally, some research demonstrates that education level is also positively correlated with the risk of COVID-19 infection [47]. That is, highly educated people are at a higher risk for both exposure and infection. However, a study pointed out that the higher the education level, the lower the actual infection rate [48]. A study also pointed out that the lower the education level, the higher the mortality rate of people infected with COVID-19 [49]. In addition, regarding the “side effects” of COVID-19, people with higher education levels also suffered fewer shocks (such as unemployment) [50], than people with lower education levels. These studies show that while people with more education are at higher risk of exposure and infection, this risk does not translate into reality impact. It is those with less education who suffer more infections, deaths and unemployment.
In terms of occupation, students are more exposed than civil servants. On the one hand, students are always aggregated in the classrooms with close contacts. On the other hand, it can be seen from our research that students’ frequent outdoor activities are an important reason for their high exposure risk. The reason for the large number of student activities is that students are more flexible in time arrangement and have higher social needs with their peers due to their attributes as young people. Other research points out that an important reason for the high risk of COVID-19 exposure among young people is that they think it will be fine to contact COVID-19 [51]. A cavalier attitude to the dangers of COVID-19 puts them at higher risk of exposure.
In terms of income, compared with the group with the monthly income ≤2000 yuan, the exposure risk of the group with the monthly income ≥30,001 yuan was higher (p < 0.01). The possible reason lies in the diversity of activities: the number of activities of people with a monthly income of more than 30,001 yuan is much higher than that of people with a monthly income of less than 2000 yuan.
Interestingly, Boyeong et al.’s measurements of COVID-19 exposure in US communities are the exact opposite of our results: Affluent neighborhoods in the United States have the lowest exposure, because in addition to being able to reduce contact by moving to a second home in the suburbs, residents in these neighborhoods have the option of working remotely. Poor minority communities are at greater risk of exposure because they tend to work in basic service jobs where the need to survive prevents them from strictly enforcing government’s stay-at-home orders [52]. The reason for the completely opposite results of the empirical studies in the two countries may be that the socioeconomic context and the definition of high-income groups are different. Boyeong et al.’s basic analyzing unit is the community, whereas ours is the individual. The American high income groups belongs to wealthy neighborhoods and live far away from the poor ones. The situation is totally different in the megacity in China. In addition, residents’ living habit and activity features of different social groups in China are also different from that of the American residents. We found a robust result even when we applied different weights during the calculations. It may be because most of the respondents’ activities are indoors in the megacity, and the proportion of indoor activities overweight the outdoor activities. Besides, this paper aims to explore the relative differences of exposure risks among respondents, and both CVs of different scenarios are larger than 1, which means great diversity of different social groups. The comparative result is not hampered based on different weights analysis.
Compared to existing literature, this study makes contributions in the following aspects: first, most studies aggregated on the research of infection rate and death rate of COVID-19 and other types of epidemics. This research explores the risk of exposure to COVID-19 under the condition of uncertainty and analyzes the impact of different individuals’ activities and social characteristics on their exposure to COVID-19. Second, existing studies usually focus on particular groups of people such as medical staffs and the infected people, and the general public under the risk of becoming infected are paid less attention. This study focuses on the general public and reveals the COVID-19 exposure risk of general public during their different activities at different time. Third, studies on the inequality of COVID-19 or other epidemics are less, this study measures the inequality of the risk of exposure to COVID-19 in and between different social groups, which could enlighten the governments to take effective measures to reduce the infection rate from the perspective of exposure risk.
However, there are still some limitations in this paper. First, although the professional structure of Beijing residents was considered in the design and collection of questionnaires, the questionnaires number was still small in general. Second, based on Beijing’s compulsive “wear a mask” policy, we calculate the exposure risks on the assumption that nearly everyone took strict self-protection measures and wore masks correctly indoors and one third of people also wore masks outside. Different compliance rates of wearing masks indoors and outdoors could lead to different sets of weights which would lead to different values of exposure risks. Although the conclusions of influencing factors of COVID-19 and inequity under uncertainty are robust, there are inevitable value deviations. It needs further and deeper exploration under different circumstances. Lastly, the factors affecting individuals’ exposure risk of COVID-19 in this paper are not fully considered. People with poor immunity and basic diseases are susceptible and have higher chance of becoming infected, when compared with other people, even if they are exposed in the same situation. In the external environment, the spread of the new coronavirus will be affected by meteorological factors such as temperature and humidity [53]. However, in this study, we did not consider individual health condition and the impact of external environmental factors on the exposure levels. The deficiencies of this study also provide a direction for further research.

5. Conclusions

5.1. Differences in Exposure Risk among Activities

Affected by time and frequency, the exposure risk of each activity is different. First, the exposure risk was always highest for work activities, regardless of the frequency of activity. Second, regardless of the frequency of activity, low-exposure activities, such as dining out, commuting, and picking up kids, did not differ much between weekdays and rest days. Leisure, personal affairs, and socializing are activities with high exposure risk, and the exposure risk is higher on work days than on rest days. Finally, after considering the frequency of activity, dining out, commuting, and picking up kids ranked significantly higher on work days, while leisure, personal affairs and socializing ranked lower.
In terms of the total exposure risk within one week, the exposure risk of subsistence activities was the highest, the exposure risk of living activities was in the middle, and the exposure risk of leisure activities was relatively the lowest. Specifically, the exposure risks of these eight activities in one week, in descending order, are: work, commuting, dining out, picking up children, leisure, personal affairs, life and shopping, and social contact.

5.2. Differences in Exposure Risk among Social Groups

Education level, occupation and income passed the statistical test and showed significant differences of COVID-19 exposure risks. In terms of the education level, residents with master’s degree or above have the highest exposure risk, followed by those with bachelor’s degree. People with a junior high school education or less had the lowest exposure risk. In terms of occupational types, the exposure risk of students is the highest. As for the income level, residents with a monthly income of more than 30,001 yuan had the greatest exposure risk, followed by those with a monthly income of 10,001–15,000 yuan.

5.3. Inequality of Exposure Risk

The coefficients of variation of exposure risk of the whole sample under two scenarios are 1.46 and 1.49, indicating that diversities in exposure risk among residents and health inequity existed. The health inequities are higher on weekdays than on rest days. In terms of activity type, work presents the highest degree of health inequality. This is because each job varies greatly in its working environment, requirements, working hours, population density and mobility. In addition, other activities also present great differences of the exposure risks, expect for the dining out activity.
Health inequalities also exist within groups of different socioeconomic status. The social groups, characterized as male, 31~40 ages, with a high school education degree, married, non-local agricultural hukou, renting houses, farmers, working in private enterprises, income more than 30,001 yuan, are demonstrating higher inequity within the group with larger coefficients of variation of exposure risk. As for people with the same attribute, we have sketched out a portrait of a person who is suffering from the highest level of health inequality within the group: male, 31–40 years old, married, with a rural hukou, rented housing, farmers, three generations of cohabitation.

Author Contributions

Conceptualization, C.L. and X.R.; methodology, X.R.; software, X.R. and X.Y.; validation, X.R. and X.Y.; formal analysis, X.R. and C.L.; investigation, X.R.; resources, X.R.; data curation, X.R.; writing—original draft preparation, X.R. and C.L.; writing—review and editing, X.R., C.L. and X.Y.; visualization, X.R.; supervision, C.L.; project administration, C.L.; funding acquisition, C.L. All authors have read and agreed to the published version of the manuscript.

Funding

This research was funded by the National Natural Science Foundation of China (41671124), the University of Chinese Academy of Sciences (Y95402CXX2) and Guangdong Planning Office of Philosophy and Social Sciences (GD18XSH04).

Institutional Review Board Statement

Not applicable.

Informed Consent Statement

Not applicable.

Data Availability Statement

All data included in this study are available upon request by contact with the corresponding author.

Acknowledgments

The authors are very grateful for the valuable comments and suggestion of the anonymous reviewers.

Conflicts of Interest

The authors declare no conflict of interest.

Appendix A

Table A1. Exposure level of each activity.
Without Considering the Frequency of ActivityConsidering the Frequency of
Activity
ActivityWork DaysRest DaysWork
Days
Rest Days
Commuting5302271952172
Dining out140675743231518
Work4025299715,3492098
Personal affairs114683016491213
Shopping91481117031197
Picking up kids7151903577190
Leisure 126896520211434
Socializing105893917311322
Table A2. Exposure level of all activities within a week.
ActivitynMinMaxMedianMeanStandard
Deviation
Commuting529127831145418861805
Dining out3266021,360268339773625
Work40460390,000648014,55228,183
Personal affairs2547511,157117117351832
Shopping3804524,78795019302732
Picking up kids92259354135520902099
Leisure 22813522,600112120602719
Socializing1884516,384109218502394
Total exposure75456436,561747513,73624,223
Table A3. Exposure level of three kinds of activities.
ActivityWork DaysRest DaysA Total of a Week
TypeMinMaxMedianMeanMinMaxMedianMeanMinMaxMedianMean
(1)30304,208912011,1321510,0804561003120390,839475510,645
(2)6036,707398745341518,7431542231125036,70728954763
(3)14042,000228029136112,8451254242145037,77216032780
Note: (1), (2) and (3) respectively represent survival activities, daily activities and leisure activities.
Table A4. Exposure level of different social groups.
VariableMinMaxMedianMeanVariableMinMaxMedianMean
Gender Occupation
Male56436,521693313,919Civil servant12357,08540118593
Female56146,973806613,532Public institutions 6788,511861212,778
Age State-owned enterprise 67142,973689813,512
≤18 12333,600524010,981Private-owned enterprise 56436,561892814,501
19–30 56111,814825813,658Foreign-owned enterprise 28045,46160828734
31–40 56436,561708110,269Individual business 6712,24221013974
41–50 5673,645469010,397Freelancer 5638,26849438193
51–60 16883,63520029344Farmer16852,83518427952
≥61 54220,94449926008Student269111,81416,37424,603
Education Unemployed64116,66740455762
≤Junior high school 5633,60013003891Retirees14630,89425246692
High school56436,561382115,016Others56172,859428213,748
Junior college6786,435640711,708Income (yuan)
Undergraduate56172,859925714,093≤200012387,360524313,147
Postgraduate112111,81411,13318,0342001–350056111,814723714,137
Marital status 3501–50005686,43547679348
Married56436,560559512,2615001–10,00067195,058744513,723
Divorced/widowed16886,435689713,98610,001–15,000112172,859994415,451
Unmarried91142,973977315,24715,001–20,00036156,302789411,506
Hukou 20,001–25,000143149,02810,93914,843
Beijing urban112172,8598275698325,001–30,000171124,49870748125
Beijing agricultural5673,64528819133≥30,001276037,99212,50516,503
Non-local urban 112195,058808615,222Family structure
Non-local agricultural56436,56014,05113,403Live alone56172,859802914,267
House Ownership With parents123195,0587390147,456
Self-purchased5673,645656610,737With partner16887,360728611,249
Rented 56195,058825914,148With partner and children5661,909639210,758
Staff apartment112129,600791814,629With three generations or more 56436,561635920,785
Others56436,560461318,115
Table A5. Result of one-way ANOVA analysis.
VariableFProb > F[95% Conf. Interval]
Gender0.050.8200.01
Age1.120.3500.03
Education4.4000.08
Marriage1.40.2500.02
Occupation2.130.0100.06
Income5.8000.00
Hukou0.910.4400.01
House ownership1.940.1200.03
Family structure2.240.0600.03
Table A6. Regression results of influencing factor analysis.
VariablesCoefficientS.D.T 95% Confidence Interval
Education (Control group: Junior high school and below)
High school11,255.913786.1662.973822.68518,689.14
Junior college6221.7254025.8421.65−1682.04814,125.5
Undergraduate7447.9383848.7581.94−108.172515,004.05
Postgraduate5192.664320.4551.20−3289.51613,674.84
Occupation (Control group: Civil servants)
Public institution206.14435547.156 0.04−10,684.3611,096.65
State-owned enterprise −99.670655231.173 −0.02−10,369.8210,170.48
Private-owned enterprise 1351.65951740.26−8806.24711,509.56
Foreign-owned enterprise −6749.3916172.625−1.09−18,867.865369.075
Individual business−6347.3499573.831−0.66−25,365.265418.57
Freelancer−3109.1816088.612−0.51−15,062.718844.346
Farmer−4272.898176.362 −0.52−20,325.2111,779.43
Student17,3616007.5632.895566.59229,155.4
Unemployed−8696.0538551.988−1.02−25,485.838093.721
Retirees−7558.5328494.988−0.89−24,236.49119.335
Others2572.4035807.6230.44−8829.46913,974.27
Income (Control group: ≤2000 Yuan)
2001–3500−1036.4043732.591 −0.28−8364.456291.642
3501–5000−2077.9034002.277 −0.52−9935.4125779.606
5001–10,0003877.2213947.5520.98−3872.84911,627.29
10,001–15,000 5582.4164251.809 1.31−2764.9913,929.82
15,001–20,000 1825.8645045.633 0.36−8080.02311,731.75
20,001–25,000 5041.5717045.960.72−8791.47918,874.62
25,001–30,000 −1184.717435.496−0.16−15,782.5213,413.1
≥30,001 −1184.717435.496−0.16−15,782.5213,413.1
Control variables
Gender718.28191821.083 0.39−2856.9774293.541
Age1658.5 1499.84 1.11−1286.0764603.076
Marital status902.39231198.797 0.75−1451.1573255.942
Hukou−441.1183802.6724−0.55−2016.9731134.736
House Ownership2459.071048.7342.34400.13294518.008
Family structure1126.592742.03041.52 −330.2062583.391
Constant−9973.0527839.551−1.27−25364.135418.022
Figure A1. Coefficient of variation of different activities.
Ijerph 19 01121 g0a1
Table A7. Coefficient of variation of residents in all groups.
VariableCVVariableCV
Gender Occupation
Male2.06Civil servants1.58
Female1.32Public institutions1.13
Age State-owned enterprises1.53
≤181.07Private enterprises2.14
19–301.33Foreign enterprises1.09
31–402.11Individual business1.10
41–501.03Freelancer1.03
51–601.77Farmers2.0
≥610.88Students0.99
Education Unemployed1.85
≤Junior high school1.33Retirees1.26
High school2.91Others2.09
Junior college1.11Income(yuan)
Undergraduate1.21≤20001.51
Postgraduate0.992001–3500 1.33
Marital status 3501–50001.55
Married1.775001–10,0001.33
Divorced/widowed1.4310,001–150000.98
Unmarried1.2215,001–20,0000.88
Hukou 20,001–25,0000.81
Beijing urbanl.4025,001–30,0000.74
Beijing agricultural1.65≥30,0012.21
Non-local urban1.52Family structure
Non-local agricultural2.17Live alone1.4
House Ownership With parents1.62
Self-purchased House1.16With partner1.14
Rented house1.38With partner and children2.82
Staff apartment1.32With three generations or more1.76

References

  1. Public Health Governance Research Group of Wuhan University. Thoughts and suggestions on public health management under epidemic prevention normalization. Learn. Explor. 2020, 6, 1–7. [Google Scholar]
  2. National Health Commission. Press Conference on Joint Prevention and Control Mechanism of the China State Council. Available online: http://www.nhc.gov.cn/xcs/xwbd/202003/973e5e0435dd433cb1a84da295cfe0b6.shtml (accessed on 12 October 2021).
  3. National Health Commission. Interpretation of COVID-19 Diagnosis and Treatment Protocol (Trial Version 6). Available online: http://www.nhc.gov.cn/yzygj/s7652m/202002/54e1ad5c2aac45c19eb541799bf637e9.shtml (accessed on 12 October 2021).
  4. Li, L.; Jianhua, W.; Siyan, Z. Epidemiology, 3rd ed.; People’s Medical Publishing House: Beijing, China, 2015; Volume 1. [Google Scholar]
  5. Wang, Q.; Guo, J.; Sun, H. An investigation on the risk of COVID-19 exposure among frontline nurses. J. Peking Univ. Med. Sci. 2020, 52, 711–714. [Google Scholar]
  6. Lorenzo, D.; Carrisi, C. COVID-19 exposure risk for family members of healthcare workers: An observational study. Int. J. Infect. Dis. 2020, 98, 287–289. [Google Scholar] [CrossRef]
  7. Dioscoridi, L.; Carrisi, C. COVID-19 Exposure Risk of Healthcare Personnel in Digestive Endoscopy: A Prospective Study. Res. Sq. 2020, 1, 1–9. [Google Scholar]
  8. World Health Organization. Risk Assessment and Management of Exposure of Health Care Workers in the Context of COVID-19: Interim Guidance. 19 March 2020. Available online: https://apps.who.int/iris/bitstream/handle/10665/331496/WHO-2019-nCov-HCW_risk_assessment-2020.2-eng.pdf?sequence=1&isAllowed=y (accessed on 3 January 2022).
  9. Li, C.; Huang, X.; Cai, T. Expert consensus on personal protection in different regions of healthcare facilities during COVID-19. Chin. J. Infect. Control 2020, 19, 199–213. [Google Scholar]
  10. Dai, H.; Fang, R.; Lei, Y. Exposure risk and protection of frontline medical workers in the context of COVID-19. Sichuan Med. 2020, 41, 257–261. [Google Scholar]
  11. Chai, Y.; Shen, Y.; Xiao, Z. The research trend of time space behavior and its application prospect. Prog. Geogr. 2012, 31, 667–675. [Google Scholar]
  12. Yan, Z.; Chai, Y. Urban commuting in Beijing based on comparison of residential areas. Geogr. Res. 2009, 28, 1327–1340. [Google Scholar]
  13. Zhang, W.; Chai, Y. A household-based model of shopping decision-making behavior in timing and destination choice:Formulation and application to spatial policy evaluation. Geogr. Res. 2010, 29, 338–350, (In Chinese with English Abstract). [Google Scholar]
  14. Han, H.R.; Song, J.P. The study on temporal and spatial characteristics of shopping behavior of Wuhu residents. Econ. Geogr. 2013, 33, 82–87. [Google Scholar]
  15. Jin, R.; Yao, S.; Cai, Y. Study on temporal and spatial behavior characteristics of Leisure sports in Shanghai residents. Sports Sci. 2015, 35, 12–19. [Google Scholar]
  16. Lin, R.; Zhou, S.; Yan, X. The temporal and spatial characteristics and influencing factors of workplace choice behavior of Guangzhou residents since 1978. Acta Geogr. Sin. 2019, 74, 753–769. [Google Scholar]
  17. Whitehead, M. The Concepts and Principles of Equity and Health. Int. J. Health Serv. 1992, 22, 429–445. [Google Scholar] [CrossRef] [PubMed]
  18. Zhu, H.; Feng, X. Health inequality in the context of “Healthy China”. Learn. Pract. 2018, 4, 91–98. [Google Scholar]
  19. Hou, J. An empirical study on the influencing factors of regional health equity of Chinese residents. Spec. Zone Econ. 2006, 10, 26–28. [Google Scholar]
  20. Li, M. Research on health equity and Its Influencing Factors. Chin. Health Serv. Manag. 2005, 9, 516–518. [Google Scholar]
  21. Cui, X.; Chang, C.-T. How Income Influences Health: Decomposition Based on Absolute Income and Relative Income Effects. Int. J. Environ. Res. Public Health 2021, 18, 10738. [Google Scholar] [CrossRef] [PubMed]
  22. Liu, L.; Tang, J. The impact of socioeconomic status on health equity of residents. Chin. Health Econ. 2004, 6, 40–42. [Google Scholar]
  23. Xing, Y.; Guo, Y. Research Progress of health equity. Foreign Med. Hosp. Manag. Vol. 1999, 4, 160–165. [Google Scholar]
  24. Abbate, M.; Pericas, J.; Yañez, A.M.; López-González, A.A.; de Pedro-Gómez, J.; Aguilo, A.; Morales-Asencio, J.M.; Bennasar-Veny, M. Socioeconomic Inequalities in Metabolic Syndrome by Age and Gender in a Spanish Working Population. Int. J. Environ. Res. Public Health 2021, 18, 10333. [Google Scholar] [CrossRef]
  25. Rao, K.; Yao, L.; Qin, L. The Measurement of health equity. Chin. Health Econ. 1998, 12, 30–32. [Google Scholar]
  26. Price-Haywood, E.G.; Burton, J.; Fort, D.; Seoane, L. Hospitalization and mortality among black patients and white patients with COVID-19. N. Engl. J. Med. 2020, 382, 2534–2543. [Google Scholar] [CrossRef]
  27. Hooper, M.W.; Nápoles, A.M.; Pérez-Stable, E.J. COVID-19 and racial/ethnic disparities. JAMA Netw. 2020, 323, 2466–2467. Available online: https://jamanetwork.com/journals/jama/fullarticle/2766098 (accessed on 3 January 2022). [CrossRef] [PubMed]
  28. Bibbins-Domingo, K. This time must be different: Disparities during the COVID-19 pandemic. Ann. Intern. Med. 2020, 173, 233–234. [Google Scholar] [CrossRef] [PubMed]
  29. Islam, N.; Lacey, B.; Shabnam, S.; Erzurumluoglu, A.M.; Marmot, M.G. Social inequality and the syndemic of chronic disease and COVID-19: County-level analysis in the USA. J. Epidemiol. Community Health 2021, 75, 496–500. [Google Scholar] [CrossRef] [PubMed]
  30. Yahmed, B.S.; Cappellari, L.; Checchi, D.; Corak, M.; Jenkins, S.P.; Neidhöfer, G.; Tertilt, M.; Tommasi, M. COVID-19 and Inequality. Available online: https://ideas.repec.org/p/zbw/zewpbs/52020.html (accessed on 3 January 2022).
  31. Eline, B.A.; Atherly, A.; Diehl, S.; Gleason, K.; Hart, V.; Maclean, C.; Barkhuff, D.; Levine, M.; Carney, J. Risk Factors for COVID-19: Community Exposure and Mask-Wearing. Available online: https://papers.ssrn.com/sol3/papers.cfm?abstract_id=3676570 (accessed on 3 January 2022).
  32. Rozenfeld, Y.; Beam, J.; Maier, H.; Haggerson, W.; Boudreau, K.; Carlson, J.; Medows, R. A model of disparities: Risk factors associated with COVID-19 infection. Int. J. Equity Health 2020, 19, 1–10. [Google Scholar] [CrossRef] [PubMed]
  33. Witteveen, D. Sociodemographic inequality in exposure to COVID-19-induced economic hardship in the United Kingdom. Res. Soc. Stratif. Mobil. 2020, 69, 100551. [Google Scholar] [CrossRef] [PubMed]
  34. He, A.J.; Zhang, C.; Qian, J. COVID-19 and social inequality in China: The local-migrant divide and the limits of social protections in a pandemic. Policy Soc. 2021, 40, 1–30. [Google Scholar]
  35. Beijing Municipal Bureau of Statistics. Available online: http://tjj.beijing.gov.cn/tjsj_31433/ (accessed on 18 December 2021). (In Chinese)
  36. Beijing Municipal Bureau of Statistics. Economic Statistics of Beijing in 2020. Available online: http://tjj.beijing.gov.cn/zxfbu/202101/t20210120_2227698.html (accessed on 18 December 2021). (In Chinese)
  37. Hussein, T.; Löndahl, J.; Thuresson, S.; Alsved, M.; Al-Hunaiti, A.; Saksela, K.; Aqel, H.; Junninen, H.; Mahura, A.; Kulmala, M. Indoor Model Simulation for COVID-19 Transport and Exposure. Int. J. Environ. Res. Public Health 2021, 18, 2927. [Google Scholar] [CrossRef]
  38. Beijing Municipal Comprehensive Administrative Law Enforcement Bureau. Notice on Further Strengthening Epidemic Prevention and Control in Commercial Premises, Shopping Malls and Restaurants. Available online: http://cgj.beijing.gov.cn/art/2020/2/12/art_3360_8988.html (accessed on 18 December 2021). (In Chinese)
  39. Nishiura, H.; Oshitani, H.; Kobayashi, T.; Saito, T.; Sunagawa, T.; Matsui, T.; Wakita, T.; Suzuki, M. Closed Environments Facilitate Secondary Transmission of Coronavirus Disease 2019 (COVID-19). Available online: https://europepmc.org/article/PPR/PPR115470 (accessed on 3 January 2022).
  40. Talic, S.; Shah, S.; Wild, H.; Gasevic, D.; Maharaj, A.; Ademi, Z.; Li, X.; Xu, W.; Mesa-Eguiagaray, I.; Rostron, J.; et al. Effectiveness of public health measures in reducing the incidence of COVID-19, SARS-CoV-2 transmission, and COVID-19 mortality: Systematic review and meta-analysis. BMJ 2021, 375, e068302, Erratum in: BMJ 2021, 375, N2997. [Google Scholar] [CrossRef]
  41. The Virus Infection Rate Dropped by 98.5 Percent When Everyone Wore Masks. Available online: https://www.sohu.com/a/427445051_120873246 (accessed on 27 December 2021). (In Chinese).
  42. Beijing Statistical Yearbook 2019. Available online: http://nj.tjj.beijing.gov.cn/nj/main/2019-tjnj/zk/indexch.htm (accessed on 3 January 2022).
  43. National Bureau of Statistics. Available online: http://www.stats.gov.cn/ (accessed on 3 January 2022).
  44. Lei, Z.; Yang, S.; Xie, S. Soil Hydrodynamics; Tsinghua University Press: Beijing, China, 1988. [Google Scholar]
  45. Cerda, A.A.; García, L.Y. Factors explaining the fear of being infected with COVID-19. Health Expect. 2021, 24, 1–7. [Google Scholar] [CrossRef]
  46. Hossain, M.A.; Jahid, M.I.K.; Hossain, K.M.A.; Walton, L.M.; Uddin, Z.; Haque, M.O.; Hossain, Z. Knowledge, attitudes, and fear of COVID-19 during the Rapid Rise Period in Bangladesh. PLoS ONE 2021, 15, e0239646. [Google Scholar] [CrossRef]
  47. Abedi, V.; Olulana, O.; Avula, V.; Chaudhary, D.; Khan, A.; Shahjouei, S.; Zand, R. Racial, economic, and health inequality and COVID-19 infection in the United States. J. Racial Ethn. Health Dispar. 2021, 8, 732–742. [Google Scholar] [CrossRef]
  48. Baser, O. Population density index and its use for distribution of COVID-19: A case study using Turkish data. Health Policy 2021, 125, 148–154. [Google Scholar] [CrossRef] [PubMed]
  49. Drefahl, S.; Wallace, M.; Mussino, E.; Aradhya, S.; Kolk, M.; Brandén, M.; Andersson, G. A population-based cohort study of socio-demographic risk factors for COVID-19 deaths in Sweden. Nat. Commun. 2020, 11, 1–7. [Google Scholar] [CrossRef] [PubMed]
  50. Lee, S.Y.T.; Park, M.; Shin, Y. Hit Harder, Recover Slower? Unequal Employment Effects of the COVID-19 Shock. Available online: https://papers.ssrn.com/sol3/papers.cfm?abstract_id=3768267 (accessed on 3 January 2022).
  51. Wilson, R.F.; Sharma, A.J.; Schluechtermann, S.; Currie, D.W.; Mangan, J.; Kaplan, B.; Goffard, K.; Salomon, J.; Casteel, S.; Mukasa, A.; et al. Factors Influencing Risk for COVID-19 Exposure Among Young Adults Aged 18–23 Years—Winnebago County, Wisconsin, March—July 2020. MMWR Morb. Mortal. Wkly. Rep. 2020, 69, 1497–1502. [Google Scholar] [CrossRef]
  52. Hong, B.; Bonczak, B.J.; Gupta, A.; Thorpe, L.E.; Kontokosta, C.E. Exposure density and neighborhood disparities in COVID-19 infection risk. Proc. Natl. Acad. Sci. USA 2021, 118, e2021258118. [Google Scholar] [CrossRef]
  53. Liu, J.; Zhou, J.; Yao, J.; Zhang, X.; Li, L.; Xu, X.; Zhang, K. Impact of meteorological factors on the COVID-19 transmission: A multi-city study in China. Sci. Total Environ. 2021, 726, 138513. [Google Scholar] [CrossRef] [PubMed]
Figure 1. The percentage of different types of activities.
Ijerph 19 01121 g001
Figure 2. Coefficient of variation of different activities.
Ijerph 19 01121 g002
Table 1. Demographic characteristics of the sample.
VariablenPercentage (%)VariablenPercentage (%)
Age Occupation
≤18121.59Civil servant263.45
19–3043057.03Public institutions719.42
31–4020026.53State-owned enterprise12816.98
41–508110.74Private-owned enterprise26034.48
51–60212.79Foreign-owned enterprise395.17
≥61101.33Individual business81.06
Gender Freelancer425.57
Male39852.79Farmer162.12
Female35647.21Student759.95
Education Unemployed121.59
≤Junior high school689.02Retirees182.39
High school11014.59Others597.82
Junior college11915.78Income (yuan)
Undergraduate30340.19≤2000719.42
Postgraduate15420.422001–350010213.53
Marital status 3501–500011114.72
Married37449.65001–10,00022329.58
Divorced/widowed182.3910,001–15,00014619.36
Unmarried36248.0115,001–20,000547.16
Hukou 20,001–25,000162.12
Beijing urban23230.7725,001–30,000141.86
Beijing agricultural547.16≥30,001172.25
Non-local urban18224.14Family structure
Non-local agricultural28637.93Live alone33544.43
House Ownership With parents9612.73
Self-purchased19525.86With partner13317.64
Rented39552.39With partner and children12816.98
Staff apartment8511.27With three generations or more628.22
Others7910.48
Table 2. Exposure risk level of each activity.
Without Considering the Frequency of ActivityConsidering the Frequency of Activity
ActivityWork DaysRest DaysWork DaysRest Days
Commuting13965975137454
Dining out140685643231731
Work4025299615,3492098
Personal affairs2198126631791844
Shopping1493110626971624
Picking up kids7153283577328
Leisure 2155135833512002
Socializing1665130226771849
Table 3. Exposure risk level of all activities within a week.
ActivitynMinMaxMedianAverageStandard
Deviation
Commuting5293020,608382749644751
Dining out3266028,800286141203782
Work40460390,000648014,55228,183
Personal affairs25410020,720186729793057
Shopping3807029,400146028683854
Picking up kids925022,920215033344199
Leisure 22816035,000192031453974
Socializing1887024,320170527553576
Total exposure754147446,02511,55617,55525,719
Table 4. Exposure level of three kinds of activities.
ActivityWork DaysRest DaysA Total of a Week
TypeMinMaxMedianMeanMinMaxMedianMeanMinMaxMedianMean
(1)147392,208853812,9013017,280608145430392,208827713,165
(2)6039,017398755645019,272175226235052,27240476255
(3)14042,000228039237017,800152026247058,48026804201
Note: (1), (2) and (3) respectively represent survival activities, daily activities and leisure activities.
Table 5. Exposure risk level of different social groups.
VariableMinMaxMedianAverageVariableMinMaxMedianAverage
Gender Occupation
Male147446,02511,20017,938Civil servant32587,792515612,985
Female147189,18811,59117,125Public institutions 17891,19112,26815,943
Age State-owned enterprise 178189,18810,48317,851
≤18 32535,385936113,758Private-owned enterprise147446,02514,35119,308
19–30 147116,08013,27517,673Foreign-owned enterprise 47053,47410,51612,952
31–40 147446,02511,14820,465Individual business 17819,15529676698
41–50 14773,744841313,276Freelancer 14746,119672411,152
51–60 34086,491264010,948Farmer44252,89133229281
≥61 84022,68052907364Student420116,08018,24027,071
Education Unemployed79017,69459117603
≤Junior high school 14733,60021005546Retirees32031,08030207708
High school147446,025592517,175Others147172,859945817,388
Junior college17886,491926715,581Income (yuan)
Undergraduate147189,18814,47619,004≤200032487,360718015,481
Postgraduate294116,08015,21021,8032001–3500147116,080936116,747
Marital status 3501–500014786,491739011,981
Married147446,025905415,7165001–10,000177195,15213,19918,253
Divorced/widowed44286,491793516,73910,001–15,000294172,85914,16820,348
Unmarried238189,18814,65019,49515,001–20,00046064,96613,14915,384
Hukou 20,001–25,000323050,41214,84019,338
Beijing urban294172,85912,23717,53225,001–30,000324031,960972511,449
Beijing agricultural14773,744492211,400≥30,0011827446,02519,50044,563
Non-local urban 294195,15212,57719,822Family structure
Non-local agricultural147446,02511,15917,293Live alone147189,18812,49918,101
House Ownership With parents324195,15211,42118,506
Self-purchased14773,74410,30014,308With partner44187,79212,65916,261
Rented 147195,15213,31618,392With partner and children14764,622958613,855
Staff apartment294129,60011,15017,962With three generations or more 147446,025991823,543
Others147446,025805020,947
Table 6. Result of one-way ANOVA analysis.
VariableFProb > F[95% Conf. Interval]
Gender0.020.8900.01
Age2.520.0200.03
Education18.39000.08
Marriage9.54000.02
Occupation4.570.0100.06
Income2.78000.08
Hukou2.890.0600.02
House ownership1.460.2300.02
Family structure0.790.5300.02
Table 7. Regression results of influencing factor analysis.
VariablesCoefficientS.D.T 95% Confidence Interval
Education (Reference group: Junior high school and below)
High school5360 ***20412.6313539367
Junior college9225 ***20114.69527613,173
Undergraduate11,729 ***17756.61824315,214
Postgraduate14,226 ***19267.3810,44418,008
Occupation (Reference group: Civil servants)
Public institution379130901.23−22759859
State-owned enterprise 390529001.35−17889599
Private-owned enterprise 518327731.87−26010,627
Foreign-owned enterprise 128834130.38−54127898
Individual business−48445451−0.89−15,5465856
Freelancer−4133364−0.12−70186191
Farmer−24544284−0.57−10,8645955
Student11,164 **30683.64514017,188
Unemployed−39834705−0.85−13,2215253
Retirees−38564134−0.93−11,9724259
Others194831730.61−42818179
Income (Reference group: ≤2000 Yuan)
2001–3500−322117−0.02−41894124
3501–5000−26142082−1.26−67021472
5001–10,000180018660.96−18655465
10,001–15,000 402619821.031347917
15,001–20,000 87424730.35−39825730
20,001–25,000 509637911.34−234612,540
25,001–30,000 −27924006−0.7−10,6575073
≥30,001 7050 **36991.91−21114,313
Control variables
Gender45619670.44−33474375
Age87516061.44−12275077
Marital status105713061.05−11883941
Hukou−475896−0.37−20901429
House Ownership72518681.26−13196015
Family structure13028051.11−3621297
Constant−8258618−0.94−24,9788860
Note: *** p < 0.01, ** p < 0.05, * p < 0.1.
Table 8. Coefficient of variation of residents in all social groups.
VariableCVVariableCV
Gender Occupation
Malel.67Civil servants1.55
Female1.17Public institutions0.99
Age State-owned enterprises1.37
≤181.05Private enterprises1.65
19–30l.02Foreign enterprises0.96
31–401.98Individual business1.10
41–501.14Freelancer0.97
51–601.80Farmersl.69
≥610.94Students0.98
Education Unemployed0.72
≤Junior high school1.40Retirees1.18
High school2.82Othersl.63
Junior college1.00Income(yuan)
Undergraduate1.09≤20001.24
Postgraduate0.962001–3500 1.38
Marital status 3501–50001.14
Married1.915001–10,0001.29
Divorced/widowed1.3010,001–15,0001.07
Unmarriedl.0615,001–20,0000.88
Hukou 20,001–25,0000.65
Beijing urbanl.1825,001–30,0000.70
Beijing agricultural1.40≥30,0012.34
Non-local urban1.32Family structure
Non-local agricultural1.75Live alone1.23
House Ownership With parents1.32
Self-purchased House0.99With partner0.94
Rented house1.59With partner and childrenl.01
Staff apartment1.13With three generations or more2.53
Publisher’s Note: MDPI stays neutral with regard to jurisdictional claims in published maps and institutional affiliations.

