
Effects of Radiant Floor Heating Integrated with Natural Ventilation on Flow and Dispersion in a Newly Decorated Residence

 ,
, 
Abstract
1. Introduction
2. Methodology
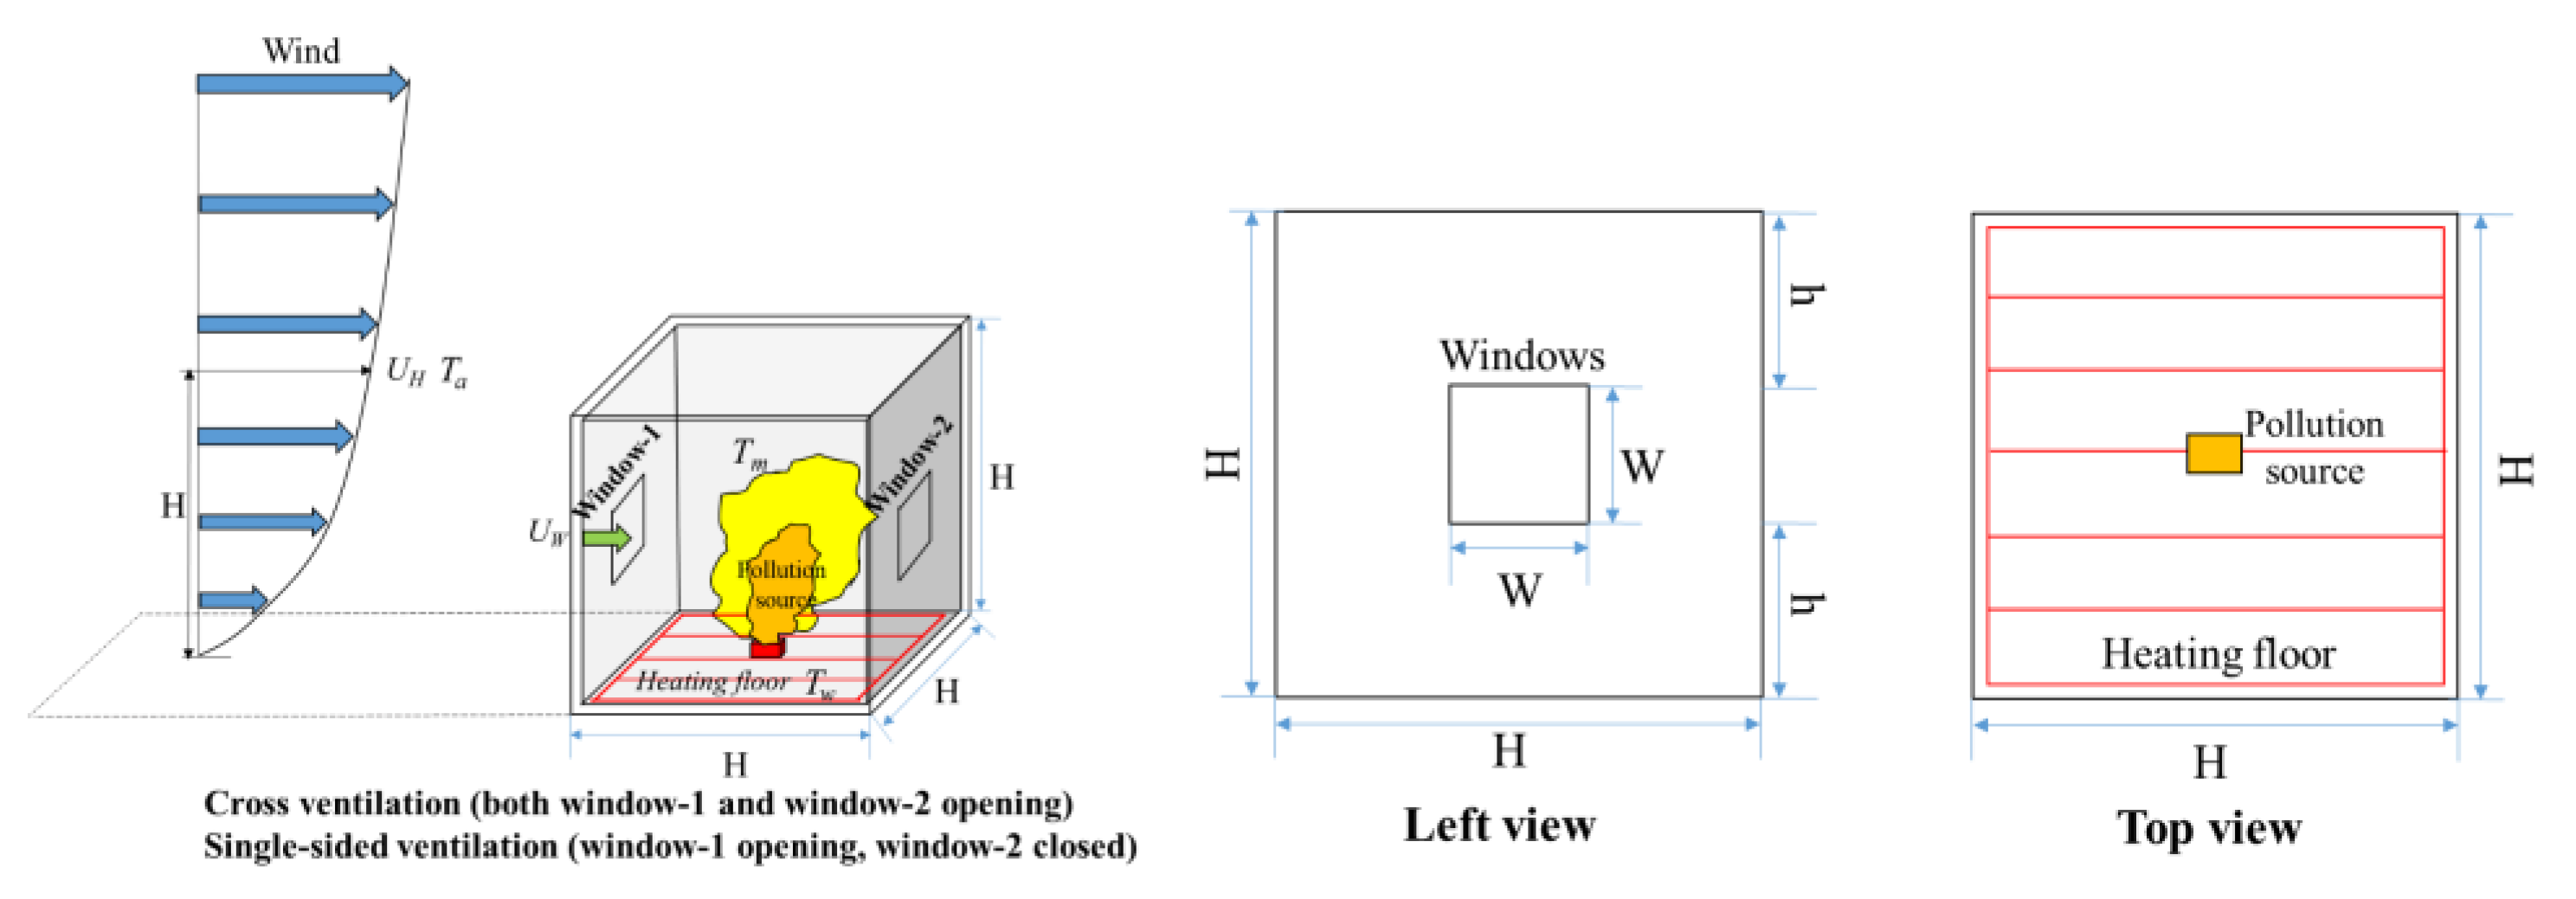
2.1. Physical Model
2.2. Numerical Method
2.2.1. Governing Equations
2.2.2. Computational Domain and Boundary Conditions
3. Wind-Tunnel Experimental Setup
4. Results and Discussion
4.1. Validation of Numerical Models
4.2. Flow and Dispersion Characteristics under the Same Ri but Different Re Values
4.3. Characteristics of Indoor Flow Structures with Varying Ri Values
4.3.1. Contours of U/U0 against Increasing Ri
4.3.2. Mean ACH Plotted against the Square Ri
4.4. Characteristics of Indoor Temperature Distributions with Varying Ri
4.4.1. Contours of θ against Increasing Ri
4.4.2. Mean h against the Square Ri
4.5. Characteristics of Indoor Pollutant Dispersion with Varying Ri Values
4.5.1. Contours of K against Increasing Ri
4.5.2. Mean K in the Room against the Square Ri
5. Conclusions
- (1)
- It can be noted that the similarity criterion of Ri equality should be satisfied first by using a reduced−scale model to study the indoor mixed convection, followed by Re−independence, and the Re value should be as large as possible in order to reduce the deviation caused by the reduced scale.
- (2)
- Indoor flow structures:
- (1)
- Indoor temperature distributions:
- (2)
- Indoor pollutant dispersion:
Author Contributions
Funding
Institutional Review Board Statement
Informed Consent Statement
Data Availability Statement
Acknowledgments
Conflicts of Interest
References
- Rickenbacker, H.J.; Vaden, J.M.; Bilec, M.M. Engaging Citizens in Air Pollution Research: Investigating the Built Environment and Indoor Air Quality and Its Impact on Quality of Life. J. Archit. Eng. 2020, 26, 04020041. [Google Scholar] [CrossRef]
- Jones, A.P. Indoor air quality and health. Atmos. Environ. 1999, 33, 4535–4564. [Google Scholar] [CrossRef]
- Jiru, T.E.; Bitsuamlak, G.T. Application of CFD in Modelling Wind-Induced Natural Ventilation of Buildings—A Review. Int. J. Vent. 2010, 9, 131–147. [Google Scholar] [CrossRef]
- Ren, C.; Cao, S.-J.; Haghighat, F. A practical approach for preventing dispersion of infection disease in naturally ventilated room. J. Build. Eng. 2022, 48, 103921. [Google Scholar] [CrossRef]
- Van Hooff, T.; Blocken, B. Coupled urban wind flow and indoor natural ventilation modelling on a high-resolution grid: A case study for the Amsterdam ArenA stadium. Environ. Model. Softw. 2010, 25, 51–65. [Google Scholar] [CrossRef]
- Omrani, S.; Garcia-Hansen, V.; Capra, B.R.; Drogemuller, R. Effect of natural ventilation mode on thermal comfort and ventilation performance: Full-scale measurement. Energy Build. 2017, 156, 1–16. [Google Scholar] [CrossRef]
- Calautit, J.K.; Hughes, B.R. A passive cooling wind catcher with heat pipe technology: CFD, wind tunnel and field-test analysis. Appl. Energy 2016, 162, 460–471. [Google Scholar] [CrossRef]
- Tominaga, Y.; Blocken, B. Wind tunnel analysis of flow and dispersion in cross-ventilated isolated buildings: Impact of opening positions. J. Wind. Eng. Ind. Aerodyn. 2016, 155, 74–88. [Google Scholar] [CrossRef]
- Ji, L.; Tan, H.W.; Kato, S.; Bu, Z.; Takahashi, T. Wind tunnel investigation on influence of fluctuating wind direction on cross natural ventilation. Build. Environ. 2011, 46, 2490–2499. [Google Scholar] [CrossRef]
- Ikegaya, N.; Hasegawa, S.; Hagishima, A. Time-resolved particle image velocimetry for cross-ventilation flow of generic block sheltered by urban-like block arrays. Build. Environ. 2019, 147, 132–145. [Google Scholar] [CrossRef]
- Shirzadi, M.; Tominaga, Y.; Mirzaei, P.A. Wind tunnel experiments on cross-ventilation flow of a generic sheltered building in urban areas. Build. Environ. 2019, 158, 60–72. [Google Scholar] [CrossRef]
- Tominaga, Y.; Blocken, B. Wind tunnel experiments on cross-ventilation flow of a generic building with contaminant dispersion in unsheltered and sheltered conditions. Build. Environ. 2015, 92, 452–461. [Google Scholar] [CrossRef]
- Liu, X.P.; Niu, J.L.; Kwok, K.C.S.; Wang, J.H.; Li, B.Z. Investigation of indoor air pollutant dispersion and cross-contamination around a typical high-rise residential building: Wind tunnel tests. Build. Environ. 2010, 45, 1769–1778. [Google Scholar] [CrossRef]
- Wang, J.H.; Zhang, T.F.; Wang, S.G.; Battaglia, F. Gaseous pollutant transmission through windows between vertical floors in a multistory building with natural ventilation. Energy Build. 2017, 153, 325–340. [Google Scholar] [CrossRef] [PubMed]
- Mu, D.; Shu, C.; Gao, N.P.; Zhu, T. Wind tunnel tests of inter-flat pollutant transmission characteristics in a rectangular multi-storey residential building, part B: Effect of source location. Build. Environ. 2017, 114, 281–292. [Google Scholar] [CrossRef]
- Liu, C.H.; Leung, D.Y.C.; Barth, M.C. On the prediction of air and pollutant exchange rates in street canyons of different aspect ratios using large-eddy simulation. Atmos. Environ. 2005, 39, 1567–1574. [Google Scholar] [CrossRef]
- Blocken, B. 50 years of Computational Wind Engineering: Past, present and future. J. Wind. Eng. Ind. Aerodyn. 2014, 129, 69–102. [Google Scholar] [CrossRef]
- He, Y.L.; Tao, W.Q. Multiscale Simulations of Heat Transfer and Fluid Flow Problems. J. Heat Transf.-Trans. Asme 2012, 134, 031018. [Google Scholar] [CrossRef]
- Ramponi, R.; Blocken, B. CFD simulation of cross-ventilation for a generic isolated building: Impact of computational parameters. Build. Environ. 2012, 53, 34–48. [Google Scholar] [CrossRef]
- Bangalee, M.Z.I.; Miau, J.J.; Lin, S.Y.; Yang, J.H. Flow visualization, PIV measurement and CFD calculation for fluid-driven natural cross-ventilation in a scale model. Energy Build. 2013, 66, 306–314. [Google Scholar] [CrossRef]
- Van Hooff, T.; Blocken, B.; Tominaga, Y. On the accuracy of CFD simulations of cross-ventilation flows for a generic isolated building: Comparison of RANS, LES and experiments. Build. Environ. 2017, 114, 148–165. [Google Scholar] [CrossRef]
- Kosutova, K.; van Hooff, T.; Vanderwel, C.; Blocken, B.; Hensen, J. Cross-ventilation in a generic isolated building equipped with louvers: Wind-tunnel experiments and CFD simulations. Build. Environ. 2019, 154, 263–280. [Google Scholar] [CrossRef]
- Ai, Z.T.; Mak, C.M. Modeling of coupled urban wind flow and indoor air flow on a high-density near-wall mesh: Sensitivity analyses and case study for single-sided ventilation. Environ. Model. Softw. 2014, 60, 57–68. [Google Scholar] [CrossRef]
- Peren, J.I.; van Hooff, T.; Leite, B.C.C.; Blocken, B. CFD analysis of cross-ventilation of a generic isolated building with asymmetric opening positions: Impact of roof angle and opening location. Build. Environ. 2015, 85, 263–276. [Google Scholar] [CrossRef]
- Yang, X.; Zhang, Y.; Hang, J.; Lin, Y.Y.; Mattsson, M.; Sandberg, M.; Zhang, M.; Wang, K. Integrated assessment of indoor and outdoor ventilation in street canyons with naturally -ventilated buildings by various ventilation indexes. Build. Environ. 2020, 169, 106528. [Google Scholar] [CrossRef]
- Tong, Z.M.; Chen, Y.J.; Malkawi, A. Defining the Influence Region in neighborhood-scale CFD simulations for natural ventilation design. Appl. Energy 2016, 182, 625–633. [Google Scholar] [CrossRef]
- Van Hooff, T.; Blocken, B. CFD evaluation of natural ventilation of indoor environments by the concentration decay method: CO2 gas dispersion from a semi-enclosed stadium. Build. Environ. 2013, 61, 1–17. [Google Scholar] [CrossRef]
- Shirzadi, M.; Mirzaei, P.A.; Naghashzadegan, M.; Tominaga, Y. Modelling enhancement of cross-ventilation in sheltered buildings using stochastic optimization. Int. J. Heat Mass Transf. 2018, 118, 758–772. [Google Scholar] [CrossRef]
- Ai, Z.T.; Mak, C.M. Potential use of reduced-scale models in CFD simulations to save numerical resources: Theoretical analysis and case study of flow around an isolated building. J. Wind. Eng. Ind. Aerodyn. 2014, 134, 25–29. [Google Scholar] [CrossRef]
- Gilani, S.; Montazeri, H.; Blocken, B. CFD simulation of stratified indoor environment in displacement ventilation: Validation and sensitivity analysis. Build. Environ. 2016, 95, 299–313. [Google Scholar] [CrossRef]
- Kosutova, K.; van Hooff, T.; Blocken, B. CFD simulation of non-isothermal mixing ventilation in a generic enclosure: Impact of computational and physical parameters. Int. J. Therm. Sci. 2018, 129, 343–357. [Google Scholar] [CrossRef]
- Zhang, C.; Pomianowski, M.; Heiselberg, P.K.; Yu, T. A review of integrated radiant heating/cooling with ventilation systems- Thermal comfort and indoor air quality. Energy Build. 2020, 223, 110094. [Google Scholar] [CrossRef]
- Olesen, B.W. Radiant floor heating in theory and practice. Ashrae J. 2002, 44, 19–26. [Google Scholar]
- Jiang, T.T.; Zheng, C.X.; You, S.J.; Zhang, H.; Wu, Z.J.; Wang, Y.R.; Wei, S. Experimental and numerical study on the heat transfer performance of the radiant floor heating condenser with composite phase change material. Appl. Therm. Eng. 2022, 213, 118749. [Google Scholar] [CrossRef]
- Zhou, Y.; Deng, Y.; Wu, P.; Cao, S. The effects of ventilation and floor heating systems on the dispersion and deposition of fine particles in an enclosed environment. Build. Environ. 2017, 125, 192–205. [Google Scholar] [CrossRef]
- Uehara, K.; Wakamatsu, S.; Ooka, R. Studies on critical Reynolds number indices for wind-tunnel experiments on flow within urban areas. Bound.-Layer Meteorol. 2003, 107, 353–370. [Google Scholar] [CrossRef]
- Tominaga, Y.; Stathopoulos, T. Turbulent Schmidt numbers for CFD analysis with various types of flowfield. Atmos. Environ. 2007, 41, 8091–8099. [Google Scholar] [CrossRef]
- Jahanbin, A.; Zanchini, E. Effects of position and temperature-gradient direction on the performance of a thin plane radiator. Appl. Therm. Eng. 2016, 105, 467–473. [Google Scholar] [CrossRef]
- Yakhot, V.; Orszag, S.A. Renormalization group analysis of turbulence. I. Basic theory. J. Sci. Comput. 1986, 1, 3–51. [Google Scholar] [CrossRef]
- Tominaga, Y.; Mochida, A.; Yoshie, R.; Kataoka, H.; Nozu, T.; Yoshikawa, M.; Shirasawa, T. AIJ guidelines for practical applications of CFD to pedestrian wind environment around buildings. J. Wind. Eng. Ind. Aerodyn. 2008, 96, 1749–1761. [Google Scholar] [CrossRef]
- Cui, P.Y.; Chen, W.Q.; Wang, J.Q.; Zhang, J.H.; Huang, Y.D.; Tao, W.Q. Numerical studies on issues of Re-independence for indoor airflow and pollutant dispersion within an isolated building. Build. Simul. 2022, 15, 1259–1276. [Google Scholar] [CrossRef] [PubMed]
- Li, X.X.; Liu, C.H.; Leung, D.Y.C. Development of a k-epsilon model for the determination of air exchange rates for street canyons. Atmos. Environ. 2005, 39, 7285–7296. [Google Scholar] [CrossRef]
- Huang, Y.D.; Li, M.Z.; Ren, S.Q.; Wang, M.J.; Cui, P.Y. Impacts of tree-planting pattern and trunk height on the airflow and pollutant dispersion inside a street canyon. Build. Environ. 2019, 165, 106385. [Google Scholar] [CrossRef]


| Cases | UH | ReH | Uw | Rew | ΔT (K) | Gr | Ri = Gr/Rew2 |
|---|---|---|---|---|---|---|---|
| 1 | 6 | 1.36 × 10⁵ | 3.96 | 8.94 × 10⁴ | 0 | 0 | 0 |
| 2 | 6 | 1.36 × 10⁵ | 3.96 | 8.94 × 10⁴ | 60 | 3.08 × 10⁸ | 0.04 |
| 3 (a) | 4 | 9.04 × 10⁴ | 2.65 | 5.98 × 10⁴ | 240 | 9.55 × 10⁸ | 0.27 |
| 3 (b) | 3 | 6.78 × 10⁴ | 1.99 | 4.50 × 10⁴ | 120 | 5.61 × 10⁸ | 0.27 |
| 3 (c) | 1.5 | 3.39 × 10⁴ | 1.00 | 2.26 × 10⁴ | 25 | 1.36 × 10⁸ | 0.27 |
| 4 | 1.5 | 3.39 × 10⁴ | 0.90 | 2.04 × 10⁴ | 180 | 7.74 × 10⁸ | 1.86 |
| 5 | 1 | 2.26 × 10⁴ | 0.59 | 1.34 × 10⁴ | 240 | 9.55 × 10⁸ | 5.31 |
| 6 | 0.8 | 1.81 × 10⁴ | 0.44 | 1.00 × 10⁴ | 300 | 1.11 × 10⁹ | 11.11 |
| 7 | 0.6 | 1.36 × 10⁴ | 0.30 | 6.84 × 10³ | 360 | 1.25 × 10⁹ | 26.65 |
| Boundary Conditions | Velocity | k | ε | Temperature | Pollutants |
|---|---|---|---|---|---|
| Inlet plane | Ta | 0 | |||
| Outlet plane | ; v = w = 0 | ||||
| Central plane | ; v = 0 | ||||
| Top plane | ; w = 0 | ||||
| Right/left plane | ; v = 0 | ||||
| Building walls (Wood) | SWFs | 0 | 0 | Mixed | Zero gradient |
| Outdoor bottom plane | SWFs | 0 | 0 | h = 0 | Zero gradient |
| Indoor ground (Aluminum) | SWFs | 0 | 0 | Tf | Zero gradient |
| Pollutant source | 0 | 0 | 0 | / | 0.025 g/(m3·s) |
| Cases | Ri | ||||||||
|---|---|---|---|---|---|---|---|---|---|
| 1 | 0 | 0.1049 | 0.0433 | 0.1118 | 0.0433 | 0.1482 | 0.1551 | 0.71/0.29 | 0.72/0.28 |
| 2 | 0.04 | 0.1059 | 0.0441 | 0.1102 | 0.0444 | 0.1500 | 0.1546 | 0.71/0.29 | 0.71/0.29 |
| 3 | 0.27 | 0.1064 | 0.0443 | 0.1121 | 0.0443 | 0.1507 | 0.1564 | 0.71/0.29 | 0.72/0.28 |
| 4 | 1.86 | 0.1035 | 0.0439 | 0.1114 | 0.0439 | 0.1474 | 0.1553 | 0.70/0.30 | 0.72/0.28 |
| 5 | 5.31 | 0.0948 | 0.0532 | 0.1067 | 0.0532 | 0.1480 | 0.1599 | 0.64/0.36 | 0.67/0.33 |
| 6 | 11.11 | 0.0889 | 0.0408 | 0.1037 | 0.0408 | 0.1297 | 0.1445 | 0.69/0.31 | 0.72/0.28 |
| 7 | 26.65 | 0.0770 | 0.0444 | 0.0968 | 0.0444 | 0.1214 | 0.1411 | 0.63/0.37 | 0.69/0.31 |
| Cases | Ri | ||||||||
|---|---|---|---|---|---|---|---|---|---|
| 1 | 0 | 0.0069 | 0.0216 | 0.0071 | 0.0216 | 0.0285 | 0.0287 | 0.24/0.76 | 0.25/0.75 |
| 2 | 0.04 | 0.0069 | 0.0215 | 0.0062 | 0.0215 | 0.0284 | 0.0278 | 0.24/0.76 | 0.22/0.78 |
| 3 | 0.27 | 0.0063 | 0.0220 | 0.0066 | 0.0220 | 0.0283 | 0.0286 | 0.22/0.78 | 0.23/0.77 |
| 4 | 1.86 | 0.0028 | 0.0219 | 0.0023 | 0.0219 | 0.0247 | 0.0242 | 0.11/0.89 | 0.09/0.91 |
| 5 | 5.31 | 0.0043 | 0.0214 | 0.0040 | 0.0214 | 0.0258 | 0.0254 | 0.17/0.83 | 0.16/0.84 |
| 6 | 11.11 | 0.0188 | 0.0175 | 0.0244 | 0.0175 | 0.0364 | 0.0420 | 0.52/0.48 | 0.58/0.42 |
| 7 | 26.65 | 0.0354 | 0.0182 | 0.0510 | 0.0182 | 0.0536 | 0.0692 | 0.66/0.34 | 0.74/0.26 |
Publisher’s Note: MDPI stays neutral with regard to jurisdictional claims in published maps and institutional affiliations. |
© 2022 by the authors. Licensee MDPI, Basel, Switzerland. This article is an open access article distributed under the terms and conditions of the Creative Commons Attribution (CC BY) license (https://creativecommons.org/licenses/by/4.0/).
Share and Cite
Cui, P.-Y.; Wang, J.-Q.; Yang, F.; Zhao, Q.-X.; Huang, Y.-D.; Yang, Y.; Tao, W.-Q. Effects of Radiant Floor Heating Integrated with Natural Ventilation on Flow and Dispersion in a Newly Decorated Residence. Int. J. Environ. Res. Public Health 2022, 19, 16889. https://doi.org/10.3390/ijerph192416889
Cui P-Y, Wang J-Q, Yang F, Zhao Q-X, Huang Y-D, Yang Y, Tao W-Q. Effects of Radiant Floor Heating Integrated with Natural Ventilation on Flow and Dispersion in a Newly Decorated Residence. International Journal of Environmental Research and Public Health. 2022; 19(24):16889. https://doi.org/10.3390/ijerph192416889
Chicago/Turabian StyleCui, Peng-Yi, Jia-Qi Wang, Feng Yang, Qing-Xia Zhao, Yuan-Dong Huang, Yong Yang, and Wen-Quan Tao. 2022. "Effects of Radiant Floor Heating Integrated with Natural Ventilation on Flow and Dispersion in a Newly Decorated Residence" International Journal of Environmental Research and Public Health 19, no. 24: 16889. https://doi.org/10.3390/ijerph192416889
APA StyleCui, P.-Y., Wang, J.-Q., Yang, F., Zhao, Q.-X., Huang, Y.-D., Yang, Y., & Tao, W.-Q. (2022). Effects of Radiant Floor Heating Integrated with Natural Ventilation on Flow and Dispersion in a Newly Decorated Residence. International Journal of Environmental Research and Public Health, 19(24), 16889. https://doi.org/10.3390/ijerph192416889