Article

Identifying Evacuation Needs and Resources Based on Volunteered Geographic Information: A Case of the Rainstorm in July 2021, Zhengzhou, China

1
Department of Architecture and Building Science, Graduate School of Engineering, Tohoku University, Sendai 980-8579, Japan
2
International Research Institute of Disaster Science, Tohoku University, Sendai 980-8572, Japan
3
Department of Earth Science, Graduate School of Science, Tohoku University, Sendai 980-8578, Japan
*
Author to whom correspondence should be addressed.
Int. J. Environ. Res. Public Health 2022, 19(23), 16051; https://doi.org/10.3390/ijerph192316051
Submission received: 28 October 2022 / Revised: 23 November 2022 / Accepted: 28 November 2022 / Published: 30 November 2022

Abstract

:
Recently, global climate change has led to a high incidence of extreme weather and natural disasters. How to reduce its impact has become an important topic. However, the studies that both consider the disaster’s real-time geographic information and environmental factors in severe rainstorms are still not enough. Volunteered geographic information (VGI) data that was generated during disasters offered possibilities for improving the emergency management abilities of decision-makers and the disaster self-rescue abilities of citizens. Through the case study of the extreme rainstorm disaster in Zhengzhou, China, in July 2021, this paper used machine learning to study VGI issued by residents. The vulnerable people and their demands were identified based on the SOS messages. The importance of various indicators was analyzed by combining open data from socio-economic and built-up environment elements. Potential safe areas with shelter resources in five administrative districts in the disaster-prone central area of Zhengzhou were identified based on these data. This study found that VGI can be a reliable data source for future disaster research. The characteristics of rainstorm hazards were concluded from the perspective of affected people and environmental indicators. The policy recommendations for disaster prevention in the context of public participation were also proposed.

1. Introduction

1.1. Background

Climate change has led to extreme rainfall and the resulting floods have been frequent in recent years, severely hindering global sustainability [1]. Populations and economic activities are concentrated in cities and hence vulnerable to heavy rainfall and urban flooding [2]. In many developing countries [3], urbanization has considerably impacted hydrology [4]. For example, the extreme rainstorm event in Zhengzhou, China, in July 2021 resulted in a large number of casualties and property damage. The mismatch between rapid urbanization and infrastructure construction, such as underdeveloped urban road networks [5], has increased the likelihood of urban flooding from heavy rainfall [6]. In recent years, urban flooding caused by extreme rainstorms has frequently occurred in many countries; since urban rainstorms are sudden, clustered, and continuous, emergency management is extremely difficult [7]. How to reduce the impact of extreme weather, especially urban rainstorm hazards has become an important topic in the field of Disaster Risk Reduction (DRR). The Sendai Framework for Disaster Risk Reduction 2015–2030 (SFDRR) emphasized the priority of understanding disaster risk. To achieve this, it is necessary but not limited to collecting, and analyzing the relevant data. Besides, the use of location-based disaster risk information and related technology is encouraged to realize the identification of disaster vulnerability, characteristics, etc [8].
Technological development and the Web 2.0 era provide unlimited possibilities for DRR and emergency management (EM). Emergency management is a complex field that involved multi-disciplinary, interdisciplinary approaches, and a diversity of data and information. Big data and emergency management (BDEM), is now viewed by researchers as an emerging research area based on different knowledge, culture, and social backgrounds. Applications such as mobile communication, online social network, etc. are the core topics of the BDEM field [9]. Information visualization (InfoVis) is another key issue in EM. It provides an approach to helping to understand and analyze the huge amount of data produced during emergencies [10]. Based on the visualization of the multi-source information, the government will be easier to make the appropriate decisions in a disaster. The emergence of volunteered geographic information (VGI) and its widespread use have greatly helped disaster research and EM.
VGI refers to geographic information that is voluntarily and widely created and shared by citizens through platforms such as social media and mobile smart apps [11]. Created primarily by common citizens, these data have recently emerged as a complementary information source to traditional authoritative information [12]. Network technology development and the use of devices such as smartphones have enabled citizens from all literacy and age backgrounds to play the role of sensors, receiving and generating various spatial information from their daily lives. This spontaneously generated VGI is widely used in environmental monitoring, event reporting, disaster management, human behavior analysis, and land-use mapping [13,14]. VGI has also been widely used to understand and analyze the development of cities or regions, as well as human activities [15]. It is as effective as professional geographic information (PGI) in an outdoor recreational context, and the combination of PGI and VGI can be effectively used for the planning of outdoor activities [16]. In disaster-related research, VGI plays a critical role in the disaster management processes of prevention, preparedness, and response. Most studies have focused on the application of citizen-contributed VGI data in disaster response [17,18], and it has been proven to be very useful for collecting disaster crisis information, especially in flood and fire disasters [19]. Highly credible on-site location information is critical for rescue and subsequent recovery during disasters; however, such data are often difficult or impossible to obtain in a timely manner. VGI is highly valuable for the affected population, including for rescuers, decision-makers, and other key players [20]. The generation, dissemination, and use of VGI for disaster-related geographic data provided by citizens are realized through the development of VGI-related technologies and volunteer assistance [21,22]. VGI is cost-efficient and of lower cost than methods of traditional data collection and use [23]. It can provide near real-time information during disasters and location information that can be used to effectively identify disaster risk areas and generate hazard maps [24]. In addition to disaster response, it can also be applied to post-disaster spatial planning. For example, Kusumo, Reckien, and Verplanke [25] used VGI to analyze the choice and preference of shelter locations during floods among residents of Jakarta, Indonesia and compared it to the locations of official evacuation shelters. VGI is emerging as a new data source that can be applied to urban resilience enhancement, which breaks the traditional top-down resilience enhancement pathway [26] and enhances participation during disaster management in a bottom-up manner, contributing toward the resilience of affected groups and regions [27,28].
Research and application of VGI are largely technology-driven [29]. The application and development of VGI data are largely constrained by their inherent uncertainty and the need for extensive manual manipulation. Therefore, effective VGI use requires support from other technologies [30]. The combination of artificial intelligence (AI) related methods in VGI data application has become an important research trend in recent years. For example, Yuan et al. [31], used VGI data and deep-learning methods to map buildings in Kano state, Nigeria, to effectively support socio-economic development. Arapostathis [32], used machine learning to classify information from VGI-sourced social media tweets to identify information (e.g., geographic location) for flood disaster research. Feng and Sester [33], combined deep learning to analyze flood events in Paris, London, and Berlin. It is difficult for managers and policymakers such as governments to collect statistical data on natural disasters such as typhoons. However, real-time disaster information shared by citizens through social media platforms during a disaster can generate a considerable amount of VGI regarding the disaster situation. This provides effective information for disaster management stakeholders. Its proper use can also strongly support disaster risk reduction [34]. For example, VGI data from social media and the K-nearest neighbor (KNN) algorithm were used to extract and classify typhoon disasters in the southeastern coastal region of China [35]. Currently, VGI is predominantly applied to flood and forest fire studies in Europe and North America; the combination of VGI data and scientific models has become an important research method for natural hazard analysis in recent years [36].

1.2. Recent Trends for Rainstorm Research

The research methodology for determining flooding risk has recently shifted from qualitative to quantitative studies [37]; however, most studies on rainstorms and urban flooding are based on geographic information system (GIS) assessments [38], scenario simulation [39], and other model construction methods. Although open and big data have been widely used in urban research, few studies have applied them to rainstorms [40]. Machine learning is an effective tool compared with traditional research methods and is increasingly being applied in rainstorm studies. For example, machine-learning methods and AI techniques for the two-dimensional principal component analysis (2DPCA) method have been used to study the dynamic characteristics of spatial and temporal distributions of rainstorm events in the coastal city of Shenzhen, China, to enable early identification of rainstorm risk [41,42]. Machine learning has also been used to construct a model for flood damage assessment of extreme rainfall events from economic and demographic perspectives [43]. Predictions of urban flooding inundation due to short-duration rainstorms have also been made based on random forest and KNN machine-learning algorithms [44]. Therefore, applying machine-learning methods to VGI is effective for rainstorm research.
Through a preliminary review of the priority proposed by SFDRR and the background of rainstorm-related research, some potential research inadequacies could be noticed. First, the studies focused on spatial risk or impact tend to consider static environmental indicators, which may ignore real-time situations during the disaster process, disaster characteristics, and especially the demands of the affected people. Second, the studies focused on real-time information such as social media posts may tend to belittle the role and value of spatial geographic location information. However, it is necessary to combine static environmental factors with the disaster’s real-time geographic information to identify the disaster characteristics such as vulnerable people and their needs. The widespread use of social media among people in their daily lives in recent times provides more opportunities for determining disaster risk reduction from the perspective of public participation. Hence, by using VGI and machine-learning methods, this paper aims to figure out the following two questions:
(1) How is the characteristic of a severe rainstorm from the perspective of the affected people?
(2) Based on the VGI and environmental indicators, where might be potential shelters with evacuation needs and resources?
By exploring the above two questions, we expect to realize the value and goal of this research from two levels. First, to identify the characteristics of the hazard and possibilities in optimization and enhancement of disaster shelter site selection through the case study of Zhengzhou City for severe rainstorm hazard prevention from the perspective of public participation. Second, beyond the case and the rainstorm hazard itself, to provide some policy recommendations for future emergency management and DRR in the context of the Web 2.0 era. This paper will be described in the following order: In Section 2, the study area, data, and research methods are introduced. In Section 3, the results of this study are presented, including textual analysis of the VGI data collected based on Baidu AI and a Latent Dirichlet Allocation (LDA) model, importance analysis of indicators based on random forest, and construction and prediction of security location models based on binary logistic regression, random forest, and Support Vector Classification (SVC). In Section 4, the findings and possible shortcomings of this study are discussed. In Section 5, a summary of this paper and future research directions are presented.

2. Materials and Methods
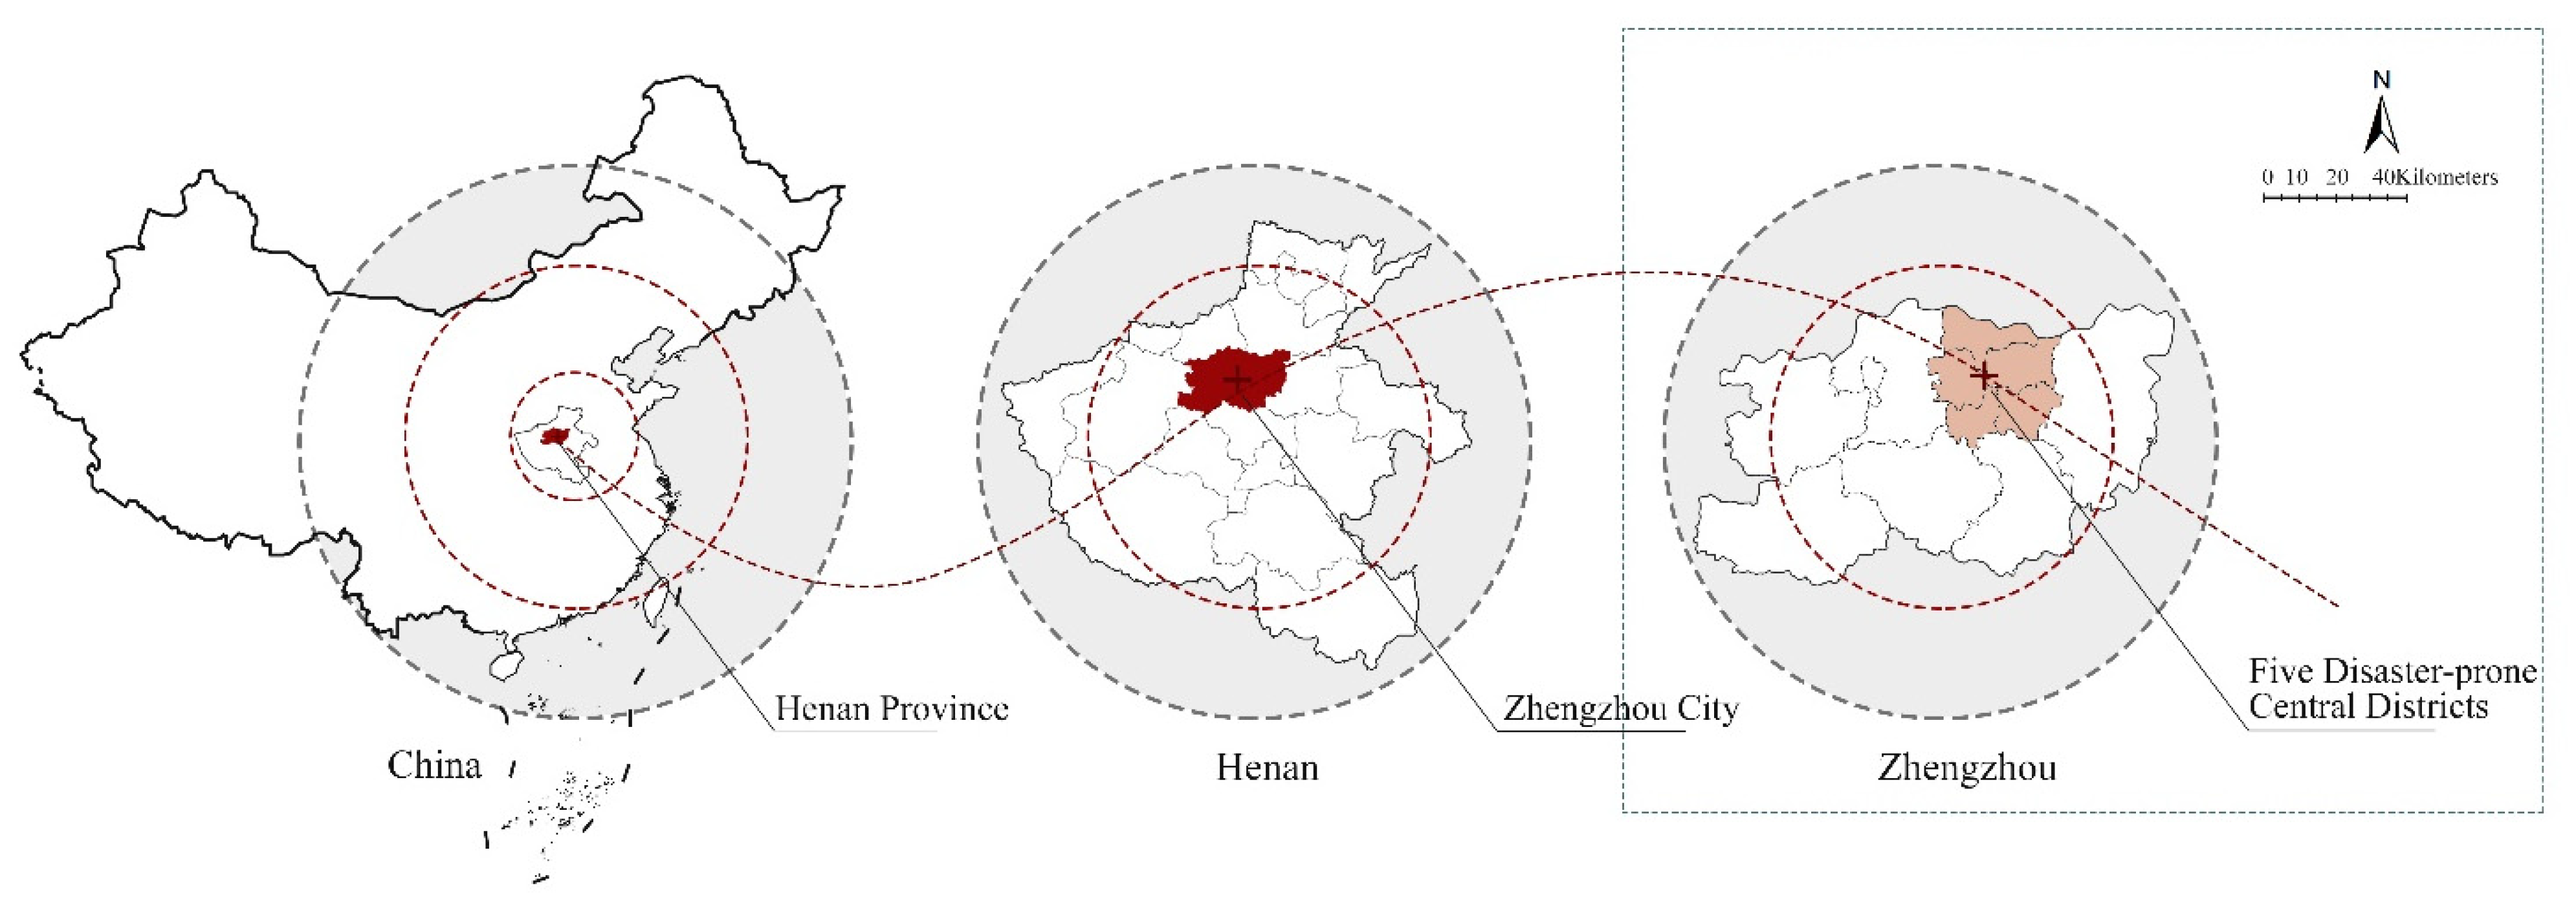
2.1. Study Site

Henan Province (110°21′–116°39′ E and 31°23′–36°22′ N) is located in the middle and lower reaches of the Yellow River in east–central China. Zhengzhou City is its capital with six districts (Zhongyuan, Erqi, Guanchenghuizu, Jinshui, Shangjie, and Huiji districts), five county-level cities (Gongyi, Xingyang, Xinmi, Xinzheng, and Dengfeng cities), and one county (Zhongmou County) [45] (Figure 1). Zhengzhou City has a warm temperate continental climate with an average annual rainfall of 640.9 mm.
With an area of 7567 square kilometers and a municipal urban built-up area of 1284.89 square kilometers and an urbanization rate of 78.4%, Zhengzhou is a supercity in central China that has a population of 12.6 million [46]. This kind of high-density city’s disaster response capability and urban resilience level has been the focus of research, especially following the extreme rainstorm disaster on 20 July 2021. Recent studies related to the rainstorm disaster chiefly involve the resilience level evaluation index system of Zhengzhou City [47] and the coupled model of urban built-up area flood forecasting [45]. Research has also focused on the evaluation system of rainstorm safety patterns and land-use strategy under different flood risk levels [48], the joint distribution models of rainstorm elements [49], and urban flood depth prediction [50].
On 17–23 July 2021, Henan Province experienced one of the most severe torrential rainfall events in recorded history and consequent severe flooding. Zhengzhou City was particularly severely affected on 20 July. According to information provided by AIRWISE (https://airwise.hjhj-e.com/ (accessed on 16 March 2022), between 0:00 and 23:00 on 20 July, maximum rainfall in Zhengzhou City occurred at 17:00, and cumulative rainfall in Erqi, Jinshui, Zhongyuan, Huiji, and Guanchenghuizu districts (in the central part of the city) exceeded 600 mm (Figure 2). During this disaster, which encompassed 95.5% of the province, 380 people died or disappeared. This severe hazard was defined by the Chinese Government as a rare torrential rainstorm in history. Its intensity and scope broke historical records, far exceeding the urban and rural flood response capabilities. Large areas of urban and rural areas of the city, especially the depressions in urban streets were severely flooded. Many people were trapped in places such as residences, subway stations, or other indoor establishments. Despite the natural factors, the human factors in delay and lack of emergency management were also causes of such major losses that cannot be ignored [51]. In this circumstance, both considering the timeliness and its practical significance for future disaster prevention in cities of similar scale, we chose Zhengzhou City as the study site of this paper.

2.2. Collection and Processing of VGI Data and Indicators

The rainstorm began on 17 July and became severe on 20 July, trapping many people on this day. VGI used in this study was obtained from data compiled by volunteers from 20–23 July 2021. Volunteers collected information from social media platforms such as Sina Weibo [52], and WeChat for providing mutual aid during the disaster. They used an online sharing document tool called Shimo (https://shimo.im/ (accessed on 8 February 2022)), sorting the various information into one open-access document accessible to everyone. VGI content was collated for three main areas. First, there were a total of 301 pieces of real-time SOS messages sent by residents during disasters (Table 1).
Second, there were a total of 343 pieces of information on disaster relief that the private sector could provide or temporary water points issued by the government. Third, a total of 241 pieces of information on severely affected areas (such as broken road sections and electricity leakage) were independently reported by citizens. Through manual inspection of the textual information, the addresses in them were screened. Using a tool called “DataMap For Excel”, these addresses were searched on Gaode Map (https://ditu.amap.com/ (accessed on 18 March 2022)) to receive coordinates. These coordinates belonged to the GCJ-02 coordinate system which was not sufficiently accurate with real locations. To ensure the reliability of results, the coordinates of points were converted to the WGS-84 coordinate system for analysis in ArcMap 10.8. Then, each coordinate point was resolved and calibrated from the location obtained from the text as indicator values corresponding to its spatial position. A total of 522 hazardous locations were extracted from VGI using issued SOS messages, including 300 safe locations that were potential evacuation resources for address resolution and subsequent spatial analysis.
In this study, socio-economic [53,54,55], demographic [56,57], and spatial data were also collected. To improve the reproducibility and applicability of the methods proposed, all the data in this research were open data. To improve the data credibility, we also corrected the population data collected by WorldPop based on the results of the seventh census of China. For spatial aspects, topography [58], the number of points of interest (POIs) [50], impervious surfaces [59], and land-use types [53,60,61,62,63,64], were separately selected based on existing studies. We assigned these data to each of the 822 points in VGI to establish a spatial association. We used ArcMap 10.8 to divide the Zhengzhou City area into 250 × 250 m grids [65], and assigned corresponding data separately to each grid. Spatial interpolation was carried out for data with insufficient precision, such as the gross domestic product (GDP), to construct a database with the distribution of hazard and safety locations in the disaster with 25 indicators, as shown in Table 2 [66,67,68].

2.3. Methods

This paper selected the research methods according to the characteristics of the data and the research purpose, whilst considering the methods applied in similar research. For VGI data in the form of text and spatial information, the corresponding methods were employed, respectively. The methods used in this research were determined by the workflow (Figure 3) that reflected the main processes of data collection, processing, and analysis. The first part of the methods was applied to textual analysis for the identification of disaster sentiment and evacuation needs. The second part was applied to measure the importance of influencing indicators and propose suggestions for improving strategies for disaster prevention and disaster risk reduction.
In the first part, the textual analysis was mainly conducted for SOS messages from citizens in the VGI [7]. Three methods were used for identifying evacuation needs. The text of SOS messages from citizens in VGI was divided into words by a Python module named Jieba. Using Python, word frequency and lexical statistics were counted to identify keywords in the SOS messages. The SOS messages were then analyzed for sentiment tendency on a line-by-line basis using Python and the application programming interface (API) of sentiment analysis on the Baidu AI open platform [58] (https://ai.baidu.com/tech/nlp_apply/sentiment_classify (accessed on 12 April 2022). This tool was based on sentiment knowledge enhanced pre-training for sentiment analysis (SKEP), which made it possible to assess the text with a single subject of its subjective information in sentence-level sentiment classification [69]. The output results included the request unique identification code (log_id) of the text, sentiment polarity classification result (0: negative, 1: neutral, 2: positive), probability of belonging to the positive or negative category (value range [0, 1]), and confidence of the judgment result (value range [0, 1]). An LDA model [52,70], was constructed using Python to select the optimal number of topics and content suitable for further understanding of the topic distribution of SOS messages. LDA was a generative probabilistic model and may be used for text corpora. The formula is given below (1) [71]. By establishing a model for the SOS document, the coherence value for each number of topics was calculated and compared. The model with proper coherence value was selected as a suitable model to describe the topic classification for the entire text.
p ( D | α , β ) = d = 1 M p ( θ d | α ) ( n = 1 N d Z d n p ( z d n | θ d ) p ( w d n | z d n , β ) ) d θ d
As a three-level hierarchical Bayesian model, there are corpus-level parameters a and b, document-level variables θ d, and the word-level variables wdn and zdn.
In the second part, classifications corresponding to 822 sets of address information, and their corresponding 25 indicators, were used to construct the importance ranking for indicators based on the random forest algorithm [72] using Python. It is a method called random forest variable importance measures(VIMs) that often used to rank candidate predictors [73]. During the initial stages of dataset building, whether a point was safe or dangerous, and the values of the 25 variables associated with that point were known. However, there were differences in the predictive power of these 25 variables for this result; therefore, a random forest model was constructed to compare the degree of influence for the value of each variable on the result. Measurement of the importance of variables was conducive to selecting more important variables as prediction indicators for subsequent model construction and data training, thereby improving the prediction ability of the model.
Based on the indicator’s importance ranking, the optimization of disaster prevention strategies was considered from the perspective of the built-up environment. According to the binary classification nature of point data, binary logistic regression [74], random forest, and SVC [75,76] models are the most common methods for learning and prediction. In this study, three models were constructed with 70% and 30% as the training and test sets, respectively. The results were recorded and compared after placing the 1–25 indicators into the models according to their importance ranking. The best-performing algorithm and the number of indicators were selected according to the parameters for the best prediction model. Five districts (Zhongyuan, Erqi, Guanchenghuizu, Jinshui, and Huiji districts) in the central area of Zhengzhou City had higher rainfall, vulnerability, and susceptibility to flooding than other areas in the city [48] on July 20 and these were used as prediction objects to identify potential safe shelter resource points in the event of heavy rainfall disasters.

3. Results

3.1. Textual Analysis

3.1.1. Keywords and Sentiments in SOS Messages

Among the 301 SOS text messages, a total of 1898 words were classified. The word frequency and nature were counted, and the most frequent word nature was identified as nouns, verbs, numbers, place names, times, and premises. These reflected the characteristics, number, location, and behavior of the affected people. Words such as “trapped,” “rescue,” “elderly,” “food,” “children,” “power outage,” and “lost” were counted more than 20 times, reflecting the real-time situation of people trapped during the disaster (Table 3).
The 301 SOS text messages were judged by the Baidu AI Open Platform. Among them, 36, 256, and 9 were judged to contain positive, negative, and neutral emotions, respectively. A total of 199 data with >80% confidence level were screened out, including 188 negative sentiments, accounting for 94.47%. This showed that the SOS messages consistently referred to negative emotions, which was in line with the general perception, and indicated that this dataset could realistically reflect the emotions of citizens during disasters. However, these messages also contained some neutral or positive sentiments which reflected that those messages were likely to have not only been sent by the person involved in the disaster but also that some people in a safe situation had sent messages to those trapped in the disaster.

3.1.2. Topics of SOS Messages

Using the LDA method, models with 2–30 topic counts were trained separately and their consistency scores were calculated as a basis for comparison. Consistency scores showed a tendency to fluctuate across the number of topics (Figure 4). A model with 12 topics was selected because it had a relatively high consistency score when N = 12 and was an end of rapid growth in the image. Considering the limited amount of data, the trend of consistency score changes, consistency scores, and the comprehensibility and distinguishability of the output contents of each topic were considered when selecting the model. The number of topics selected did not exceed 15, effectively avoiding the problem whereby more topic count models would have higher consistency scores but also more keyword repetition, which is detrimental to interpreting the topic results.
Table 4 shows the specifics of the model with 12 topic counts. Each topic group was set to be ranked by the 10 most important keywords for that topic and their weighting from highest to lowest. Due to the existence of one unrecognized Chinese character, there were nine keywords in topics No. 2 and No. 7. However, the main content in each topic was not affected. The keywords in each topic reflected the content of that specific topic. SOS message topics involved the needs of vulnerable people such as the elderly [77], children, and pregnant women; shortages of medical resources, water, and energy; terrain characteristics of the location in which people were trapped; and location information. There were also contents such as time spent trapped, the difficulty of rescue, the health status of trapped people, and disaster communication.

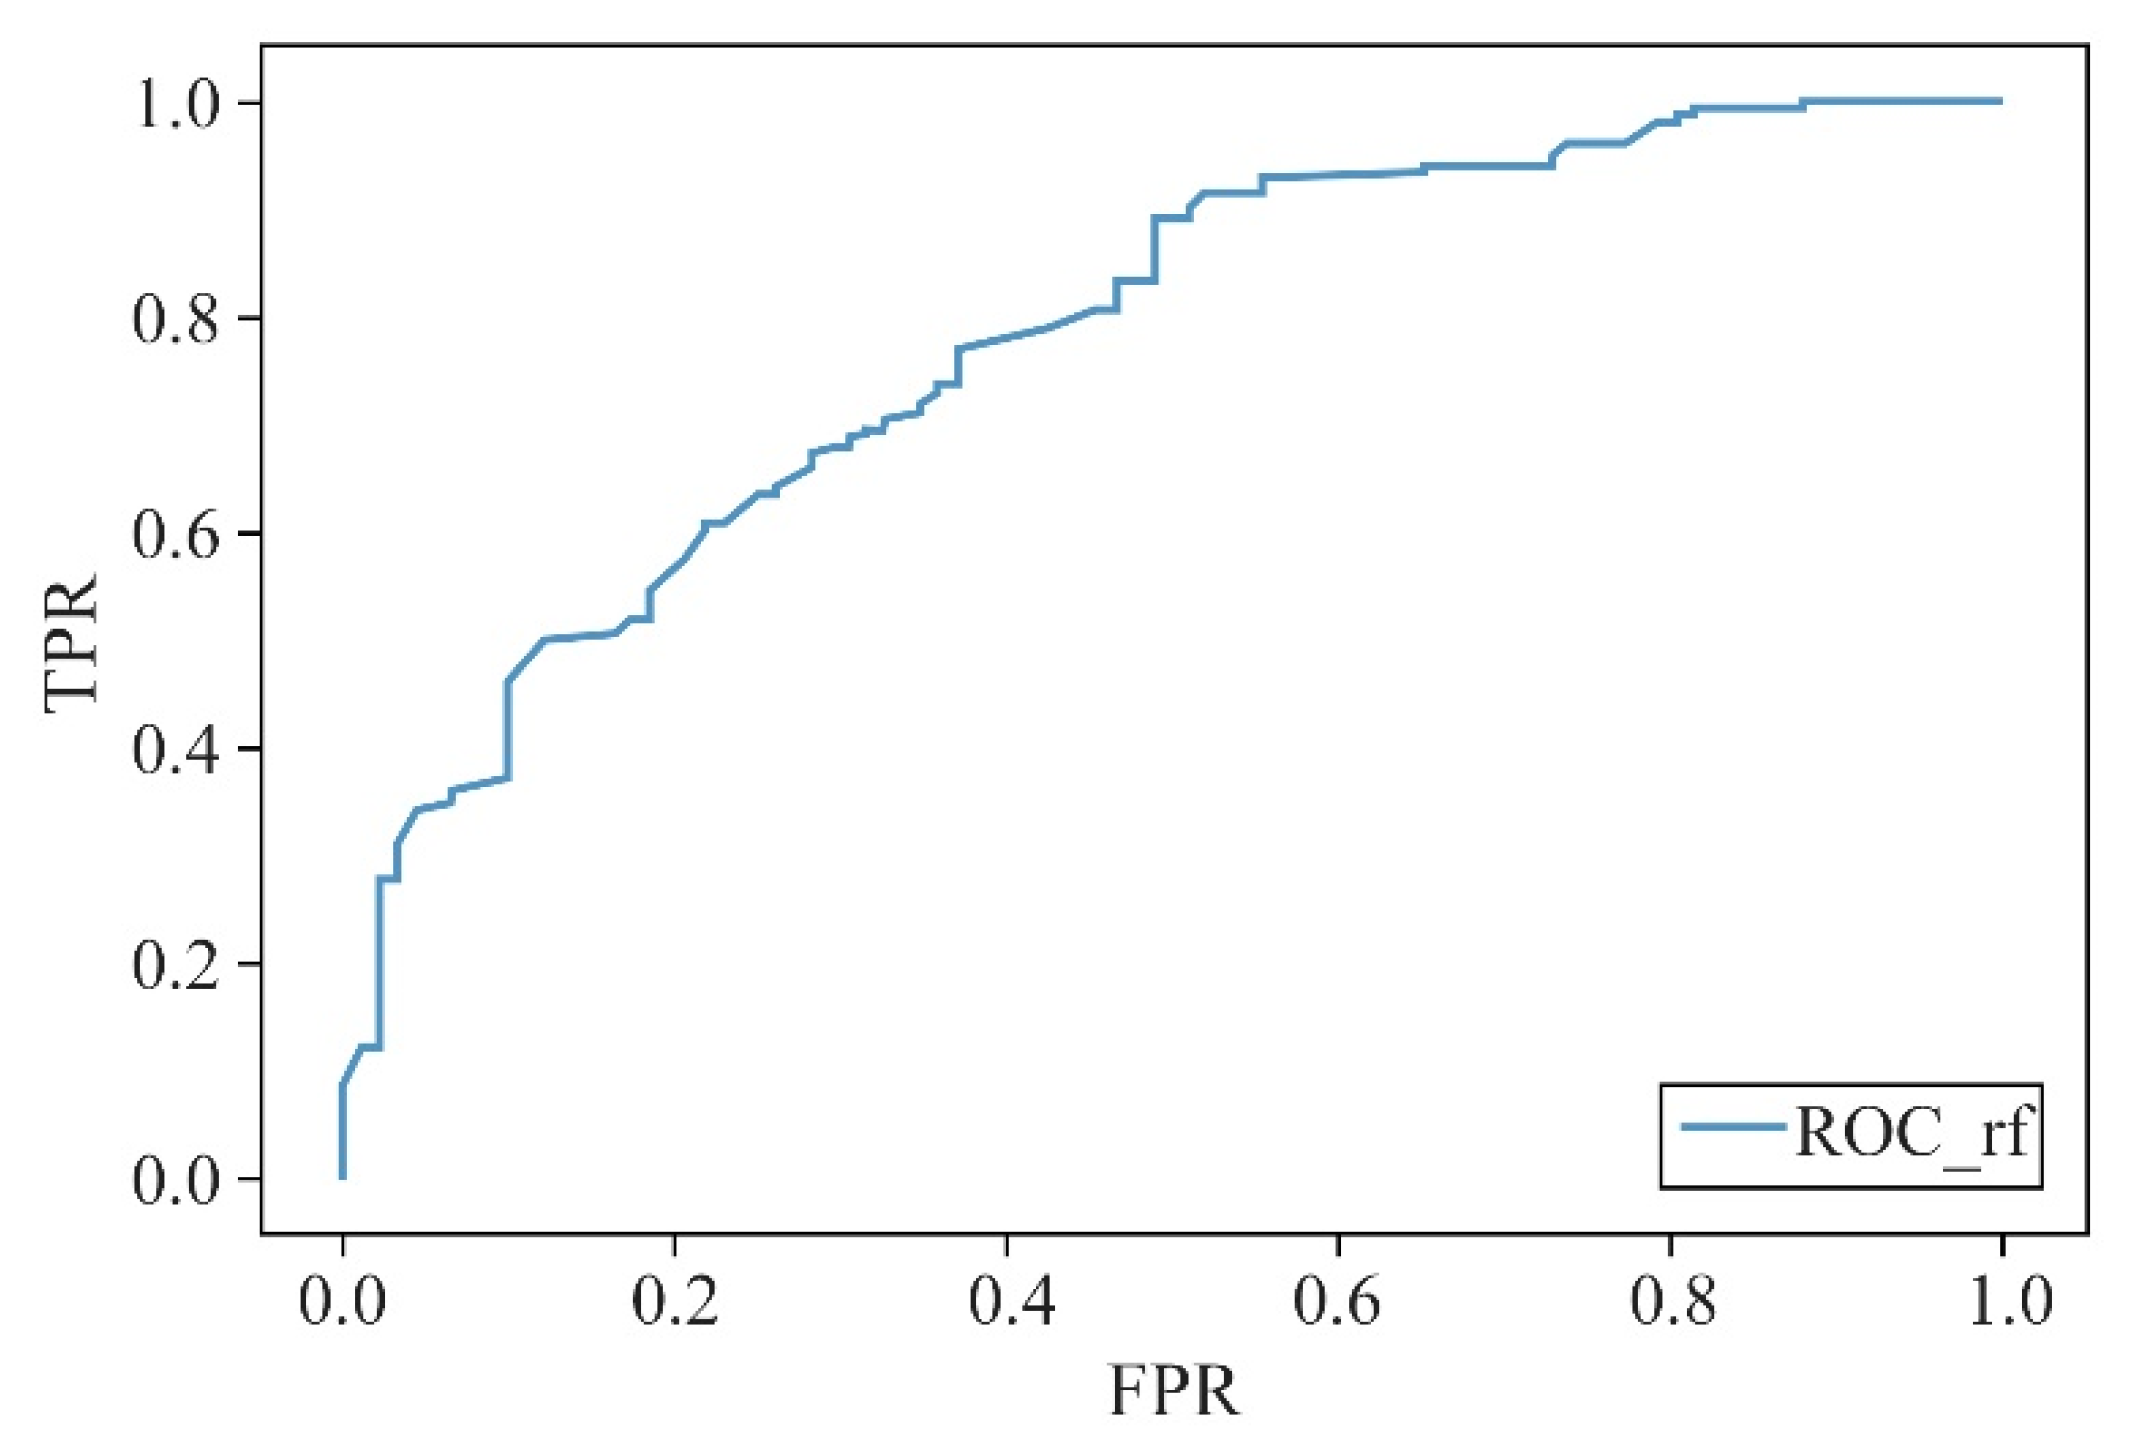
3.2. Importance of Ranking Indicators and Selection of Forecasting Models

Given that there were 300 safety points with evacuation resources (classified as 0) and 522 dangerous points (classified as 1) in the VGI, the ratio of these two kinds of points was not strictly 1:1. Therefore, the lower limit of the prediction accuracy for this imbalance dataset was calculated as 0.64077; thus, the accuracy of the subsequent model prediction for this dataset was not <64.08%.
Of the 822 points extracted from the VGI and their corresponding 25 indicator data, 70% were used as the training set and 30% were used as the test set to develop a random forest model. The importance ranking of each indicator was then calculated (Figure 5). Results showed that the planar curvature, elevation, slope direction, slope, and profile curvature in the topography category; GDP and population distribution in the socio-economic and demographic categories; road density and proportion of impervious surface area in the land-use category; and the number of POIs in the grid for living services in the facilities category, had a greater influence on the determination of a point as “dangerous and in need of rescue” or “safe and with evacuation resources.” Logistic regression, random forest, and SVC models were then constructed for this dataset. Given that the SVC model was used, the data needed to be standardized before training was undertaken. The parameters for each model, including the accuracy, precision, recall, F1-score, and the area under curve (AUC) values, were calculated for each of the metrics entered into 1–25 metrics according to their importance ranking. The three models were then compared from the key parameters (Figure 6).
Figure 6 showed that, in terms of accuracy and precision, the random forest model was considerably superior to the logistic regression and SVC models. Although the latter have considerably higher recall than random forest, the recall indicates the probability of a positive sample being predicted in a sample that is actually positive. Therefore, it can only represent the probability when a dangerous point in the original data is judged to be dangerous. A high recall rate indicated that there may be cases in which safe points are also judged as dangerous in real situations. This is a possible misjudgment that is not conducive to distinguishing safety from danger, and a high recall rate may be accompanied by a low accuracy rate. The F1-score indicated that precision and recall were both considered, and the higher the F1-score, the better the model performance. The AUC value can also be used to evaluate the model performance, and the higher the AUC, the better the model. Therefore, among the three commonly used models, the random forest model was the most suitable for this study.
After justifying the selection of the random forest model, models with a different number of indicators were compared. Results showed that the model parameters improved after entering the top 17 indicators in terms of importance while having better accuracy (0.7823), precision (0.7945), recall (0.9018), F1-score (0.8448), and AUC (0.8115) values (Figure 7); the receiver operating characteristic (ROC) curve is shown in Figure 8. Therefore, it was determined that the random forest algorithm, when selecting the top 17 ranked indicators in terms of importance, should be used to construct a prediction model for whether the grid within the five districts of the central region of Zhengzhou offered potential safety for evacuation resources.

3.3. Optimization of Disaster Prevention through Identifying More Potential Evacuation Resource Locations

Using the selected model, grid data for five districts in the central location of Zhengzhou, (Zhongyuan, Erqi, Guanchenghuizu, Jinshui, and Huiji) were analyzed, and 683 potential safety grids were screened. Figure 9 shows the spatial distribution of the predicted safe grids and dangerous points in VGI. Dangerous points rarely coincided with the predicted safe grids, and there was no pronounced spatial correlation. However, the predicted safe grids and safe points in VGI showed certain spatial clustering and correlation characteristics. Therefore, in addition to the scientific nature of the model parameters, it also reflected the credibility of the prediction model constructed from the perspective of visualization.
Compared with the 289 actual security points extracted from the VGI, there were increases in the number and scope (Table 5). The ratio of predicted safe grids to safe points showed that the number of safe grids in each zone was at least 1.45 times higher than the number of safe points in the VGI. There were differences in the ratios between districts. It was predicted that the safe grids in Huiji and Erqi districts increased the most, i.e., by three and four times the number of safe points in the VGI information, respectively. This suggested that there may be more potential shelters and resources in these areas. This result provided a reference for determining safety areas in the region resources could be sheltered during extreme storm disasters. This compensated for the problem of having insufficient real-time VGI of an area during the disaster and, consequently, being unable to judge the safety of that area. For existing dangerous points, the decision-makers need to figure out why people here got trapped, then strengthen their disaster response capacity. For predicted safety points, along with the verification of their actual situation, some new potential shelters can be found. The urban emergency system can be optimized based on the current emergency shelters.

4. Discussion

Through the case study of the severe rainstorm that occurred in Zhengzhou City, it is shown that VGI has a certain level of reliability as a data source. The VGI issued by residents during the disaster reflected realistic content, themes, and emotions of the people in distress involved in the rainstorm in Zhengzhou. The number of SOS messages was much higher in the central areas of Zhengzhou than in the suburbs, which is consistent with previous studies that found higher flood risk in the central and old urban areas of Zhengzhou [48]. In the meanwhile, based on the indicators selected from similar disaster risk studies, this study focused on five aspects (topography, socio-economics, population distribution, public facilities, and land use) to investigate the extent to which a geographic location with VGI was judged to be “safe and has evacuation resources.” In the case of Zhengzhou, the predicted 683 security grids were more than the 289 original security points obtained based on VGI for the five districts of the central region. Therefore, the actual security area was considered to be larger than that reflected by the VGI. In the context of future disaster prevention and mitigation work, the optimal layout of evacuation sites can be achieved according to these 683 grid points. The areas outside the safety points can also be a focus for hidden danger investigation and the optimization and enhancement of disaster prevention capabilities.
In addition to the case itself, there is actually more content worthy of discussion and attention in further rainstorm studies in the future. First, it is the number and quality of VGI. VGI data are free, open, and timely, and can provide first-hand information for disaster studies [78]. However, the accuracy and information distribution of such data may not be ideal due to factors such as personnel distribution and limitations associated with communication. Consequently, the performance of the trained model may not be as effective as the results based on professionally collected data. Furthermore, the sample size for disaster studies using LDA models is generally large [79,80]. In future studies, the obtained results could be better by collecting a larger number of samples for textual analysis.
Second, the difference between urban and rural areas should not be ignored, especially in developing countries. On the one hand, due to the difference in population distribution and economic development levels between the urban and rural areas, it was found that VGI data were more easily gathered from urban areas, which provided enhanced the possibility of getting a more accurate result for the urban areas than the rural areas. Since the urban areas have a higher population density and built area, their vulnerability is consequently higher. However, disaster damage in undeveloped rural areas should not be neglected. Therefore, the manner in which this research framework can be applied to undeveloped areas should be considered in future research. On the other hand, when selecting the important predictors, the POI category accounted for a larger proportion of the top-ranked indicators. This may have led to the model having a more accurate prediction capacity for urban areas with more complete POI information, especially the central city. Although POI can effectively reflect the built-up environment (especially land use) for areas with incomplete POI data (e.g., rural areas), it is possible that the model might not perform effectively in rural areas. In future studies, the model can be further optimized and improved in terms of indicator selection.
Third, the value of VGI generated during hazards should gain more attention from the authorities. Compared to the traditional big data applied to emergency management, the usage of VGI should also be viewed as a promising data source in the context of Web 2.0 and the wide use of smartphones. The decision-maker such as the government should take measures including cultivating and training specialized volunteers, building a real-time public disaster information-sharing platform, and formulating corresponding emergency plans, etc. Policies should also be developed to ensure that VGI data contribute to disaster prevention to the greatest extent possible.

5. Conclusions

The Web 2.0 era provides more opportunities and possibilities for the optimization of big data in disaster prevention and emergency management. In the context of priorities proposed in the SFDRR, this study preliminarily reviewed the current state of research on extreme rainstorm hazards, and the related technical background. Through the case study of a severe rainstorm hazard in Zhengzhou City, China, the possibility of applying VGI and machine learning in extreme rainstorm hazard research was explored. The policy recommendations on DRR and strategies for future rainstorm hazards research and disaster prevention were also discussed. The main conclusions are summarized as follows.
First, VGI should receive more attention during disaster research in the future. Mutual aid information during disasters collated by volunteers as VGI can serve as a reliable data source [81]. It provides a descriptive account of the disaster in real time, further validating the idea that VGI data can help reproduce the real-time dynamics of disasters [82]. VGI data analysis and application can help compensate for an inadequate understanding of the actual situation during these disasters. This study showed that SOS information, even from non-professionals, analyzed by information extraction, LDA modeling, and other textual analyses could provide valid information, including emotional tendencies, needs, and locations, and can be used as a reliable data source for further spatial analysis.
Second, vulnerable people and their demands should gain more attention from the authorities. The disaster-vulnerable populations in extreme urban rainstorm disasters were predominantly the elderly, children, and pregnant women. Most of the demands were associated with loss of water and electricity, lack of food and drinking water, being trapped in transportation, poor communication, and instability of buildings. Such claims should be treated as priorities in preparation for future disaster responses for the expeditious protection of vulnerable people and to strengthen infrastructure construction and necessary material stockpiles to reduce human casualties and property damage in the event of a natural disaster.
Third, it is necessary to combine VGI with other authoritative or open-source data in emergency management to reduce emergency response times and improve disaster resilience in cities. In terms of rainstorm hazards, the topography, population distribution, economic development level, and the built-up environment of a city exhibited different degrees of correlation with the impacts caused by extreme rainstorm hazards. Especially the section and plane curvature, elevation, slope and slope direction of typographic elements, the average land GDP, population of socio-economic elements, the POI distribution, road network density, and the percentage of impervious surfaces in the built-up environment all had relatively important effects on the classification of hazard and safety points in rainstorm disasters. In contrast, indicators regarding land-use types (e.g., water, trees, or grass) may be relatively unimportant indicators, which provides a reference for indicator selection in future urban rainstorm hazard studies.
Last, to make full and efficient use of VGI information generated by ordinary people during disasters, thereby reducing disaster risks and losses caused by disasters, there are still many areas worthy of optimization in terms of policies. As a researcher, it is necessary to further understand public participation in disasters, especially the public’s preferences and habits for risk communication and social media use during disasters, to make a more accurate analysis. Besides, decision-makers should pay attention to the timely information generated by the public during disasters, and build a more convenient platform for the release of such information. In addition, the processing, presentation, and dissemination of data should be strengthened, to effectively reduce disaster risks and improve the comprehensive ability of emergency management.

Author Contributions

Conceptualization, J.G. and O.M.; methodology, J.G. and X.P.; software, J.G. and Y.D.; validation, X.P. and O.M.; formal analysis, J.G. and Y.D.; investigation, Y.D.; resources, J.G. and Y.D.; data curation, J.G., Y.D., and X.P.; writing—original draft preparation, J.G.; writing—review and editing, J.G., O.M. and X.P.; visualization, Y.D.; supervision, O.M.; funding acquisition, J.G. and O.M. All authors have read and agreed to the published version of the manuscript.

Funding

This research was funded by the Tohoku University Advanced Graduate School Pioneering Research Support Project for PhD Students and the International Joint Graduate Program in Resilience and Safety Studies (GP-RSS).

Institutional Review Board Statement

Not applicable.

Informed Consent Statement

Not applicable.

Data Availability Statement

All data used in this study are openly available. Some data are available in a publicly accessible repository that issues DOIs, whereas some are available in a publicly accessible repository that does not issue DOIs. The method to access the data in this study can be found in the article at the place where the data are first mentioned.

Acknowledgments

The authors would like to thank the editor and anonymous reviewers who have read the paper and provided helpful comments for improvements.

Conflicts of Interest

The authors declare no conflict of interest.

References

  1. Fang, J.; Hu, J.M.; Shi, X.W.; Zhao, L. Assessing disaster impacts and response using social media data in China: A case study of 2016 Wuhan rainstorm. Int. J. Disaster Risk Reduct. 2019, 34, 275–282. [Google Scholar] [CrossRef]
  2. Wang, B.; Loo, B.P.Y.; Zhen, F.; Xi, G.L. Urban resilience from the lens of social media data: Responses to urban flooding in Nanjing, China. Cities 2020, 106, 102884. [Google Scholar] [CrossRef]
  3. Guo, J.; Wu, X.H.; Wei, G. A new economic loss assessment system for urban severe rainfall and flooding disasters based on big data fusion. Environ. Res. 2020, 188, 109822. [Google Scholar] [CrossRef]
  4. Guan, M.; Sillanpää, N.; Koivusalo, H. Storm runoff response to rainfall pattern, magnitude and urbanization in a developing urban catchment. Hydrol. Process. 2016, 30, 543–557. [Google Scholar] [CrossRef]
  5. Yin, J.; Yu, D.P.; Yin, Z.; Liu, M.; He, Q. Evaluating the impact and risk of pluvial flash flood on intra-urban road network: A case study in the city center of Shanghai, China. J. Hydrol. 2016, 537, 138–145. [Google Scholar] [CrossRef] [Green Version]
  6. Zhang, X.Q.; Hu, M.C.; Chen, G.; Xu, Y.P. Urban rainwater utilization and its role in mitigating urban waterlogging problems—A case study in Nanjing, China. Water Resour. Manag. 2012, 26, 3757–3766. [Google Scholar] [CrossRef]
  7. Xiao, Y.; Li, B.Q.; Gong, Z.W. Real-time identification of urban rainstorm waterlogging disasters based on Weibo big data. Nat. Hazards 2018, 94, 833–842. [Google Scholar] [CrossRef]
  8. UNDRR. The Sendai Framework for Disaster Risk Reduction 2015–2030. Available online: https://www.undrr.org/publication/sendai-framework-disaster-risk-reduction-2015-2030 (accessed on 17 October 2022).
  9. Song, X.; Skupin, A.; Pottathil, A.; Culotta, A.; Zhang, H.; Akerkar, R.A.; Huang, H.; Guo, S.; Zhong, L.; Ji, Y.; et al. Big Data and Emergency Management: Concepts, Methodologies, and Applications. IEEE Trans. Big Data 2020, 8, 397–419. [Google Scholar] [CrossRef]
  10. Dusse, F.; Júnior, P.S.; Alves, A.T.; Novais, R.; Vieira, V.; Mendonça, M. Information Visualization for Emergency Management: A Systematic Mapping Study. Expert Syst. Appl. 2016, 45, 424–437. [Google Scholar] [CrossRef]
  11. Elwood, S.; Goodchild, M.F.; Sui, D.Z. Researching volunteered geographic information: Spatial data, geographic research, and new social practice. Ann. Assoc. Am. Geogr. 2012, 102, 571–590. [Google Scholar] [CrossRef]
  12. Goodchild, M.F.; Glennon, J.A. Crowdsourcing geographic information for disaster response: A research frontier. Int. J. Digit. Earth 2010, 3, 231–241. [Google Scholar] [CrossRef]
  13. Jonietz, D.; Antonio, V.; See, L.; Zipf, A. Highlighting current trends in volunteered geographic information. ISPRS Int. J. Geo-Inf. 2017, 6, 202. [Google Scholar] [CrossRef] [Green Version]
  14. Senaratne, H.; Mobasheri, A.; Ali, A.L.; Capineri, C.; Haklay, M. A review of volunteered geographic information quality assessment methods. Int. J. Geogr. Inf. Sci. 2017, 31, 139–167. [Google Scholar] [CrossRef] [Green Version]
  15. Olszewski, R.; Wendland, A. Digital Agora–Knowledge acquisition from spatial databases, geoinformation society VGI and social media data. Land Use Policy 2021, 109, 105614. [Google Scholar] [CrossRef]
  16. Parker, C.J.; May, A.; Mitchell, V. The role of VGI and PGI in supporting outdoor activities. Appl. Ergon. 2013, 44, 886–894. [Google Scholar] [CrossRef] [Green Version]
  17. Klonner, C.; Usón, T.J.; Aeschbach, N.; Höfle, B. Participatory mapping and visualization of local knowledge: An example from Eberbach, Germany. Int. J. Disaster Risk Sci. 2021, 12, 56–71. [Google Scholar] [CrossRef]
  18. Sterlacchini, S.; Bordogna, G.; Cappellini, G.; Voltolina, D. SIRENE: A spatial data infrastructure to enhance communities’ resilience to disaster-related emergency. Int. J. Disaster Risk Sci. 2018, 9, 129–142. [Google Scholar] [CrossRef] [Green Version]
  19. Horita, F.E.A.; Degrossi, L.C.; De Assis, L.F.G.; Zipf, A.; de Albuquerque, J.P. The use of volunteered geographic information (VGI) and crowdsourcing in disaster management: A systematic literature review. In Proceedings of the Nineteenth Americas Conference on Information Systems, Chicago, IL, USA, 15–17 August 2013; Volume 2013. [Google Scholar]
  20. Spinsanti, L.; Ostermann, F. Automated geographic context analysis for volunteered information. Appl. Geogr. 2013, 43, 36–44. [Google Scholar] [CrossRef]
  21. Foody, G.M.; See, L.; Fritz, S.; van der Velde, M.; Perger, C.; Schill, C.; Boyd, D.S.; Comber, A. Accurate attribute mapping from volunteered geographic information: Issues of volunteer quantity and quality. Cartogr. J. 2015, 52, 336–344. [Google Scholar] [CrossRef]
  22. Kankanamge, N.; Yigitcanlar, T.; Goonetilleke, A.; Kamruzzaman, M. Can volunteer crowdsourcing reduce disaster risk? A systematic review of the literature. Int. J. Disaster Risk Reduct. 2019, 35, 101097. [Google Scholar] [CrossRef]
  23. Haworth, B.; Bruce, E. A review of volunteered geographic information for disaster management. Geogr. Compass 2015, 9, 237–250. [Google Scholar] [CrossRef]
  24. Middleton, S.E.; Middleton, L.; Modafferi, S. Real-time crisis mapping of natural disasters using social media. IEEE Intell. Syst. 2014, 29, 9–17. [Google Scholar] [CrossRef] [Green Version]
  25. Kusumo, A.N.L.; Reckien, D.; Verplanke, J. Utilising volunteered geographic information to assess resident’s flood evacuation shelters. Case study: Jakarta. Appl. Geogr. 2017, 88, 174–185. [Google Scholar] [CrossRef]
  26. Moghadas, M.; Rajabifard, A.; Fekete, A.; Kötter, T. A framework for scaling urban transformative resilience through utilizing volunteered geographic information. ISPRS Int. J. Geo-Inf. 2022, 11, 114. [Google Scholar] [CrossRef]
  27. Haworth, B.T.; Bruce, E.; Whittaker, J.; Read, R. The good, the bad, and the uncertain: Contributions of volunteered geographic information to community disaster resilience. Front. Earth Sci. 2018, 6, 183. [Google Scholar] [CrossRef] [Green Version]
  28. Tzavella, K.; Fekete, A.; Fiedrich, F. Opportunities provided by geographic information systems and volunteered geographic information for a timely emergency response during flood events in Cologne, Germany. Nat. Hazards 2018, 91, 29–57. [Google Scholar] [CrossRef]
  29. Granell, C.; Ostermann, F.O. Beyond data collection: Objectives and methods of research using VGI and geo-social media for disaster management. Comput. Environ. Urban Syst. 2016, 59, 231–243. [Google Scholar] [CrossRef]
  30. Hung, K.C.; Kalantari, M.; Rajabifard, A. Methods for assessing the credibility of volunteered geographic information in flood response: A case study in Brisbane, Australia. Appl. Geogr. 2016, 68, 37–47. [Google Scholar] [CrossRef]
  31. Yuan, J.Y.; Roy Chowdhury, P.K.R.; Mckee, J.; Yang, H.L.; Weaver, J.; Bhaduri, B. Exploiting deep learning and volunteered geographic information for mapping buildings in Kano, Nigeria. Sci. Data 2018, 5, 180217. [Google Scholar] [CrossRef] [Green Version]
  32. Arapostathis, S.G. A methodology for automatic acquisition of flood-event management information from social media: The flood in Messinia, South Greece, 2016. Inf. Syst. Front. 2021, 23, 1127–1144. [Google Scholar] [CrossRef]
  33. Feng, Y.; Sester, M. Extraction of pluvial flood relevant volunteered geographic information (VGI) by deep learning from user generated texts and photos. ISPRS Int. J. Geo-Inf. 2018, 7, 39. [Google Scholar] [CrossRef] [Green Version]
  34. Mccallum, I.; Liu, W.; See, L.; Mechler, R.; Keating, A.; Hochrainer-Stigler, S.; Mochizuki, J.; Fritz, S.; Dugar, S.; Arestegui, M.; et al. Technologies to support community flood disaster risk reduction. Int. J. Disaster Risk Sci. 2016, 7, 198–204. [Google Scholar] [CrossRef] [Green Version]
  35. Yu, J.; Zhao, Q.S.; Chin, C.S. Extracting typhoon disaster information from VGI based on machine learning. J. Mar. Sci. Eng. 2019, 7, 318. [Google Scholar] [CrossRef] [Green Version]
  36. Klonner, C.; Marx, S.; Usón, T.; Porto de Albuquerque, J.P.; Höfle, B. Volunteered geographic information in natural hazard analysis: A systematic literature review of current approaches with a focus on preparedness and mitigation. ISPRS Int. J. Geo-Inf. 2016, 5, 103. [Google Scholar] [CrossRef] [Green Version]
  37. Quan, R.S. Rainstorm waterlogging risk assessment in central urban area of Shanghai based on multiple scenario simulation. Nat. Hazards 2014, 73, 1569–1585. [Google Scholar] [CrossRef]
  38. Yin, Z.E.; Yin, J.; Xu, S.Y.; Wen, J.H. Community-based scenario modelling and disaster risk assessment of urban rainstorm waterlogging. J. Geogr. Sci. 2011, 21, 274–284. [Google Scholar] [CrossRef]
  39. Su, B.N.; Huang, H.; Li, Y.T. Integrated simulation method for waterlogging and traffic congestion under urban rainstorms. Nat. Hazards 2016, 81, 23–40. [Google Scholar] [CrossRef]
  40. Lin, T.; Liu, X.; Song, J.; Zhang, G.; Jia, Y.; Tu, Z.; Zheng, Z.; Liu, C. Urban waterlogging risk assessment based on internet open data: A case study in China. Habitat Int. 2018, 71, 88–96. [Google Scholar] [CrossRef]
  41. Liu, Y.Y.; Li, L.; Zhang, W.H.; Chan, P.W.; Liu, Y.S. Rapid identification of rainstorm disaster risks based on an artificial intelligence technology using the 2DPCA method. Atmos. Res. 2019, 227, 157–164. [Google Scholar] [CrossRef]
  42. Liu, Y.Y.; Li, L.; Liu, Y.S.; Chan, P.W.; Zhang, W.H. Dynamic spatial-temporal precipitation distribution models for short-duration rainstorms in Shenzhen, China based on machine learning. Atmos. Res. 2020, 237, 104861. [Google Scholar] [CrossRef]
  43. Su, X.; Shao, W.W.; Liu, J.H.; Jiang, Y.Z.; Wang, K.B. Dynamic assessment of the impact of flood disaster on economy and population under extreme rainstorm events. Remote Sens. 2021, 13, 3924. [Google Scholar] [CrossRef]
  44. Hou, J.M.; Zhou, N.; Chen, G.Z.; Huang, M.; Bai, G.B. Rapid forecasting of urban flood inundation using multiple machine learning models. Nat. Hazards 2021, 108, 2335–2356. [Google Scholar] [CrossRef]
  45. Henan Government. Provincial Situation: Henan Overview (EB/OL). 2021. Available online: https://www.henan.gov.cn/2018/05-31/2408.html (accessed on 18 March 2022).
  46. The State Council of the People’s Republic of China, Circular of the State Council on Adjusting the Criteria for the Classification of City Sizes (EB/OL). 2014. Available online: http://www.gov.cn/zhengce/content/2014-11/20/content_9225.htm (accessed on 18 March 2022).
  47. Zhu, Y.; Zhang, C.; Fang, J.; Miao, Y. Paths and strategies for a resilient megacity based on the water-energy-food nexus. Sustain. Cities Soc. 2022, 82, 103892. [Google Scholar] [CrossRef]
  48. Wang, H.; Hu, Y.; Guo, Y.; Wu, Z.; Yan, D. Urban flood forecasting based on the coupling of numerical weather model and stormwater model: A case study of Zhengzhou city. J. Hydrol. Reg. Stud. 2022, 39, 100985. [Google Scholar] [CrossRef]
  49. Zhang, J.; Zhang, H.; Fang, H. Study on urban rainstorms design based on multivariate secondary return period. Water Resour. Manag. 2022, 36, 2293–2307. [Google Scholar] [CrossRef]
  50. Zhang, Y.; Chen, Z.; Zheng, X.; Chen, N.; Wang, Y. Extracting the location of flooding events in urban systems and analyzing the semantic risk using social sensing data. J. Hydrol. 2021, 603, 127053. [Google Scholar] [CrossRef]
  51. Ministry of Emergency Management of the People’s Republic of China, Investigation Report on “7.20” Heavy Rainstorm Disaster in Zhengzhou, Henan. Available online: https://www.mem.gov.cn/gk/sgcc/tbzdsgdcbg/202201/P020220121639049697767.pdf (accessed on 1 March 2022).
  52. Wu, W.J.; Li, J.L.; He, Z.Y.; Ye, X.X.; Zhang, J.; Cao, X.; Qu, H.J. Tracking spatio-temporal variation of geo-tagged topics with social media in China: A case study of 2016 Hefei rainstorm. Int. J. Disaster Risk Reduct. 2020, 50, 101737. [Google Scholar] [CrossRef]
  53. Wu, M.; Wu, Z.; Ge, W.; Wang, H.; Shen, Y.; Jiang, M. Identification of sensitivity indicators of urban rainstorm flood disasters: A case study in China. J. Hydrol. 2021, 599, 126393. [Google Scholar] [CrossRef]
  54. Yang, S.N.; Yin, G.F.; Shi, X.W.; Liu, H.; Zou, Y. Modeling the adverse impact of rainstorms on a regional transport network. Int. J. Disaster Risk Sci. 2016, 7, 77–87. [Google Scholar] [CrossRef] [Green Version]
  55. Zhou, L.; Wu, X.H.; Ji, Z.H.; Gao, G. Characteristic analysis of rainstorm-induced catastrophe and the countermeasures of flood hazard mitigation about Shenzhen city. Geomat. Nat. Hazards Risk 2017, 8, 1886–1897. [Google Scholar] [CrossRef]
  56. Liao, X.L.; Xu, W.; Zhang, J.L.; Li, Y.; Tian, Y.G. Global exposure to rainstorms and the contribution rates of climate change and population change. Sci. Total Environ. 2019, 663, 644–653. [Google Scholar] [CrossRef] [PubMed]
  57. Yoo, G.; Hwang, J.H.; Choi, C. Development and application of a methodology for vulnerability assessment of climate change in coastal cities. Ocean Coast. Manag. 2011, 54, 524–534. [Google Scholar] [CrossRef]
  58. Ma, S.; Lyu, S.; Zhang, Y. Weighted clustering-based risk assessment on urban rainstorm and flood disaster. Urban Clim. 2021, 39, 39100974. [Google Scholar] [CrossRef]
  59. Hu, H. Rainstorm flash flood risk assessment using genetic programming: A case study of risk zoning in Beijing. Nat. Hazards 2016, 83, 485–500. [Google Scholar] [CrossRef]
  60. Chen, J.F.; Liu, L.M.; Pei, J.P.; Deng, M.H. An ensemble risk assessment model for urban rainstorm disasters based on random forest and deep belief nets: A case study of Nanjing, China. Nat. Hazards 2021, 107, 2671–2692. [Google Scholar] [CrossRef]
  61. Li, Z.; Zhang, Y.; Wang, J.; Ge, W.; Li, W.; Song, H.; Guo, X.; Wang, T.; Jiao, Y. Impact evaluation of geomorphic changes caused by extreme floods on inundation area considering geomorphic variations and land use types. Sci. Total Environ. 2021, 754, 142424. [Google Scholar] [CrossRef] [PubMed]
  62. Quan, R.S.; Liu, M.; Lu, M.; Zhang, L.J.; Wang, J.J.; Xu, S.Y. Waterlogging risk assessment based on land use/cover change: A case study in Pudong New Area, Shanghai. Environ. Earth Sci. 2010, 61, 1113–1121. [Google Scholar] [CrossRef]
  63. Wu, X.D.; Yu, D.P.; Chen, Z.Y.; Wilby, R.L. An evaluation of the impacts of land surface modification, storm sewer development, and rainfall variation on waterlogging risk in Shanghai. Nat. Hazards 2012, 63, 305–323. [Google Scholar] [CrossRef]
  64. Zhang, H.; Wang, X.R. Land-use dynamics and flood risk in the hinterland of the Pearl River Delta: The case of Foshan City. Int. J. Sustain. Dev. World Ecol. 2007, 14, 485–492. [Google Scholar] [CrossRef]
  65. Al-Hourani, A.; Kandeepan, S.; Jamalipour, A. Modeling air-to-ground path loss for low altitude platforms in urban environments. In Proceedings of the 2014 IEEE Global Communications Conference, Austin, TX, USA, 8–12 December 2014; pp. 2898–2904. [Google Scholar] [CrossRef]
  66. Xu, X.L. China GDP Spatial Distribution km Grid Dataset, Resource and Environmental Science Data Registration and Publication System. 2017. Available online: http://www.resdc.cn/DOI (accessed on 18 March 2022).
  67. Bondarenko, M.; Kerr, D.; Sorichetta, A.; Tatem, A.J. Census/projection-disaggregated gridded population datasets, adjusted to match the corresponding UNPD 2020 estimates, for 183 countries in 2020 using Built-Settlement Growth Model (BSGM) outputs. In WorldPop; University of Southampton: Southampton, UK, 2020. [Google Scholar] [CrossRef]
  68. Zhang, X.; Liu, L.; Zhao, T.; Gao, Y.; Chen, X.; Mi, J. GISD30: Global 30 m impervious-surface dynamic dataset from 1985 to 2020 using time-series Landsat imagery on the Google Earth Engine platform. Earth Syst. Sci. Data 2022, 14, 1831–1856. [Google Scholar] [CrossRef]
  69. Tian, H.; Gao, C.; Xiao, X.; Liu, H.; He, B.; Wu, H.; Wang, H.; Wu, F. SKEP: Sentiment knowledge enhanced pretraining for sentiment analysis. In Proceedings of the 58th Annual Meeting of the Association for Computational Linguistics, Online, 5–10 July 2020; Association for Computational Linguistics: Stroudsburg, PA, USA, 2020; pp. 4067–4076. [Google Scholar]
  70. Blei, D.M. Probabilistic topic models. Commun. ACM 2012, 55, 77–84. [Google Scholar] [CrossRef] [Green Version]
  71. Blei, D.M.; Ng, A.Y.; Jordan, M.I. Latent Dirichlet allocation. J. Mach. Learn. Res. 2003, 3, 993–1022. [Google Scholar]
  72. Breiman, L. Random forests. Mach. Learn. 2001, 45, 5–32. [Google Scholar] [CrossRef] [Green Version]
  73. Janitza, S.; Strobl, C.; Boulesteix, A.-L. An AUC-Based Permutation Variable Importance Measure for Random Forests. BMC Bioinform. 2013, 14, 119. [Google Scholar] [CrossRef] [Green Version]
  74. Harrell, F.E. Binary logistic regression. In Regression Modeling Strategies. Springer Series in Statistics; Springer: Berlin/Heidelberg, Germany, 2015; pp. 219–274. [Google Scholar] [CrossRef]
  75. Hsu, C.; Chang, C.; Lin, C. A Practical Guide to Support Vector Classification; Department of Computer Science and Information Engineering, National Taiwan University: Taipei, Taiwan, 2003. [Google Scholar]
  76. Mendez, K.M.; Reinke, S.N.; Broadhurst, D.I. A Comparative Evaluation of the Generalised Predictive Ability of Eight Machine Learning Algorithms across Ten Clinical Metabolomics Data Sets for Binary Classification. Metabolomics 2019, 15, 150. [Google Scholar] [CrossRef] [Green Version]
  77. Liang, P.; Xu, W.; Ma, Y.; Zhao, X.; Qin, L. Increase of elderly population in the rainstorm hazard areas of China. Int. J. Environ. Res. Public Health 2017, 14, 963. [Google Scholar] [CrossRef] [Green Version]
  78. Goodchild, M.F.; Li, L.N. Assuring the quality of volunteered geographic information. Spat. Stat. 2012, 1, 110–120. [Google Scholar] [CrossRef]
  79. Han, X.H.; Wang, J.L. Using social media to mine and analyze public sentiment during a disaster: A case study of the 2018 Shouguang city flood in China. ISPRS Int. J. Geo-Inf. 2019, 8, 185. [Google Scholar] [CrossRef]
  80. Yuan, F.X.; Li, M.; Liu, R. Understanding the evolutions of public responses using social media: Hurricane Matthew case study. Int. J. Disaster Risk Reduct. 2020, 51, 101798. [Google Scholar] [CrossRef]
  81. de Albuquerque, J.P.; Herfort, B.; Brenning, A.; Zipf, A. A geographic approach for combining social media and authoritative data towards identifying useful information for disaster management. Int. J. Geogr. Inf. Syst. 2015, 29, 667–689. [Google Scholar] [CrossRef]
  82. Rollason, E.; Bracken, L.J.; Hardy, R.J.; Large, A.R.G. The importance of volunteered geographic information for the validation of flood inundation models. J. Hydrol. 2018, 562, 267–280. [Google Scholar] [CrossRef]
Figure 1. Study site.
Ijerph 19 16051 g001
Figure 2. Precipitation from 0:00–23:00 on 20 July 2021, in each administrative region of Zhengzhou City.
Ijerph 19 16051 g002
Figure 3. Workflow of the research.
Ijerph 19 16051 g003
Figure 4. Coherence values of models with a different number of topics (the orange dot indicates the selected number of topics).
Ijerph 19 16051 g004
Figure 5. Importance ranking of each indicator based on the random forest algorithm (see Table 2 for the description of X1–X25).
Ijerph 19 16051 g005
Figure 6. Comparison of the parameters of random forest, Support Vector Classification (SVC), and logistic regression models.
Ijerph 19 16051 g006
Figure 7. Parameters of the random forest models with different numbers of indicators.
Ijerph 19 16051 g007
Figure 8. ROC curve for the random forest model with 17 indicators (“TPR”: true positive rate; “FPR”: false positive rate).
Ijerph 19 16051 g008
Figure 9. Comparison of predicted safe grids and the dangerous/safe points from volunteered geographic information(VGI).
Ijerph 19 16051 g009
Table 1. Examples of SOS messages.
Example 1Example 2
Is there anyone at Zhengzhou East Station? Friends are trapped inside the station! The little girl has a fever and a severe headache. She does not know what to do now without medicine. There is not much battery left on her mobile phone. Contact number: XXX-XXXX-XXXX.Address: 2 km north of Sanglin Road, Zhengkai Avenue, Zhengzhou City, in Hengze Logistics Park.
Hundreds of people have been trapped for 24 h, the water level is still rising, people are already on the roof, and there is no way out! No water, no power, no food. Some people already feel unwell and ask for rescue, emergency! Urgent!
Table 2. Indicators and data sources of spatial factors.
CategoryIndicator DescriptionData Source
Distribution of facilities(X1) POI of domestic servicesNumber of living service facilities in the gridGaode Open Platform (https://lbs.amap.com/ (accessed on 18 March 2022))
(X2) POI of dining and shoppingNumber of dining and shopping facilities in the grid
(X3) POI of transportation facilitiesNumber of transportation facilities in the grid
(X4) POI of sports and leisure facilitiesNumber of sports and leisure facilities in the grid
(X5) POI of government organizationsNumber of government agencies in the grid
(X6) POI of science and education facilitiesNumber of science, education, and cultural facilities in the grid
(X7) POI of industry and enterprisesNumber of industrial and business facilities in the grid
(X8) POI of financial institutionsNumber of financial facilities in the grid
(X9) POI of medical institutionsNumber of medical facilities in the grid
Typography(X10) Section curvatureSection curvature at grid center pointCalculated using ArcGIS 10.8 on 30 m DEM data from Geospatial Data Cloud.
(X11) ElevationElevation at the grid center point
(X12) Plane curvaturePlane curvature at grid center point
(X13) Slope directionSlope direction at grid center point
(X14) SlopeSlope at grid center point
Society and economy(X15) GDPGDP of the grid (in 2015)
1 km resolution data with spatial interpolation
Kilometer grid dataset of China’s GDP spatial distribution. The data were obtained from the Resource and Environmental Science Data Registration and Publishing System [66]
(X16) PopulationThe population of the grid
Population counts/constrained individual countries 2020 UN adjusted (100 m resolution)
Population data were corrected according to Official data from China’s seventh population census
WorldPop [67]
Land use(X17) Proportion of impervious surface areaPercentage of impervious surface in the gridGISD30: global 30 m impervious surface dynamic dataset from 1985–2020 [68]
(X18) Road densityThe density of roads in the gridBaidu Map Open Platform
(X19) WaterArea of water in the gridESRI: Sentinel-2 10-Meter Land Use/Land Cover
(X20) Built areaArea of built area in the grid
(X21) Bare groundArea of bare ground in the grid
(X22) TreesArea of trees in the grid
(X23) CropsArea of crops in the grid
(X24) GrassArea of grass in the grid
(X25) ShrubArea of shrubs in the grid
POI—point of interest; DEM—digital elevation model.
Table 3. Keywords counted more than 20 times in SOS messages.
No.WordCountFlagNo.WordCountFlag
1trapped172adjective15water lever32noun
2rescue103verb noun16rescue team31noun
3hour65noun17Zhengzhou29place
4the aged63noun182029numeral
5child62noun19hope29verb
6food47noun20personnel27noun
7cell phone45noun21signal26noun
8telephone45noun22water cut off24verb
9not accessible39adverb23condition23noun
10community37noun24friend23noun
11power failure36verb25on the car22place
12help34verb26no power22verb
13urgent need33noun27materials21noun
14lost contact32verb noun28stagnant water21noun
Table 4. Topic model with 12 selected topics.
Topic No.Keywords and Their WeightsTopic Summary
10.033 × “the old” + 0.032 × “urgent need” + 0.021 × “hour” + 0.019 × “generator” + 0.012 × “one” + 0.011 × “friend” + 0.009 × “mobile” + 0.009 × “company” + 0.009 × “worry” + 0.008 × “information”Vulnerable people, needs
20.213 × “call for help” + 0.206 × “scenic area” + 0.128 × “trapped” + 0.109 × “!!” + 0.003 × “reservoir” + 0.003 × “area” + 0.003 × “place” + 0.003 × “support” + 0.003 × “section”Trapped location
30.034 × “!” + 0.017 × “child” + 0.015 × “Zhengzhou” + 0.015 × “power outage” + 0.012 × “flooded” + 0.011 × “water outage” + 0.011 × “first floor” + 0.011 × “month” + 0.011 × “day” + 0.010 × “food”People, time, location, needs
40.021 × “inside” + 0.017 × “transfer” + 0.016 × “condition” + 0.016 × “water cut off” + 0.013 × “hope” + 0.012 × “dad” + 0.011 × “one person” + 0.008 × “battery” + 0.008 × “tumor hospital” + 0.007 × “medical staff”Medical resources
50.017 × “year old” + 0.017 דthe old” + 0.013 × “water level” + 0.012 × “less than” + 0.012 × “home” + 0.011 × “water depth” + 0.011 × “landslide” + 0.011 × “occurrence” + 0.010 × “one meter” + 0.009 × “baby”Vulnerable people, secondary disaster
60.012 × “message” + 0.011 × “phone” + 0.010 × “terrain” + 0.010 × “front” + 0.010 × “five o’clock” + 0.010 × “Zhengzhou” + 0.010 × “multiple people” + 0.010 × “please“ + 0.010 × “point” + 0.009 × “height”Information, topography, population characteristics
70.018 × “hotel” + 0.018 × “power outage” + 0.014 × “water outage” + 0.014 × “thank you” + 0.014 × “signal” + 0.013 × “transfer” + 0.012 × “water” + 0.012 × “children” + 0.010 × “the old”Location, energy, transfer
80.058 × “rescue” + 0.034 × “trapped” + 0.023 × “community” + 0.020 × “no” + 0.017 × “person” + 0.017 × “water” + 0.015 × “old people” + 0.014 × “20” + 0.012 × “request” + 0.012 × “night”Location, needs, time
90.015 × “urgent” + 0.015 × “road” + 0.014 × “no access” + 0.014 × “yesterday” + 0.013 × “home” + 0.011 × “family” +0.011 × “rescue team” + 0.011 × “phone” + 0.011 × “cannot get out” + 0.010 × “place”Rescue
100.145 × “trapped” + 0.116 × “help” + 0.115 × “submerged” + 0.112 × “parking lot” + 0.011 × “hospital” + 0.010 × “tears” + 0.010 × “pregnant women” + 0.009 × “hours” + 0.008 × “floor” + 0.008 × “waiting”Location, affected people
110.061 × “!” + 0.033 × “water” + 0.022 × “car” + 0.020× “food” + 0.015 × “method” + 0.014 × “community” + 0.012 × “thank you” + 0.009 × “help” + 0.008 × “fever” + 0.008 × “true”Mood, materials, health condition
120.021 × “no access” + 0.020 × “no” + 0.020 × “mobile” + 0.016 × “no contact” + 0.015 × “no power” + 0.014 × “help” + 0.013 × “eat” + 0.010 × “hours” + 0.010 × “shutdown” + 0.009 × “bad”Contacts
Table 5. Comparison of predicted results and actual data.
DistrictDangerous Points from VGISafe Points from VGIPredicted Safe GridsRatio of Predicted Safe Grids to Safe Points
Erqi76391173.00
Guanchenghuizu84611392.28
Jinshui1561402031.45
Zhongyuan110401433.58
Huiji279364.00
Total4532896382.21
Publisher’s Note: MDPI stays neutral with regard to jurisdictional claims in published maps and institutional affiliations.

