
Assessment of Standing Multi-Frequency Bioimpedance Analyzer to Measure Body Composition of the Whole Body and Limbs in Elite Male Wrestlers


 ,
,
Abstract
1. Introduction
2. Materials and Methods
2.1. Participants
2.2. Ethical Considerations
2.3. Procedure
2.4. Bioimpedance Analysis
2.5. Dual-Energy X-ray Absorptiometry
2.6. Statistical Analysis
3. Results
4. Discussion
5. Conclusions
Author Contributions
Funding
Institutional Review Board Statement
Informed Consent Statement
Data Availability Statement
Conflicts of Interest
References
- Horswill, C.A. Applied physiology of amateur wrestling. Sport. Med. 1992, 14, 114–143. [Google Scholar] [CrossRef] [PubMed]
- Lansky, R.C. Wrestling and Olympic-style lifts: In-season maintenance of power and anaerobic endurance. Strength Cond. J. 1999, 21, 21–27. [Google Scholar] [CrossRef]
- Vardar, S.A.; Tezel, S.; Öztürk, L.; Kaya, O. The relationship between body composition and anaerobic performance of elite young wrestlers. J. Sport. Sci. Med. 2007, 6, 34–38. [Google Scholar]
- Kelly, J.M.; Goreney, B.A.; Kalm, K.K. The effects of a collegiate wrestling season on body composition, cardiovascular fitness and muscular strength and endurance. Med. Sci. Sport. 1978, 10, 119–124. [Google Scholar]
- Roemmich, J.N.; Sinning, W.E. Sport-seasonal changes in body composition, growth, power and strength of adolescent wrestlers. Int. J. Sport. Med. 1996, 17, 92–99. [Google Scholar] [CrossRef]
- Roemmich, J.N.; Sinning, W.E. Weight loss and wrestling training: Effects on nutrition, growth, maturation, body composition, and strength. J. Appl. Physiol. 1997, 82, 1751–1759. [Google Scholar] [CrossRef]
- Lukaski, H.C.; Raymond-Pope, C.J. New frontiers of body composition in sport. Int. J. Sport. Med. 2021, 42, 588–601. [Google Scholar] [CrossRef]
- Roelofs, E.; Bockin, A.; Bosch, T.; Oliver, J.; Bach, C.W.; Carbuhn, A.; Stanforth, P.R.; Dengel, D.R. Body composition of National Collegiate Athletic Association (NCAA) Division I female soccer athletes through competitive seasons. Int. J. Sport. Med. 2020, 41, 766–770. [Google Scholar] [CrossRef]
- Czeck, M.A.; Raymond-Pope, C.J.; Stanforth, P.R.; Carbuhn, A.; Bosch, T.A.; Bach, C.W.; Oliver, J.M.; Dengel, D.R. Total and regional body composition of NCAA Division I collegiate female softball athletes. Int. J. Sport. Med. 2019, 40, 645–649. [Google Scholar] [CrossRef]
- Chiarlitti, N.A.; Delisle-Houde, P.; Reid, R.E.; Kennedy, C.; Andersen, R.E. Importance of body composition in the national hockey league combine physiological assessments. J. Strength Cond. Res. 2018, 32, 3135–3142. [Google Scholar] [CrossRef]
- Bosch, T.A.; Carbuhn, A.; Stanforth, P.R.; Oliver, J.M.; Keller, K.A.; Dengel, D.R. Body composition and bone mineral density of Division I collegiate football players: A consortium of college athlete research study. J. Strength Cond. Res. 2019, 33, 1339–1346. [Google Scholar] [CrossRef] [PubMed]
- Prokop, N.W.; Reid, R.E.; Andersen, R.E. Seasonal changes in whole body and regional body composition profiles of elite collegiate ice-hockey players. J. Strength Cond. Res. 2016, 30, 684–692. [Google Scholar] [CrossRef] [PubMed]
- Milanese, C.; Cavedon, V.; Corradini, G.; De Vita, F.; Zancanaro, C. Seasonal DXA-measured body composition changes in professional male soccer players. J. Sport. Sci. 2015, 33, 1219–1228. [Google Scholar] [CrossRef] [PubMed]
- Bosch, T.A.; Burruss, T.P.; Weir, N.L.; Fielding, K.A.; Engel, B.E.; Weston, T.D.; Dengel, D.R. Abdominal body composition differences in NFL football players. J. Strength Cond. Res. 2014, 28, 3313–3319. [Google Scholar] [CrossRef] [PubMed]
- Janssen, I.; Heymsfield, S.B.; Allison, D.B.; Kotler, D.P.; Ross, R. Body mass index and waist circumference independently contribute to the prediction of nonabdominal, abdominal subcutaneous, and visceral fat. Am. J. Clin. Nutr. 2002, 75, 683–688. [Google Scholar] [CrossRef] [PubMed]
- Berker, D.; Kopoaral, S.; Isik, S.; Paşaoğlu, L.; Aydin, Y.; Erol, K.; Delibaşi, T.; Güler, S. Compatibliity of different methods for the measurement of visceral fat in different body mass index strata. Diagn. Interv. Radiol. 2010, 16, 99–105. [Google Scholar] [CrossRef]
- Bonora, E.; Micciolo, R.; Ghiatas, A.A.; Lancaster, J.L.; Alyassin, A.; Muggeo, M.; Defronzo, R.A. Is it possible to derive a reliable estimate of human visceral and subcutaneous abdominal adipose tissue from simple anthropometric measurements? Metabolism 1995, 44, 1617–1625. [Google Scholar] [CrossRef] [PubMed]
- Ellis, K.J. Human body composition: In vivo methods. Physiol. Rev. 2000, 80, 649–680. [Google Scholar] [CrossRef] [PubMed]
- Tolonen, A.; Pakarinen, T.; Sassi, A.; Kyttä, J.; Cancino, W.; Rinta-Kiikka IPertuz, S.; Arponen, O. Methodology, clinical applications, and future directions of body composition analysis using computed tomography (CT) images: A review. Eur. J. Radiol. 2021, 145, 109943. [Google Scholar] [CrossRef] [PubMed]
- Borga, M.; Ahlgren, A.; Romu, T.; Widholm, P.; Leinhard, O.D.; West, J. Reproducibility and repeatability of MRI-based body composition analysis. Magn. Reson. Med. 2000, 84, 3146–3156. [Google Scholar] [CrossRef]
- Sanfilippo, J.; Krueger, D.; Heiderscheit, B.; Binkley, N. Dual energy X-ray absorptiometry body composition in NCAA Division I athletes: Exploration of mass distribution. Sport. Health 2019, 11, 453–460. [Google Scholar] [CrossRef] [PubMed]
- Kyle, U.G.; Bosaeus, I.; De Lorenzo, A.D.; Deurenberg, P.; Elia, M.; Gómez, J.M.; Heitmann, B.L.; Kent-Smith, L.; Melchior, J.-C.; Pirlich, M.; et al. Bioelectrical impedance—Part II: Utilization in clinical practice. Clin. Nutr. 2004, 21, 1430–1453. [Google Scholar] [CrossRef] [PubMed]
- Campa, F.; Gobbo, L.A.; Stagi, S.; Cyrino, L.T.; Toselli, S. Bioelectrical impedance analysis versus reference methods in the assessment of body composition in athletes. Eur. J. Appl. Physiol. 2022, 122, 561–589. [Google Scholar] [CrossRef] [PubMed]
- Brewer, G.J.; Blue, M.N.M.; Hirsch, K.T.; Saylor, H.E.; Gould, L.M.; Nelson, A.G.; Smith-Ryan, A.E. Validation of InBody 770 bioelectrical impedance analysis compared to four-compartment model criterion in young adults. Clin. Physiol. Funct. Imaging 2021, 41, 317–325. [Google Scholar] [CrossRef]
- Antnio, J.; Kenyon, M.; Ellerbroek, A.; Carson, C.; Burgess, V.; Tyler-Palmer, D.; Mike, J.; Roberts, J.; Angeli, G.; Peacock, C. Comparison of dual-energy X-ray absorptiometry (DXA) versus a multi-frequency bioelectrical impedance (InBody 770) device for body composition assessment after a 4-week hypoenergetic diet. J. Funct. Morphol. Kinesiol. 2019, 4, 23. [Google Scholar] [CrossRef]
- Antonio, J.; Kenyon, M.; Ellerbroek, A.; Carson, C.; Yuler-Palmer, D.; Burgess, V.; Angeli, G.; Silver, T.; Jiannine, L.; Peacock, C. Body composition assessment: A comparison of the Bod Pod, InBody 770, and DXA. J. Exerc. Nutr. 2019, 2, 11. [Google Scholar]
- McLester, C.N.; Nickerson, B.S.; KLliszczweicz McLester, J.R. Reliability and agreement of various InBody body composition analyzers as compared to Duaal-energy X-ray absorptiometry in healthy men and women. J. Clin. Densitom. 2020, 23, 443–450. [Google Scholar] [CrossRef]
- Yamada, Y.; Yamada, M.; Yoshida, T.; Miyachi, M.; Arai, H. Validating muscle mass cutoffs of four international sarcopenia-working groups in Japanese people using DXA and BIA. J. Cachexia Sarcopenia Muscle 2021, 12, 1000–1010. [Google Scholar] [CrossRef]
- Hurt, R.T.; Ebbert, J.O.; Crohan, I.; Nanda, S.; Schroeder, D.R.; Teigen, L.M.; Velapati, S.R.; Mundi, M.S. The comparison of segmental multifequency bioelectrical impedance analysis and dual-energy X-ray absorptiometry for estimating fat free mass and percentage body fat in an ambulatory population. JPEN J. Paraenter. Enteral. Nutr. 2021, 45, 1231–1238. [Google Scholar] [CrossRef]
- Carrion, B.M.; Wells, A.; Mayhew, J.L.; Koch, A.J. Concordance among bioelectrical impedance analysis measures of percent body fat in athletic young adults. Int. J. Exerc. Sci. 2019, 12, 324–331. [Google Scholar]
- Raymond, C.J.; Dengel, D.R.; Bosch, T.A. Total and segmental body composition examination in collegiate football players using multifrequency bioelectrical impedance analysis and dual X-ray absorptiometry. J. Strength Cond. Res. 2018, 32, 772–782. [Google Scholar] [CrossRef] [PubMed]
- Brewer, G.J.; Blue, M.N.M.; Hirsch, K.R.; Peterjohn, A.M.; Smith-Ryan, A.E. Appendicular body composition analysis: Validity of bioelectrical impedance analysis compared with dual-energy X-ray absorptiometry in division I college athletes. J. Strength Cond. Res. 2019, 33, 2920–2925. [Google Scholar] [CrossRef]
- Munguia-Izquierdo, D.; Suarez-Arrones, L.; Salvo, V.D.; Paredes-Hernadez, V.; Alcazar, J.; Ara, I.; Kreider, R.; Mendez-Villanueva, A. Validation of field methods to assess body fat percentage in elite youth soccer players. Int. J. Sport. Med. 2018, 39, 349–354. [Google Scholar] [CrossRef] [PubMed]
- Utter, A.; Lambeth, P.G. Evaluation of multifrequency bioelectrical impedance analysis in assessing body composition of wrestlers. Med. Sci. Sport Exerc. 2010, 42, 361–367. [Google Scholar] [CrossRef]
- Bazzocchi, A.; Ponti, F.; Albisnni, U.; Battista, G.; Guglielmi, G. DXA: Technical aspects and application. Eur. J. Radiol. 2016, 85, 1481–1491. [Google Scholar] [CrossRef] [PubMed]
- Esco, M.R.; Snarr, R.L.; Leatherwood, M.D.; Chamberlain, N.A.; Redding, M.L.; Flatt, A.A.; Moon, J.R.; Williford, H.N. Comparison of total and segmental body composition using DXA and multifrequency bioimpedance in collegiate female athletes. J. Strength Cond. Res. 2015, 29, 918–925. [Google Scholar] [CrossRef]
- Sardinha, L.B.; Correia, I.R.; Magalhaes, J.P.; Judice, P.B.; Silva, A.M.; Hetherington-Rauth, M. Development and validation of BIA prediction equations of upper and lower limb lean soft tissue in athletes. Eur. J. Clin. Nutr. 2020, 74, 1646–1652. [Google Scholar] [CrossRef]
- Hong, S.; Oh, H.J.; Cho, H.; Kim, J.G.; Lim, S.K.; Kim, E.K.; Pyo, E.Y.; Oh, K.; Kim, Y.T.; WILSON, K.; et al. Characteristics of body fat, body fat percentage and other body composition for Koreans from KNHANES IV. J. Korean Med. Sci. 2011, 26, 1599–1605. [Google Scholar] [CrossRef]
- Kelly, T.L.; Wilson, K.E.; Heymsfield, S.B. Dual energy X-ray absorptiometry body composition reference values from NHANES. PLoS ONE 2009, 4, e7038. [Google Scholar] [CrossRef]
- Aloui, A.; Chtourou, H.; Souissi, N. Weight reduction cycles and effects in Tawkwondo. In Performance Optimization in Taekwondo: From Laboratory to Field; Haddad, M., Ed.; OMICS International: Foster City, CA, USA; pp. 131–136.
- Bešlija, T.; Čular, D.; Kezić, A.; Tomljanović, M.; Ardigò, L.P.; Dhabhi, W.; Padulo, J. Height-based model for the categorization of athletes in combat sports. Appl. Sport Sci. 2020, 21, 471–480. [Google Scholar] [CrossRef]


| Light Weight (n = 12) | Middle Weight (n = 40) | Heavy Weight (n = 14) | All (n = 66) | |
|---|---|---|---|---|
| Age (year) | 20.1 ± 1.1 (18.7, 21.1) | 20.6 ± 1.1 (18.7, 22.3) | 21.1 ± 1.0 (19.4, 22.3) | 20.6 ± 1.1 (18.7, 22.3) |
| Weight (kg) | 60.6 ± 2.7 (56.4, 63.9) | 71.8 ± 5.6 (64.1, 83.8) | 103.1 ± 13.0 (84.0, 127.9) | 76.4 ± 16.3 (56.4, 127.9) |
| Height (cm) | 164.2 ± 4.5 (156.5, 171.0) | 170.4 ± 4.3 (162.0, 181.0) | 176.7 ± 7.0 (170.0, 196.0) | 170.6 ± 6.3 (156.5, 196.0) |
| BMI (kg/m2) | 22.5 ± 1.2 (20.7, 24.5) | 24.8 ± 2.1 (20.9, 29.1) | 33.0 ± 3.2 (27.5, 37.5) | 26.1 ± 4.3 (20.7,37.5) |
| Percent Body Fat (%) | 10.7 ± 3.7 (5.1, 17.7) | 15.7 ± 7.2 (8.1, 36.2) | 30.3 ± 5.0 (21.8, 37.1) | 17.9 ± 9.2 (5.1, 37.1) |
| FFM (kg) | 54.5 ± 2.9 (50.2, 60.8) | 60.8 ± 4.8 (49.4, 74.3) | 71.4 ± 6.1 (65.0, 86.1) | 61.9 ± 7.3 (49.4, 86.1) |
| LSTM (kg) | 51.4 ± 2.7 (47.6, 57.3) | 57.3 ± 4.9 (46.1, 70.4) | 67.5 ± 6.1 (60.8, 82.2) | 58.4 ± 7.0 (46.1, 82.2) |
| TBW (kg) | 40.2 ± 2.1 (36.9, 44.8) | 44.8 ± 3.5 (36.4, 54.8) | 52.6 ± 4.5 (47.9, 63.4) | 43.0 ± 5.4 (36.4, 63.4) |
| Training experience (year) | 7.9 ± 1.9 (6.7, 9.3) | 8.2 ± 1.6 (6.9, 8.9) | 8.8 ± 1.3 (5.9, 9.5) | 8.5 ± 2.1 (6.7, 9.5) |
| Limit of Agreement | |||||||||||
|---|---|---|---|---|---|---|---|---|---|---|---|
| MFBIA | DXA | ρ | CCC | p 1 | Cb | Bias | Lower | Upper | Regression Line | Trend | |
| FFMWB (kg) | 61.97 ± 8.10 | 61.89 ± 7.27 | 0.958 | 0.953 | 0.790 | 0.994 | 0.077 | −4.523 | 4.683 | Y = −6.956 + 0.109x | ** |
| LSTMWB (kg) | 58.55 ± 7.59 | 58.40 ± 7.02 | 0.954 | 0.951 | 0.519 | 0.997 | 0.151 | −4.332 | 4.635 | Y = −4.475 + 0.079x | * |
| BFMWB (kg) | 14.02 ± 9.47 | 14.09 ± 10.16 | 0.982 | 0.979 | 0.772 | 0.997 | −0.07 | −3.963 | 3.802 | Y = 0.930 − 0.710x | ** |
| PBFWB (%) | 17.11 ± 7.51 | 17.91 ± 9.20 | 0.962 | 0.938 | * | 0.975 | −0.795 | −6.362 | 4.771 | Y = 2.822 − 0.206x | *** |
| FFMRA (kg) | 3.58 ± 0.58 | 3.69 ± 0.57 | 0.238 | 0.233 | 0.186 | 0.979 | −0.117 | −1.526 | 1.285 | Y = −0.268 + 0.041x | 0.834 |
| FFMLA (kg) | 3.54 ± 0.57 | 3.61 ± 0.53 | 0.224 | 0.221 | 0.420 | 0.990 | −0.069 | −1.424 | 1.283 | Y = −0.439 + 0.103x | 0.604 |
| FFMTK (kg) | 27.36 ± 3.47 | 29.83 ± 4.27 | 0.929 | 0.755 | *** | 0.813 | −2.467 | −5.714 | 0.777 | Y = 3.689 − 0.215x | *** |
| FFMRL (kg) | 9.39 ± 1.30 | 11.19 ± 1.61 | 0.795 | 0.440 | *** | 0.554 | −1.796 | −3.715 | 0.121 | Y = 0.645 − 2.372x | *** |
| FFMLL (kg) | 9.32 ± 1.27 | 11.12 ± 2.32 | 0.811 | 0.434 | *** | 0.536 | −1.798 | −3.546 | −0.054 | Y = 0.247 − 0.200x | * |
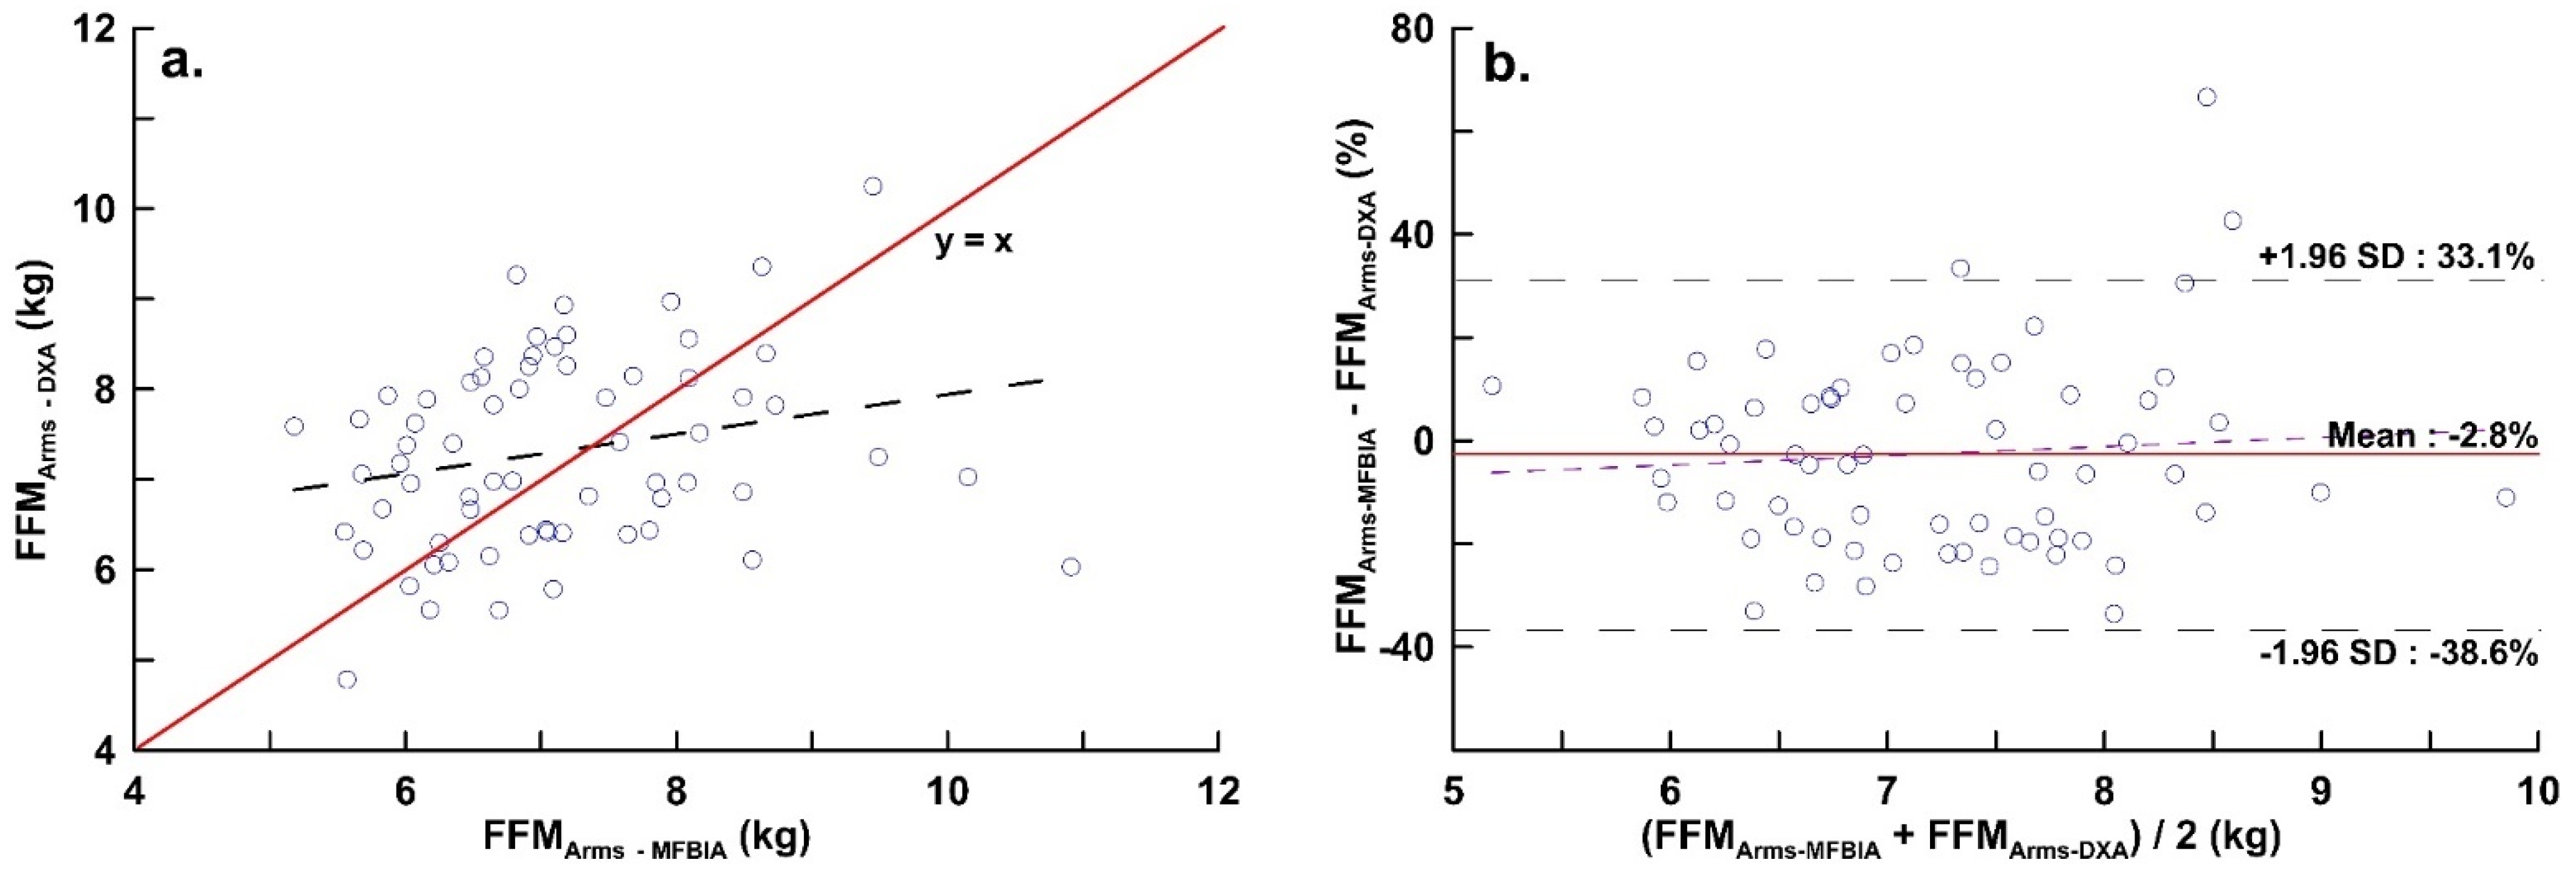
| FFMArms (kg) | 7.12 ± 1.15 | 7.31 ± 1.06 | 0.237 | 0.233 | 0.273 | 0.983 | −0.186 | −2.877 | 2.504 | Y = −1.129 + 0.130x | 0.506 |
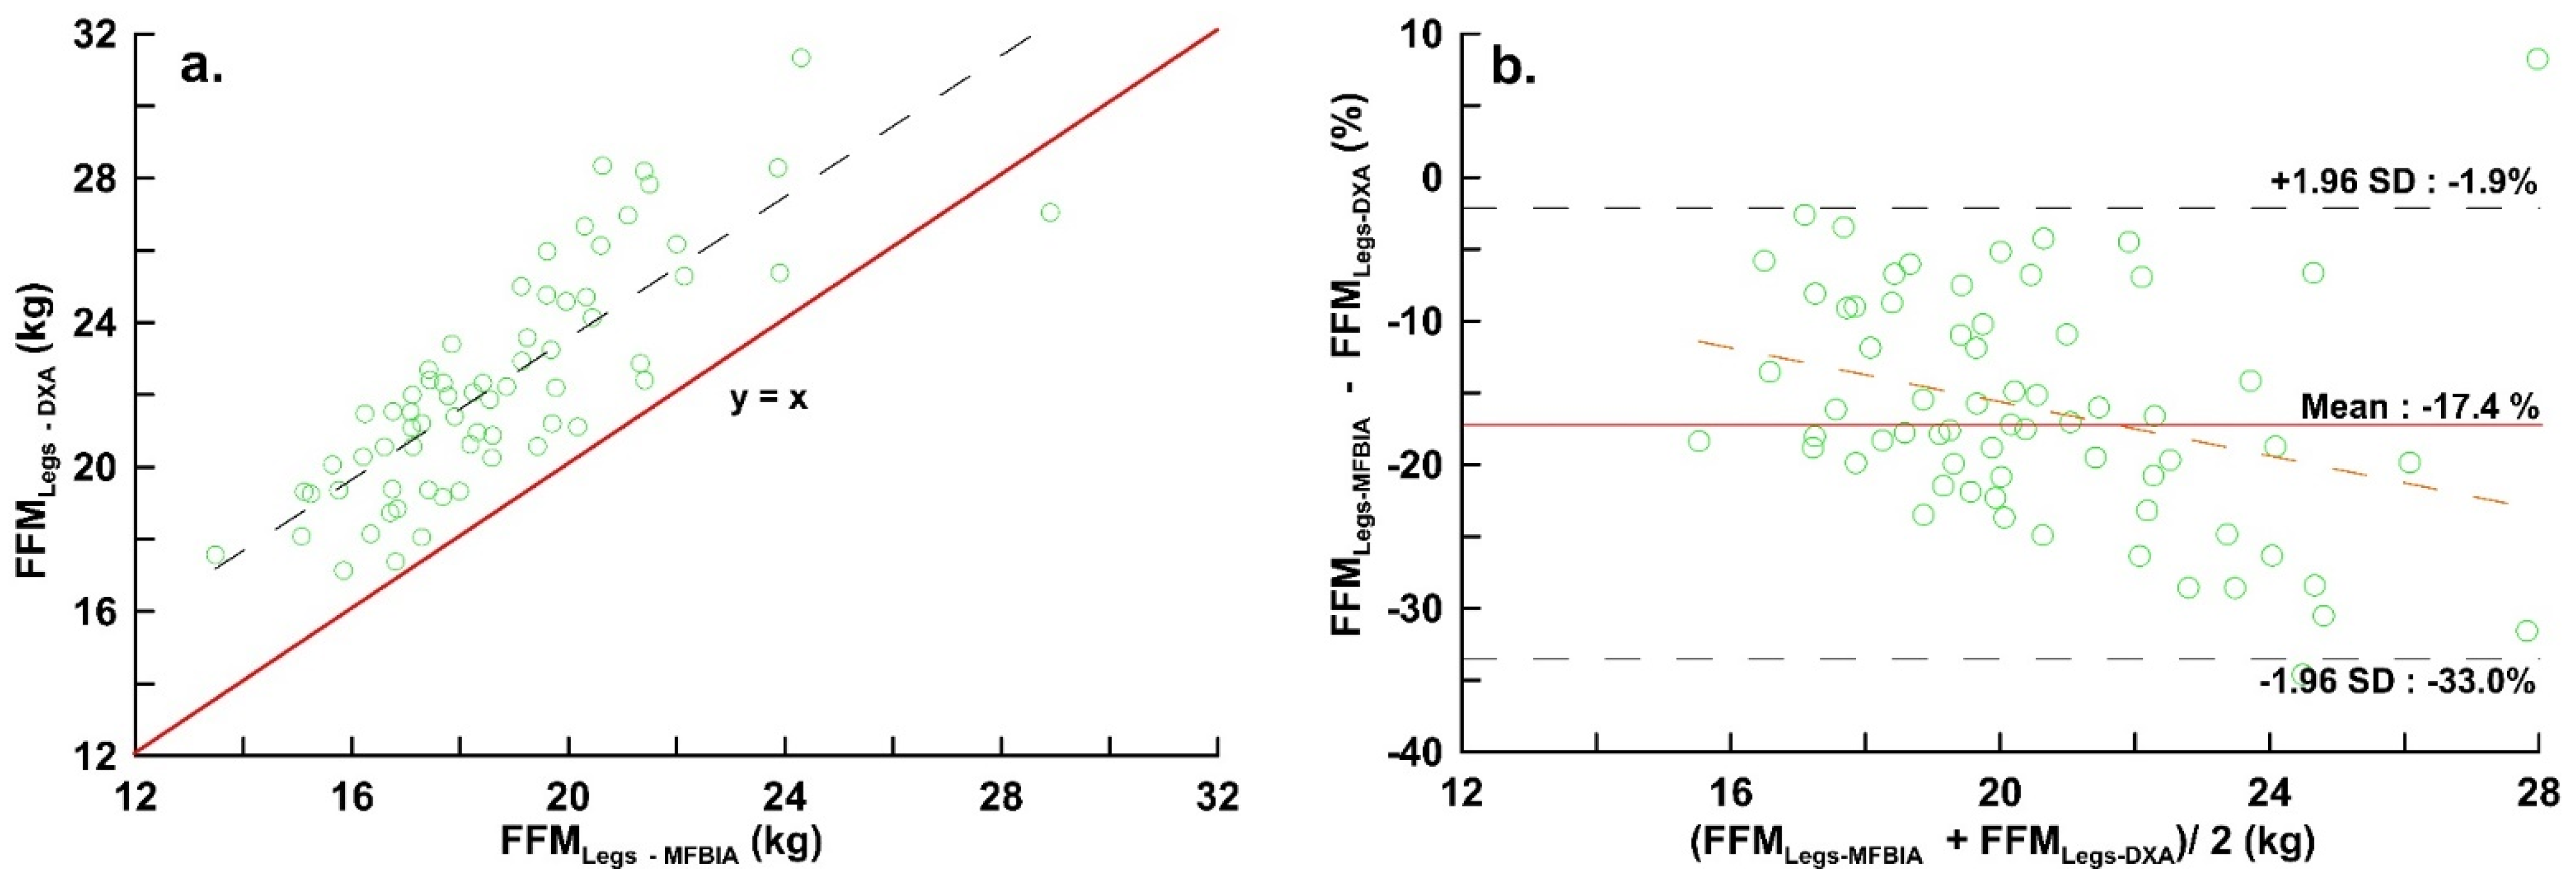
| FFMLegs (kg) | 18.71 ± 2.56 | 22.30 ± 3.10 | 0.809 | 0.440 | *** | 0.544 | −3.594 | −7.173 | −0.015 | Y = 0.705 − 0.209x | * |
Publisher’s Note: MDPI stays neutral with regard to jurisdictional claims in published maps and institutional affiliations. |
© 2022 by the authors. Licensee MDPI, Basel, Switzerland. This article is an open access article distributed under the terms and conditions of the Creative Commons Attribution (CC BY) license (https://creativecommons.org/licenses/by/4.0/).
Share and Cite
Lai, Y.-K.; Ho, C.-Y.; Lai, C.-L.; Taun, C.-Y.; Hsieh, K.-C. Assessment of Standing Multi-Frequency Bioimpedance Analyzer to Measure Body Composition of the Whole Body and Limbs in Elite Male Wrestlers. Int. J. Environ. Res. Public Health 2022, 19, 15807. https://doi.org/10.3390/ijerph192315807
Lai Y-K, Ho C-Y, Lai C-L, Taun C-Y, Hsieh K-C. Assessment of Standing Multi-Frequency Bioimpedance Analyzer to Measure Body Composition of the Whole Body and Limbs in Elite Male Wrestlers. International Journal of Environmental Research and Public Health. 2022; 19(23):15807. https://doi.org/10.3390/ijerph192315807
Chicago/Turabian StyleLai, Yeong-Kang, Chu-Ying Ho, Chung-Liang Lai, Chih-Yang Taun, and Kuen-Chang Hsieh. 2022. "Assessment of Standing Multi-Frequency Bioimpedance Analyzer to Measure Body Composition of the Whole Body and Limbs in Elite Male Wrestlers" International Journal of Environmental Research and Public Health 19, no. 23: 15807. https://doi.org/10.3390/ijerph192315807
APA StyleLai, Y.-K., Ho, C.-Y., Lai, C.-L., Taun, C.-Y., & Hsieh, K.-C. (2022). Assessment of Standing Multi-Frequency Bioimpedance Analyzer to Measure Body Composition of the Whole Body and Limbs in Elite Male Wrestlers. International Journal of Environmental Research and Public Health, 19(23), 15807. https://doi.org/10.3390/ijerph192315807