
The Impact of Community Shuttle Services on Traffic and Traffic-Related Air Pollution


Abstract
:1. Introduction
2. Related Works
2.1. Traffic-Related Environmental Evaluation
2.2. Community Shuttle Service Design
2.3. Research Gap
3. Methods
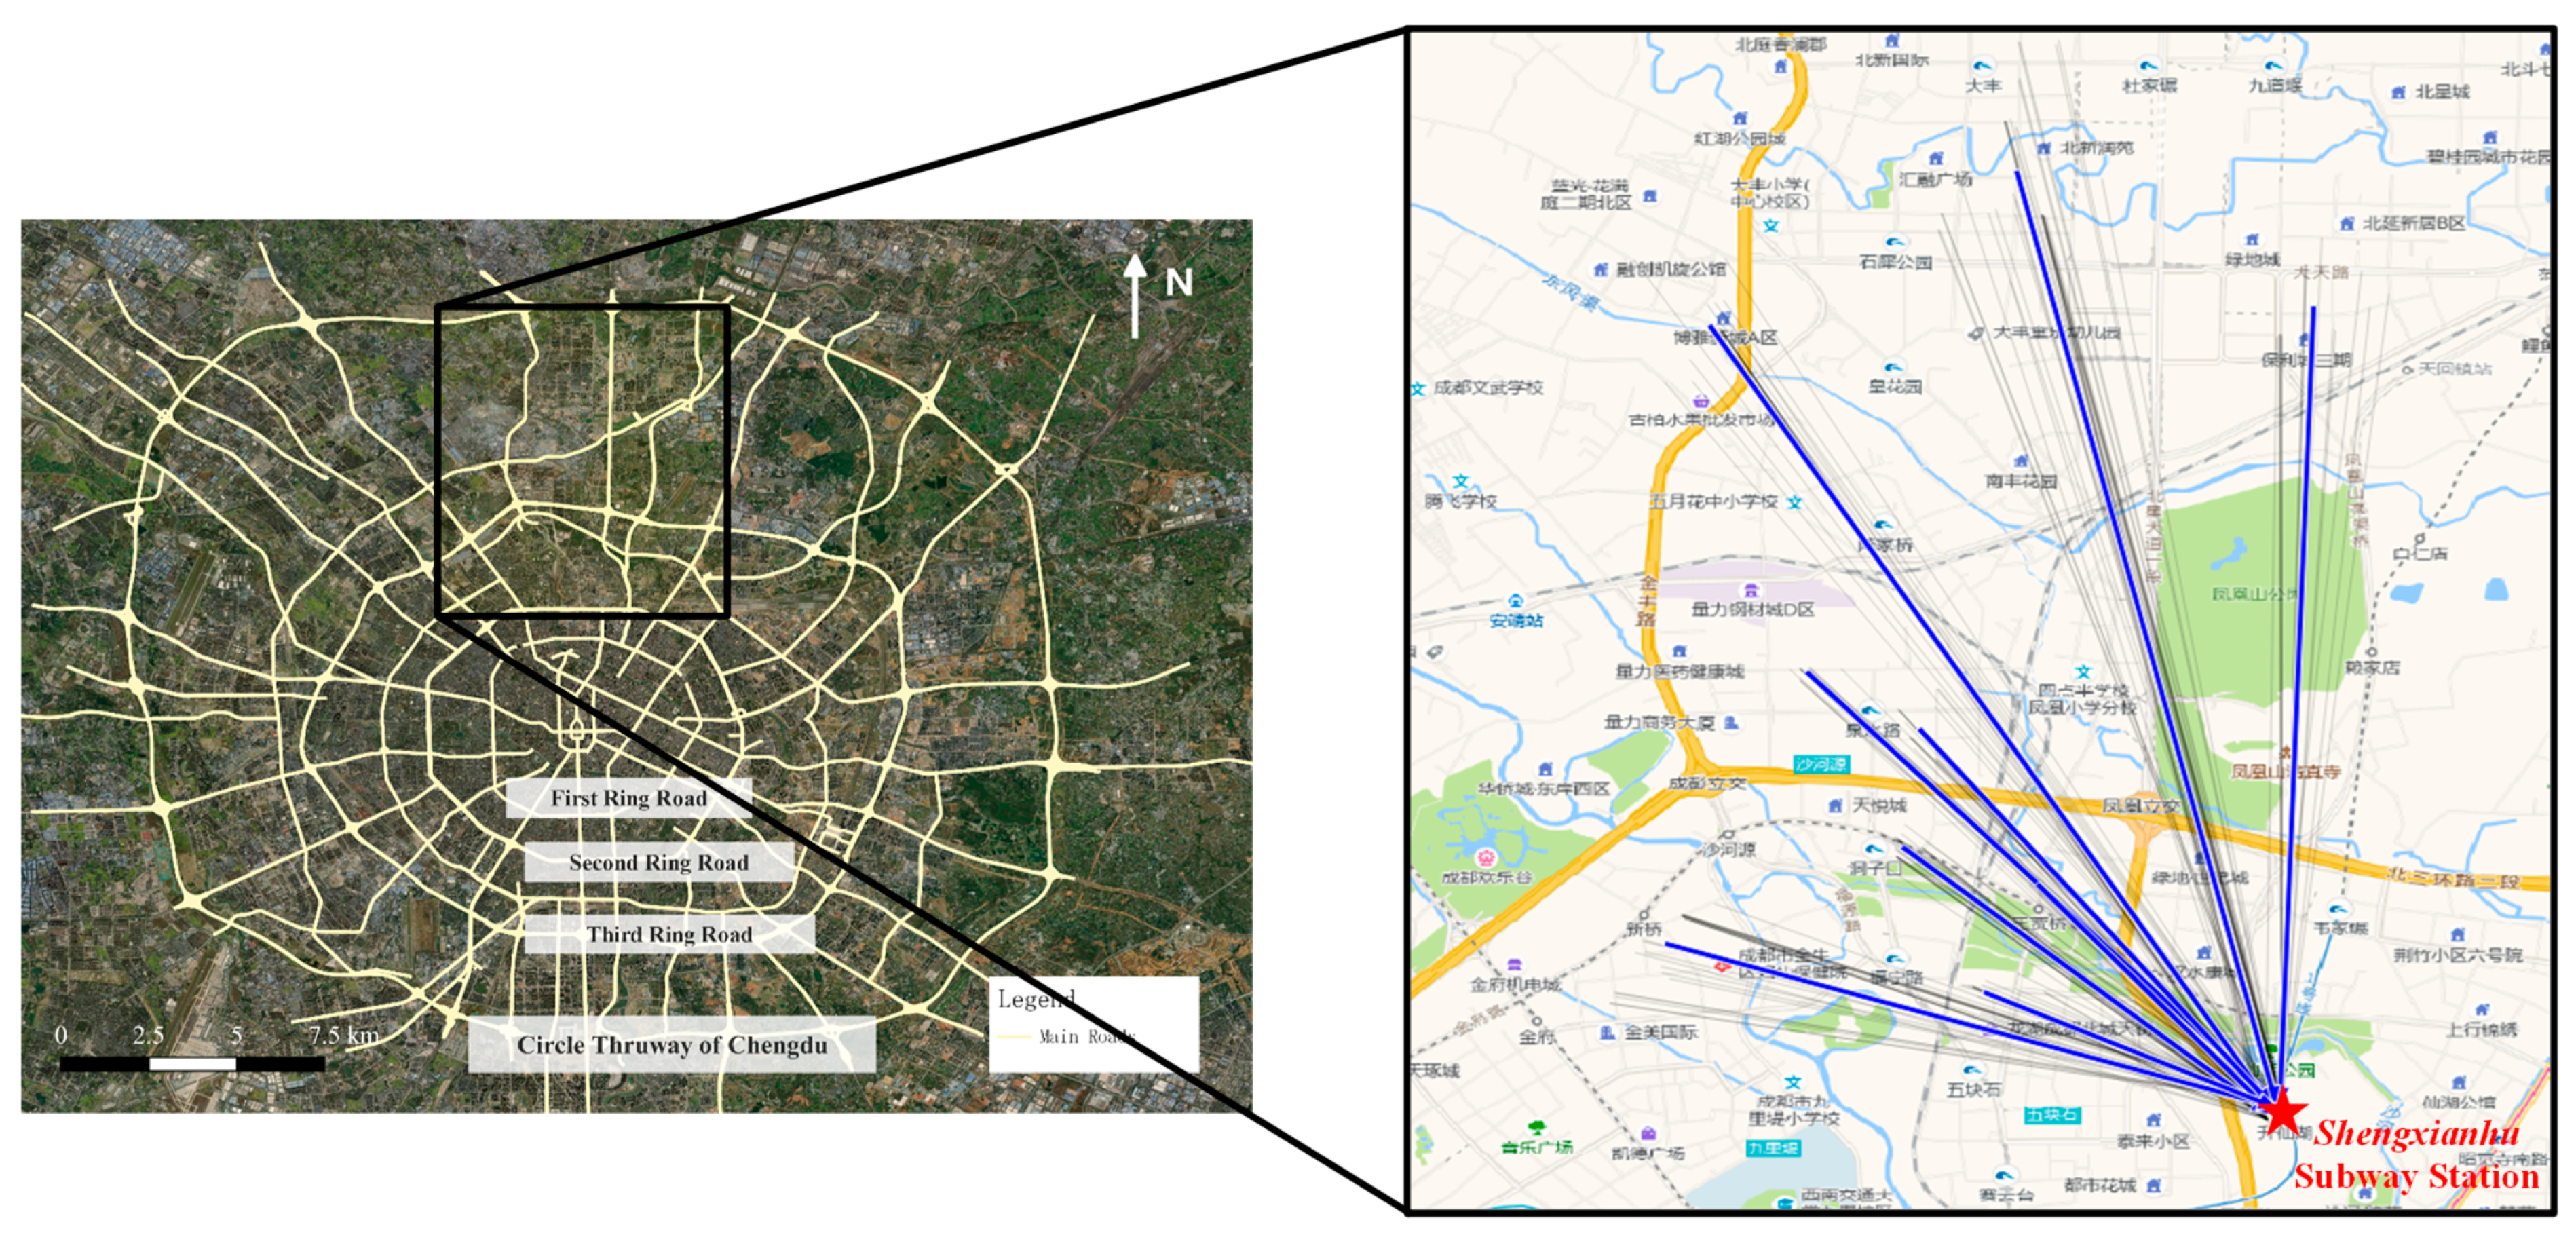
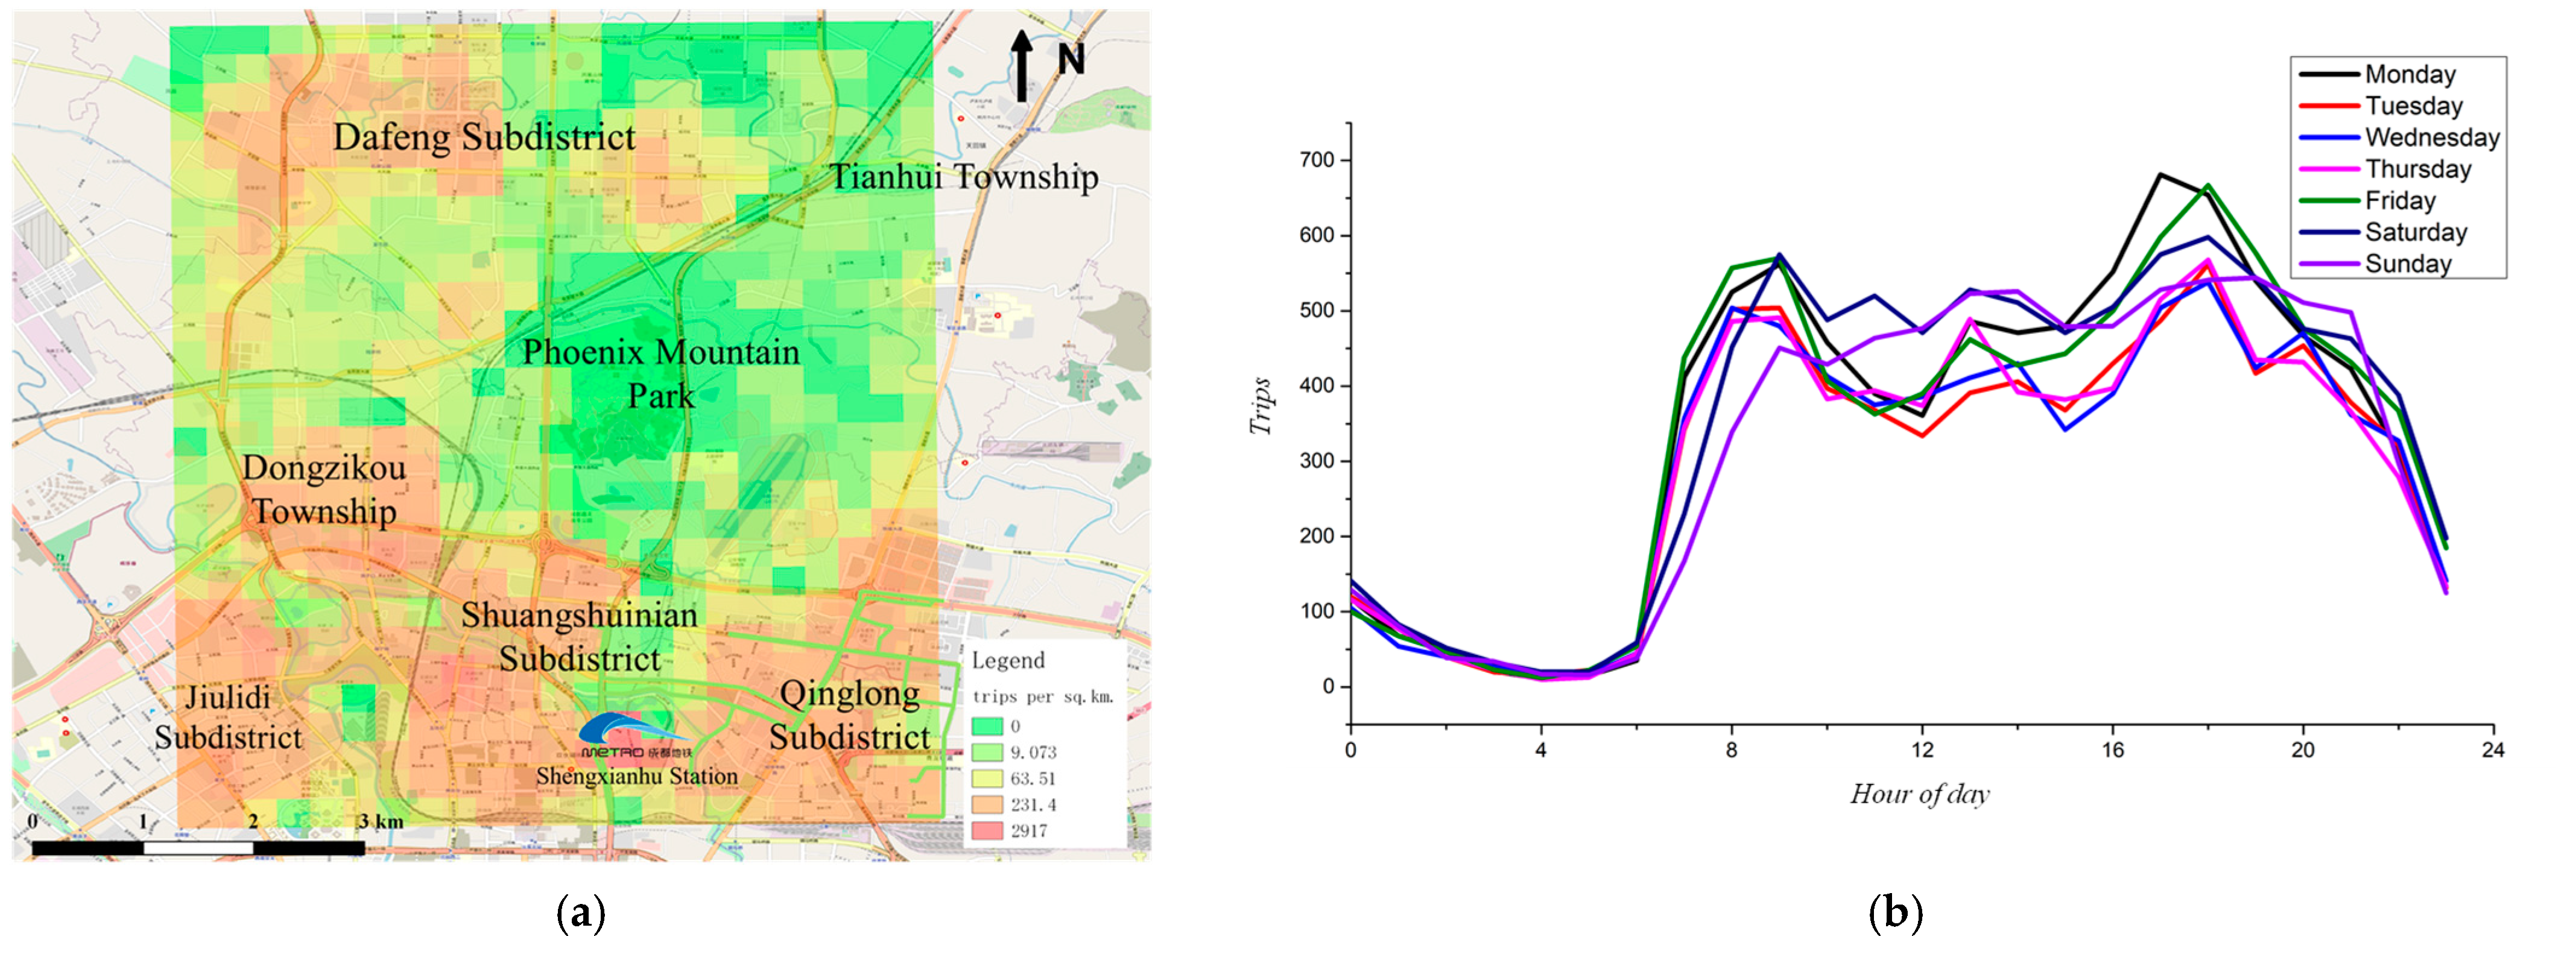
3.1. Study Area and Residential Mobility Data
3.2. Designing the Community Shuttle Route Based on Resident OD Data
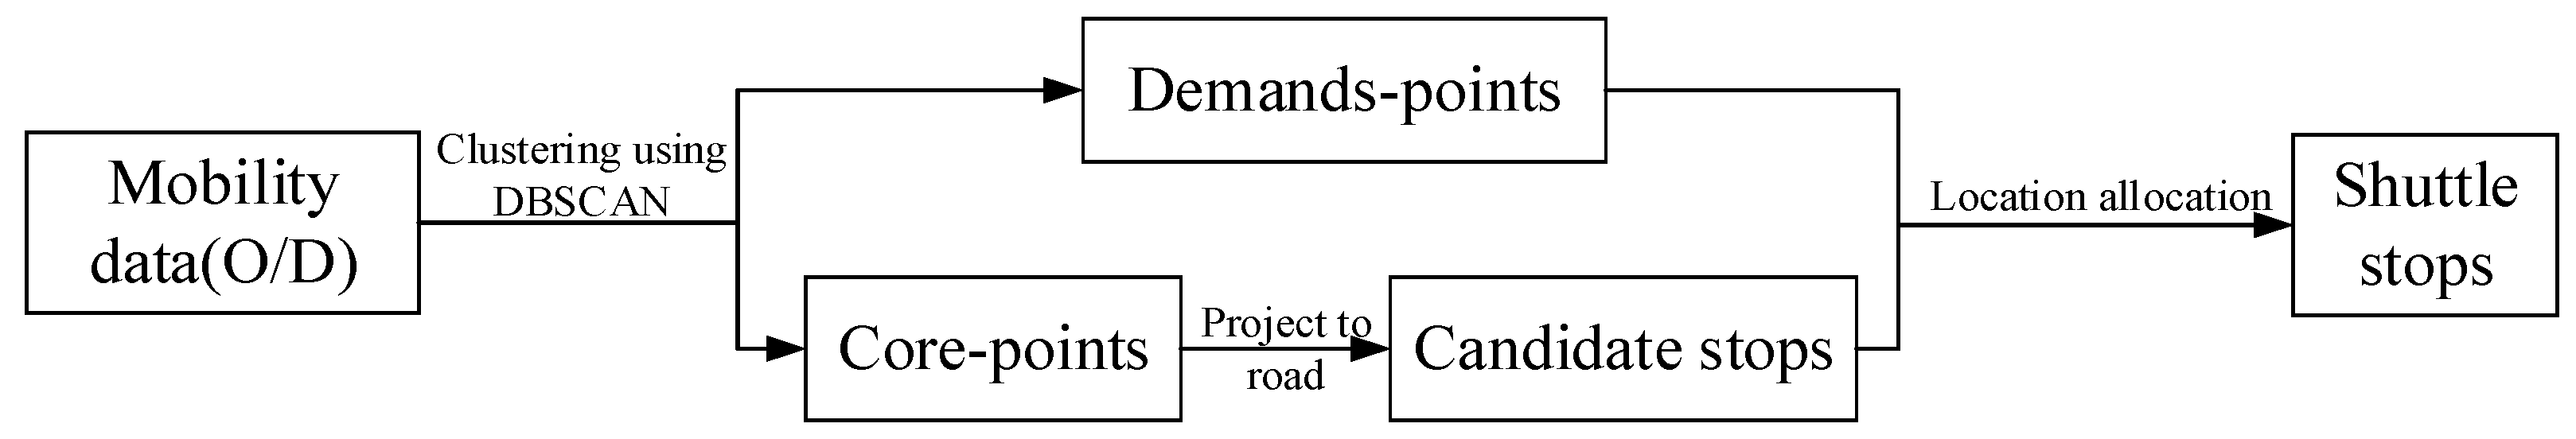
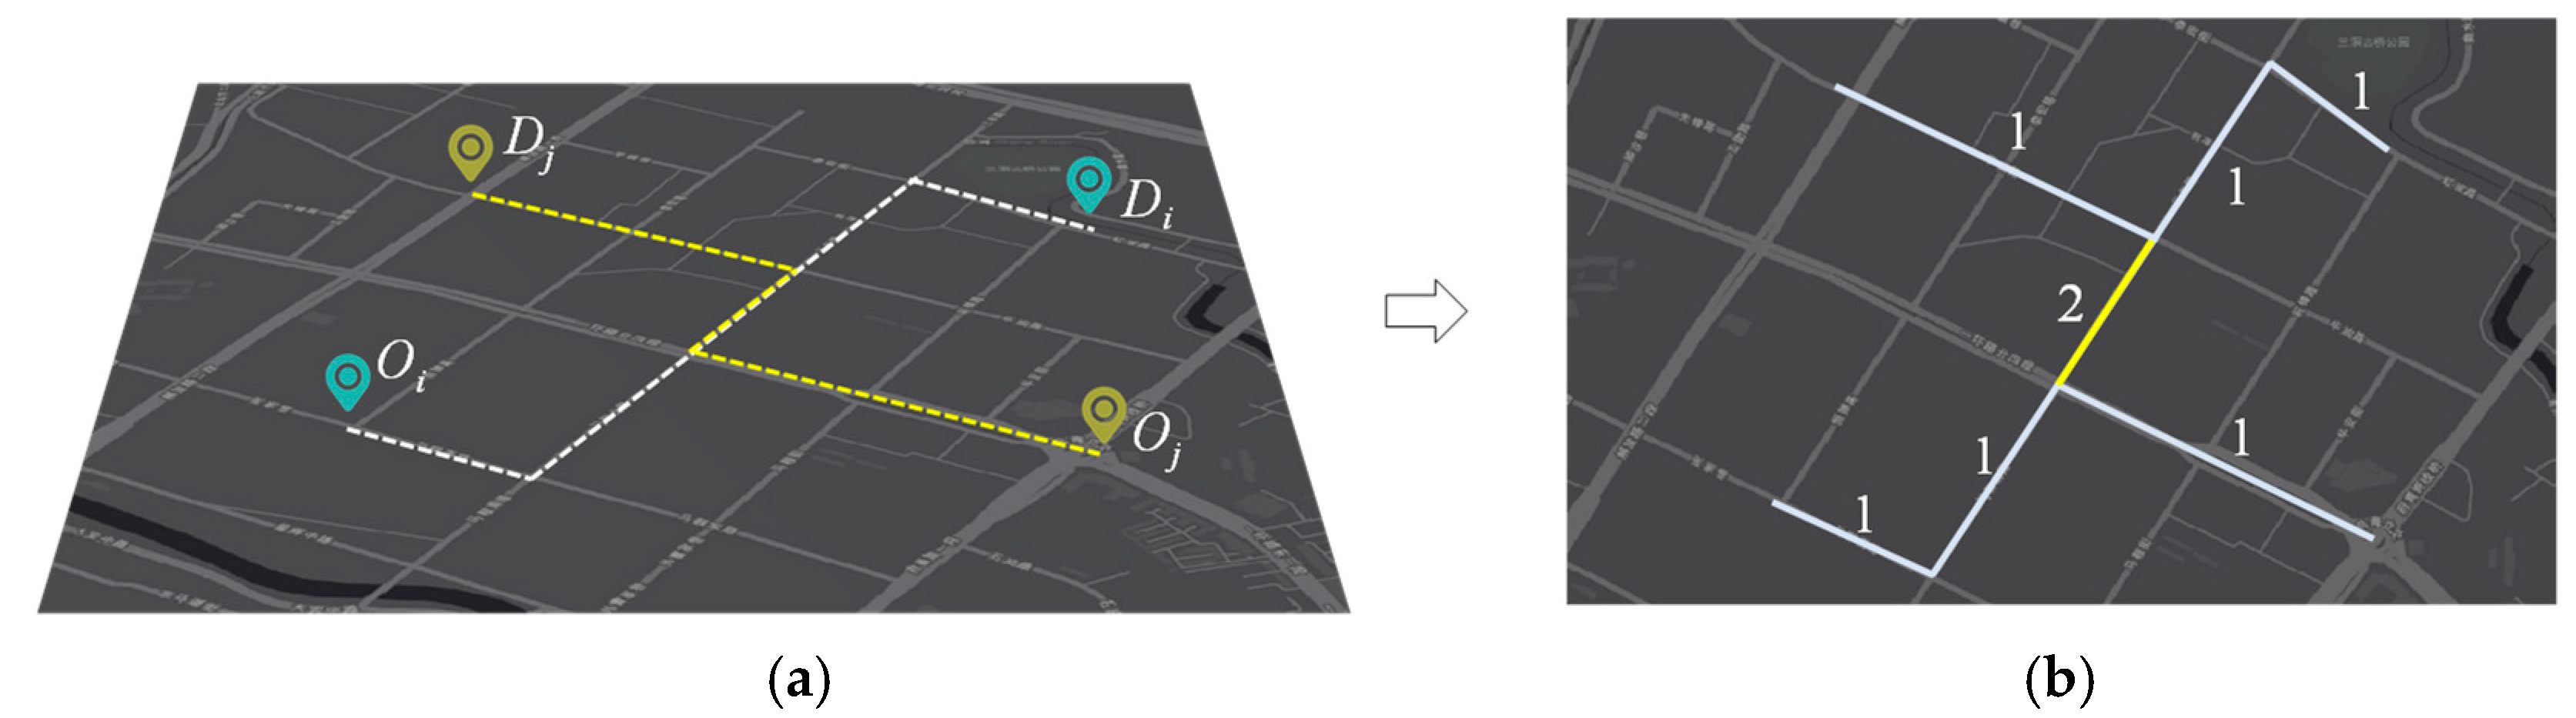
3.2.1. Generating Shuttle Stops with Maximized Service Capability
3.2.2. Generating Shuttle Routes by Genetic Algorithm
| Algorithm 1. Designing Shuttle Bus Routes with Genetic Algorithm |
Input: generated shuttle stops, distance matrix, iteration epochs maxiter, crossover probability pc, mutation probability pm, population size pop_size, population selection probability p_select.
|
3.3. Analyzing the Shifting Potential and Environmental Impacts
3.3.1. Condition of Shifting Traveling Mode to Community Shuttle Service
3.3.2. Estimating Traffic Distribution on the Road Network
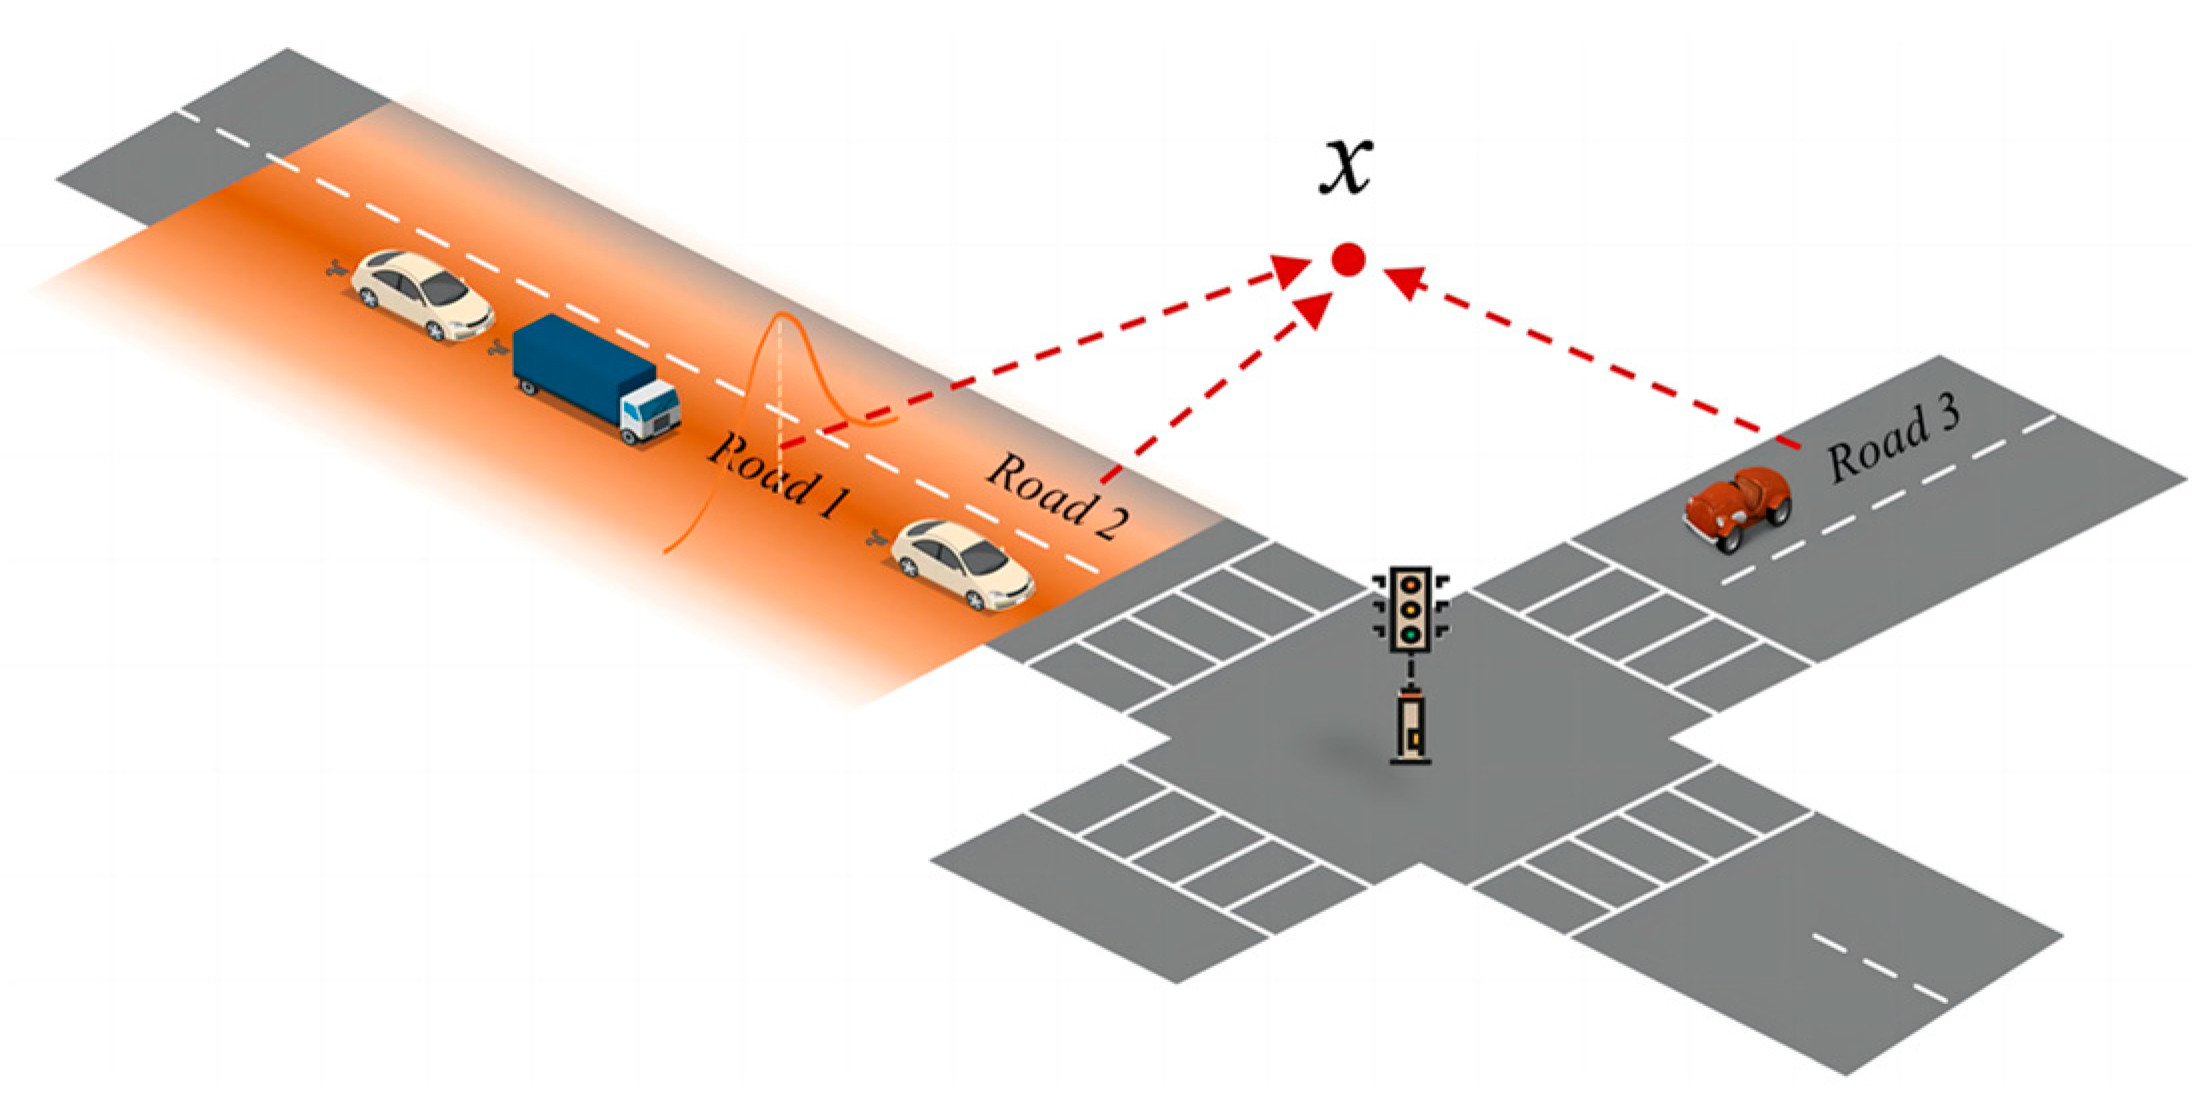
3.3.3. Estimating the Impact of Traffic Emissions on the Surrounding Environment
4. Results
4.1. Community Shuttle Service Design
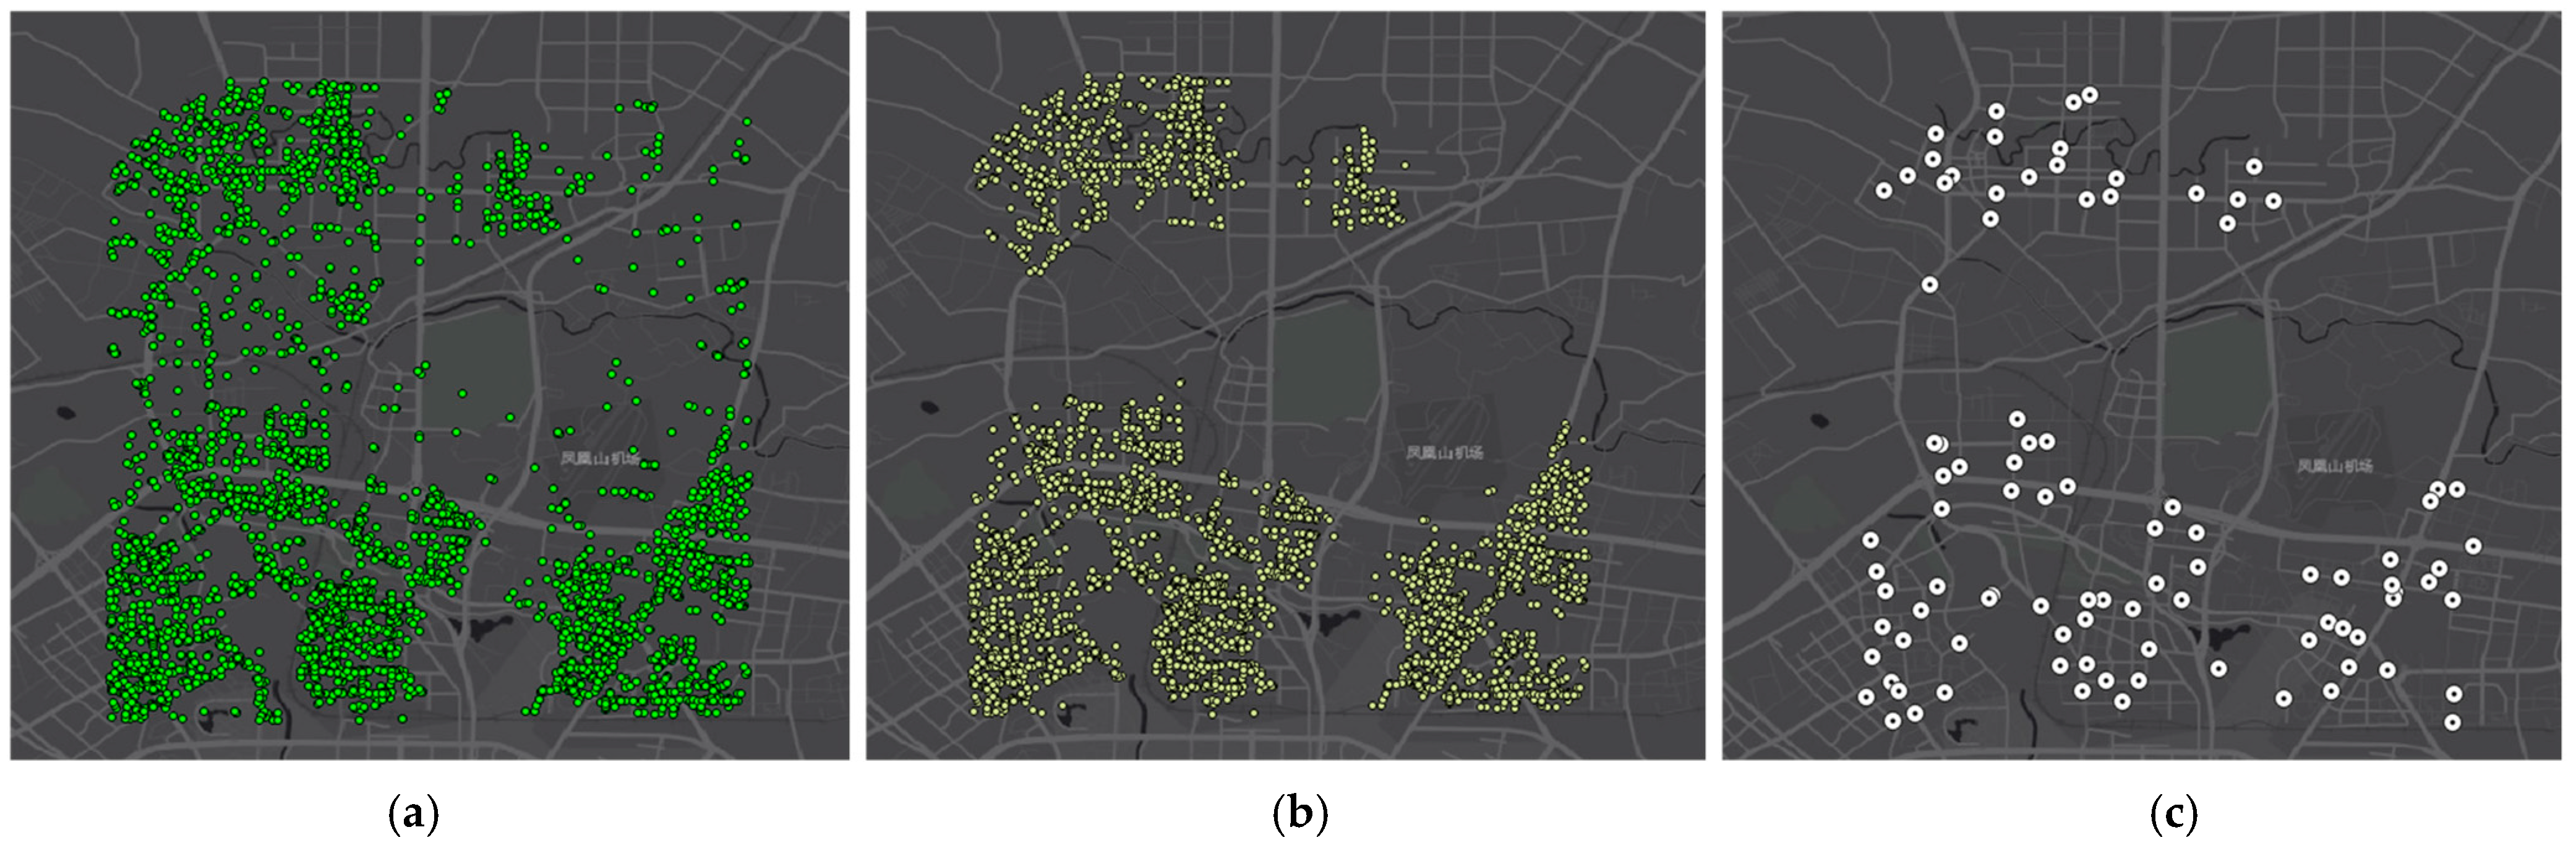
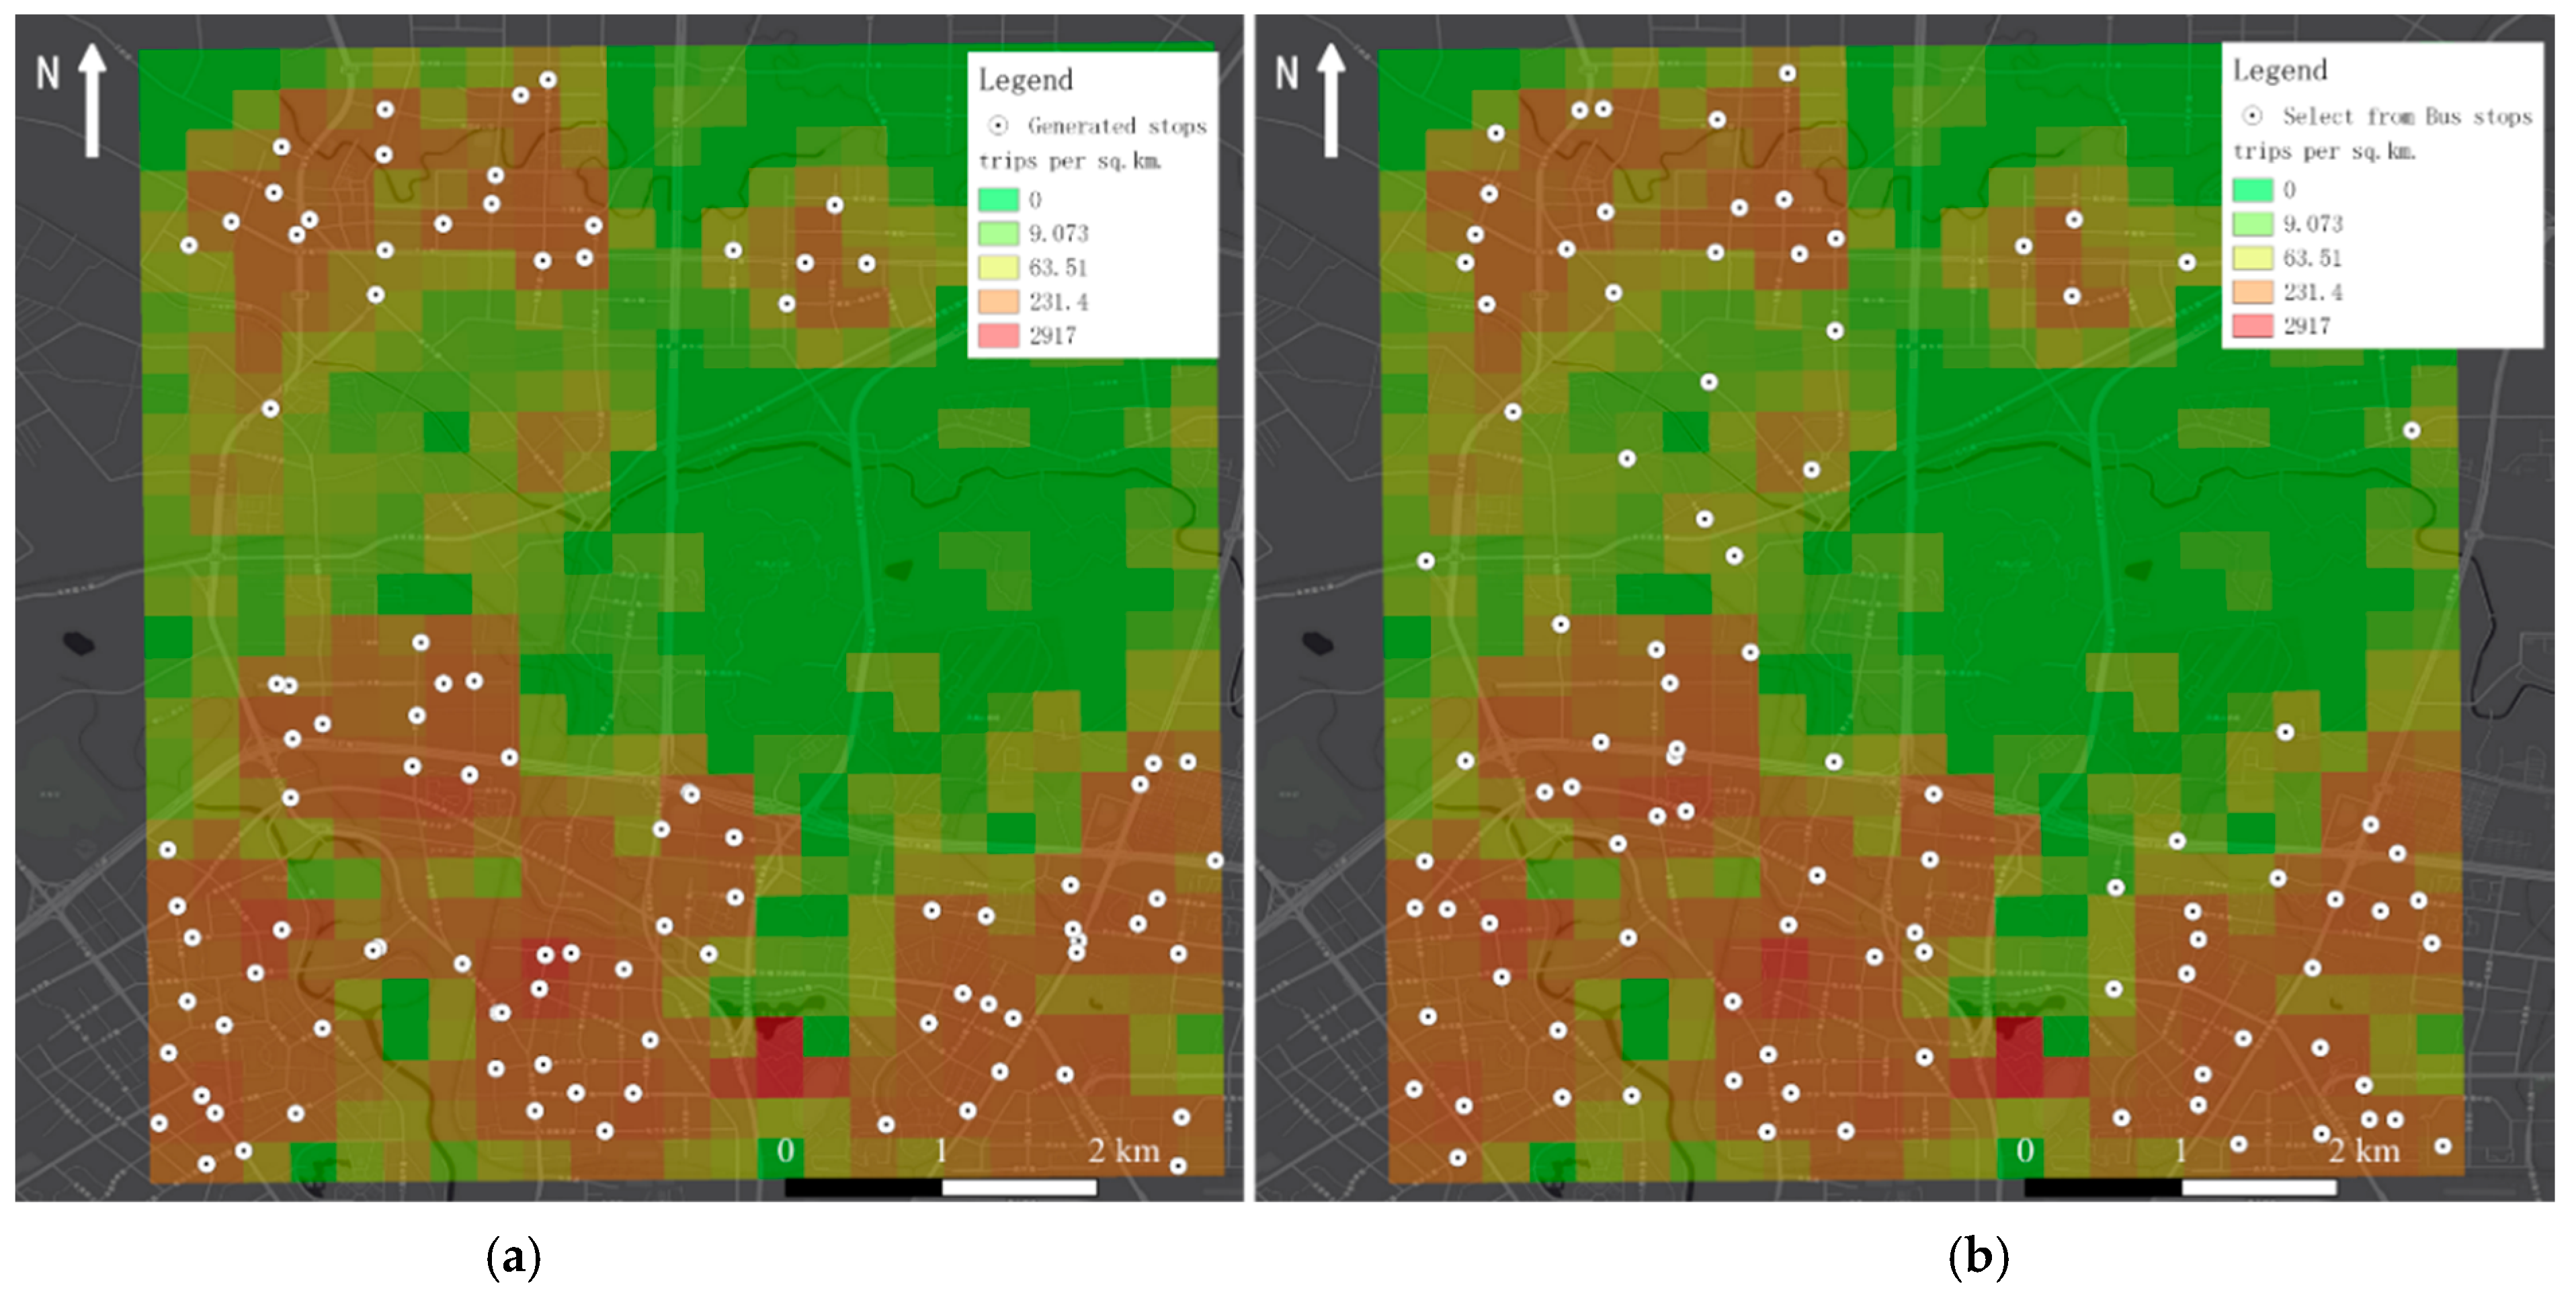
4.1.1. Generation of Shuttle Stops
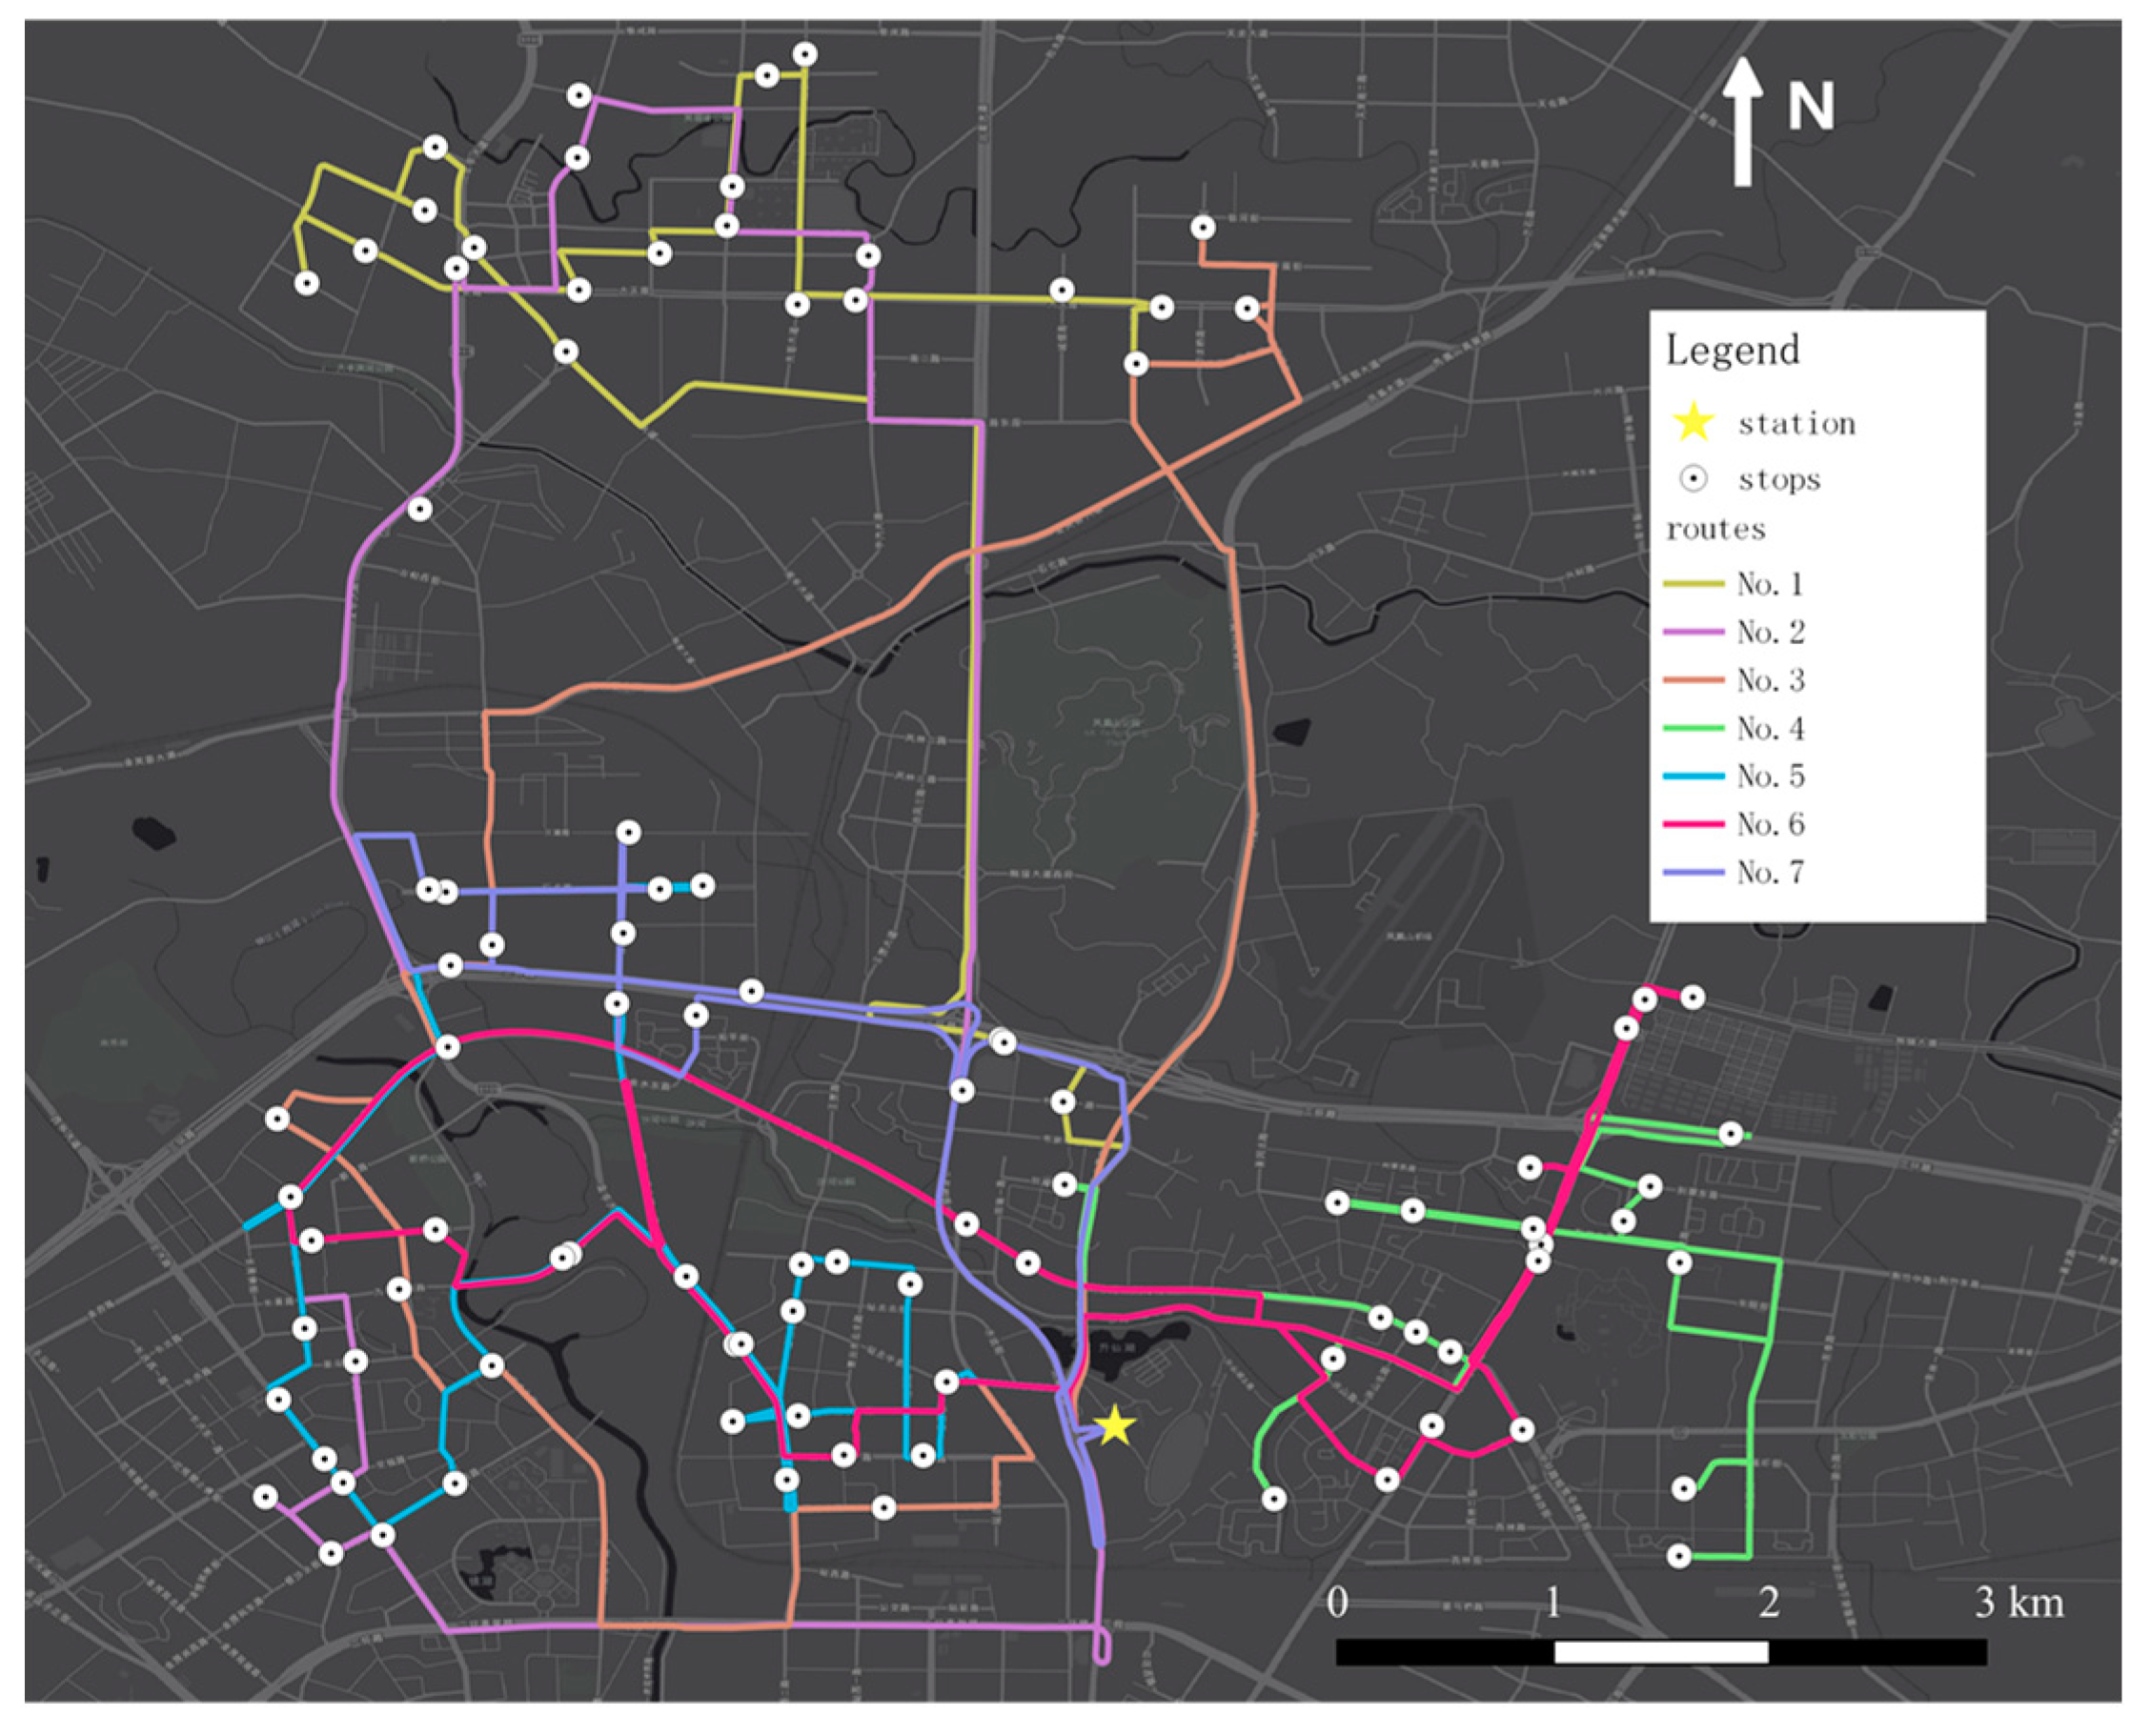
4.1.2. Generation of Shuttle Routes
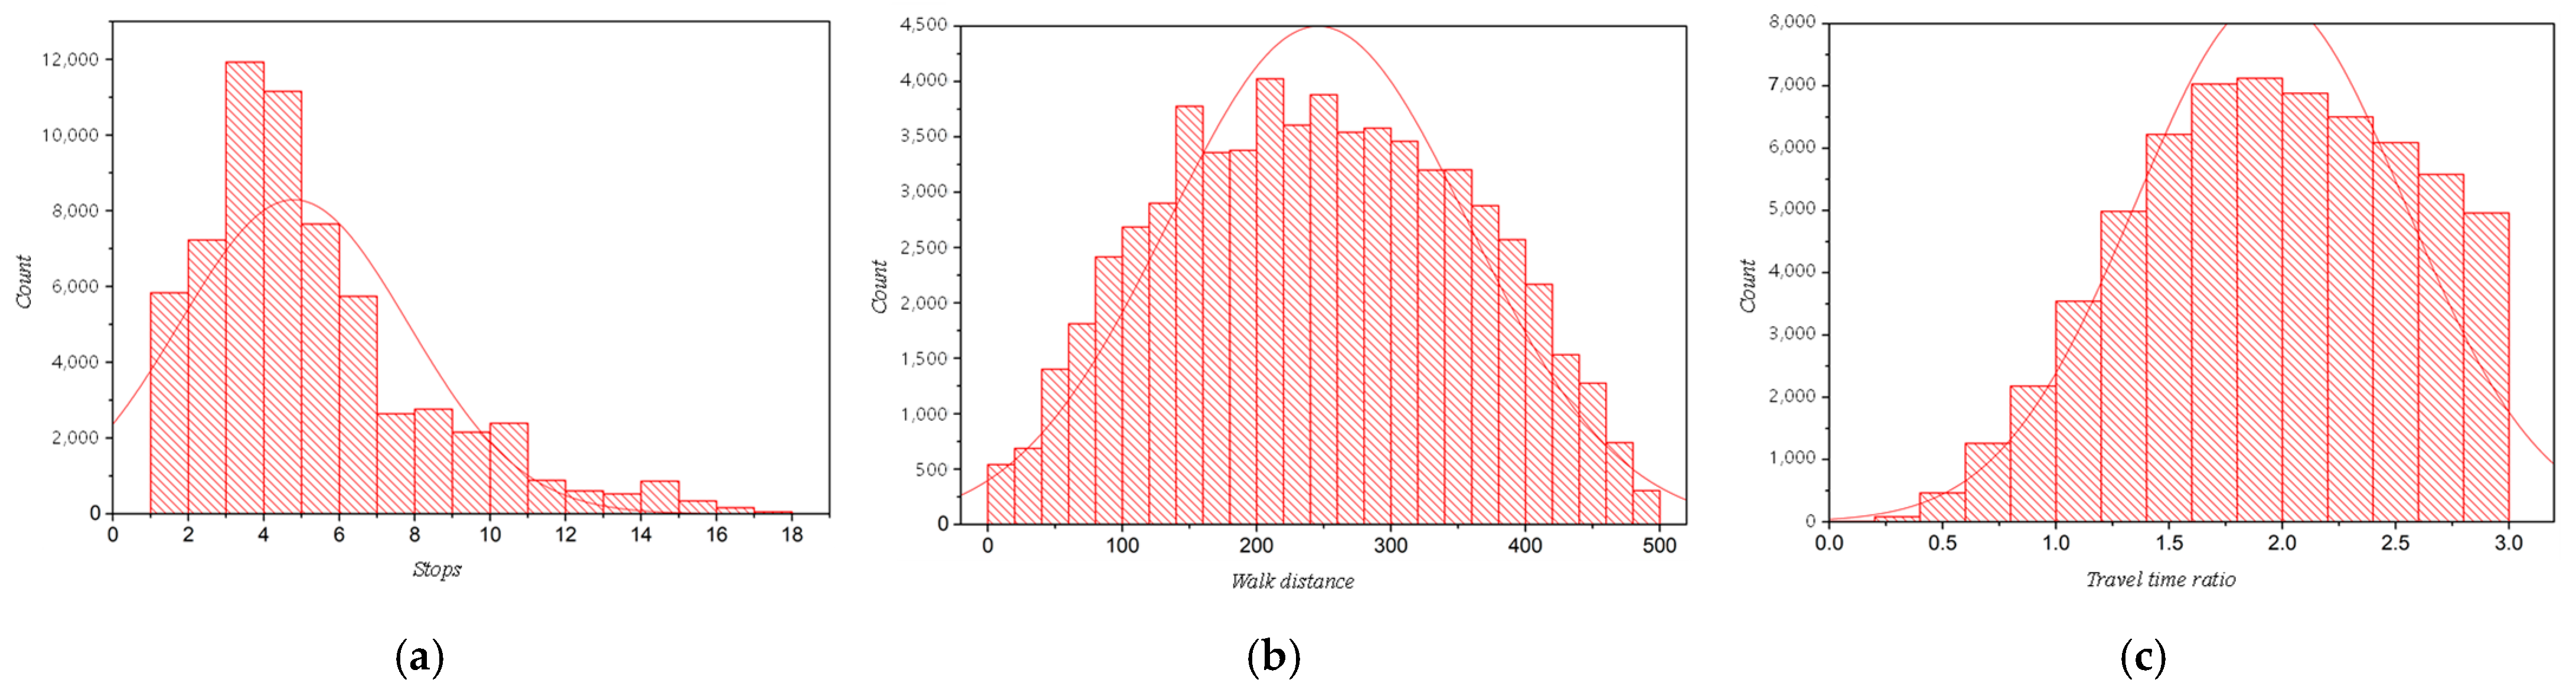
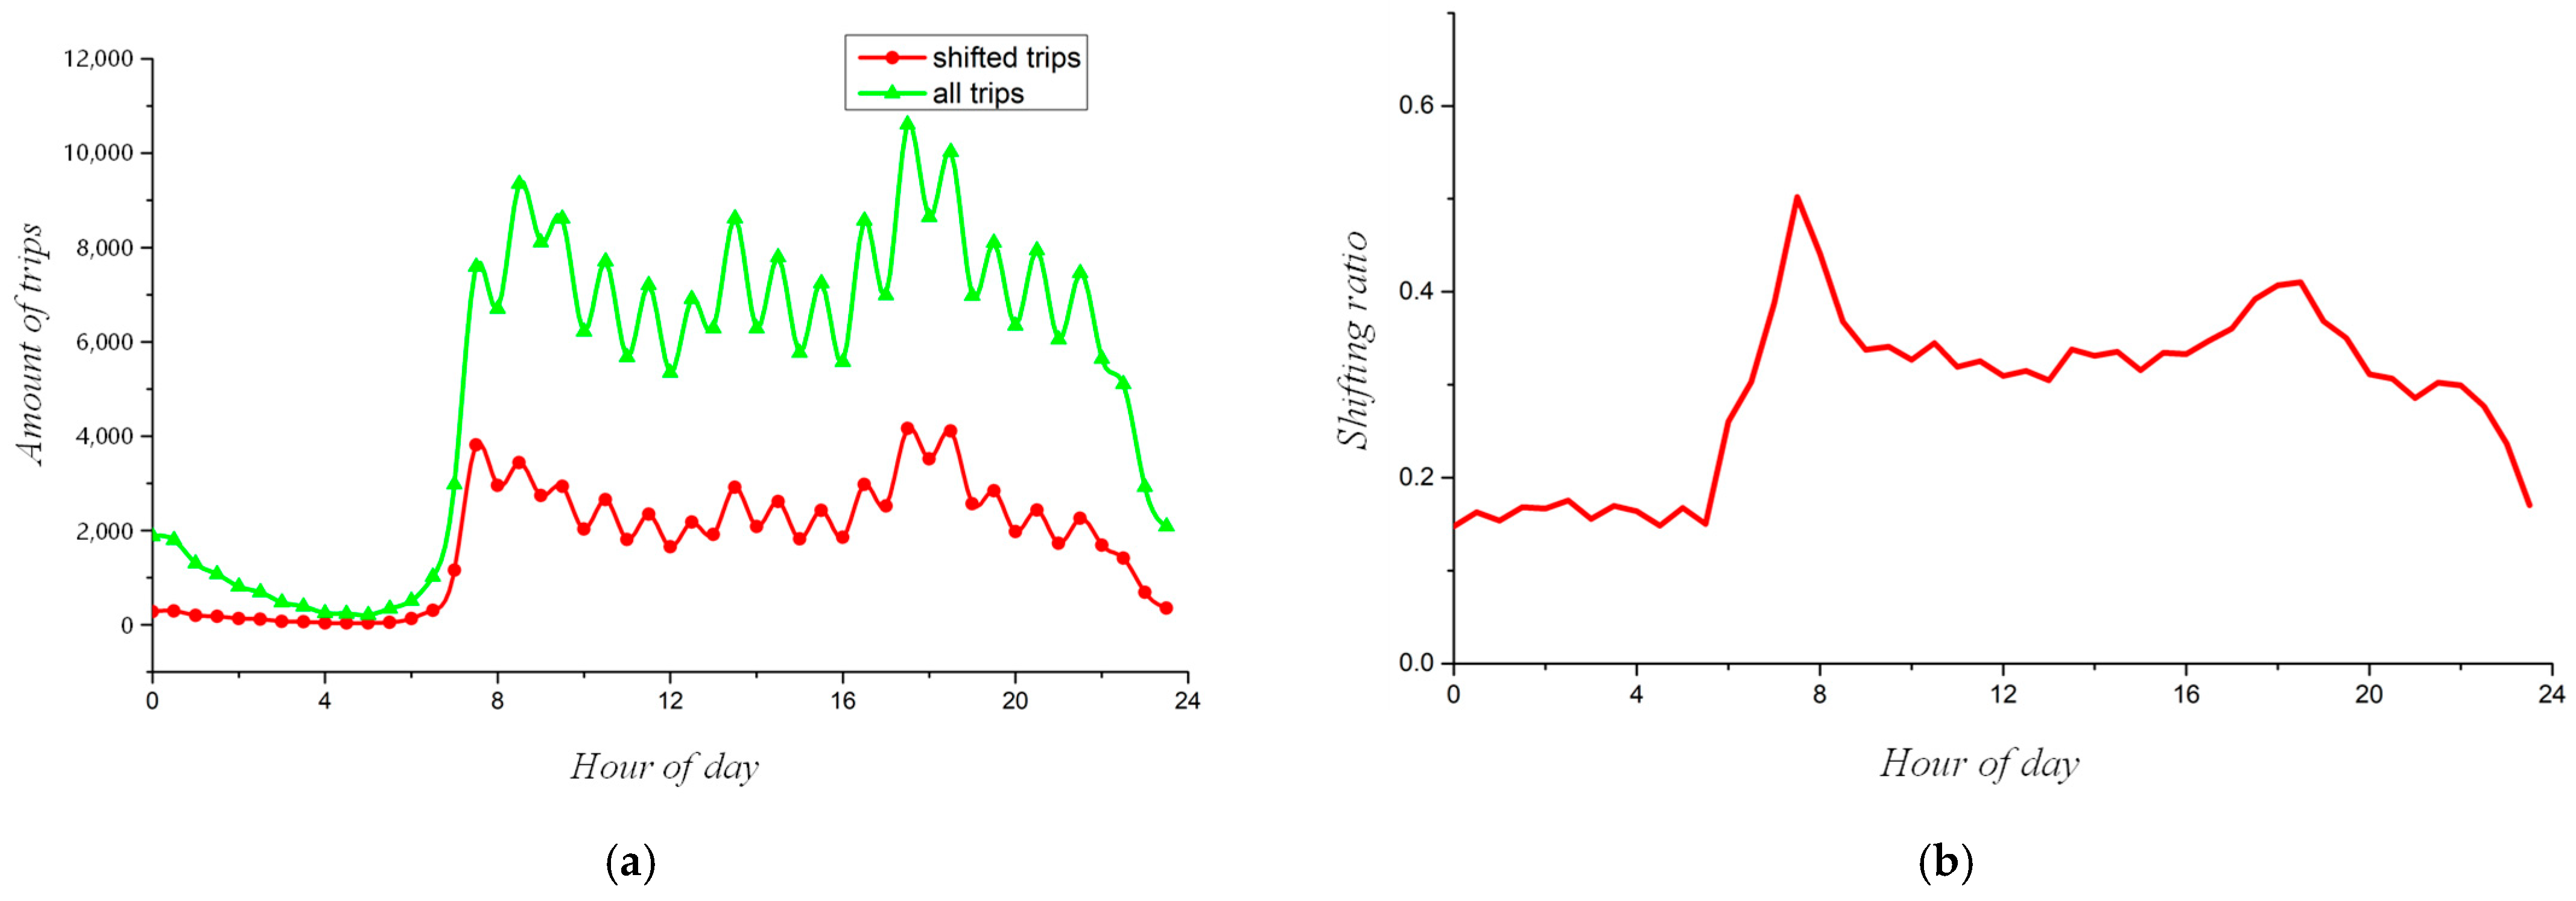
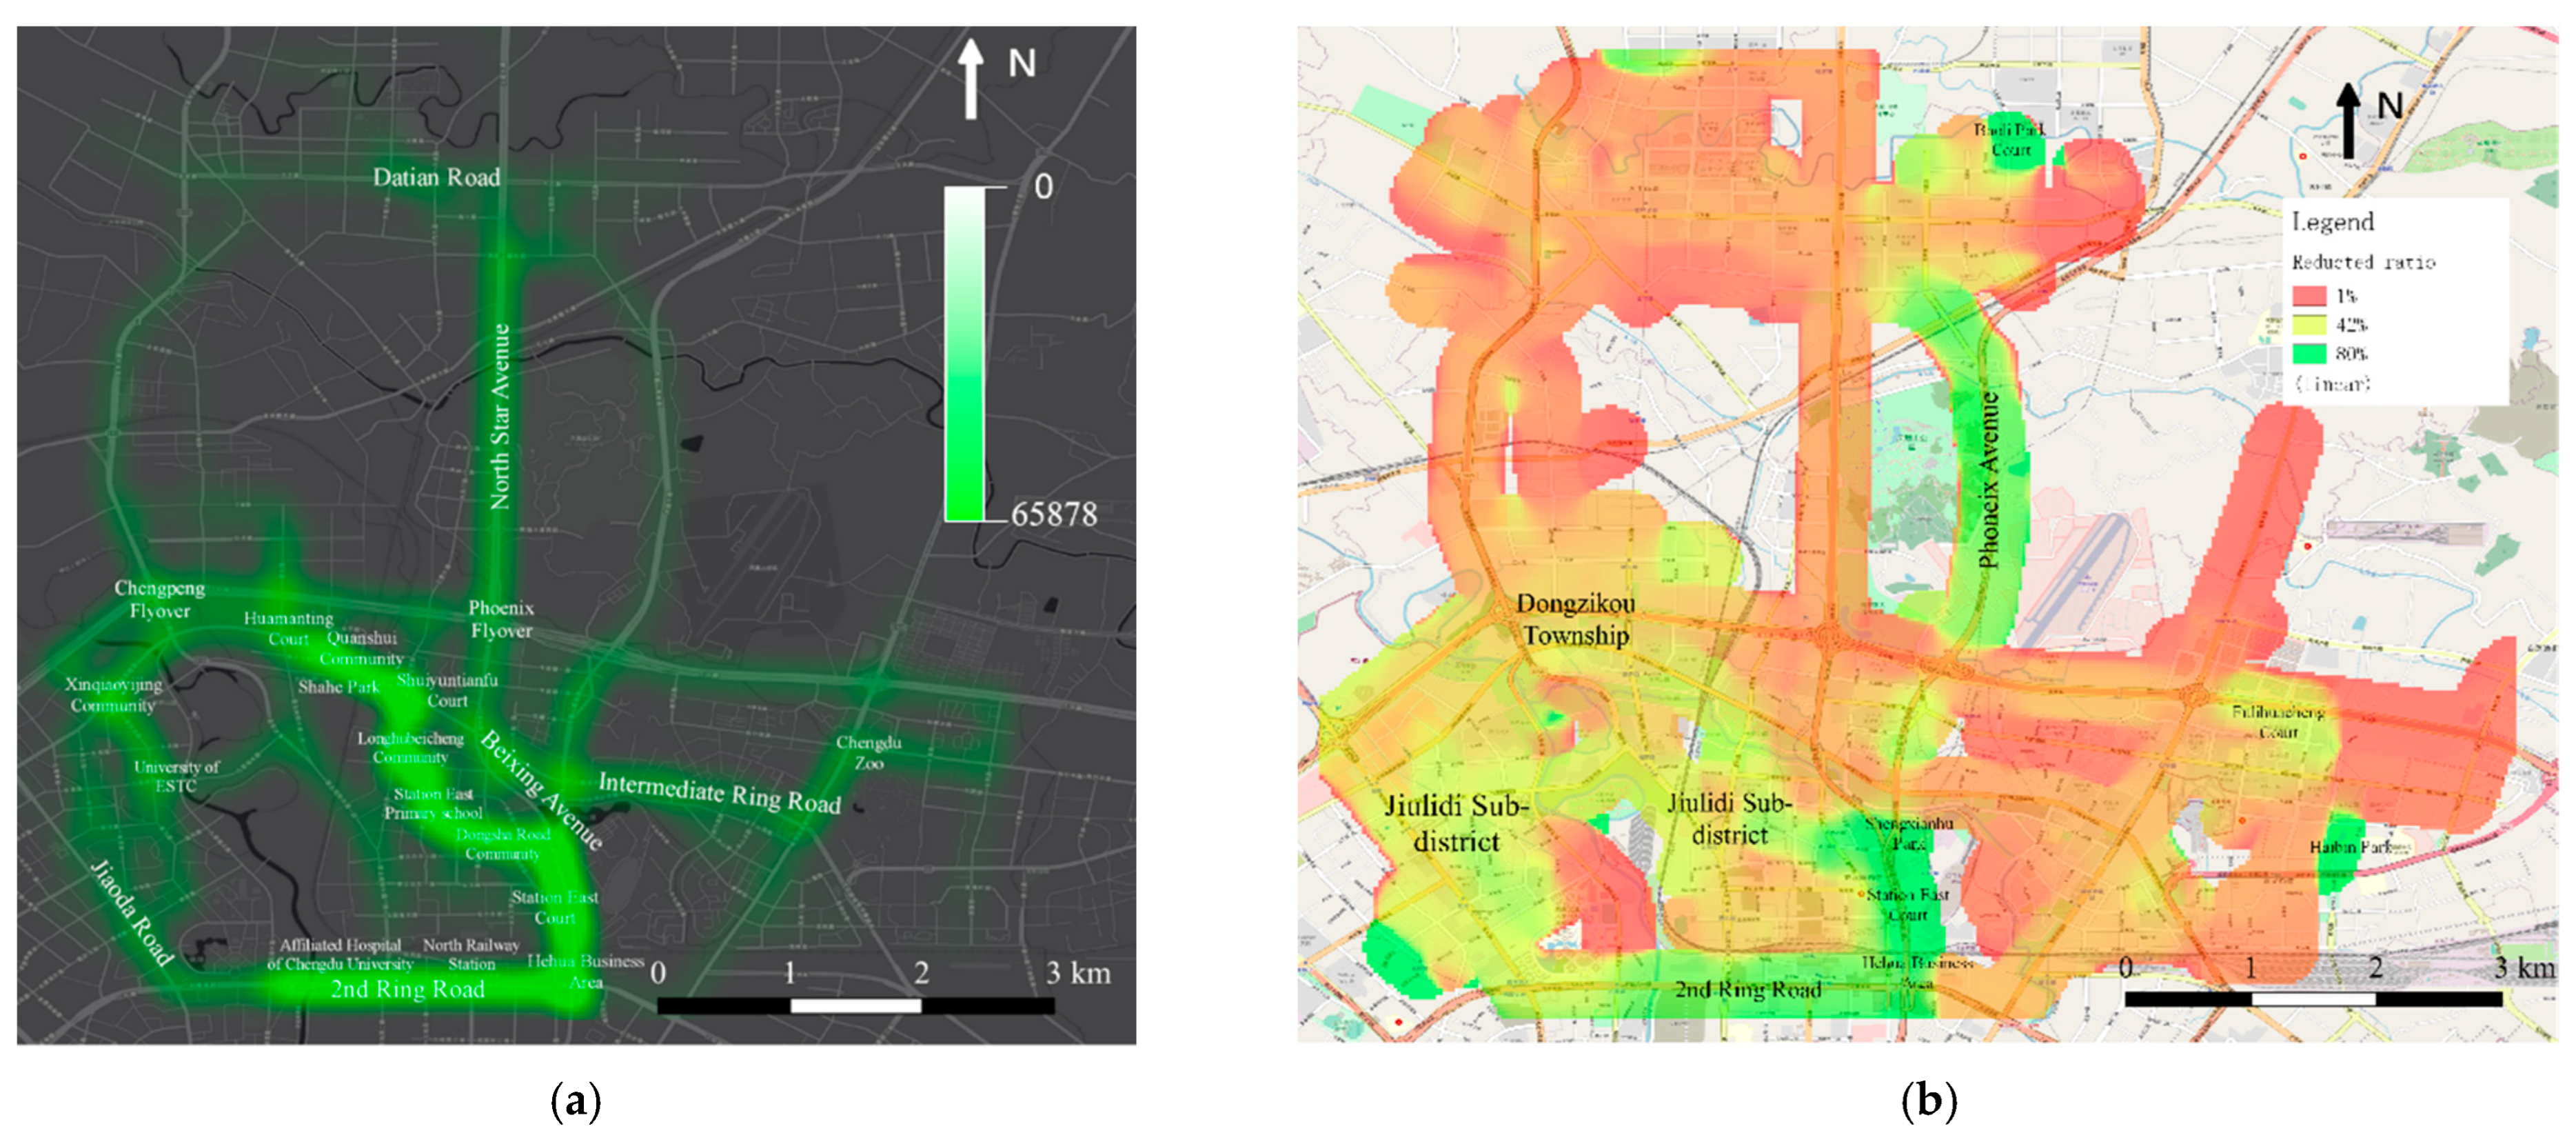
4.2. The Potential Reduction in Traffic Volume
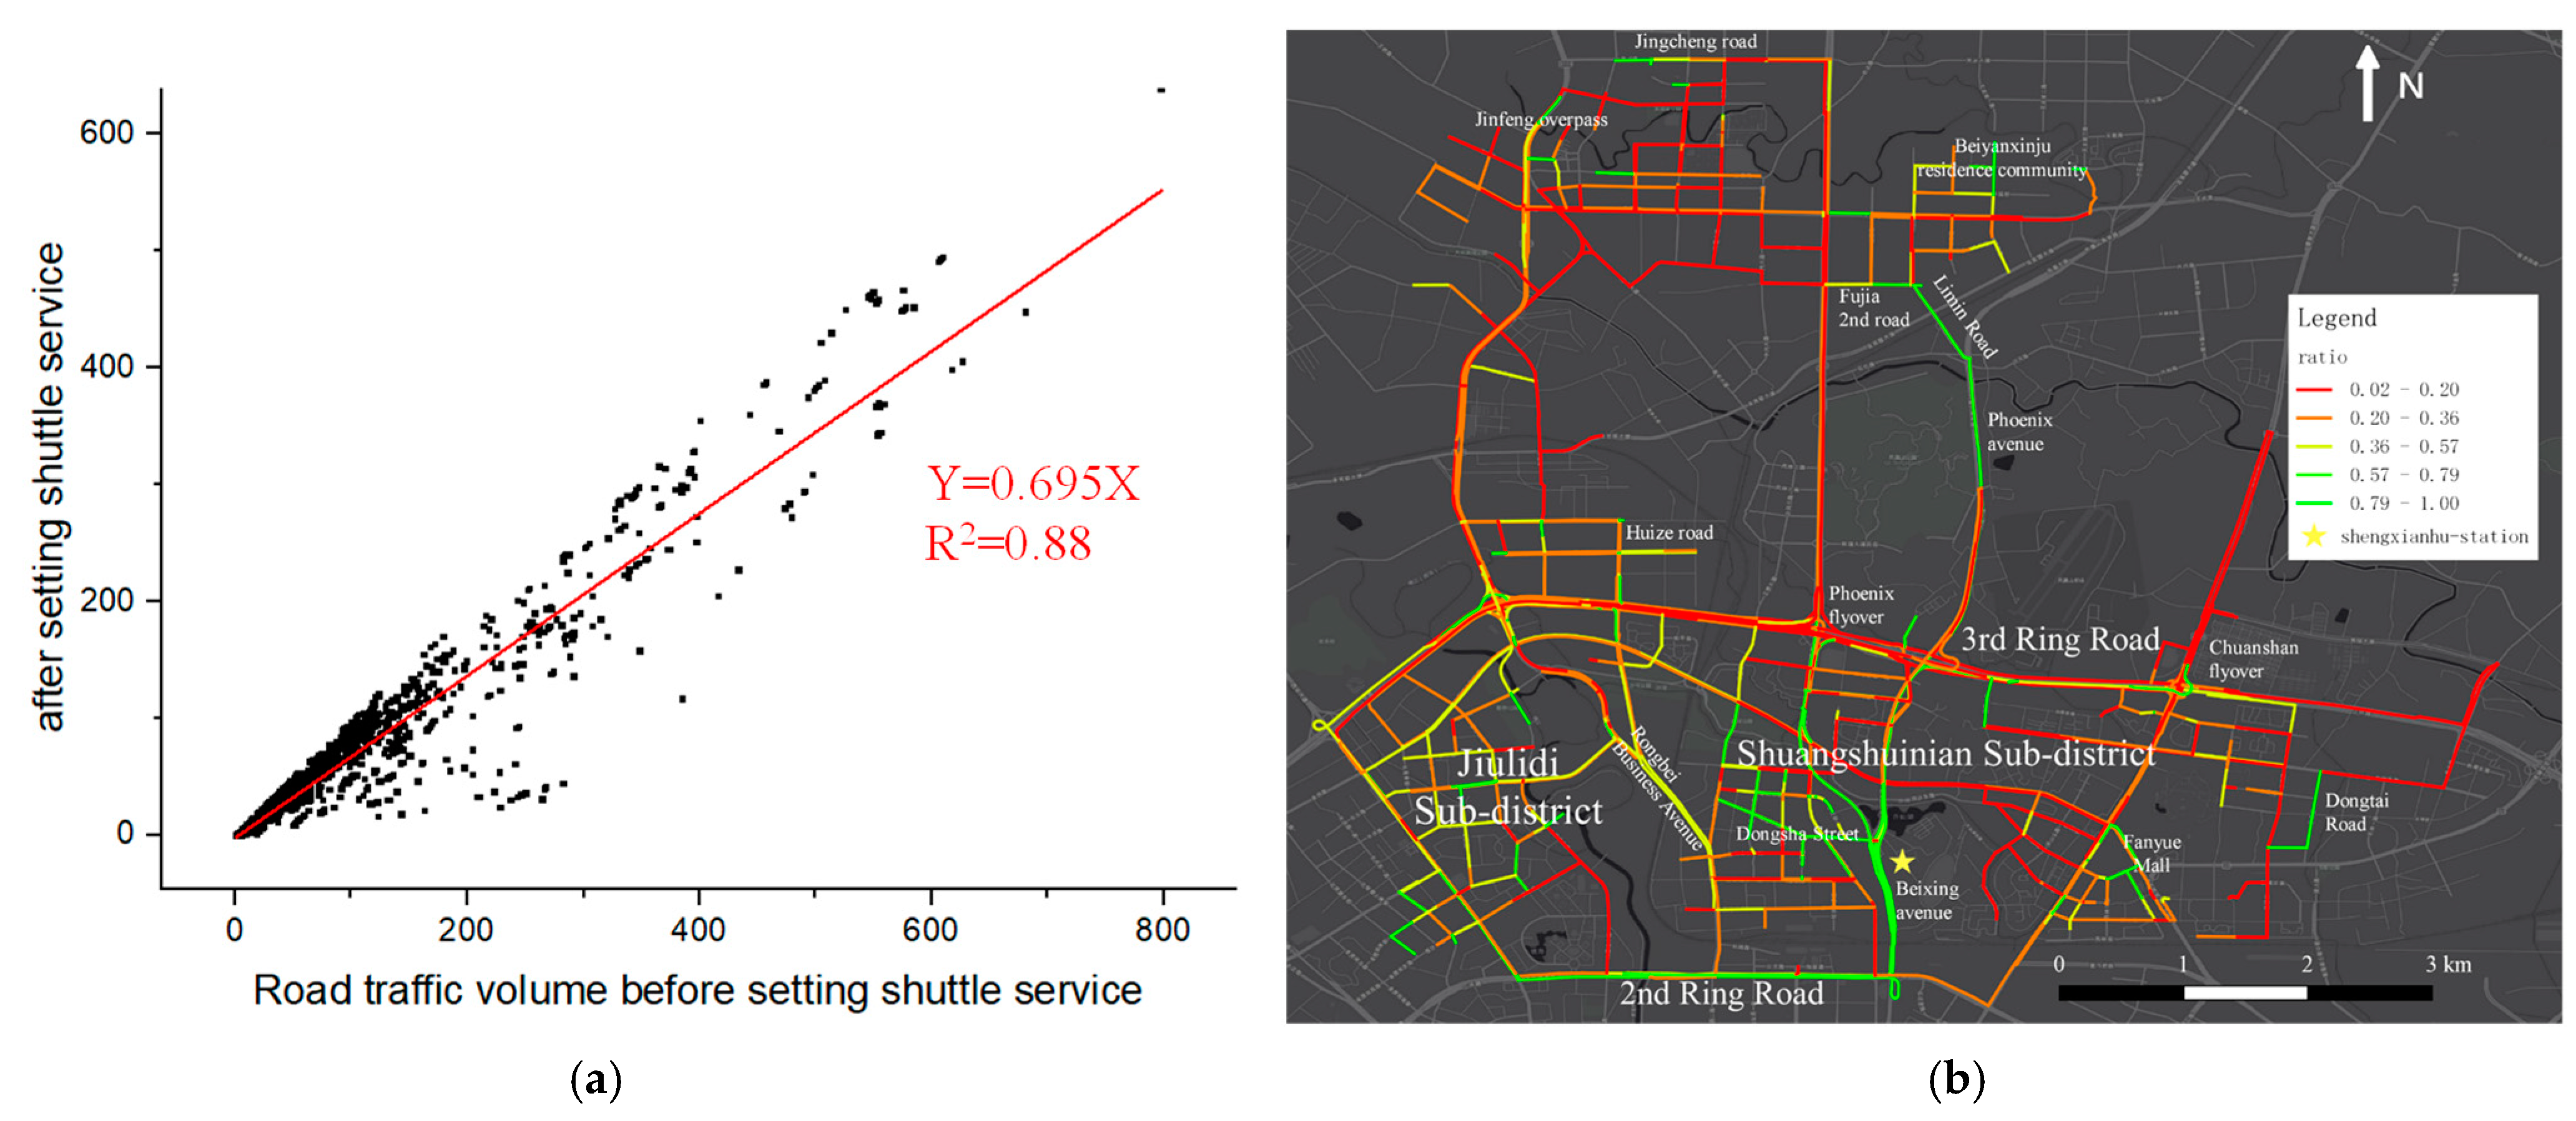
4.3. The Potential Contribution to the Surrounding Environment
5. Discussion
6. Conclusions
Author Contributions
Funding
Institutional Review Board Statement
Informed Consent Statement
Data Availability Statement
Acknowledgments
Conflicts of Interest
References
- St’astna, M.; Vaishar, A.; Stonawska, K. Integrated Transport System of the South-Moravian Region and its impact on rural development. Transp. Res. Part D-Transp. Environ. 2015, 36, 53–64. [Google Scholar] [CrossRef]
- Xiong, J.; Chen, B.; He, Z.; Guan, W.; Chen, Y. Optimal design of community shuttles with an adaptive-operator-selection-based genetic algorithm. Transp. Res. Part C: Emerg. Technol. 2021, 126, 103109. [Google Scholar] [CrossRef]
- Kan, Z.; Tang, L.; Kwan, M.-P.; Zhang, X. Estimating Vehicle Fuel Consumption and Emissions Using GPS Big Data. Int. J. Environ. Res. Public Health 2018, 15, 566. [Google Scholar] [CrossRef] [PubMed] [Green Version]
- Ministry of Ecology and Environment of the People’s Republic of China. China Mobile Source Environmental Management Annual Report; Ministry of Ecology and Environment of the People’s Republic of China: Beijing, China, 2021. [Google Scholar]
- Yan, L.; Luo, X.; Zhu, R.; Santi, P.; Wang, H.; Wang, D.; Zhang, S.; Ratti, C. Quantifying and analyzing traffic emission reductions from ridesharing: A case study of Shanghai. Transp. Res. Part D Transp. Environ. 2020, 89, 102629. [Google Scholar] [CrossRef]
- Xie, C.; Gong, H.; Wang, F. In A solution for the last mile problem of the Beijing rapid transit network: Local shuttle bus system. In Proceedings of the 2010 18th International Conference on Geoinformatics, Beijing, China, 18–20 June 2010; pp. 1–6. [Google Scholar]
- Hulagu, S.; Celikoglu, H.B. A Mixed Integer Linear Programming Formulation for Green Vehicle Routing Problem: Case for Shuttle Services. In Computer Aided Systems Theory, Proceedings of the EUROCAST 2019, Las Palmas de Gran Canaria, Spain, 17–22 February 2019; Moreno-Díaz, R., Pichler, F., Quesada-Arencibia, A., Eds.; Springer International Publishing: Cham, Switzerland, 2020. [Google Scholar]
- Kuan, S.N.; Ong, H.L.; Ng, K.M. Solving the feeder bus network design problem by genetic algorithms and ant colony optimization. Adv. Eng. Softw. 2006, 37, 351–359. [Google Scholar] [CrossRef]
- Mohammed, M.A.; Abd Ghani, M.K.; Hamed, R.I.; Mostafa, S.A.; Ahmad, M.S.; Ibrahim, D.A. Solving vehicle routing problem by using improved genetic algorithm for optimal solution. J. Comput. Sci. 2017, 21, 255–262. [Google Scholar] [CrossRef]
- Tong, L.; Zhou, L.; Liu, J.; Zhou, X. Customized bus service design for jointly optimizing passenger-to-vehicle assignment and vehicle routing. Transp. Res. Part C Emerg. Technol. 2017, 85, 451–475. [Google Scholar] [CrossRef]
- Kong, X.; Li, M.; Tang, T.; Tian, K.; Moreira-Matias, L.; Xia, F. Shared Subway Shuttle Bus Route Planning Based on Transport Data Analytics. IEEE Trans. Autom. Sci. Eng. 2018, 15, 1507–1520. [Google Scholar] [CrossRef]
- Tong, P.; Du, W.; Li, M.; Huang, J.; Wang, W.; Qin, Z. Last-Mile School Shuttle Planning with Crowdsensed Student Trajectories. IEEE Trans. Intell. Transp. Syst. 2021, 22, 293–306. [Google Scholar] [CrossRef]
- Nieuwenhuijsen, M.J.; Khreis, H. Car free cities: Pathway to healthy urban living. Environ. Int. 2016, 94, 251–262. [Google Scholar] [CrossRef]
- Choudhary, A.; Gokhale, S. On-road measurements and modelling of vehicular emissions during traffic interruption and congestion events in an urban traffic corridor. Atmos. Pollut. Res. 2019, 10, 480–492. [Google Scholar] [CrossRef]
- Misra, A.; Roorda, M.J.; MacLean, H.L. An integrated modelling approach to estimate urban traffic emissions. Atmos. Environ. 2013, 73, 81–91. [Google Scholar] [CrossRef] [Green Version]
- Sun, Z.; Hao, P.; Ban, X.; Yang, D. Trajectory-based vehicle energy/emissions estimation for signalized arterials using mobile sensing data. Transp. Res. Part D Transp. Environ. 2015, 34, 27–40. [Google Scholar] [CrossRef]
- Kan, Z.; Tang, L.; Kwan, M.-P.; Ren, C.; Liu, D.; Pei, T.; Liu, Y.; Deng, M.; Li, Q. Fine-grained analysis on fuel-consumption and emission from vehicles trace. J. Clean. Prod. 2018, 203, 340–352. [Google Scholar] [CrossRef]
- Panis, L.I.; Broekx, S.; Liu, R.H. Modelling instantaneous traffic emission and the influence of traffic speed limits. Sci. Total Environ. 2006, 371, 270–285. [Google Scholar] [CrossRef]
- Kumar, P.; Bains, M.S.; Bharadwaj, N.; Arkatkar, S.; Joshi, G. Impact assessment of driver speed limit compliance behavior on macroscopic traffic characteristics under heterogeneous traffic environment. Transp. Lett.-Int. J. Transp. Res. 2020, 12, 54–65. [Google Scholar] [CrossRef]
- Ma, X.; Lei, W.; Chen, H. Environmental Impacts of Road Transport: Emission Modeling for Evaluation of Urban Traffic Controls. In Proceedings of the First International Conference on Sustainable Urbanization (ICSU 2010), Hong Kong, China, 15–17 December 2010; pp. 1563–1571. [Google Scholar]
- Chen, X.; Yuan, Z. Environmentally friendly traffic control strategy-A case study in Xi’an city. J. Clean. Prod. 2020, 249, 119397. [Google Scholar] [CrossRef]
- Mahmod, M.; van Arem, B.; Pueboobpaphan, R.; de Lange, R. Reducing local traffic emissions at urban intersection using ITS countermeasures. Iet Intell. Transp. Syst. 2013, 7, 78–86. [Google Scholar] [CrossRef]
- Jin, S.T.; Kong, H.; Wu, R.; Sui, D.Z. Ridesourcing, the sharing economy, and the future of cities. Cities 2018, 76, 96–104. [Google Scholar] [CrossRef]
- Shaheen, S.; Cohen, A.; Zohdy, I. Shared Mobility: Current Practices and Guiding Principles; Federal Highway Administration: Washington, DC, USA, 2016. [Google Scholar]
- Zhu, J.; Xie, N.; Cai, Z.; Tang, W.; Chen, X. A comprehensive review of shared mobility for sustainable transportation systems. Int. J. Sustain. Transp. 2022, 1–25. [Google Scholar] [CrossRef]
- Hu, S.; Chen, P.; Xin, F.; Xie, C. Exploring the effect of battery capacity on electric vehicle sharing programs using a simulation approach. Transp. Res. Part D Transp. Environ. 2019, 77, 164–177. [Google Scholar] [CrossRef]
- Hu, S.; Chen, P.; Lin, H.; Xie, C.; Chen, X. Promoting carsharing attractiveness and efficiency: An exploratory analysis. Transp. Res. Part D Transp. Environ. 2018, 65, 229–243. [Google Scholar] [CrossRef]
- Yu, B.; Ma, Y.; Xue, M.; Tang, B.; Wang, B.; Yan, J.; Wei, Y.-M. Environmental benefits from ridesharing: A case of Beijing. Appl. Energy 2017, 191, 141–152. [Google Scholar] [CrossRef]
- Yin, B.; Liu, L.; Coulombel, N.; Viguié, V. Appraising the environmental benefits of ride-sharing: The Paris region case study. J. Clean. Prod. 2018, 177, 888–898. [Google Scholar] [CrossRef]
- Fielbaum, A.; Bai, X.; Alonso-Mora, J. On-demand ridesharing with optimized pick-up and drop-off walking locations. Transp. Res. Part C Emerg. Technol. 2021, 126, 103061. [Google Scholar] [CrossRef]
- Ceder, A.; Wilson, N.H.M. Bus network design. Transp. Res. Part B Methodol. 1986, 20, 331–344. [Google Scholar] [CrossRef]
- Guo, X.; Song, R.; He, S.; Bi, M.; Jin, G. Integrated Optimization of Stop Location and Route Design for Community Shuttle Service. Symmetry 2018, 10, 678. [Google Scholar] [CrossRef] [Green Version]
- Kuah, G.K.; Perl, J. The Feeder-bus Network-design Problem. J. Oper. Res. Soc. 1989, 40, 751–767. [Google Scholar] [CrossRef]
- Lúcio Martins, C.; Vaz Pato, M. Search strategies for the feeder bus network design problem. Eur. J. Oper. Res. 1998, 106, 425–440. [Google Scholar] [CrossRef]
- Shrivastav, P.; Dhingra, S.L. Development of feeder routes for suburban railway stations using heuristic approach. J. Transp. Eng.-Asce 2001, 127, 334–341. [Google Scholar] [CrossRef]
- Ibaraki, T.; Imahori, S.; Kubo, M.; Masuda, T.; Uno, T.; Yagiura, M. Effective local search algorithms for routing and scheduling problems with general time-window constraints. Transp. Sci. 2005, 39, 206–232. [Google Scholar] [CrossRef] [Green Version]
- Xiong, J.; Guan, W.; Song, L.; Huang, A.; Shao, C. Optimal Routing Design of a Community Shuttle for Metro Stations. J. Transp. Eng. 2013, 139, 1211–1223. [Google Scholar] [CrossRef]
- Wang, H.; Wen, H.; Yi, F.; Zhu, H.; Sun, L. Road Traffic Anomaly Detection via Collaborative Path Inference from GPS Snippets. Sensors. 2017, 17, 550. [Google Scholar] [CrossRef] [PubMed] [Green Version]
- Wu, W.; Zhou, W.; Lin, Y.; Xie, Y.; Jin, W. A hybrid metaheuristic algorithm for location inventory routing problem with time windows and fuel consumption. Expert Syst. Appl. 2021, 166, 114034. [Google Scholar] [CrossRef]
- Fang, M.; Tang, L.; Kan, Z.; Yang, X.; Pei, T.; Li, Q.; Li, C. An adaptive Origin-Destination flows cluster-detecting method to identify urban mobility trends. arXiv 2021. [Google Scholar] [CrossRef]
- Wang, S.; Noland, R.B. Variation in ride-hailing trips in Chengdu, China. Transp. Res. Part D Transp. Environ. 2021, 90, 102596. [Google Scholar] [CrossRef]
- Ester, M.; Kriegel, H.-P.; Sander, J.; Xu, X. A density-based algorithm for discovering clusters in large spatial databases with noise. In Proceedings of the Second International Conference on Knowledge Discovery and Data Mining, Portland, Oregon, 2–4 August 1996; AAAI Press: Portland, Oregon, 1996; pp. 226–231. [Google Scholar]
- Esri Location-Allocation Analysis. Available online: https://desktop.arcgis.com/en/arcmap/10.3/guide-books/extensions/network-analyst/location-allocation.htm (accessed on 16 November 2022).
- Ciaffi, F.; Cipriani, E.; Petrelli, M. Feeder Bus Network Design Problem: A New Metaheuristic Procedure and Real Size Applications. Procedia-Soc. Behav. Sci. 2012, 54, 798–807. [Google Scholar] [CrossRef]
- Whitley, D. A Genetic Algorithm Tutorial. Stat. Comput. 1994, 4, 65–85. [Google Scholar] [CrossRef]
- Xiong, J.; Chen, B.; Chen, Y.; Jiang, Y.; Lu, Y. Route Network Design of Community Shuttle for Metro Stations through Genetic Algorithm Optimization. IEEE Access 2019, 7, 53812–53822. [Google Scholar] [CrossRef]
- Jiang, S.X.; Guan, W.; Yang, L.; Zhang, W.Y. Feeder Bus Accessibility Modeling and Evaluation. Sustainability 2020, 12, 8942. [Google Scholar] [CrossRef]
- Li, L.; Wang, S.; Li, M.; Tan, J. Comparison of Travel Mode Choice Between Taxi and Subway Regarding Traveling Convenience. Tsinghua Sci. Technol. 2018, 23, 135–144. [Google Scholar] [CrossRef]
- Dijkstra, E.W. A note on two problems in connexion with graphs. Numer. Math. 1959, 1, 269–271. [Google Scholar] [CrossRef] [Green Version]
- Ntziachristos, L.; Samaras, Z.; Eggleston, S.; Gorissen, N.; Hassel, D.; Hickman, A. COPERT III Computer Programme to Calculate Emissions from Road Transport, Methodology and Emission Factors (Version 2.1); European Energy Agency (EEA): Copenhagen, Denmark, 2000. [Google Scholar]
- Xie, S.; Song, X.; Shen, X. Calculating vehicular emission factors with COPERT III mode in China. Environ. Sci. 2006, 27, 415–419. [Google Scholar]
- Shang, J.; Zheng, Y.; Tong, W.; Chang, E.; Yu, Y. Inferring gas consumption and pollution emission of vehicles throughout a city. In Proceedings of the 20th ACM SIGKDD International Conference on Knowledge Discovery and Data Mining, New York, NY, USA, 24–27 August 2014; pp. 1027–1036. [Google Scholar]
- Liu, S.V.; Chen, F.L.; Xue, J.P. Evaluation of Traffic Density Parameters as an Indicator of Vehicle Emission-Related Near-Road Air Pollution: A Case Study with NEXUS Measurement Data on Black Carbon. Int. J. Environ. Res. Public Health 2017, 14, 11. [Google Scholar] [CrossRef] [Green Version]
- Gordon, M.; Staebler, R.M.; Liggio, J.; Li, S.-M.; Wentzell, J.; Lu, G.; Lee, P.; Brook, J.R. Measured and modeled variation in pollutant concentration near roadways. Atmos. Environ. 2012, 57, 138–145. [Google Scholar] [CrossRef]
- Pratt, G.C.; Parson, K.; Shinoda, N.; Lindgren, P.; Dunlap, S.; Yawn, B.; Wollan, P.; Johnson, J. Quantifying traffic exposure. J. Expo. Sci. Environ. Epidemiol. 2014, 24, 290–296. [Google Scholar] [CrossRef] [Green Version]
- Jenks, G.F. The data model concept in statistical mapping. Int. Yearb. Cartogr. 1967, 7, 186–190. [Google Scholar]
- Yu, Q.; Zhang, H.R.; Li, W.F.; Song, X.; Yang, D.Y.; Shibasaki, R. Mobile phone GPS data in urban customized bus: Dynamic line design and emission reduction potentials analysis. J. Clean. Prod. 2020, 272, 122471. [Google Scholar] [CrossRef]


| Order ID | Time-d | Time-a | Longitude-d | Latitude-d | Longitude-a | Latitude-a |
|---|---|---|---|---|---|---|
| eb9dd4095d9850e6287cefd8 | 1477964797 | 1477966507 | 104.0946 | 30.70397 | 104.0893 | 30.65085 |
| 387a742fa5a3fbe4a1f215ac5 | 1477985585 | 1477987675 | 104.0765 | 30.76743 | 104.0637 | 30.58951 |
| 9cf55f8e6e02a1e0f792df06e | 1478004952 | 1478006217 | 104.0197 | 30.68901 | 104.1053 | 30.66395 |
| 5feeae0307e15203484b9ffce | 1477989840 | 1477991065 | 104.0361 | 30.62269 | 104.0439 | 30.68232 |
| Pollutant | a | b | c | d | e |
|---|---|---|---|---|---|
| CO | 71.7 | 35.4 | 11.4 | −0.248 | 0 |
| NOX | 9.29 × 10⁻² | −1.22 × 10⁻² | −1.49 × 10⁻³ | 3.97 × 10⁻⁵ | 6.53 × 10⁻⁶ |
| Hydrocarbon | 5.57 × 10⁻² | 3.65 × 10⁻² | −1.1 × 10⁻³ | −1.88 × 10⁻⁴ | 1.25 × 10⁻⁵ |
| Fuel Consumption (FC) | 217 | 9.6 × 10⁻² | 0.253 | −4.21 × 10⁻⁴ | 9.65 × 10⁻³ |
| Average | STD | Cover Percentage | |
|---|---|---|---|
| Generated shuttle stops (Our method) | 68.12 | 57.43 | 78.09% |
| Selected from Bus stops | 45.97 | 64.06 | 47.89% |
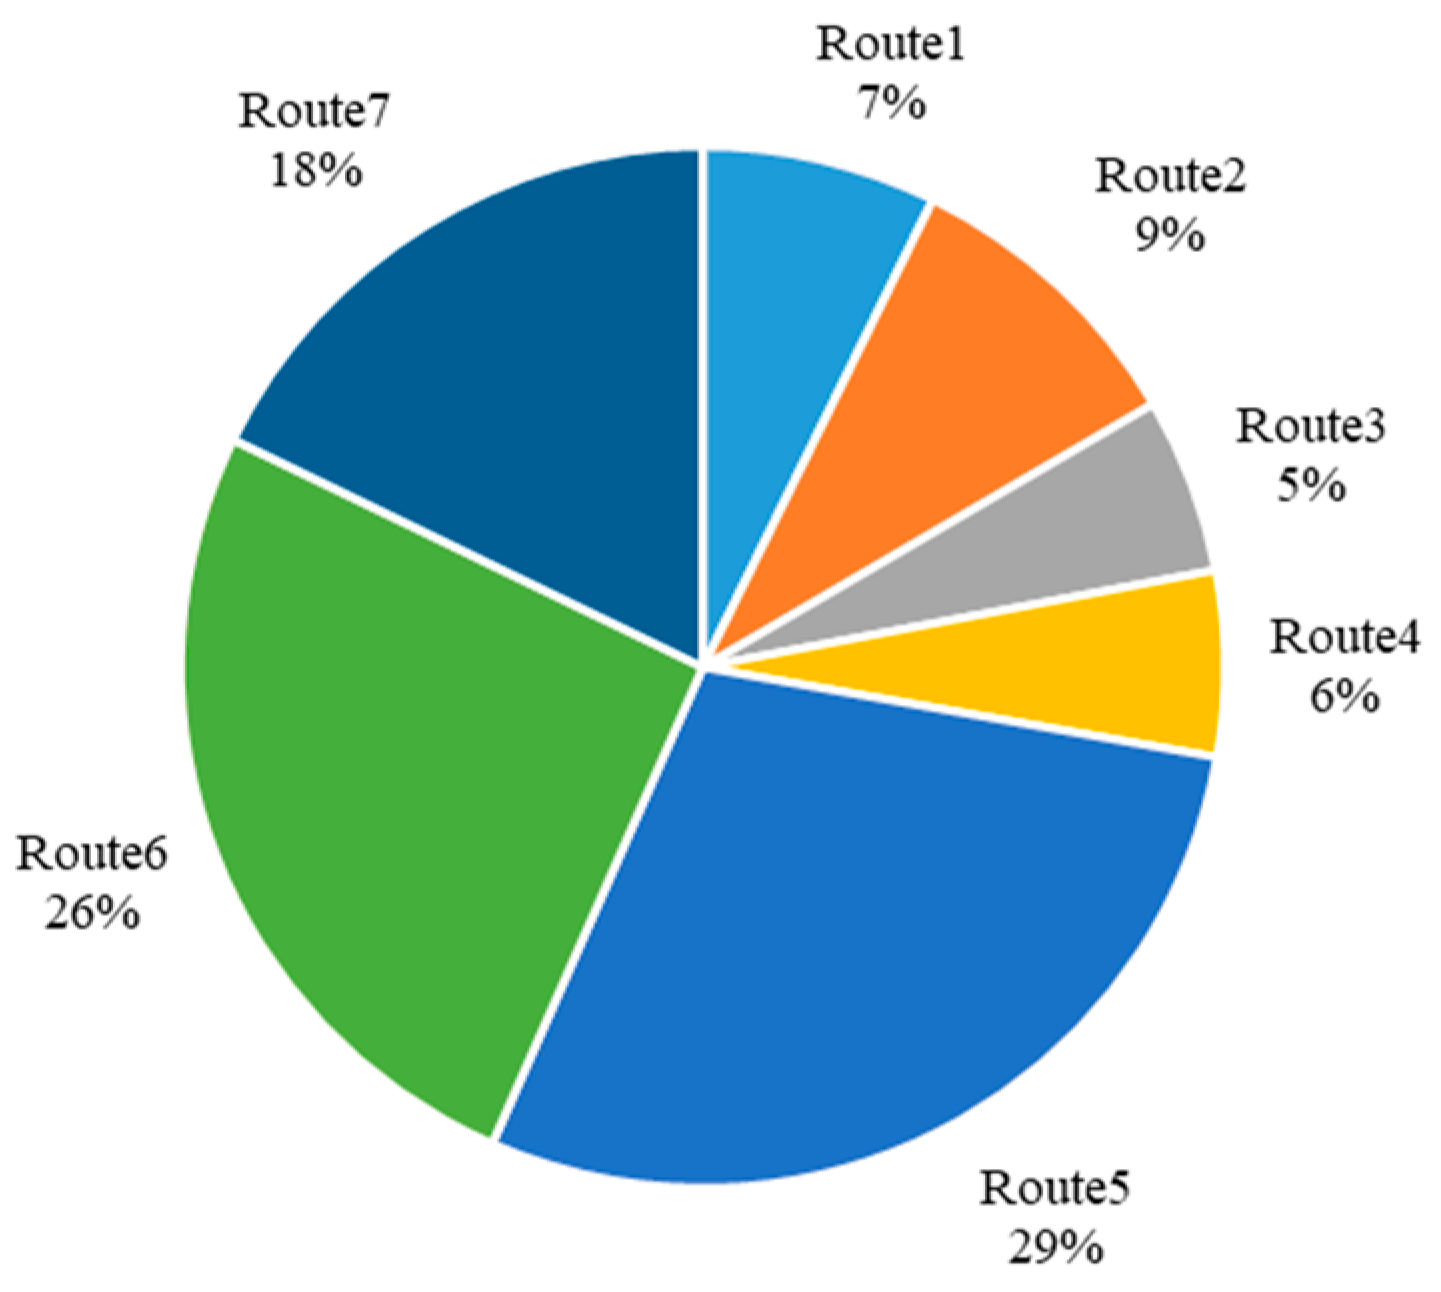
| ID | Number of Stops | Route Length (km) | Main Service Regions |
|---|---|---|---|
| 1 | 15 | 29.83 | Dafeng Subdistrict |
| 2 | 11 | 26.63 | Dafeng, Jiulidi Subdistrict |
| 3 | 7 | 27.96 | Tianhui Township, Shuangshuinian Subdistrict |
| 4 | 16 | 28.95 | Qinglong Subdistrict |
| 5 | 19 | 27.32 | Shuangshuinian, Jiulidi Subdistrict |
| 6 | 19 | 27.85 | Shuangshuinian, Bailianchi Subdistrict |
| 7 | 10 | 18.99 | Dongzikou Township |
| Item | Total Amount | Reduced Amount | Reduced Ratio |
|---|---|---|---|
| Cumulative Distance | 27,938 km | 7825 km | 28.01% |
| CO | 13.762 kg | 3.854 kg | |
| NOx | 2.255 kg | 0.632 kg | |
| CO2 | 5919.51 kg | 1657.95 kg | |
| Hydrocarbon | 0.49 kg | 0.138 kg |
Publisher’s Note: MDPI stays neutral with regard to jurisdictional claims in published maps and institutional affiliations. |
© 2022 by the authors. Licensee MDPI, Basel, Switzerland. This article is an open access article distributed under the terms and conditions of the Creative Commons Attribution (CC BY) license (https://creativecommons.org/licenses/by/4.0/).
Share and Cite
Zhao, Z.; Fang, M.; Tang, L.; Yang, X.; Kan, Z.; Li, Q. The Impact of Community Shuttle Services on Traffic and Traffic-Related Air Pollution. Int. J. Environ. Res. Public Health 2022, 19, 15128. https://doi.org/10.3390/ijerph192215128
Zhao Z, Fang M, Tang L, Yang X, Kan Z, Li Q. The Impact of Community Shuttle Services on Traffic and Traffic-Related Air Pollution. International Journal of Environmental Research and Public Health. 2022; 19(22):15128. https://doi.org/10.3390/ijerph192215128
Chicago/Turabian StyleZhao, Zilong, Mengyuan Fang, Luliang Tang, Xue Yang, Zihan Kan, and Qingquan Li. 2022. "The Impact of Community Shuttle Services on Traffic and Traffic-Related Air Pollution" International Journal of Environmental Research and Public Health 19, no. 22: 15128. https://doi.org/10.3390/ijerph192215128
APA StyleZhao, Z., Fang, M., Tang, L., Yang, X., Kan, Z., & Li, Q. (2022). The Impact of Community Shuttle Services on Traffic and Traffic-Related Air Pollution. International Journal of Environmental Research and Public Health, 19(22), 15128. https://doi.org/10.3390/ijerph192215128