Article

Variation in Road Dust Heavy Metal Concentration, Pollution, and Health Risk with Distance from the Factories in a City–Industry Integration Area, China

1
Key Research Institute of Yellow River Civilization and Sustainable Development & Collaborative Innovation Center on Yellow River Civilization Jointly Built by Henan Province and Ministry of Education, Henan University, Kaifeng 475001, China
2
College of Resources and Environment, Henan Agricultural University, Zhengzhou 450018, China
3
School of Environmental and Chemical Engineering, Shanghai University, Shanghai 200444, China
4
The College of Environment and Planning, Henan University, Kaifeng 475001, China
*
Author to whom correspondence should be addressed.
Int. J. Environ. Res. Public Health 2022, 19(21), 14562; https://doi.org/10.3390/ijerph192114562
Submission received: 24 September 2022 / Revised: 27 October 2022 / Accepted: 28 October 2022 / Published: 6 November 2022

Abstract

:
Road dust samples around three typical factories, F1, F2, and F3, in the National Zhengzhou Economic and Technology Development Zone (ZETZ), China, were collected to study the variation in heavy metal concentration (As, Cd, Cr, Cu, Hg, Ni, Pb, and Zn), pollution, and health risk with distance from the factories. The results indicated that the concentrations of all the elements near F1 were higher than near both F2 and F3. Apart from Co, Mn, and Cu in some dust samples, all the element concentrations were higher than the corresponding background values (BCs), to varying degrees. The spatial distributions of the heavy metals surrounding the factories followed the normal distribution. The peak values of element concentrations occurred at 300~400 m away from the factories, except for Hg, which continued increasing more than 500 m away from the factories. The fluctuation curves of the pollution load index value calculated according to the BCs for F1, F2, and F3 all had two peaks, a “small peak” and a “large peak”, appearing at about 30 m and 300 m, respectively. For the hazard index and the total carcinogenic risk, the peak values all appeared at 400 m, with the curves following the normal distribution. Exposure to road dust containing non-carcinogenic and carcinogenic elements around F1 was greater than around F2 or F3. In conclusion, our results provide a reference for pursuing effective prevention of dust heavy metal pollution around modern manufacturing factories.

1. Introduction

Road dust refers to solid particles on the road surface with a particle size of less than 20 mesh (<0.92 mm) [1]. These can adsorb more heavy metal pollutants due to their large specific surface area, making them sensitive to pollution sources [2,3,4]. A large number of studies [5,6] have shown that, owing to human activities, the concentration of heavy metals in road dust far exceeds original levels, thereby leading to potential health risks for local people through inhalation, ingestion, and dermal contact [7,8]. Especially in densely populated cities, more people are at risk of exposure to road dust heavy metals [9,10]. For these reasons, studies of the variation in road dust heavy metal distribution, pollution, and health risk with distance from factories could contribute greatly to the assessment of public health.
City–industry integration, which requires the spatial integration of industry and urban functions, has been an important development pathway for new-type urbanization in China in recent years [11]. In the past 10–20 y, urbanization and industrialization in these areas have developed at an unprecedented rate. Previous studies demonstrate that industrial activities always lead to a significant increase in the concentrations of heavy metals in dust [12,13]. Consequently, humans who live and work in the city–industry integration areas, specifically near the factories, may have more potential health risks due to high heavy metal exposure currently and in the future. Existing studies to determine and monitor urban road dust heavy metal pollution levels have been focused on functional areas such as bus stations or parks [14,15], while the studies on the spatial variation of heavy metal concentrations have been focused on the areas around high pollution factories far away from residential areas [12,16]. There have been few studies focusing on the dust heavy metal contamination caused by the modern high-tech manufacturing factories, especially those located in the typical city–industry integration areas with dense populations. Therefore, in this study, the concentrations, diffusion range, and health risks of heavy metals in the dust around such factories were investigated.
The National Zhengzhou Economic and Technology Development Zone (ZETZ), as one of the typical city–industry integration areas, was taken as the study area. Road dust samples were collected from three typical factories, the electrical component manufacturing factory (F1), the automobile production and parts manufacturing factory (F2), and the equipment manufacturing factory (F3) [17]. The objectives of the study were (1) to determine the dust heavy metal concentrations and their distribution, including As, Cd, Co, Cr, Cu, Hg, Mn, Ni, Pb, and Zn; (2) to explore the degree of pollution with heavy metals in road dust by calculating the pollution load index (PLI), and measuring its spatial distribution; and (3) to investigate the non-carcinogenic and carcinogenic health risks posed to humans, and their spatial distribution characteristics, by applying the United States Environmental Protection Agency (USEPA) health risk assessment model.

2. Materials and Methods

2.1. Study Area

The ZETZ, founded in 1993, is located in the southeast suburbs of Zhengzhou city, Henan Province. It occupies an area of approximately 158.7 km2, with a permanent resident population of about 342,600. It has a temperate monsoon climate, with a mean annual temperature of 14.3 °C and mean annual rainfall of 640.5 mm, and is mainly covered by the alluvial deposits of the Yellow River (Figure 1).

2.2. Sample Collection

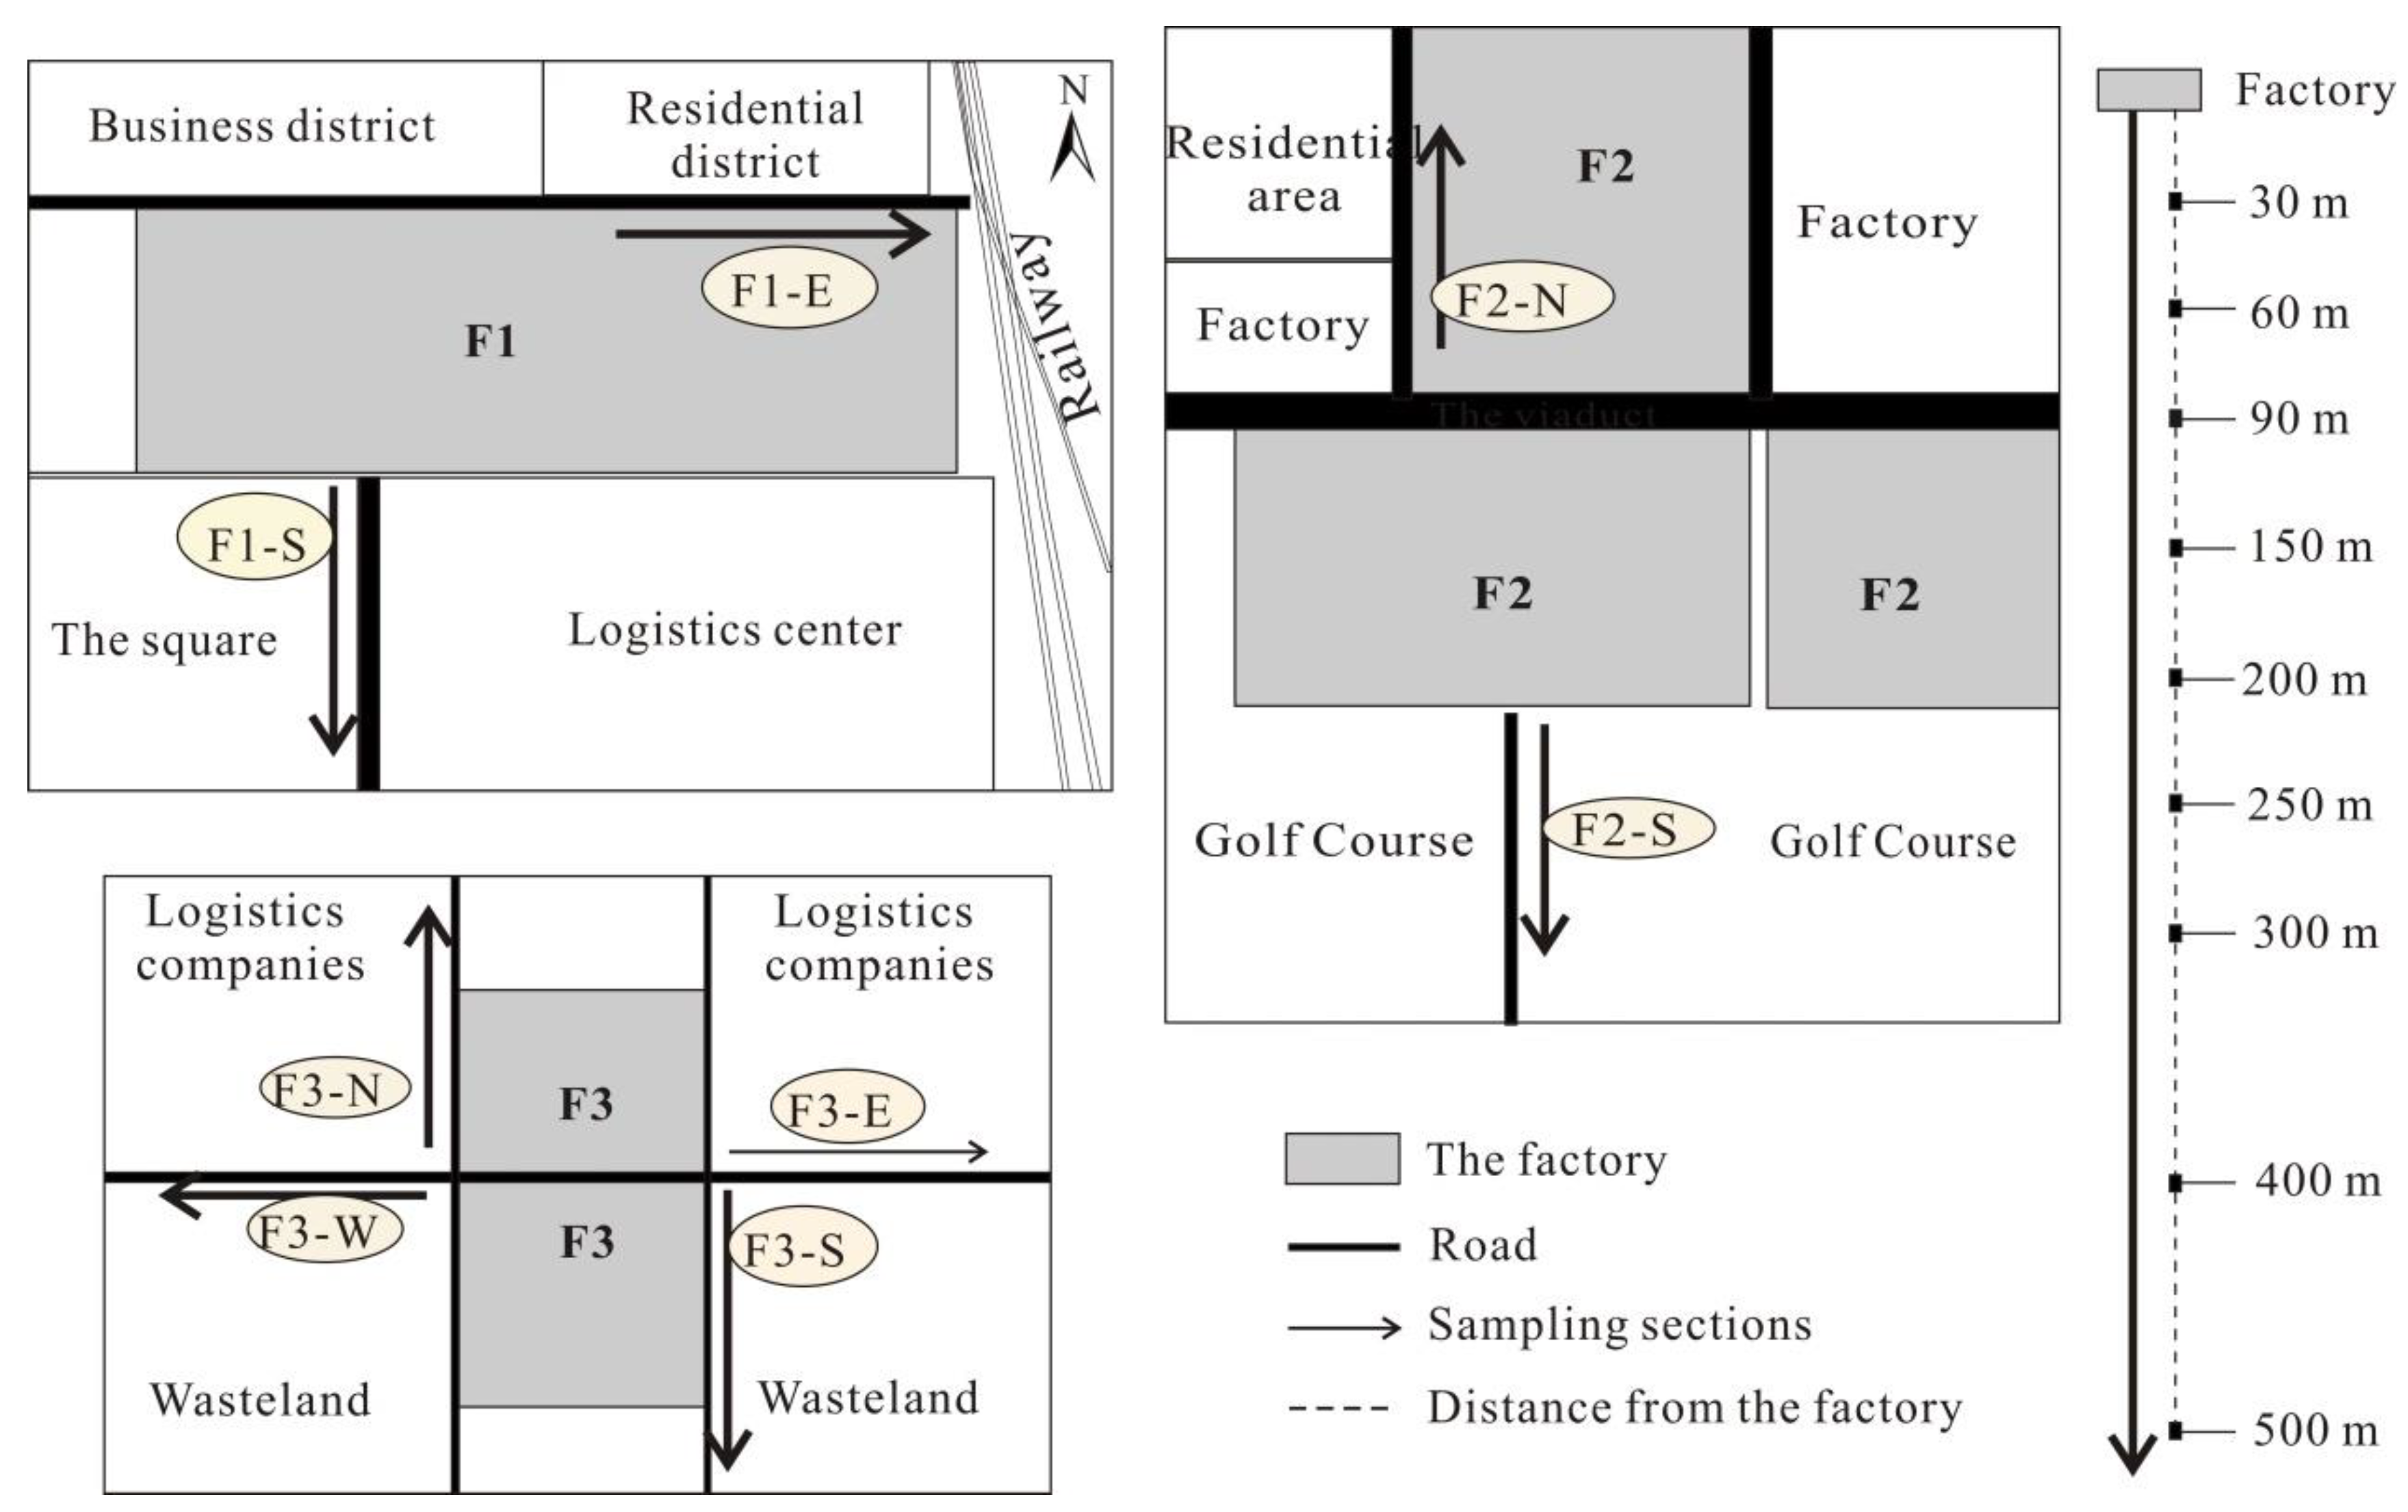
In this study, dust samples were collected from the areas surrounding F1, F2, and F3. Nine dust samples were collected in each direction, at distances of 0–30 m, 30–60 m, 60–90 m, 90–150 m, 150–200 m, 200–250 m, 250–300 m, 300–400 m, and 400–500 m from the factory (Figure 2). Sampling points should have been arranged according to the dominant local wind direction, but due to the restrictions regarding the factory surroundings, listed in Table S1, the number and direction of the sampling transects for each factory were different. Even so, when sampling, we ensured that the road section was completely covered in every sampling point, to try to make it more representative.
A total of 78 road dust samples were collected from the three factories, comprising 18 samples from F1, 18 samples from F2, and 36 samples from F3. All the samples were collected from the surrounding asphalt road using plastic brushes and plastic crucibles, then stored in labeled polyethylene bags until analyzed in the laboratory.
Thirty control soil samples were also collected from eastern virgin regions located more than 3 kilometres from the study area. The mean content of each element was calculated to produce their corresponding background values (BCs). Details of that calculation can be found in the article by Chen et al. [15].

2.3. Sample Preparation and Heavy Metal Analysis

Road dust samples were air-dried and then filtered to remove large and thick contaminants such as cigarette butts, leaves, and rocks. The samples were then manually ground by agate mortar and pestle, passed through a nylon sieve of 0.149 mm, and stored in closed polyethylene bags before chemical assay.
For the determination of Cd, Co, Cr, Cu, Mn, Ni, Pb, and Zn concentrations, 0.1000 g samples were weighed, placed into PVC digestion vessels, and digested in an automatic graphite digestion instrument (ST-60, Polytech, Beijing, China) with a mixture solution of concentrated HNO3-HF-HClO4 [18,19]. The concentrations of the target heavy metals in the dust sample were determined by inductively coupled plasma mass spectrometry (ICP-MS; X-Series II Model, Thermo Fisher Scientific, America) and inductively coupled plasma atomic emission spectrometry (ICP/AES; ICPS-7500, Shimadzu, Japan).
To determine the concentrations of As and Hg, 0.2000 g of sample was placed into a 25 mL colorimetric tube, digested in a water bath with a mixture solution of aqua regia [20,21], and analyzed by atomic fluorescence spectrometry (AFS 830, Titan, China).

2.4. Quality Assurance and Quality Control

In the course of the experiment, in order to completely remove the residual heavy metal ions from the experimental equipment, the Teflon digestion tank and all the glass laboratory equipment were immersed in 20% and 10% nitric acid for more than 24 h, respectively, then washed with deionized water 3 times.
Two procedural blanks, two standard reference materials (GBW-07405 for soils, National Research Center for Standards, China), and at least 10% parallel samples were included with each batch. The procedural blanks for all analyses were below the method detection limit (MDL). The recoveries of the elements ranged from 88.06% to 109.47%.

2.5. Heavy Metal Pollution Assessment

Potential load index (PLI) was used to evaluate the dust heavy metal pollution [22]. The function can be formulated as follows:
CF i = c i c n
PLI = CF 1 × CF 2 × × CF n n
where CFi is the pollution index of heavy metal i, ci (mg·kg−1) is the concentration of element i in dust samples, and cn is the background value of heavy metal i. BCs and China’s tidal soil background value were used for evaluation in this study. Because there lacked the level of “slight pollution” [22], the classification standards of CF and PLI were adjusted as: no pollution (CF/PLI ≤ 1), slight pollution (1 < CF/PLI ≤ 2), moderate contamination (2 < CF ≤ 3), and heavy pollution (PLI ≥ 3) [23].

2.6. Health Risk Assessment Model

The health risk assessment model was developed by the USEPA [8] to quantify human health risks (carcinogenic and non-carcinogenic). People were exposed to road dust by three main pathways: ingestion, inhalation, and dermal contact. The estimation of exposure dose for the three pathways was calculated using the following equations:
A D D ing = c · Ing R · C F · E F · E D B W · A T
A D D inh = c · Inh R · E F · E D P E F · B W · A T
A D D dermal = c · S A · C F · S L · A B S · E F · E D B W · A T
The potential non-cancer risk was assessed using the hazard quotient (HQ) and the hazard Index (HI), calculated in Equations (6) and (7), and the total carcinogenic risk (TCR) was calculated using Equations (8) and (9):
H Q i = j = 1 3 A D D i j R f D i j
H I = i = 1 9 H Q i
R i s k i j = A D D i j × S F i j
T C R = i j 3 R i s k i j
where RfD is the reference dose and SF is the cancer slope factor. Definitions of the abbreviations, units, and values of each parameter in the formulas are also presented in Table S2 [7,8,24,25,26,27,28,29].

3. Results

3.1. Characteristics of Dust Heavy Metal Concentrations

The heavy metal concentrations in road dust around the typical factories of ZETZ are presented in Table 1. The average concentrations of As, Cd, Co, Cr, Cu, Hg, Mn, Ni, Pb, and Zn were 6.65, 0.52, 5.74, 41.78, 18.31, 0.034, 371.72, 19.65, 41.62, and 117.13 mg·kg−1, which were 1.64, 1.85, 0.74, 1.46, 1.54, 0.92, 1.18, 1.64, 2.74, and 3.59 times the BCs, respectively. Apart from Co and Hg, all the other heavy metals were accumulated in higher concentrations than the BCs. In addition, compared with previous studies, the average road dust heavy metal concentrations in ZETZ was lower than those in big cities such as Beijing [30], Shanghai [31], and Guangzhou [32]. This indicates that although the heavy metal concentrations in road dust were likely affected by the local human activities, their accumulation was not severe.
The average total dust heavy metal concentrations near the three factories followed the order F1 (740.72 mg·kg−1) > F3 (590.55 mg·kg−1) > F2 (570.85 mg·kg−1). For F1, concentrations of As, Co, Cr, Cu, Ni, Pb, and Zn were higher than for both F2 and F3. Cd and Mn concentrations were higher than F2, but lower than F3, whereas Hg was lower than F2, but higher than F3. For all three factories, most of the studied element concentrations in road dust were higher than the BCs. Pb and Zn were the most accumulated elements, especially near F1, where they were 4.26 and 5.33 times higher than the BCs, respectively. Those near F2 and F3 were 1.98 and 2.73 times higher than the BCs, respectively. The high concentrations of heavy metals in road dust around the factories were most likely due to the increase in industrialization and vehicular emissions [33,34].

3.2. Spatial Distribution of Dust Heavy Metal Concentrations with Distance from the Three Factories

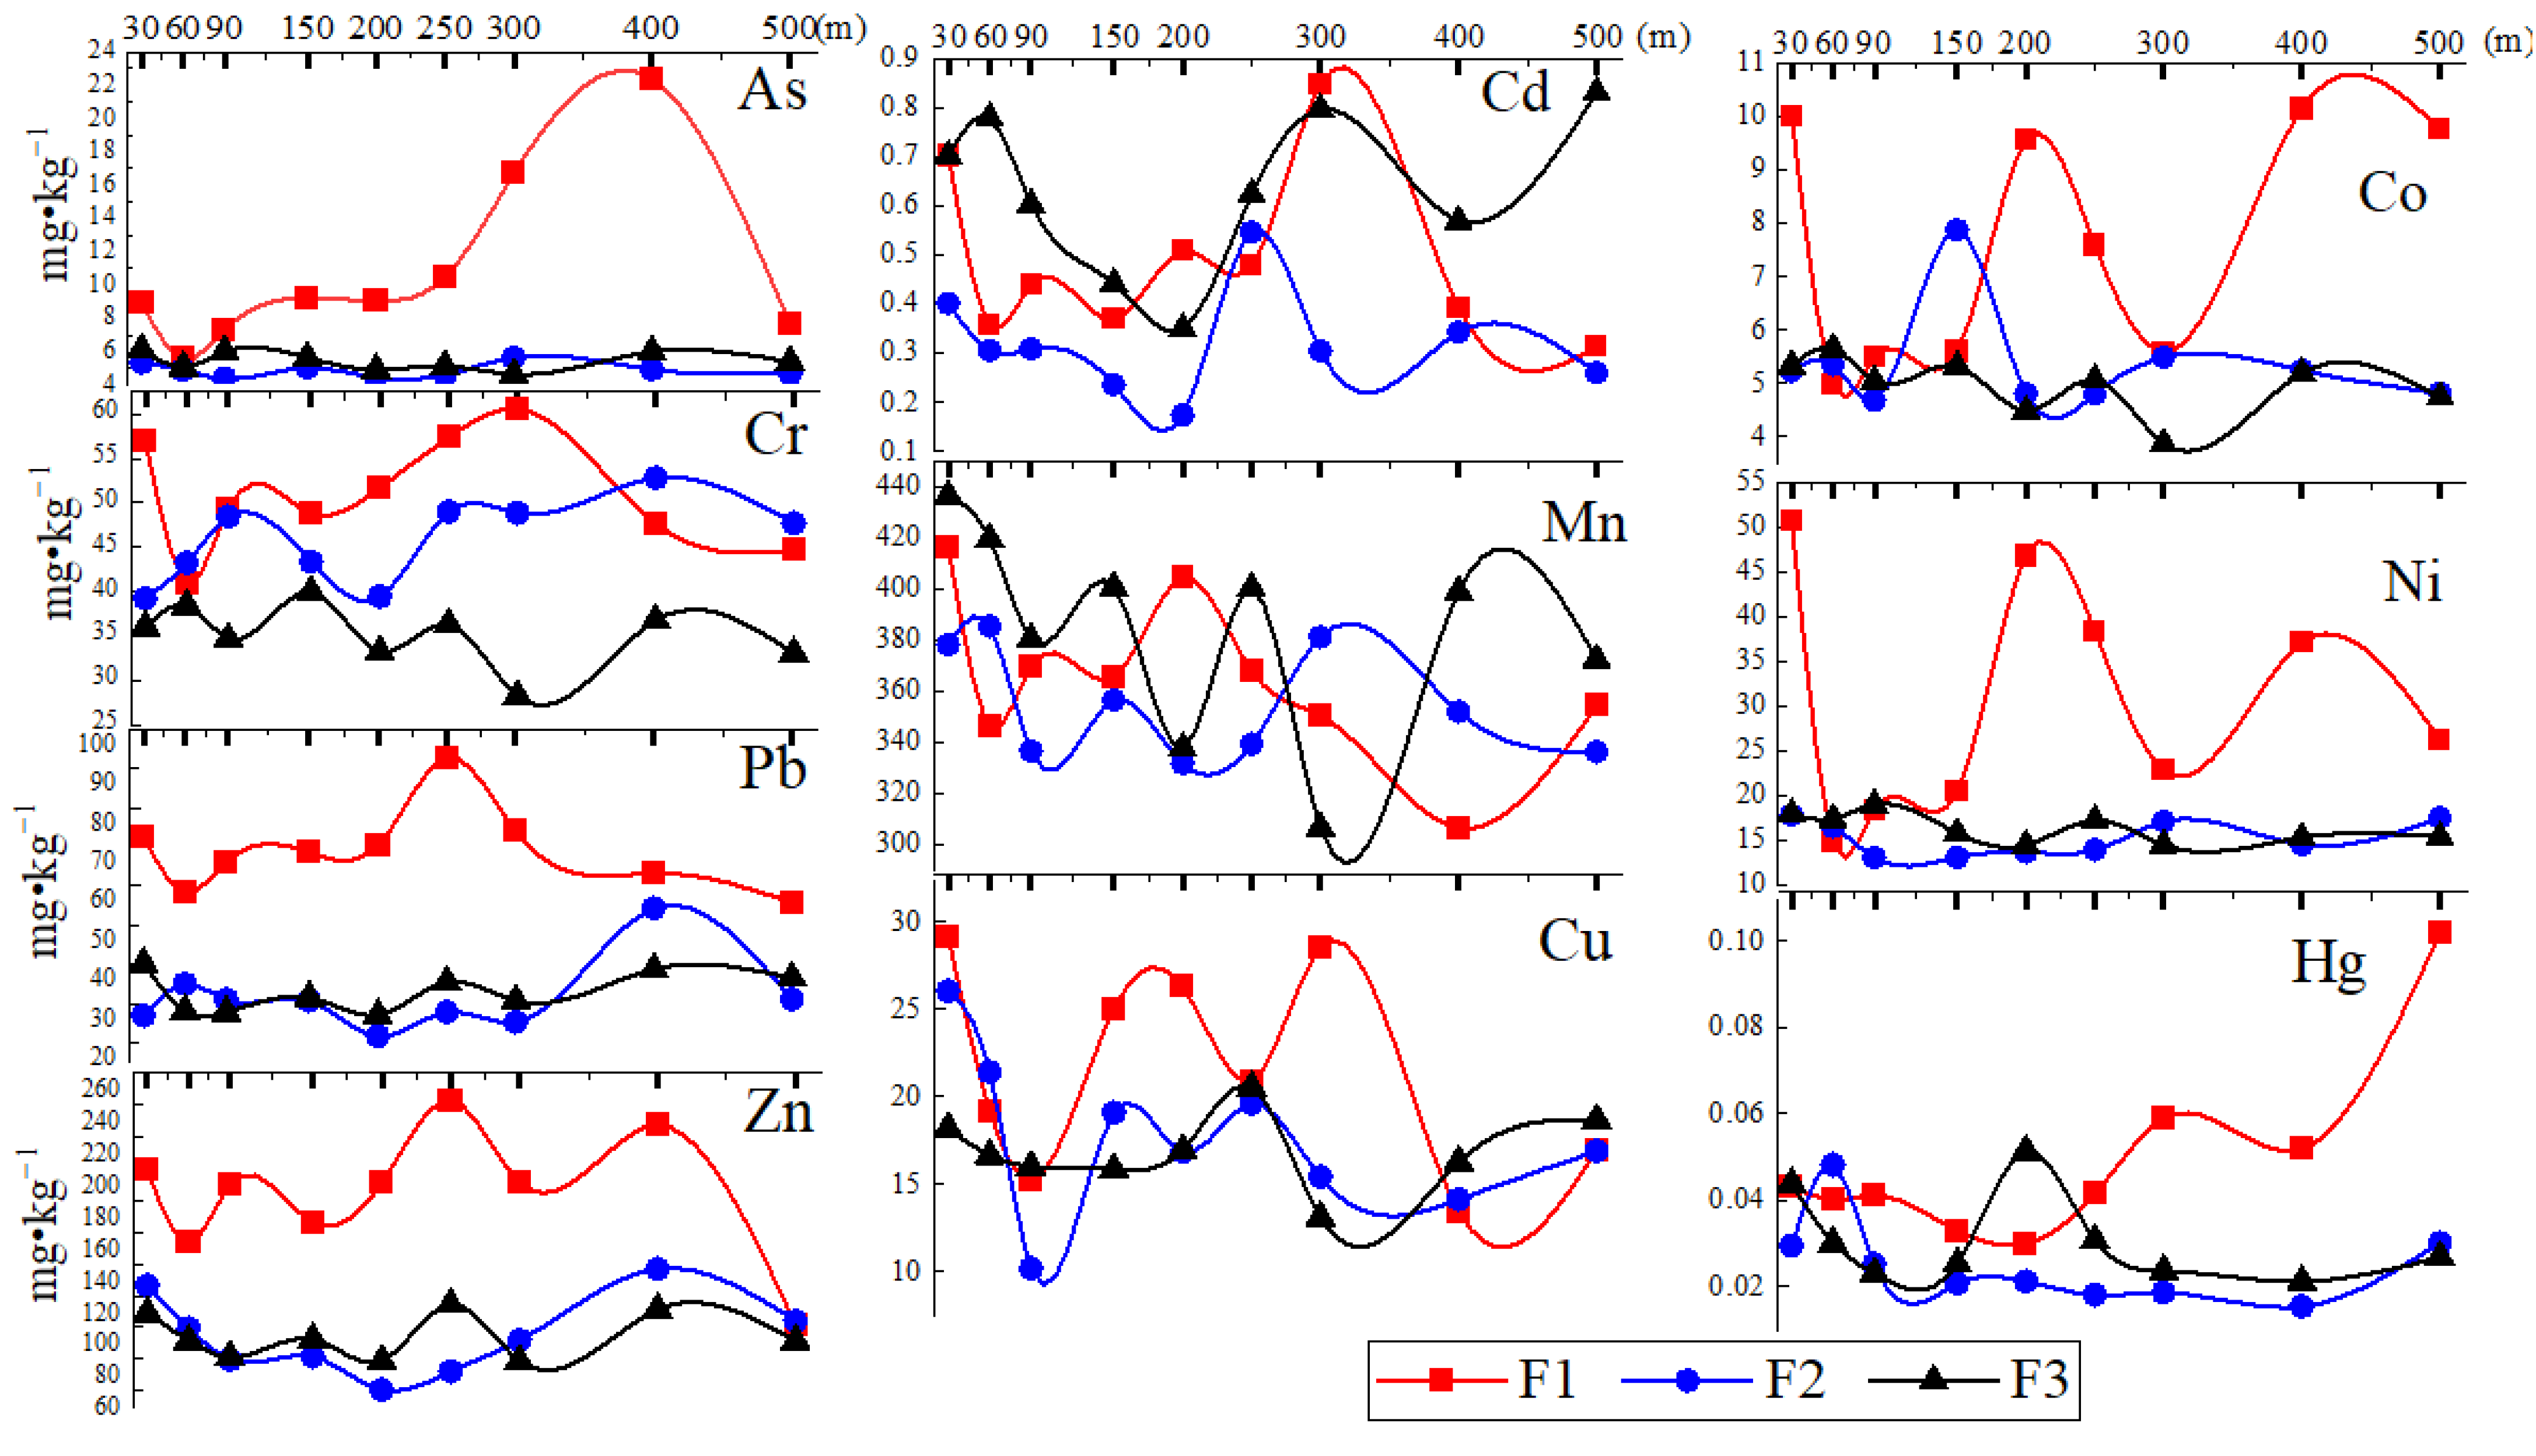
There were similarities and differences in the spatial variation of dust heavy metal concentrations around F1, F2, and F3 (Figure 3). Generally, the fluctuation of Mn concentrations around these three factories was relatively stable and consistent.
The spatial variability around F1 was the most significant, and the peak values were the most obvious. For F1, F2, and F3, the fluctuation patterns of Pb, Zn, and Cu were similar, which presented as “Decrease (30–60 m)-Increase (60–300 m)-Decrease (300–500 m)”. Most of the peak values appeared at about 300 m away from the factories.
The fluctuation patterns of As, Co, Hg, and Ni at F2 and F3 were relatively gentle, indicating that these heavy metals were less affected by the local industrial activities. Whereas, for F1, the concentrations of these elements in dusts changed significantly. Arsenic slowly increased to the highest value (400 m), and then dropped to the BC (500 m). The peak value of Hg was very likely reached beyond 500 m. Co and Ni fluctuated greatly but without obvious trends and may be affected by multiple surrounding factors.
The gentle fluctuation of Cr and Cd around F1, F2, and F3 was very similar. The peak value of Cd appeared at 250–300 m for all the three factories.

3.3. Heavy Metal Pollution Assessment

In order to describe the degree of pollution of heavy metals in dust at different distances from the factories, two sets of evaluation criteria, soil BCs and the National Soil Environmental Standard of Grade II [35], were selected and calculated according to Equation (1). The order of CF values for each element, calculated according to the BCs (reflecting the concentration of heavy metals in the dust by factory), were (Table 1):
F1: Zn (5.33) > Pb (4.26) > Hg (2.58) > As (2.52) > Ni (2.40) > Cd (1.89) > Cu (1.78) > Cr (1.69) > Mn (1.17) > Co (0.94).
F2: Zn (2.73) > Pb (1.94) > Cr (1.52) > Cu (1.46) > Hg (1.33) > Cd (1.23) > Ni (1.19) > As (1.14) > Mn (1.13) > Co (0.66).
F3: Zn (2.72) > Cd (2.44) > Pb (2.03) > Hg (1.62) > Cu (1.39) > Ni (1.28) > As (1.27) > Mn (1.23) > Cr (1.17) > Co (0.61).
For the three factories, Zn and Pb were the main sources of pollution, while the accumulation of Mn and Co was weak. There was much variability in the pollution order of other elements, which could be caused by the combined pollution of industrial activities and the surrounding environment.
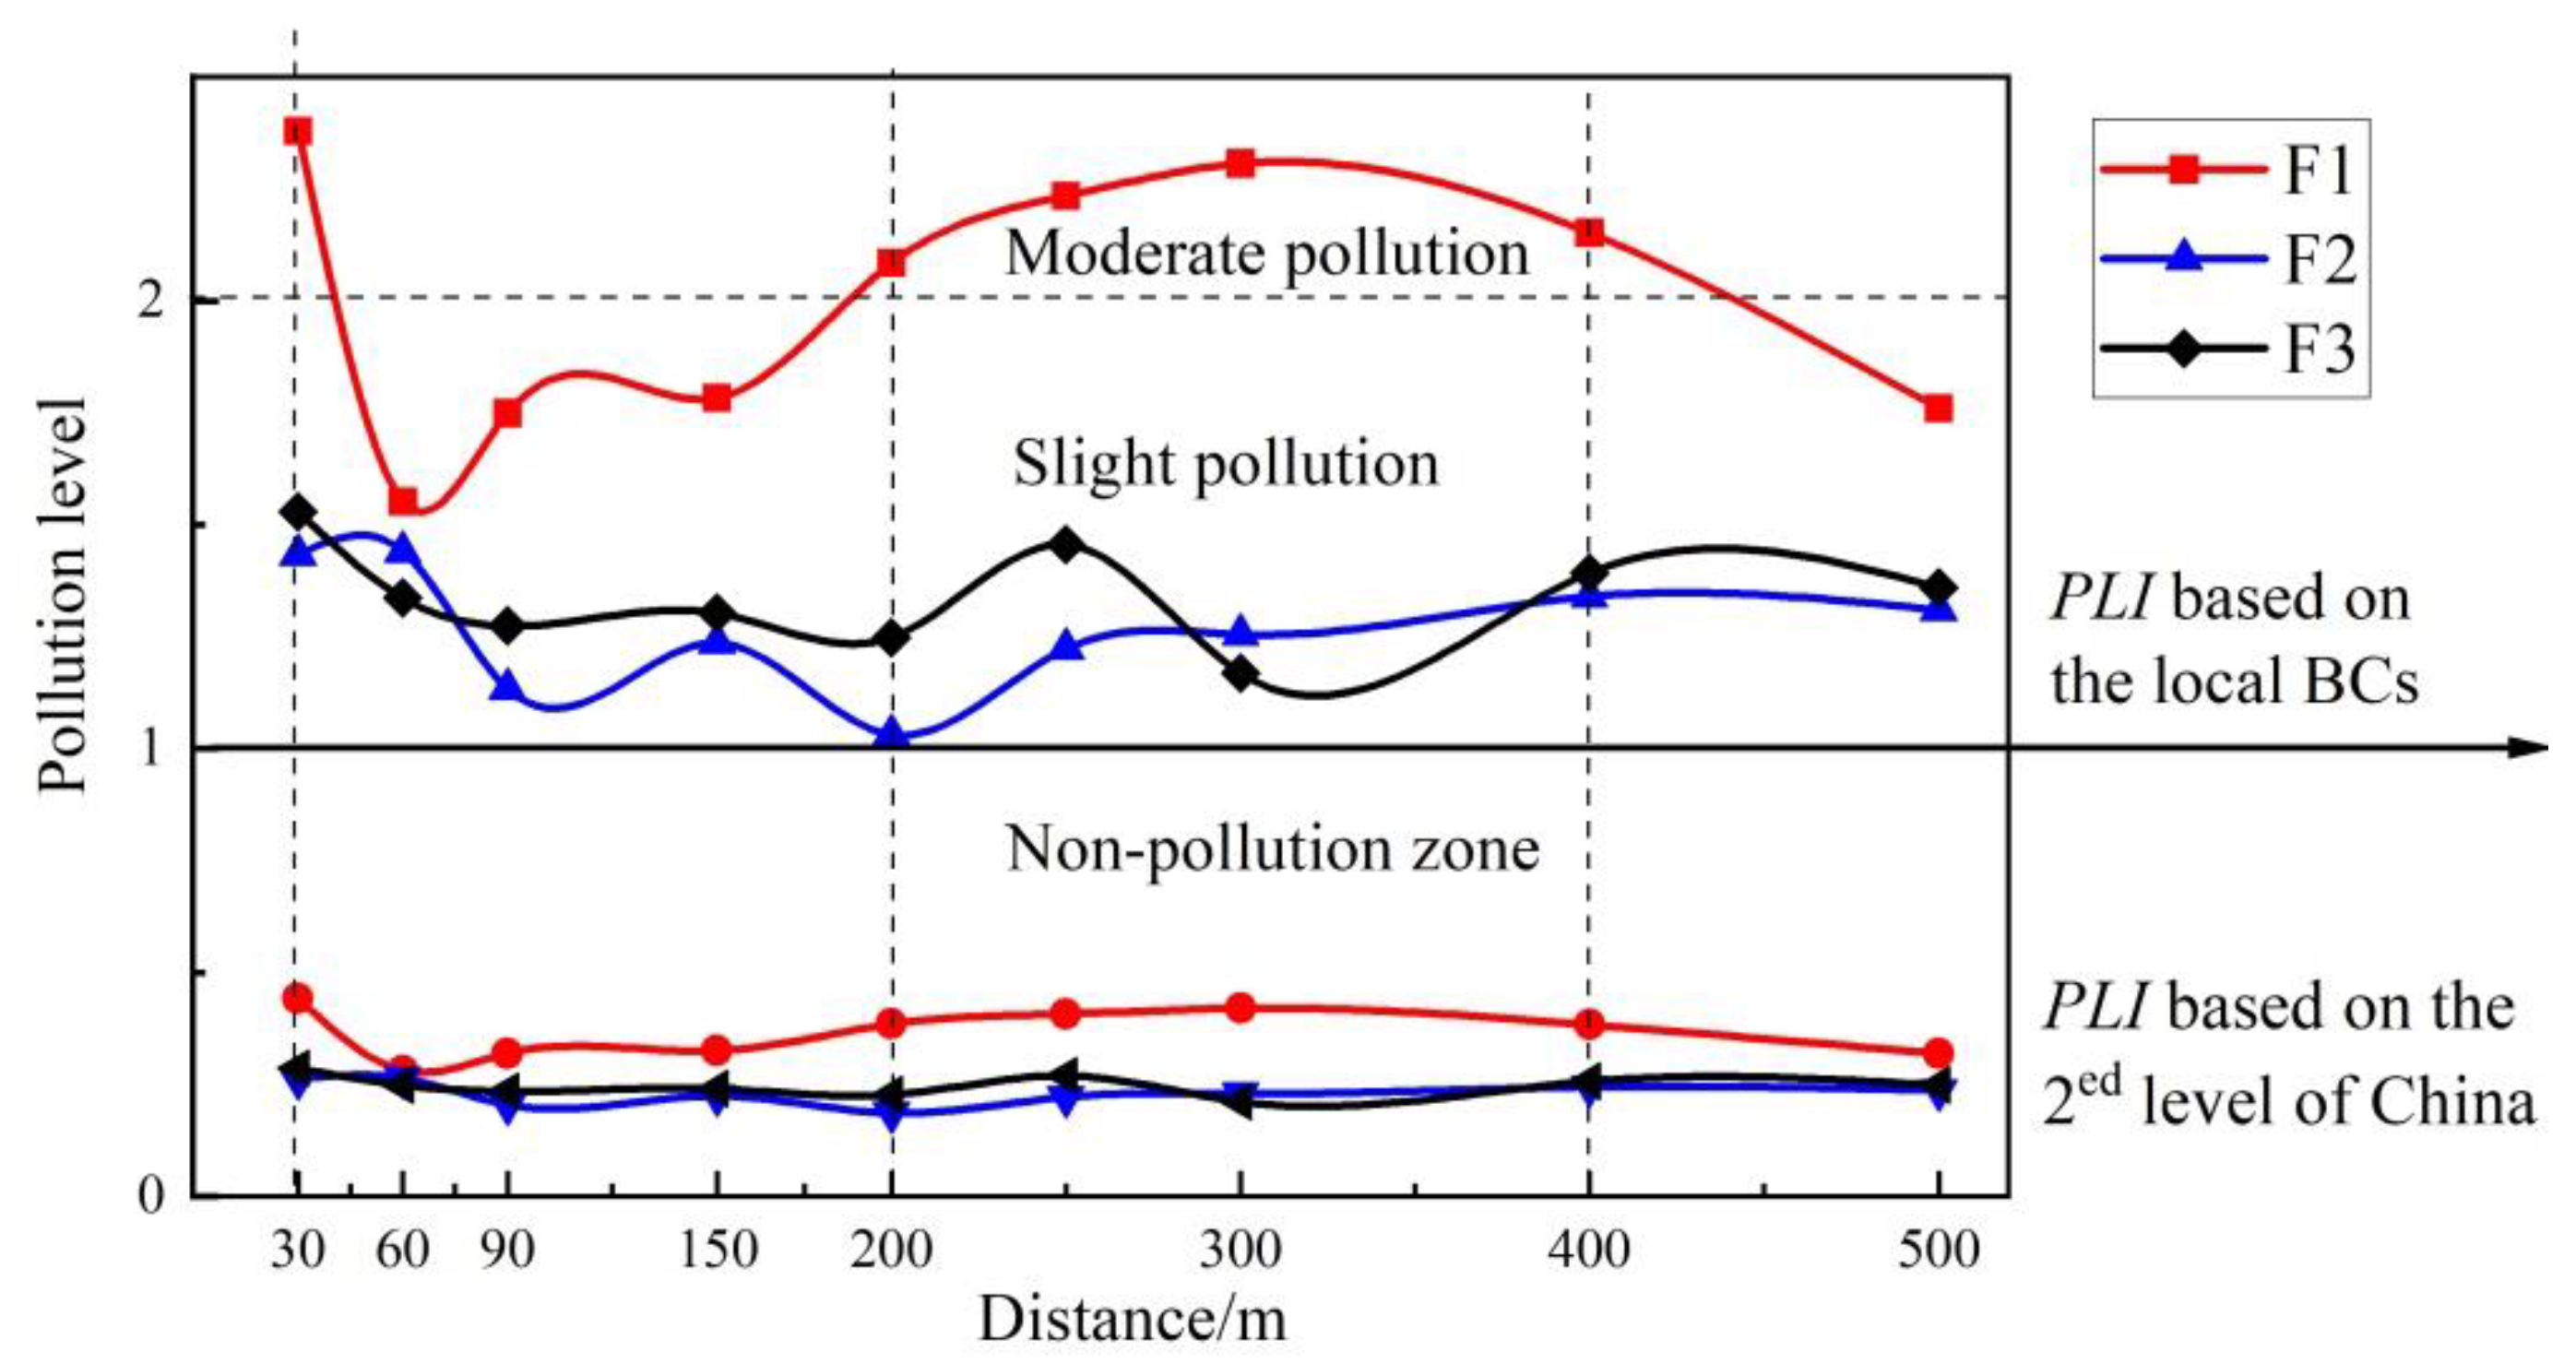
Due to the lower concentrations of heavy metals in the dust around F2 and F3, the PLI values for those two factories were lower than for F1. The mean PLI values followed the order of F1 (2.00) > F3 (1.34) > F2 (1.27) and F1 (0.36) > F3 (0.25) > F2 (0.23), calculated according to the BCs and the National Soil Environmental Standard II [35], respectively. From Figure 4, it can be seen that the PLI values based on the national secondary standard were low, with little fluctuation, whereas the PLI values calculated based on the BCs were all higher than 1, and the spatial fluctuation was more obvious. The PLI values of F1, F2, and F3 all showed two peaks, at about 30 m and 300 m. There was a decreasing trend at 30–200 m, and an increasing trend in the range of 200–400 m. Meanwhile, most of curves showed a peak value near 300 m. After 400 m, the PLI values showed a gradual decreasing trend. A comparison of the three factories found that the PLI value of F1 was greater than 2 in the range of 30 m and 200–400 m away from it, indicating that the factory has a significant impact on the concentration of heavy metals in dust.

3.4. Human Health Risk Assessment

The risk assessment model was used to determine both the non-carcinogenic and carcinogenic risk from the dust samples around each factory in adults and children through dermal, ingestion, and inhalation pathways. The non-carcinogenic risks of heavy metals in dust followed the order of F1 (1.17) > F2 (0.71) > F3 (0.70) and F1 (0.02) > F2, F3 (0.01, 0.01) for children and adults, respectively. The results of the non-carcinogenic risk assessment of heavy metals in dust indicated unlikely adverse health effects for adults around the factories, but likely adverse health effects for children in some areas around F1. As found by other studies, children are at higher risk via direct ingestion of dust than adults [6]. In addition, it was determined that both adults and children were most affected by As, Cr, and Pb via the three exposure pathways among the non-carcinogenic heavy metals. The average HQ values showed the following decreasing patterns:
Children: As (3.11 × 10⁻¹) > Cr (1.99 × 10⁻¹) > Pb (1.64 × 10⁻¹) > Mn (1.12 × 10⁻¹) > Co (2.71 × 10⁻²) > Hg (1.51 × 10⁻²) > Ni (1.33 × 10⁻²) > Cd (6.87 × 10⁻³) > Cu (6.02 × 10⁻³) > Zn (5.35 × 10⁻³).
Adults: As (4.02 × 10⁻²) > Cr (2.6 × 10⁻²) > Pb (2.10 × 10⁻²) > Mn (1.72 × 10⁻²) > Co (3.55 × 10⁻³) > Ni (1.71 × 10⁻³) > Cd (9.07 × 10⁻⁴) > Cu (7.72 × 10⁻⁴) > Zn (6.85 × 10⁻⁴) > Hg (3.07 × 10⁻⁴).
Accordingly, the average of the total HI was found to be approximately ten times higher in children than adults for each analyzed heavy metal, showing that children are more vulnerable to non-carcinogenic health risks than adults. This may be due to the fact that children are exposed to dust through their habits of playing in the dust with toys and their hand-to-mouth behavior [36]. No health risks were observed from the elements as the HI < 1, thereby illustrating no risk and subsequent adverse health effects.
The carcinogenic risks for the three factories were calculated for As, Cd, Co, Cr, and Ni according to possible exposure routes for both children and adults. The average TCR values for the observed factories were found in the decreasing order of F1 (1.90 × 10⁻⁵, 1.00 × 10⁻⁵) > F3 (9.56 × 10⁻⁶, 5.07 × 10⁻⁶) > F2 (8.61 × 10⁻⁶, 4.59 × 10⁻⁶) for children and adults, respectively. The average CR values were found in the order of As (6.46 × 10⁻⁶, 1.23 × 10⁻⁵) > Cr (9.56 × 10⁻⁸, 5.57 × 10⁻⁸) > Co (3.04 × 10⁻⁹, 1.77 × 10⁻⁹) > Ni (9.02 × 10⁻¹⁰, 4.75 × 10⁻¹⁰) > Cd (1.60 × 10⁻¹⁰, 9.30 × 10⁻¹¹) for children and adults, respectively. It was found that exposure to road dust containing carcinogenic metals around F1 was more dangerous than around F2 and F3. Furthermore, the results indicated that both CR and TCR for children and adults were far from reaching the threat threshold (1 × 10⁻⁶, 1 × 10⁻⁴).
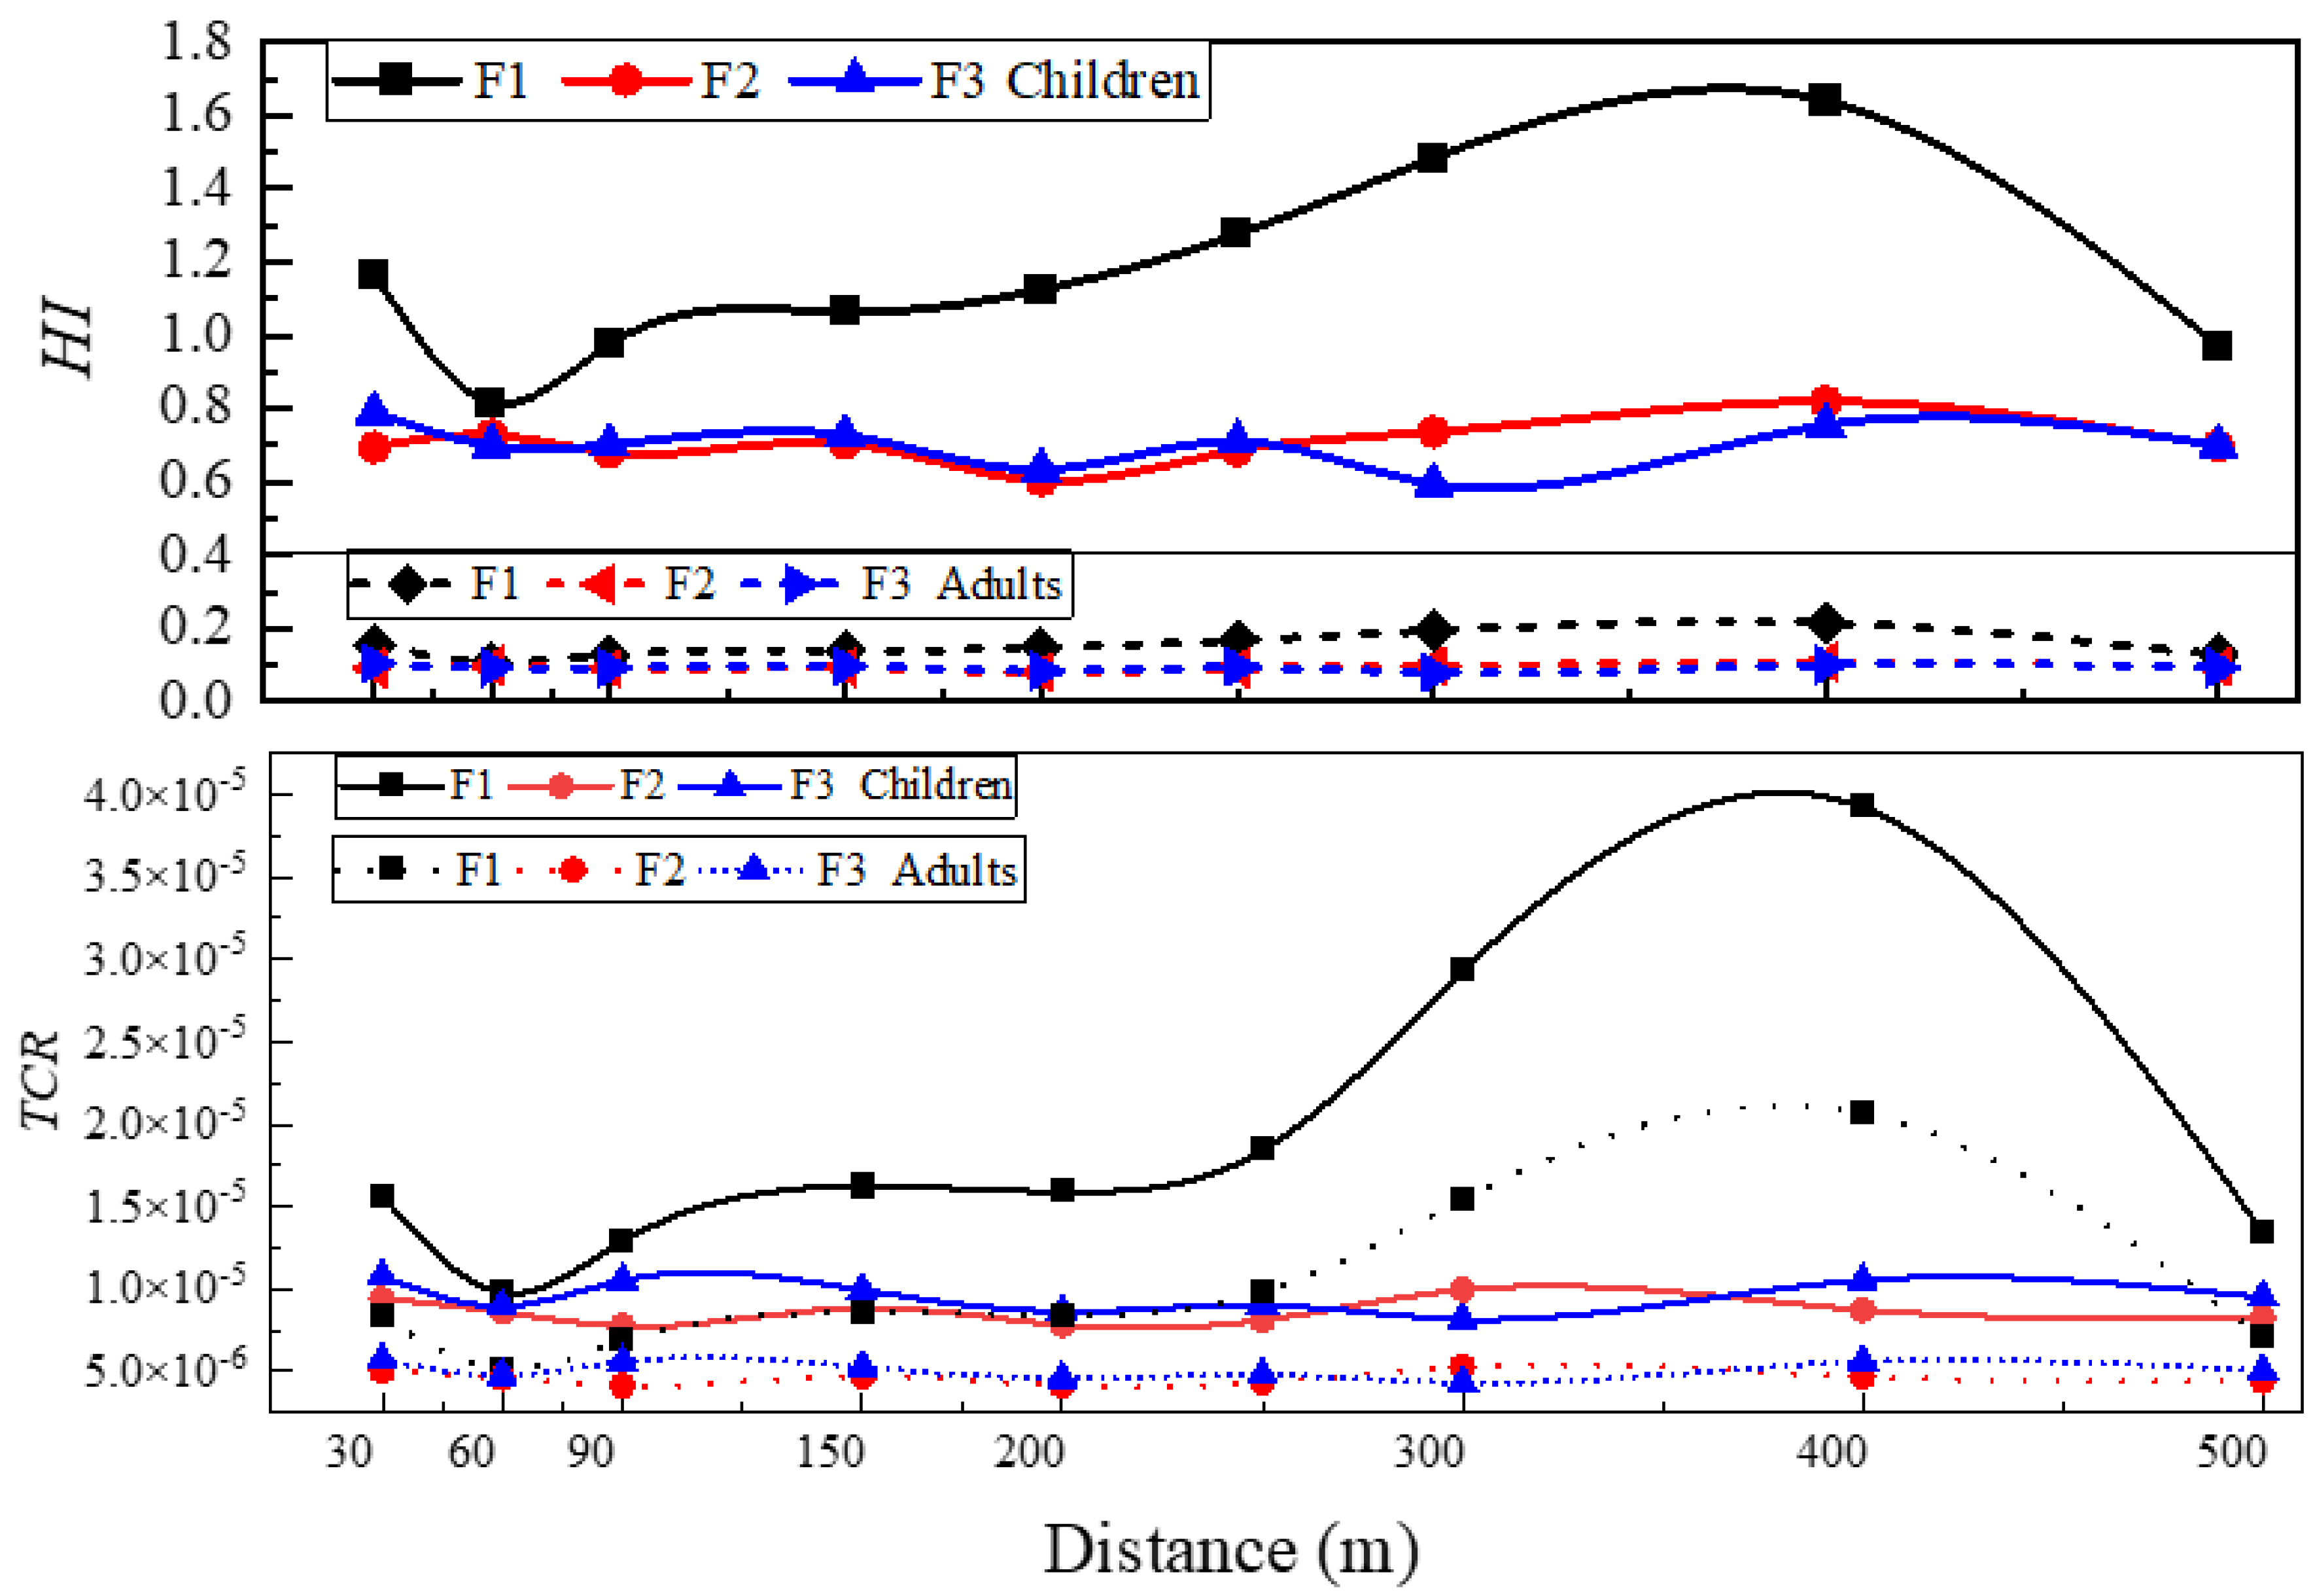
The distributions for average non-carcinogenic and carcinogenic risks of heavy metals in road dust for the three factories are shown in Figure 5. For both children and adults, the peak value of potential health risk appeared at 400 m. The fluctuation of non-carcinogenic risk was greatly affected by As, Pb, and Cr. For the spatial trends of carcinogenic risk, As and Cr were the biggest contributors.

4. Discussion

4.1. Effects of Factory Type on Dust Heavy Metal Concentrations

Characteristics of dust heavy metal concentrations were directly affected by the factory type [37]. Most of the heavy metal concentrations near F1 were significantly higher than those near F2 and F3 (Figure 6). For F1, computer, communication, mobile phone, consumer electronics, and other such components are the main products. Various heavy metal pollutants could be produced during the processing and manufacturing of circuit boards, batteries, semiconductors, and liquid crystal displays, etc. [38,39]. Although F1 belongs to the high-tech industry, it is still a typical labor-intensive factory. Thus, the emission of pollutants in the production process can be difficult to avoid completely, and could have a serious impact on the surrounding dust [40]. In this study, all the elements were accumulated to a certain degree, but the most obvious pollutants were Zn, Pb, Hg, As, and Ni.
F2 is an automobile manufacturing factory. The primary products are domestic cars, pickup trucks, and auto parts, which means processes such as manufacturing engines, spraying, general assembly, and interior decoration, etc., are common. F3 is an automobile equipment manufacturing factory. The main products are new energy trucks and buses, including the manufacturing of key parts and components, as well as the processes of stamping, welding, coating, and assembly. Both F2 and F3 adopt advanced technologies, such as fully enclosed noise reduction, dust isolation factory building, fully automatic assembly line production, and digital control, which greatly reduce the pollution caused by emissions from traditional production processes. The most highly accumulated pollutants near F2 were Zn, Pb, Cr, Cu, and Hg, and those near F3 were Zn, Cd, Pb, Hg, and Cu, which mainly came from the automobile electroplating process [41,42,43] and the impact of human activities such as traffic and transportation surroundings [44,45,46]. In this study, the production processes, technical advancement, and environmental protection facilities in F3 were better than in F2, which resulted in F3 having a smaller impact on dust heavy metal concentrations.

4.2. Factors Affecting the Spatial Distribution of Dust Heavy Metal Concentrations

The discharge intensity of the pollutant is the mostly important factor affecting the special distribution. Many studies have been conducted [47] which reveal that heavy metal concentrations around a pollution source generally obey the normal distribution, which reaches peak value at a certain distance from the pollution source. For example, the peak value of heavy metal content in roadside soil generally occurs within 25–50 m from the subgrade [48]. The main settlement area of the heavy metals discharged from a waste incineration factory was in the range of 1000 m [49,50]. Accordingly, because the emission intensity of different pollution sources varies greatly, the distances for the peak values of heavy metal concentrations around various factories will be different, even for the same element [51,52]. In this study, the general spatial distribution trends of dust heavy metal concentrations were consistent, but the details were different. This could be due to the fact that F1, F2, and F3 are located in the same zone and are subject to the same environmental regulations, but they are different types of factories.
The spatial distribution characteristics of heavy metal concentrations around the pollution source are also influenced by the pollutants’ physical and chemical properties, including volatility, discharged particle size, etc. In this study, the peak value of Hg near F1 appeared far greater than other elements at about 500 m. Fan [39] indicates that when emitted by a coal-fired power factory within 1000 m from the chimney in the downwind direction, the peak value of Hg concentration appeared at 1500 m. These results confirm that the volatility of Hg makes it spread farther than other elements. Meanwhile, the particle sizes of different pollution sources differ, therefore the distance the particles will diffuse in the air will be different, which directly affects the place where the peak value of dust heavy metals occurs [48,53,54].
In addition, it is reasonable to consider the surrounding environment when looking at the factors that influence the distribution of heavy metal concentrations, including nearby human activities, wind direction and speed, and landform [55,56,57]. This could explain the lack of an obvious law of distribution in the Cd and Cu fluctuations around the three factories, which could be due to the impacts of fertilization and spraying of plants in the surrounding green space [58,59]. The finding of the highest average Hg concentration near F3 could be due to that the factory is proximity to the rural business areas which related the heating and catering activities [60].

4.3. Effects of Various Heavy Metal Concentrations on Spatial Distribution Characteristics for Pollution and Health Risk

The curves of PLI values calculated according to BCs for F1, F2, and F3 all had two peaks, a “small peak” and a “large peak”, that appeared at about 30 m and 300 m, respectively. In the dust around the three factories, Pb and Zn contributed the most to the comprehensive pollution load index (CF/PLI).
For HI and TCR, the peak values appeared at 400 m, with a normal distribution curve. The contribution rate of As to the total risk (HQ/HI) at F1, F2, and F3 was 30.55%, 34.20%, 40.77%, respectively, and its contribution to the total carcinogenic risk (CR/TCR) was 98.84%, 97.75%, 98.42%, respectively.
The spatial distributions found by the two evaluation methods were different. PLI focuses more on the accumulation characteristics of heavy metals based on the BCs, indicating that Pb and Zn in road dust were the most prevalent pollutants surrounding the factories. Whereas HI and TCR focus more on the toxicity response coefficients of the heavy metals, and the toxicity coefficients of As were found to be much higher than the other heavy metals.

5. Conclusions

In this study, the variation in road dust heavy metal concentrations, pollution, and health risk with distance from factories in the city–industry integration area, ZETZ, were investigated. The results were as follows:
Road dust heavy metal concentrations around the electrical component manufacturing factory (F1) were higher than those around the automobile production and parts manufacturing factory (F2) and the transportation equipment manufacturing industry factory (F3). Therefore, it is necessary to strengthen the environmental control of factories such as F1. Factories such as F2 and F3 should focus on the Cd, Cu, and Cr emissions from electroplating. In addition, the significant increase in Pb and Zn content in surface dust due to industrial activities and large traffic volume should be considered.
The PLI indicated that exposures to road dust heavy metals near F1 were more dangerous than those near F2 and F3. At present, however, there is no potential risk exposure to dust heavy metals around the three typical factories in the study area. The health risk of F1 was higher than that of F2 and F3, however both non-carcinogenic and carcinogenic risks for children and adults were far from reaching the threat thresholds.
The spatial change curves for the heavy metal concentrations around the factories generally followed a normal distribution, and the peak values mainly occurred at 300~400 m away from the factories. The peak values for PLI, which was calculated according to the BCs, appeared at about 30 m and 300 m, respectively. For HI and TCR, the peak values appeared at 400 m. In general, relevant preventative measures for heavy metal pollution should be strengthened, especially at 300~400 m away from factories.

Supplementary Materials

The following supporting information can be downloaded at: https://www.mdpi.com/article/10.3390/ijerph192114562/s1, Table S1: Basic questionnaire for the chosen factories’ surroundings; Table S2: Exposure parameters used in the evaluation of health risks.

Author Contributions

This work is the result of collaboration among Y.C., Z.H., H.B. and W.S. All authors have equally contributed, reviewed, and improved the manuscript. All authors have read and agreed to the published version of the manuscript.

Funding

This study was supported by the Natural Science Foundation of Henan Province, 202300410078; the Humanities and Social Sciences Research Project of Henan Education Department, 2020-ZZJH-076; the Key Scientific Research Projects of Colleges and Universities in Henan Province, 20A170002; the National Natural Science Foundation of China [Project No. 41901148]; and the Philosophy and Social Sciences Planning Project of Henan Province [2021CJJ133].

Institutional Review Board Statement

Not applicable.

Informed Consent Statement

Not applicable.

Data Availability Statement

Some or all data and models that support the findings of this study are available from the corresponding author upon reasonable request.

Acknowledgments

We would like to thank Susu Xu, Jingcheng Luo, Lu He and Yuanxin Ding for contributing to the dust sampling and chemical element analysis.

Conflicts of Interest

The authors declare no conflict of interest.

References

  1. Wei, X.; Gao, B.; Wang, P.; Zhou, H.; Lu, J. Pollution characteristics and health risk assessment of heavy metals in street dusts from different functional areas in Beijing, China. Ecotoxiol. Environ. Safe 2015, 112, 186–192. [Google Scholar] [CrossRef] [PubMed]
  2. Zhang, Y.; Ji, X.; Ku, T.; Li, G.; Sang, N. Heavy metals bound to fine particulate matter from northern China induce season-dependent health risks: A study based on myocardial toxicity. Environ. Pollut. 2016, 216, 380–390. [Google Scholar] [CrossRef] [PubMed] [Green Version]
  3. Liu, A.; Hong, N.; Zhu, P.; Guan, Y. Characterizing petroleum hydrocarbons deposited on road surfaces in urban environments. Sci. Total Environ. 2019, 653, 589–596. [Google Scholar] [CrossRef] [PubMed]
  4. Zhu, X.; Yu, W.; Li, F.; Liu, C.; Tian, R. Spatio-temporal distribution and source identification of heavy metals in particle size fractions of road dust from a typical industrial district. Sci. Total Environ. 2021, 780, 146357. [Google Scholar] [CrossRef]
  5. Zhou, L.; Liu, G.J.; Shen, M.C.; Liu, Y. Potential ecological and health risks of heavy metals for indoor and corresponding outdoor dust in Hefei, Central China. Chemosphere 2022, 302, 134864. [Google Scholar] [CrossRef]
  6. Huang, C.S.; Zhang, L.J.; Meng, J.L.; Yu, Y.J.; Qi, J.Y.; Shen, P.; Li, X.; Ding, P.; Chen, M.B.; Hu, G.C. Characteristics, source apportionment and health risk assessment of heavy metals in urban road dust of the Pearl River Delta, South China. Ecotox. Environ. Safe 2022, 236, 113490. [Google Scholar] [CrossRef]
  7. US EPA. Guidelines for Exposure Assessment; U.S. Environmental Protection Agency: Washington, DC, USA, 1989.
  8. US EPA. Supplemental Guidance for Developing Soil Screening Levels for Superfund Sites; OSWER9355; Office of Solid Waste and Emergency Response: Washington, DC, USA, 2002; pp. 4–24.
  9. Nargis, A.; Habib, A.; Islam, M.N.; Chen, K.; Sarker, M.S.L.; Al-Razee, A.N.N.; Liu, W.B.; Liu, G.R.; Cai, M.G. Source identification, contamination status and health risk assessment of heavy metals from road dusts in Dhaka, Bangladesh. J. Environ. Sci. 2022, 121, 159–174. [Google Scholar] [CrossRef]
  10. Suvetha, M.; Charles, E.P.; Vinothkannan, A.; Rajaram, R.; Paray, B.A.; Ali, S. Are we at risk because of road dust? An ecological and health risk assessment of heavy metals in a rapid growing city in South India. Environ. Adv. 2022, 7, 100165. [Google Scholar] [CrossRef]
  11. Gan, L.; Shi, H.; Hu, Y.; Lev, B.; Lan, H. Coupling coordination degree for urbanization city-industry integration level: Sichuan case. Sustain. Cities Soc. 2020, 58, 102136. [Google Scholar] [CrossRef]
  12. Shen, M.; Ren, M.; Wang, Y.; Shen, F.; Cao, Z. Identifying dust as the dominant source of exposure to heavy metals for residents around battery factories in the Battery Industrial Capital of China. Sci. Total Environ. 2020, 765, 144375. [Google Scholar] [CrossRef]
  13. Qin, Y.F.; Liu, Y.Q.; Wang, J.B.; Lu, Y.; Xu, Z.M. Emission of PAHs, PCBs, PBDEs and heavy metals in air, water and soil around a waste plastic recycling factory in an industrial park, Eastern China. Chemosphere 2022, 294, 133734. [Google Scholar] [CrossRef]
  14. Shahab, A.; Zhang, H.; Ullah, H.; Rashid, A.; Xiao, H. Pollution characteristics and toxicity of potentially toxic elements in road dust of a tourist city, Guilin, China: Ecological and health risk assessment. Environ. Pollut. 2020, 266, 115419. [Google Scholar] [CrossRef] [PubMed]
  15. Yesilkanat, C.M.; Kobya, Y. Spatial characteristics of ecological and health risks of toxic heavy metal Pollution from road dust in the Black Sea coast of Turkey. Geoderma Reg. 2021, 25, 00388. [Google Scholar] [CrossRef]
  16. Yuan, G.L.; Sun, T.H.; Han, P.; Li, J. Environmental geochemical mapping and multivariate geostatistical analysis of heavy metals in topsoils of a closed steel smelter: Capital Iron & Steel Factory, Beijing, China. J. Geochem. Explor. 2013, 130, 15–21. [Google Scholar]
  17. Chen, Y.N.; Ma, J.H.; Miao, C.H.; Ruan, X.L. Occurrence and environmental impact of industrial agglomeration on regional soil heavy metalloid accumulation: A case study of the Zhengzhou Economic and Technological Development Zone (ZETZ), China. J. Clean. Prod. 2019, 245, 118676. [Google Scholar] [CrossRef]
  18. Yin, P.J.; Lu, H.J. Comparative study on the detection of heavy metals in concentrated leachate with different digestion methods. Environ. Sci. Technol. 2019, 42, 89–96. (In Chinese) [Google Scholar]
  19. HJ 766-2015; Solid Waste-Inductively Coupled Plasma Mass Spectrometry (ICP-MS). China Environment Press: Beijing, China, 2014. (In Chinese)
  20. HJ 680-2013; Soil and Sediment Determination of Mercury, Arsenic, Selenium, Bismuth, Antimony-Microwave Dissolution/Atomic Fluorescence Spectrometry. China Environment Press: Beijing, China, 2014. (In Chinese)
  21. HJ 803-2016; Soil and sediment-Determination of Aqua Regia Extracts of 12 Metals Elements-Inductively Coupled Plasma Mass Spectrometry. China Environment Press: Beijing, China, 2016. (In Chinese)
  22. Håkanson, L. An ecological risk index for aquatic Pollution control: A sedimentological approach. Water Res. 1980, 14, 975–1001. [Google Scholar] [CrossRef]
  23. Li, Y.M.; Ma, J.H.; Liu, D.X.; Sun, Y.L.; Chen, Y.F. Assessment of Heavy Metal Pollution and Potential Ecological Risks of Urban Soils in Kaifeng City, China. Environ. Sci. 2015, 36, 1037–1044. (In Chinese) [Google Scholar]
  24. Lim, H.S.; Lee, J.S.; Chon, H.T.; Sager, M. Heavy metal contamination and health risk assessment in the vicinity of the abandoned Songcheon Au-Ag mine in Korea. J. Geochem. Explor. 2008, 96, 223–230. [Google Scholar] [CrossRef]
  25. National Health Commission. China Health Statistics Yearbook; Peking Union Medical College Press: Beijing, China, 2007. (In Chinese)
  26. Wang, Z.; Liu, S.Q.; Chen, X.M.; Lin, C.Y. Estimates of the exposed dermal surface area of Chinese in view of human health risk assessment. J. Saf. Environ. 2008, 8, 152–156. (In Chinese) [Google Scholar]
  27. Li, R.Z.; Pan, C.R.; Chen, J.; Jiang, Y.M.; Ding, G.Z. Uncertainty model for the health risk of heavy metals in urban topsoil and dust based on blind number theory. Acta Sci. Circum. 2013, 33, 276–285. (In Chinese) [Google Scholar]
  28. Ali, M.U.; Liu, G.; Yousaf, B.; Abbas, Q.; Ullah, H.; Munir, M.A.M.; Fu, B. Pollution characteristics and human health risks of potentially (eco) toxic elements (PTEs) in road dust from metropolitan area of Hefei, China. Chemosphere 2017, 181, 111–121. [Google Scholar] [CrossRef] [PubMed]
  29. Ferreira-Baptista, L.; De Miguel, E. Geochemistry and risk assessment of street dust in Luanda, Angola: A tropical urban environment. Atmos. Environ. 2005, 39, 4501–4512. [Google Scholar] [CrossRef] [Green Version]
  30. Men, C.; Liu, R.; Wang, Q.R.; Miao, Y.X.; Wang, Y.F.; Jiao, L.J.; Li, L.; Cao, L.P.; Shen, Z.Y.; Li, Y. Spatial-temporal characteristics, source-specific variation and uncertainty analysis of health risks associated with heavy metals in road dust in Beijing, China. Environ. Pollut. 2021, 278, 116866. [Google Scholar] [CrossRef]
  31. Bi, C.J.; Zhou, Y.; Chen, Z.L.; Jia, J.P.; Bao, X.Y. Heavy metals and lead isotopes in soils, road dust and leafy vegetables and health risks via vegetable consumption in the industrial areas of Shanghai, China. Sci. Total Environ. 2018, 619–620, 1349–1357. [Google Scholar] [CrossRef]
  32. Liang, S.Y.; Cui, J.L.; Bi, X.Y.; Luo, X.S.; Li, X.-D. Deciphering source contributions of trace metal contamination in urban soil, road dust, and foliar dust of Guangzhou, southern China. Sci. Total. Environ. 2019, 695, 133596. [Google Scholar] [CrossRef]
  33. Taiwo, A.M.; Michael, J.O.; Gbadebo, A.M.; Fatai, O.; Oladoyinbo, F.O. Pollution and health risk assessment of road dust from Osogbo metropolis, Osun state, Southwestern Nigeria. Hum. Ecol. Risk Assess 2020, 26, 1254–1269. [Google Scholar] [CrossRef]
  34. Li, F.J.; Yang, H.W.; Ayyamperumal, R.; Liu, Y. Pollution, sources, and human health risk assessment of heavy metals in urban areas around industrialization and urbanization-Northwest China. Chemosphere 2022, 308, 136396. [Google Scholar] [CrossRef]
  35. GB 15618-2017; Environmental Quality Standards for soils. China Environment Press: Beijing, China, 2017.
  36. Mohmand, J.; Eqani, S.A.M.A.S.; Fasola, M.; Alamdar, A.; Mustafa, L.; Ali, N.; Liu, L.P.; Peng, S.Y.; Shen, H.Q. Human exposure to toxic metals via contaminated dust: Bio-accumulation trends and their potential risk estimation. Chemosphere 2015, 132, 142–151. [Google Scholar] [CrossRef]
  37. Efstratios, K.; Ariadne, A.; Vladislav, C.; Fotini, B.; Konstantinos, S.; Michael, K.; Aggelos, F. Metal(loid) and isotopic tracing of Pb in soils, road and house dusts from the industrial area of Volos (central Greece). Sci. Total Environ. 2020, 725, 138300. [Google Scholar]
  38. Chen, H.R.; Wang, L.; Hu, B.F.; Xu, J.M.; Liu, X.M. Potential driving forces and probabilistic health risks of heavy metal accumulation in the soils from an e-waste area, southeast China. Chemosphere 2022, 289, 133182. [Google Scholar] [CrossRef] [PubMed]
  39. Wu, W.; Wu, P.; Yang, F.; Sun, D.L.; Zhang, D.X.; Zhou, Y.K. Assessment of heavy metal Pollution and human health risks in urban soils around an electronics manufacturing facility. Sci. Total Environ. 2018, 630, 53–61. [Google Scholar] [CrossRef] [PubMed]
  40. Zhou, P.; Guo, J.; Zhou, X.Y.; Zhang, W.; Liu, L.L.; Liu, Y.C.; Lin, K.F. PM2.5, PM10 and health risk assessment of heavy metals in a typical printed circuit noards manufacturing workshop. J. Environ. Sci. 2014, 26, 2018–2026. [Google Scholar] [CrossRef] [PubMed]
  41. Wu, J.L.; Wang, X.; Wang, H.; Gong, D.C.; Yang, J.; Jiang, B.; Zhang, C.L.; Deng, X.J.; Zhou, L.; Wang, B. Rapidly alleviating particulate matter Pollution while maintaining high-speed economic development in the “world’s factory”. J. Clean. Prod. 2020, 266, 121844. [Google Scholar] [CrossRef]
  42. Ravi, K.; Kuldeep, L.; Avinash, R. Role of zero emission vehicles in sustainable transformation of the Indian automobile industry. Res. Transp. Econ. 2021, 90, 101064. [Google Scholar]
  43. Xiong, L.X.; Ning, J.J.; Wang, J.; Dong, Y.H. Coupling degree evaluation of heavy metal ecological capacity and enterprise digital transformation in river basins. Ecol. Indic. 2021, 133, 108358. [Google Scholar] [CrossRef]
  44. Heidari, M.; Darijani, T.; Alipour, V. Heavy metal Pollution of road dust in a city and its highly Polluted suburb, quantitative source apportionment and source-specific ecological and health risk assessment. Chemosphere 2021, 273, 129656. [Google Scholar] [CrossRef]
  45. Jeong, H.; Choi, J.Y.; Lee, J.Y.; Lim, J.; Ra, K. Heavy metal Pollution by road-deposited sediments and its contribution to total suspended solids in rainfall runoff from intensive industrial areas. Environ. Pollut. 2020, 265, 115028. [Google Scholar] [CrossRef]
  46. Hong, N.A.; Guan, Y.J.; Yang, B.; Zhong, J.; Zhu, P.F.; Sik, Y.; Hou, D.Y.; Tsang, D.C.W.; Guan, Y.; Liu, A. Quantitative source tracking of heavy metals contained in urban road deposited sediments. J. Hazard. Mat 2020, 393, 122362. [Google Scholar] [CrossRef]
  47. Gu, L.; Song, B.; Tong, Z.Q.; Ma, J.H. Spatial Distribution and Potential Ecological Risk Assessment of Heavy Metals in Roadside Soils along the Lianyungang-Horgas Highway. Progress. Geogr. 2012, 31, 632–638. (In Chinese) [Google Scholar] [CrossRef]
  48. Ma, J.H.; Li, J.; Song, B. Contamination and spatial distribution of heavy metals in the soils of different operating sections along the Zhengzhou-Kaifeng highway. Acta. Sci. Circumstantiae 2007, 27, 1734–1743. (In Chinese) [Google Scholar]
  49. Tai, L.Y. Contamination Source Apportionment and Health Risk Assessment of Heavy Metals in Soil Around Waste to Energy Plant; Tianjin University: Tianjin, China, 2017. (In Chinese) [Google Scholar]
  50. Fan, N. Study on Distribution and Concentration Prediction of Heavy Metals in Soil around Coal Fired Power Plants—A Case Study of Power Plant in Maocun, Xuzhou; Nanjing Normal University: Nanjing, China, 2018. (In Chinese) [Google Scholar]
  51. Liu, H.B.; Qu, M.K.; Chen, J.; Guang, X.; Zhang, J.L.; Liu, M.S.; Kang, J.F.; Zhao, Y.C.; Huang, B. Heavy metal accumulation in the surrounding areas affected by mining in China: Spatial distribution patterns, risk assessment, and influencing factors. Sci. Total Environ. 2022, 825, 154004. [Google Scholar] [CrossRef] [PubMed]
  52. Wang, Y.Z.; Duan, X.J.; Wang, L. Spatial distribution and source analysis of heavy metals in soils influenced by industrial enterprise distribution: Case study in Jiangsu Province. Sci. Total Environ. 2020, 710, 134953. [Google Scholar] [CrossRef] [PubMed]
  53. Song, Y.Q.; Kang, L.; Fan, L.; Sun, N.; Aizezi, A.; Yang, Z.K.; Wu, X.Y. Estimating the spatial distribution of soil heavy metals in oil mining area using air quality data. Atmos. Environ. 2022, 287, 119274. [Google Scholar] [CrossRef]
  54. An, S.W.; Liu, N.T.; Li, X.M.; Zeng, S.F.; Wang, X.; Wang, D.Y. Understanding heavy metal accumulation in roadside soils along major roads in the Tibet Plateau. Sci. Total Environ. 2022, 802, 149865. [Google Scholar] [CrossRef]
  55. Yang, S.Y.; David, T.B.; Yang, D.; He, M.J.; Liu, X.M.; Xu, J.M. A synthesis framework using machine learning and spatial bivariate analysis to identify drivers and hotspots of heavy metal Pollution of agricultural soils. Environ. Pollut. 2021, 287, 117611. [Google Scholar] [CrossRef]
  56. Ding, Q.; Cheng, G.; Wang, Y.; Zhuang, D.F. Effects of natural factors on the spatial distribution of heavy metals in soils surrounding mining regions. Sci. Total Environ. 2017, 578, 577–585. [Google Scholar] [CrossRef]
  57. Ranko, D.; Boško, G.; Snežana, D.; Miodrag, Đ.; Milan, Đ.; Nevena, M.; Antonije, O. Assessment of the impact of geographical factors on the spatial distribution of heavy metals in soils around the steel production facility in Smederevo (Serbia). J. Clean. Prod. 2014, 84, 550–562. [Google Scholar]
  58. Lin, L.T.; Chen, Y.; Qu, L.Y.; Zhang, Y.X.; Ma, K.M. Cd heavy metal and plants, rather than soil nutrient conditions, affect soil arbuscular mycorrhizal fungal diversity in green spaces during urbanization. Sci. Total Environ. 2020, 726, 138594. [Google Scholar] [CrossRef]
  59. Alejandra, S.V.; Guillermo, A.; Javier, I.R.; Sara, E.A.; Sonia, R.P.; Bonilla, C.A.; Pablo, P. A comparative study of soil metal concentrations in Chilean urban parks using four Pollution indexes. Appl. Geochem. 2022, 141, 105230. [Google Scholar]
  60. Zhang, B.C.; Jia, T.Z.; Peng, S.Z.; Yu, X.H.; She, D. Spatial distribution, source identification, and risk assessment of heavy metals in the cultivated soil of the Qinghai–Tibet Plateau region: Case study on Huzhu County. Glob. Ecol. Conserv. 2022, 35, e02073. [Google Scholar] [CrossRef]
Figure 1. Map of the study area and sample points.
Ijerph 19 14562 g001
Figure 2. Distribution of the dust sampling sections.
Ijerph 19 14562 g002
Figure 3. Dust heavy metal concentrations around the three factories.
Ijerph 19 14562 g003
Figure 4. PLI values and heavy metal contamination of dust in sampling transects.
Ijerph 19 14562 g004
Figure 5. Spatial distribution of non-carcinogenic and carcinogenic risks for the three factories.
Ijerph 19 14562 g005
Figure 6. Comparison of heavy metal concentrations for three factories and the BCs.
Ijerph 19 14562 g006
Table 1. Statistical description of the dust heavy metal concentrations around the three factories.
ItemsHeavy Metals Concentrations/mg∙kg−1
AsCdCoCrCuHgMnNiPbZn
F1
(n = 18)
Min4.730.214.6934.359.510.040252.8812.9451.2599.07
Max37.791.3715.3668.8943.860.349501.0583.4094.55337.67
Mean10.810.497.6450.9021.650.098364.5530.6569.12184.86
SD8.430.264.059.5510.900.06558.3323.2214.7174.36
CV/%78.0253.9352.9718.7550.3665.7716.0075.7621.2840.23
F2
(n = 18)
Min3.310.163.7724.254.770.018271.609.2821.5051.57
Max5.950.8011.7781.3932.290.098414.1520.3277.55162.77
Mean4.890.325.3745.8117.740.051355.1615.2631.5294.76
SD0.760.161.8018.329.460.02551.163.4612.5431.04
CV/%15.5848.9033.5939.9953.3549.9314.4022.6939.8032.75
F3
(n = 36)
Min0.770.071.829.197.130.010150.156.2710.8317.17
Max9.002.437.6054.4734.440.248470.8329.0166.62193.97
Mean5.440.634.9835.2216.930.061383.5916.3432.9394.46
SD2.100.601.4611.536.340.051105.585.0114.4851.23
CVs/%38.6194.4229.3632.7337.4783.0219.5230.6743.9849.24
Overall 7.040.485.9943.9718.770.22367.7720.7544.52124.69
Beijing [30]4.150.534-85.770.30.20456542.667300
Shanghai [31]9.40.46--132.1---105.6473.5
Guangzhou [32]--6.9064.3102-41123.684.1384
BCsoil [17]4.290.268.1230.0612.180.038311.6512.7716.2434.70
Publisher’s Note: MDPI stays neutral with regard to jurisdictional claims in published maps and institutional affiliations.