
Association between Sedentary Behavior and Cognitive Performance in Middle-Aged and Elderly Adults: Cross-Sectional Results from ELSA-Brasil


 , , ,
, , ,
Abstract
1. Introduction
2. Materials and Methods
2.1. Study Design
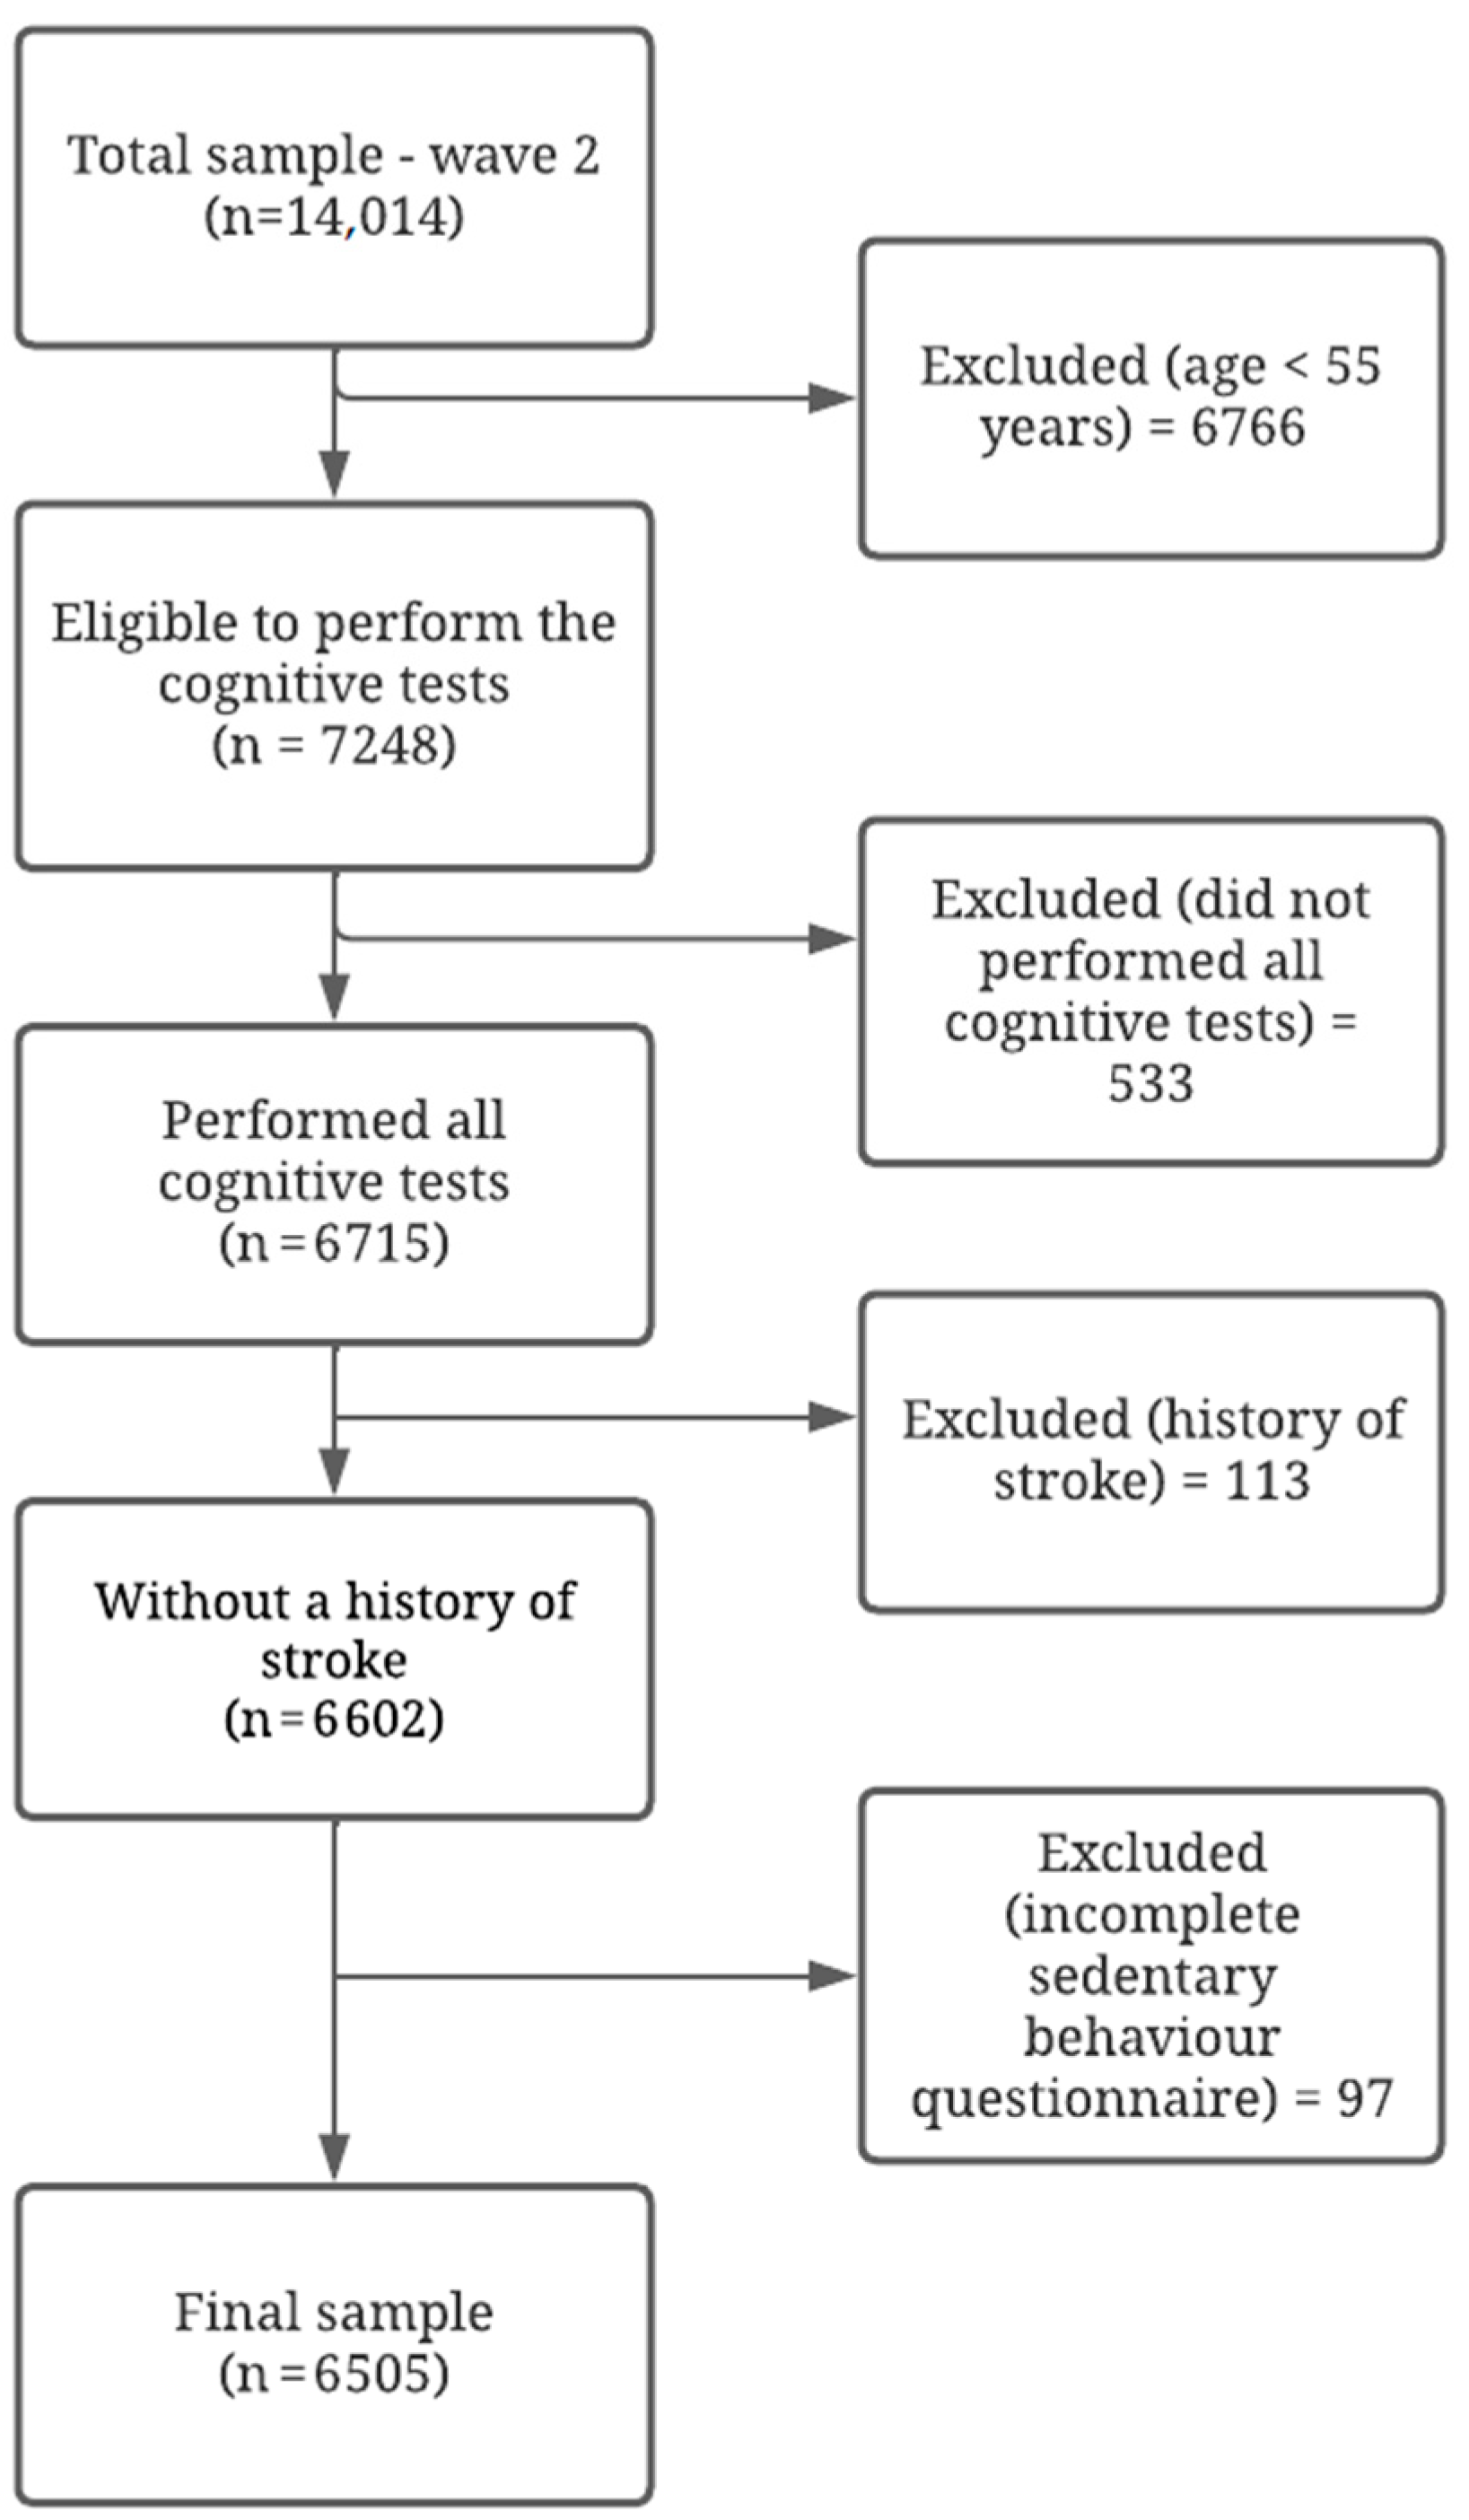
2.2. Sample
2.3. Response Variables
2.4. Exposure Variables
2.5. Co-Variables
2.6. Statistical Analysis
3. Results
3.1. Characteristics of the Sample
3.2. Associations between Sedentary Behaviour and Cognitive Performance
4. Discussion
Strengths and Limitations
5. Conclusions
Supplementary Materials
Author Contributions
Funding
Institutional Review Board Statement
Informed Consent Statement
Data Availability Statement
Conflicts of Interest
References
- Christensen, K.; Doblhammer, G.; Rau, R.; Vaupel, J.W. Aging populations: The challenges ahead. Lancet 2009, 374, 1196–1208. [Google Scholar] [CrossRef]
- Kinsella, K.; He, W. An Aging World: 2008; National Institute on Aging; U.S. Census Bureau: Washington, DC, USA, 2009.
- Kalaria, R.N.; Maestre, G.E.; Arizaga, R.; Friedland, R.P.; Galasko, D.; Hall, K.; Luchsinger, J.A.; Ogunniyi, A.; Perry, E.K.; Potocnik, F.; et al. Alzheimer’s disease and vascular dementia in developing countries: Prevalence, management, and risk factors. Lancet Neurol. 2008, 7, 812–826. [Google Scholar] [CrossRef]
- WHO. Risk Reduction of Cognitive Decline and Dementia: WHO Guidelines; World Health Organization: Geneva, Switzerland, 2019. [Google Scholar]
- Nitrini, R.; Bottino, C.M.; Albala, C.; Custodio Capunay, N.S.; Ketzoian, C.; Llibre Rodriguez, J.J.; Maestre, G.E.; Ramos-Cerqueira, A.T.; Caramelli, P. Prevalence of dementia in Latin America: A collaborative study of population-based cohorts. Int. Psychogeriatr. 2009, 21, 622–630. [Google Scholar] [CrossRef] [PubMed]
- World Alzheimer’s Disease International. WAR (World Alzheimer Report); World Alzheimer’s Disease International: Amsterdam, The Netherlands, 2014. [Google Scholar]
- Shah, R.C.; Janos, A.L.; Kline, J.E.; Yu, L.; Leurgans, S.E.; Wilson, R.S.; Wei, P.; Bennett, D.A.; Heilman, K.M.; Tsao, J.W. Cognitive decline in older persons initiating anticholinergic medications. PLoS ONE 2013, 8, e64111. [Google Scholar] [CrossRef] [PubMed]
- Farfel, J.M.; Nitrini, R.; Suemoto, C.K.; Grinberg, L.T.; Ferretti, R.E.L.; Leite, R.E.P.; Tampellini, E.; Lima, L.; Farias, D.S.; Neves, R.C.; et al. Very low levels of education and cognitive reserve: A clinicopathologic study. Neurology 2013, 81, 650–657. [Google Scholar] [CrossRef]
- Araújo, L.F.; Giatti, L.; Chor, D.; Passos, V.M.; Barreto, S.M. Maternal education, anthropometric markers of malnutrition and cognitive function (ELSA-Brasil). BMC Public Health 2014, 14, 673. [Google Scholar] [CrossRef]
- Teixeira, M.M.; Passos, V.; Barreto, S.M.; Schmidt, M.I.; Duncan, B.B.; Beleigoli, A.M.; Fonseca, M.J.M.; Vidigal, P.G.; Araújo, L.F.; Diniz, M.d.F.H.S. Association between diabetes and cognitive function at baseline in the Brazilian Longitudinal Study of Adult Health (ELSA-Brasil). Sci. Rep. 2020, 10, 1596. [Google Scholar] [CrossRef]
- Menezes, S.T.; Giatti, L.; Brant, L.C.C.; Griep, R.H.; Schmidt, M.I.; Duncan, B.B.; Suemoto, C.K.; Ribeiro, A.L.P.; Barreto, S.M. Hypertension, Prehypertension, and Hypertension Control: Association with decline in cognitive performance in the ELSA-Brasil Cohort. Hypertension 2021, 77, 672–681. [Google Scholar] [CrossRef]
- Suemoto, C.K.; Szlejf, C.; Santos, I.S.; Brunoni, A.R.; Goulart, A.C.; Bertola, L.; Bittencourt, M.S.; Viana, M.C.; Barreto, S.M.; Lotufo, P.A.; et al. Ideal vascular health and cognitive performance in the Brazilian Longitudinal Study of Adult Health. Eur. J. Neurol. 2021, 28, 71–80. [Google Scholar] [CrossRef]
- Baena, C.P.; Goulart, A.C.; Santos, I.S.; Suemoto, C.K.; Lotufo, P.A.; Bensenor, I.J. Migraine and cognitive function: Baseline findings from the Brazilian Longitudinal Study of Adult Health: ELSA-Brasil. Cephalalgia 2018, 38, 1525–1534. [Google Scholar] [CrossRef]
- Szlejf, C.; Suemoto, C.K.; Lotufo, P.A.; Benseñor, I.M. Association of sarcopenia with performance on multiple cognitive domains: Results from the ELSA-Brasil Study. J. Gerontol. A Biol. Sci. Med. Sci. 2019, 74, 1805–1811. [Google Scholar] [CrossRef] [PubMed]
- Cooper, C.; Sommerlad, A.; Lyketsos, C.G.; Livingston, G. Modifiable predictors of dementia in mild cognitive impairment: A systematic review and meta- analysis. Am. J. Psychiatry 2015, 172, 323–334. [Google Scholar] [CrossRef] [PubMed]
- Lautenschlager, N.T.; Cox, K.L.; Flicker, L.; Foster, J.K.; Van Bockxmeer, F.M.; Xiao, J.; Greenop, K.R.; Almeida, O.P. Effect of physical activity on cognitive function in older adults at risk for Alzheimer disease: A randomized trial. JAMA 2008, 300, 1027–1037. [Google Scholar] [CrossRef]
- Falck, R.S.; Davis, J.C.; Liu-Ambrose, T. What is the association between sedentary behaviour and cognitive function? A systematic review. Br. J. Sports Med. 2017, 51, 800–811. [Google Scholar] [CrossRef] [PubMed]
- Tremblay, M.S.; Aubert, S.; Barnes, J.D.; Saunders, T.J.; Carson, V.; Latimer-Cheung, A.E.; Chastin, S.F.M.; Altenburg, T.M.; Chinapaw, M.J.M. Sedentary Behavior Research Network 53 (SBRN)—Terminology consensus project process and outcome. Int. J. Behav. Nutr. Phys. Act. 2017, 14, 75. [Google Scholar] [CrossRef]
- Maasakkers, C.M.; Claassen, J.; Gardiner, P.A.; Rikkert, M.G.M.; Lipnicki, D.M.; Scarmeas, N.; Dardiotis, F.; Yannakoulia, M.; Anstey, K.J.; Cherbuin, N.; et al. The Association of Sedentary Behaviour and Cognitive Function in people without dementia: A coordinated analysis across five cohort studies from COSMIC. Sports Med. 2020, 50, 403–413. [Google Scholar] [CrossRef] [PubMed]
- Aquino, E.M.; Barreto, S.M.; Bensenor, I.M.; Carvalho, M.S.; Chor, D.; Duncan, B.B.; Lotufo, P.A.; Mill, J.G.; Molina, M.D.C.; Mota, E.L.A.; et al. Brazilian Longitudinal Study of Adult Health (ELSA-Brasil): Objectives and design. Am. J. Epidemiol. 2012, 175, 315–324. [Google Scholar] [CrossRef]
- Schmidt, M.I.; Duncan, B.B.; Mill, J.G.; Lotufo, P.A.; Chor, D.; Barreto, S.M.; Aquino, E.M.; Passos, V.M.; Matos, S.M.; Molina, M.C.; et al. Cohort profile: Longitudinal Study of Adult Health (ELSA-Brasil). Int. J. Epidemiol. 2015, 44, 68–75. [Google Scholar] [CrossRef]
- Bertolucci, P.H.F.; Okamoto, I.H.; Neto, J.T.; Ramos, L.R.; Brucki, S.M.D. Desempenho da população brasileira na bateria neuropsicológica do Consortium to Establish a Registry for Alzheimer’s Disease (CERAD). Rev. Psiquiatr. Clín. 1998, 25, 80. [Google Scholar] [CrossRef]
- Morris, J.C.; Mohs, R.C.; Rogers, H.; Fillenbaum, G.; Heyman, A. Consortium to establish a registry for Alzheimer’s disease (CERAD) clinical and neuropsychological assessment of Alzheimer’s disease. Psychopharmacol. Bull. 1988, 24, 641–652. [Google Scholar]
- Lezak, M.D. Neuropsychological Assessment; Oxford University Press: Cary, NC, USA, 2004. [Google Scholar]
- Batista, J.A.; Giatti, L.; Barreto, S.M.; Galery, A.R.P.; Passos, V.M.A. Reliability of cognitive tests of ELSA-Brasil, the brazilian longitudinal study of adult health. Dement. Neuropsychol. 2013, 7, 367–373. [Google Scholar] [CrossRef][Green Version]
- Chor, D.; Alves, M.G.; Giatti, L.; Cade, N.V.; Nunes, M.A.; Molina, M.C.; Benseñor, I.M.; Aquino, E.M.; Passos, V.; Santos, S.M.; et al. Questionnaire development in ELSA-Brasil: Challenges of a multidimensional instrument. Rev. Saude Publica 2013, 47, 27–36. [Google Scholar] [CrossRef] [PubMed]
- Passos, V.M.; Caramelli, P.; Benseñor, I.; Giatti, L.; Barreto, S.M. Methods of cognitive function investigation in the Longitudinal Study on Adult Health (ELSA-Brasil). Sao Paulo Med. J. 2014, 132, 170–177. [Google Scholar] [CrossRef] [PubMed]
- Bensenor, I.M.; Griep, R.H.; Pinto, K.A.; Faria, C.P.; Felisbino-Mendes, M.; Caetano, E.I.; Albuquerque, L.S.; Schmidt, M.I. Routines of organization of clinical tests and interviews in the ELSA-Brasil investigation center. Rev. Saude Publica 2013, 47, 37–47. [Google Scholar] [CrossRef] [PubMed]
- Santos, S.M.; Griep, R.H.; Cardoso, L.O.; Alves MG, D.M.; Fonseca MD JM, D.; Giatti, L.; Chor, D. Adaptação transcultural e confiabilidade de medidas de características autorreferidas de vizinhança no ELSA-Brasil. Rev. Saude Publica 2013, 47, 122–130. [Google Scholar] [CrossRef]
- Faleiro, J.C.; Giatti, L.; Barreto, S.M.; Camelo LD, V.; Griep, R.H.; Guimarães, J.; da Fonseca, M.d.J.M.; Chor, D.; da Conceição Almeida Chagas, M. Posição socioeconômica no curso de vida e comportamentos de risco relacionados à saúde: ELSA-Brasil. Cad. Saúde Pública 2017, 33, e00017916. [Google Scholar] [CrossRef]
- Machado, A.F.; Oliveira, A.M.H.C.; Antigo, M.F. Tipologias Ocupacionais Aplicadas à Análise Socioeconomica da Amostra Elsa (1a Onda); Relatório Técnico Projeto ELSA; CEDEPLAR, UFMG: Belo Horizonte, Brazil, 2013. [Google Scholar]
- Matsudo, S.; Araújo, T.; Marsudo, V.; Andrade, D.; Andrade, E.; Braggion, G. Questionário internacional de atividade física (IPAQ): Estudo de validade e reprodutibilidade no Brasil. Rev. Bras. Ativ. Fís. Saúd. 2001, 6, 5–18. [Google Scholar]
- Nunes, M.A.; Alves, M.G.M.; Chor, D.; Schmidt, M.I.; Duncan, B.B. Adaptação transcultural do CIS-R (Clinical Interview Schedule- Revised version) para o português no Estudo Longitudinal de Saúde do Adulto (ELSA). Rev. HCPA 2011, 31, 515–518. [Google Scholar]
- Kesse-Guyot, E.; Charreire, H.; Andreeva, V.A.; Touvier, M.; Hercberg, S.; Galan, P.; Oppert, J.M. Cross-sectional and longitudinal associations of diferent sedentary behaviors with cognitive performance in older adults. PLoS ONE 2012, 7, e47831. [Google Scholar] [CrossRef]
- Vance, D.E.; Wadley, V.G.; Ball, K.K.; Roenker, D.L.; Rizzo, M. The effects of physical activity and sedentary behavior on cognitive health in older adults. J. Aging Phys. Act. 2005, 13, 294–313. [Google Scholar] [CrossRef]
- Čukić, I.; Shaw, R.; Der, G.; Chastin, S.F.; Dontje, M.L.; Gill, J.M.; Starr, J.M.; Skelton, D.A.; Radaković, R.; Cox, S.R.; et al. Cognitive ability does not predict objectively measured sedentary behavior: Evidence from three older cohorts. Psychol. Aging 2018, 33, 288–296. [Google Scholar] [CrossRef] [PubMed]
- Rosenberg, D.E.; Bellettiere, J.; Gardiner, P.A.; Villarreal, V.N.; Crist, K.; Kerr, J. Independent Associations between Sedentary Behaviors and Mental, Cognitive, Physical, and Functional Health Among Older Adults in Retirement Communities. J. Gerontol. A Biol. Sci. Med. Sci. 2016, 71, 78–83. [Google Scholar] [CrossRef] [PubMed]
- Magnon, V.; Vallet, G.T.; Auxiette, C. Sedentary Behavior at Work and Cognitive Functioning: A Systematic Review. Front. Public Health 2018, 6, 239. [Google Scholar] [CrossRef]
- Olanrewaju, O.; Stockwell, S.; Stubbs, B.; Smith, L. Sedentary behaviours, cognitive function, and possible mechanisms in older adults: A systematic review. Aging Clin. Exp. Res. 2020, 32, 969–984. [Google Scholar] [CrossRef]
- Bakrania, K.; Edwardson, C.L.; Khunti, K.; Bandelow, S.; Davies, M.J.; Yates, T. Associations between sedentary behaviors and cognitive function: Cross-sectional and prospective findings from the UK biobank. Am. J. Epidemiol. 2018, 187, 441–454. [Google Scholar] [CrossRef] [PubMed]
- Hallgren, M.; Dunstan, D.; Owen, F.N. Passive versus Mentally Active Sedentary Behaviors and Depression. Exerc. Sport Sci. Rev. 2019, 48, 20–27. [Google Scholar] [CrossRef]
- Kurita, S.; Doi, T.; Tsutsumimoto, K.; Hotta, R.; Nakakubo, S.; Kim, M.; Shimada, H. Cognitive activity in a sitting position is protectively associated with cognitive impairment among older adults. Geriatr. Gerontol. Int. 2019, 19, 98–102. [Google Scholar] [CrossRef]
- Kikuchi, H.; Inoue, S.; Sugiyama, T.; Owen, N.; Oka, K.; Nakaya, T.; Shimomitsu, T. Distinct associations of different sedentary behaviors with health- related attributes among older adults. Prev. Med. 2014, 67, 335–339. [Google Scholar] [CrossRef]
- Tombaugh, T.N. Trail Making Test A and B: Normative data stratified by age and education. Arch. Clin. Neuropsychol. 2004, 19, 203–214. [Google Scholar] [CrossRef]
- de Azeredo Passos, V.M.; Giatti, L.; Bensenor, I.; Tiemeier, H.; Ikram, M.A.; de Figueiredo, R.C.; Schmidt, M.I.; Barreto, S.M. Education plays a greater role than age in cognitive test performance among participants of the Brazilian Longitudinal Study of Adult Health (ELSA-Brasil). BMC Neurol. 2015, 15, 191. [Google Scholar] [CrossRef]
- Stern, Y. Cognitive reserve. Neuropsychologia 2009, 47, 2015–2028. [Google Scholar] [CrossRef] [PubMed]
- Wallmann-Sperlich, B.; Bucksch, J.; Schneider, S.; Froboese, I. Socio-demographic, behavioural and cognitive correlates of work-related sitting time in German men and women. BMC Public Health 2014, 14, 1259. [Google Scholar] [CrossRef] [PubMed]
- Plotnikoff, R.C.; Costigan, S.A.; Short, C.; Grunseit, A.; James, E.; Johnson, N.; Bauman, A.; D’Este, C.; van der Ploeg, H.P.; Rhodes, R.E. Factors associated with higher sitting time in general, chronic disease, and psychologically-distressed, adult populations: Findings from the 45 & up study. PLoS ONE 2015, 10, e0127689. [Google Scholar] [CrossRef]
- Mielke, G.I.; Silva, I.C.; Owen, N.; Hallal, P.C. Brazilian adults’ sedentary behaviors by life domain: Population-based study. PLoS ONE 2014, 9, e91614. [Google Scholar] [CrossRef] [PubMed]
- Hyde, J.S. Sex and cognition: Gender and cognitive functions. Curr. Opin. Neurobiol. 2016, 38, 53–56. [Google Scholar] [CrossRef] [PubMed]
- Pitanga, F.J.G.; Matos, S.M.A.; Almeida, M.D.C.C.; Patrão, A.L.; Molina, M.D.C.B.; Aquino, E.M. Association between leisure-time physical activity and sedentary behavior with cardiometabolic health in the ELSA-Brasil participants. SAGE Open Med. 2019, 7, 2050312119827089. [Google Scholar] [CrossRef] [PubMed]
- Brasil, Ministério da Saúde, Secretaria de Ciência, Tecnologia e Insumos Estratégicos, Departamento de Ciência e Tecnologia. ELSA Brasil: Maior estudo epidemiológico da América Latina. Rev. Saude Publica 2009, 43, 1. [Google Scholar] [CrossRef]
- Chastin, S.F.M.; Palarea-Albaladejo, J.; Dontje, M.L.; Skelton, D.A. Combined effects of time spent in physical activity, sedentary behavior and sleep on adiposity and cardiometabolic health markers: A novel compositional data analysis approach. PLoS ONE 2015, 10, e0139984. [Google Scholar] [CrossRef]


| Total | Men | Women | p Value | |
|---|---|---|---|---|
| Age (years) | n = 6505 | n = 2915 | n = 3590 | 0.001 ‡ |
| 61 (58–66) ¥ | 62 (58–67) ¥ | 61 (58–66) ¥ | ||
| Schooling, n (%) | n = 6505 | n = 2915 | n = 3590 | |
| Incomplete elementary school | 355 (5.5%) | 215 (60.6%) | 140 (39.4%) | <0.001 £ |
| Complete elementary school | 517 (7.9%) | 263 (50.9%) | 254 (49.1%) | |
| High school | 1846 (28.4%) | 759 (41.1%) | 1087 (58.9%) | |
| Higher education | 3787 (58.2%) | 1678 (44.3%) | 2109 (55.7%) | |
| Race/skin colour, n (%) | n = 6415 | n = 2866 | n = 3549 | |
| Black | 923 (14.4%) | 344 (37.3%) | 579 (62.7%) | <0.001 £ |
| Brown | 1633 (25.5%) | 737 (45.1%) | 896 (54.9%) | |
| White | 3597 (56.1%) | 1685 (46.8%) | 1912 (53.2%) | |
| Yellow | 192 (3.0%) | 69 (35.9%) | 123 (64.1%) | |
| Indigenous | 70 (1.1%) | 31 (44.3%) | 39 (55.7%) | |
| Socioeconomic position, n (%) | n = 6381 | n = 2868 | n = 3513 | |
| High | 2615 (41.0%) | 1335 (51.1%) | 1280 (48.9%) | <0.001 £ |
| Medium | 2256 (35.4%) | 792 (35.1%) | 1464 (64.9%) | |
| Low | 1510 (23.7%) | 741 (49.1%) | 769 (50.9%) | |
| Marital status, n (%) | n = 6505 | n = 2915 | n = 3590 | |
| Married/stable union | 3935 (60.5%) | 2371 (60.3%) | 1564 (39.7%) | <0.001 £ |
| Divorced | 1157 (17.8%) | 320 (27.7%) | 837 (72.3%) | |
| Widower | 515 (7.9%) | 66 (12.8%) | 449 (87.2%) | |
| Single | 857 (13.2%) | 142 (16.6%) | 715 (83.4%) | |
| Other | 41 (0.6%) | 16 (39.0%) | 25 (61.0%) | |
| Occupation, n (%) | n = 6381 | n = 2868 | n = 3513 | |
| Academic | 2783 (43.6%) | 1357 (48.8%) | 1426 (51.2%) | <0.001 £ |
| Administrative | 2667 (41.8%) | 894 (33.5%) | 1773 (66.5%) | |
| Operational | 931 (14.6%) | 617 (66.3%) | 314 (33.7%) | |
| Activity status, n (%) | n = 4218 | n = 2085 | n = 2133 | |
| Active | 3279 (77.7%) | 1667 (50.8%) | 1612 (49.2%) | <0.001 £ |
| Retired | 939 (22.3%) | 418 (44.5%) | 521 (55.6%) | |
| Hypertension, n (%) | n = 6498 | n = 2910 | n = 3588 | |
| No | 3158 (48.6%) | 1254 (39.7%) | 1904 (60.3%) | <0.001 £ |
| Yes | 3340 (51.4%) | 1656 (49.6%) | 1684 (50.5%) | |
| Diabetes type 2, n (%) | n = 6480 | n = 2898 | n = 3582 | |
| No | 5498 (84.8%) | 2392 (43.5%) | 3106 (56.5%) | <0.001 £ |
| Yes | 982 (15.2%) | 506 (51.5%) | 476 (48.5%) | |
| Depressive symptoms, n (%) | n = 6504 | n = 2915 | n = 3589 | |
| No | 5638 (86.7%) | 2655 (47.1%) | 2983 (52.9%) | <0.001 £ |
| Yes | 866 (13.3%) | 260 (30.0%) | 606 (70.0%) | |
| BMI (kg/m2) | n = 6485 | n = 2908 | n = 3577 | 0.002 ‡ |
| 26.98 (24.33–30.21) ¥ | 26.81 (24.48–29.61) ¥ | 27.13 (24.19–30.76) ¥ | ||
| Self-perception of health, n (%) | n = 6501 | n = 2912 | n = 3589 | |
| Very good | 1858 (28.6%) | 751 (40.4%) | 1107 (59.6%) | <0.001 £ |
| Good | 3343 (51.4%) | 1581 (47.3%) | 1762 (52.7%) | |
| Regular | 1190 (18.3%) | 542 (45.5%) | 648 (54.5%) | |
| Bad | 88 (1.4%) | 34 (38.6%) | 54 (61.4%) | |
| Very bad | 22 (0.3%) | 4 (18.2%) | 18 (81.8%) | |
| Excessive alcohol consumption, n (%) | n = 6502 | n = 2914 | n = 3588 | |
| No | 5957 (91.6%) | 2522 (42.3%) | 3435 (57.7%) | <0.001 £ |
| Yes | 545 (8.4%) | 392 (71.9%) | 153 (28.1%) | |
| Smoking, n (%) | n = 6504 | n = 2914 | n = 3590 | |
| Never | 3366 (51.8%) | 1243 (36.9%) | 2123 (63.1%) | <0.001 £ |
| Former | 2491 (38.3%) | 1367 (54.9%) | 1124 (45.1%) | |
| Current | 647 (9.9%) | 304 (47.0%) | 343 (53.0%) | |
| Physical Activity, n (%) | n = 6505 | n = 2915 | n = 3590 | |
| Insufficiently active | 3239 (49.8%) | 1371 (42.3%) | 1868 (57.7%) | <0001 |
| Active | 3266 (50.2%) | 1544 (47.3%) | 1722 (52.7%) | |
| Sleep (hours/day) | n = 6499 | n = 2914 | n = 3590 | 0.617 ‡ |
| 6 (6–7) ¥ | 6 (6–7) ¥ | 6 (6–8) ¥ | ||
| 8 (7–10) ¥ | 8 (7–9) ¥ | 8 (7–10) ¥ | ||
| Cognitive performance—memory * | n = 6505 | n = 2915 | n = 3590 | |
| 38 (33–42) ¥ | 36 (32–40) ¥ | 39 (35–43) ¥ | <0.001 ‡ | |
| Cognitive performance—language ** | n = 6505 | n = 2915 | n = 3590 | |
| 28.28 (8.28) § | 26.98 (8.25) § | 29.33 (8.15) § | <0.001 # | |
| Cognitive performance—executive function *** | n = 6505 | n = 2915 | n = 3590 | |
| 109 (81–157) ¥ | 110 (81–164) ¥ | 108 (80–152) ¥ | 0.029 ‡ | |
| Sitting time—weekdays (hours/day) | n = 6505 | n = 2915 | n = 3590 | |
| 2.44 (1.75) § | 2.47 (1.75) § | 2.41 (1.75) § | <0.001 # | |
| Sitting time—weekends (hours/day) | n = 6505 | n = 2915 | n = 3590 | |
| 4 (2.5–6) ¥ | 4 (3–6) ¥ | 4 (2–6) ¥ | <0.001 ‡ | |
| Leisure screen time—weekdays (hours/day) | n = 6505 | n = 2915 | n = 3590 | |
| 2.98 (2.08) § | 5.84 (3.30) § | 5.30 (3.27) § | 0.169 # | |
| Leisure screen time—weekends (hours/day) | n = 6505 | n = 2915 | n = 3590 | |
| 5.54 (3.29) § | 3.11 (2.08) § | 2.87 (8.07) § | <0.001 # | |
| Occupational screen time—weekdays (hours/day) | n = 6505 | n = 2915 | n = 3590 | |
| 2 (0–6) ¥ | 3 (0.5–6) ¥ | 2 (0–6) ¥ | <0.001 ‡ | |
| Occupational screen time—weekends (hours/day) | n = 6505 | n = 2915 | n = 3590 | |
| 0 (0–2) ¥ | 1 (0–2) ¥ | 0 (0–2) ¥ | <0.001 ‡ |
| Model 1 | Model 2 | Model 3 | ||||
|---|---|---|---|---|---|---|
| β (IC95%) a | p Value | β (IC95%) a | p Value | β (IC95%) a | p Value | |
| Men | ||||||
| Memory * | ||||||
| Sitting time (weekdays) | 0.40 (0.33; 0.47) | <0.001 | 0.38 (0.31; 0.45) | <0.001 | 0.12 (0.05; 0.20) | 0.001 |
| Sitting time (weekends) | 0.28 (0.21; 0.36) | <0.001 | 0.29 (0.21; 0.36) | <0.001 | 0.10 (0.03; 0.17) | 0.007 |
| Leisure screen time (weekdays) | −0.18 (−0.32; −0.05) | 0.008 | −0.15 (−0.29; −0.02) | 0.022 | −0.02 (−0.14; 0.11) | 0.817 |
| Leisure screen time (weekends) | 0.05 (−0.06; 0.17) | 0.357 | 0.02 (−0.09; 0.14) | 0.663 | 0.04 (−0.07; 0.14) | 0.498 |
| Occupational screen time (weekdays) | 0.50 (0.43; 0.58) | <0.001 | 0.45 (0.38; 0.52) | <0.001 | 0.10 (0.02; 0.18) | 0.014 |
| Occupational screen time (weekends) | 0.35 (0.22; 0.47) | <0.001 | 0.31 (0.19; 0.43) | <0.001 | −0.04 (−0.15; 0.07) | 0.498 |
| Language ** | ||||||
| Sitting time (weekdays) | 0.71 (0.62; 0.80) | <0.001 | 0.70 (0.61; 0.79) | <0.001 | 0.22 (0.13; 0.31) | <0.001 |
| Sitting time (weekends) | 0.51 (0.41; 0.62) | <0.001 | 0.51 (0.41; 0.62) | <0.001 | 0.13 (0.04; 0.23) | 0.006 |
| Leisure screen time (weekdays) | −0.18 (−0.35; −0.01) | 0.044 | −0.16 (−0.33; 0.01) | 0.060 | 0.06 (−0.09; 0.21) | 0.422 |
| Leisure screen time (weekends) | 0.10 (−0.04; 0.24) | 0.155 | 0.09 (−0.05; 0.23) | <0.001 | 0.09 (−0.03; 0.22) | 0.152 |
| Occupational screen time (weekdays) | 0.72 (0.62; 0.82) | <0.001 | 0.71 (0.61; 0.82) | <0.001 | 0.01 (−0.10; 0.11) | 0.924 |
| Occupational screen time (weekends) | 0.65 (0.49; 0.82) | <0.001 | 0.64 (0.47; 0.81) | <0.001 | 0.01 (−0.13; 0.15) | 0.851 |
| Executive *** | ||||||
| Sitting time (weekdays) | −0.06 (−0.06; −0.05) | <0.001 | −0.06 (−0.06; −0.05) | <0.001 | −0.02 (−0.03; −0.02) | <0.001 |
| Sitting time (weekends) | −0.04 (−0.05; −0.04) | <0.001 | −0.04 (−0.05; −0.04) | <0.001 | −0.01 (−0.02; −0.01) | <0.001 |
| Leisure screen time (weekdays) | 0.02 (0.01; 0.03) | 0.004 | 0.02 (0.00; 0.03) | 0.007 | −0.00 (−0.01; 0.01) | 0.819 |
| Leisure screen time (weekends) | −0.01 (−0.02; −0.00) | 0.012 | −0.01 (−0.02; −0.00) | 0.022 | −0.01 (−0.02; −0.00) | 0.004 |
| Occupational screen time (weekdays) | −0.07 (−0.07; −0.06) | <0.001 | −0.07 (−0.07; −0.06) | <0.001 | −0.02 (−0.02; −0.01) | <0.001 |
| Occupational screen time (weekends) | −0.06 (−0.07; −0.05) | <0.001 | −0.06 (−0.07; −0.04) | <0.001 | −0.01 (−0.02; 0.00) | 0.076 |
| Women | ||||||
| Memory * | ||||||
| Sitting time (weekdays) | 0.37 (0.31; 0.43) | <0.001 | 0.32 (0.26; 0.38) | <0.001 | 0.12 (0.06; 0.17) | <0.001 |
| Sitting time (weekends)) | 0.25 (0.19; 0.32) | <0.001 | 0.24 (0.17; 0.31) | <0.001 | 0.07 (−0.00; 0.13) | 0.053 |
| Leisure screen time (weekdays) | −0.03 (−0.13; 0.08) | 0.645 | 0.04 (−0.07; 0.14) | 0.497 | 0.08 (−0.02; 0.19) | 0.110 |
| Leisure screen time (weekends) | 0.04 (−0.06; 0.13) | 0.437 | 0.02 (−0.07; 0.11) | 0.649 | 0.05 (−0.04; 0.14) | 0.325 |
| Occupational screen time (weekdays) | 0.39 (0.33; 0.45) | <0.001 | 0.31 (0.25; 0.37) | <0.001 | 0.06 (0.00; 0.12) | 0.048 |
| Occupational screen time (weekends) | 0.49 (0.39; 0.59) | <0.001 | 0.42 (0.32; 0.52) | <0.001 | 0.08 (−0.01; 0.18) | 0.081 |
| Language ** | ||||||
| Sitting time (weekdays) | 0.65 (0.57; 0.73) | <0.001 | 0.63 (0.54; 0.71) | <0.001 | 0.23 (0.15; 0.31) | <0.001 |
| Sitting time (weekends) | 0.56 (0.46; 0.67) | <0.001 | 0.55 (0.45; 0.66) | <0.001 | 0.21 (0.11; 0.30) | <0.001 |
| Leisure screen time (weekdays) | −0.05 (−0.21; 0.11) | 0.553 | −0.00 (−0.16; 0.15) | 0.972 | 0.01 (−0.13; 0.16) | 0.852 |
| Leisure screen time (weekends) | 0.16 (0.03; 0.30) | 0.018 | 0.15 (0.02; 0.29) | 0.026 | 0.13 (0.01; 0.25) | 0.035 |
| Occupational screen time (weekdays) | 0.63 (0.55; 0.72) | <0.001 | 0.61 (0.52; 0.70) | <0.001 | 0.15 (0.06; 0.24) | 0.001 |
| Occupational screen time (weekends) | 0.84 (0.68; 1.01) | <0.001 | 0.80 (0.63; 0.97) | <0.001 | 0.17 (0.02; 0.33) | 0.027 |
| Executive *** | ||||||
| Sitting time (weekdays) | −0.05 (−0.06; −0.05) | <0.001 | −0.05 (−0.05; −0.04) | <0.001 | −0.02 (−0.03; −0.02) | <0.001 |
| Sitting time (weekends) | −0.05 (−0.05; −0.04) | <0.001 | −0.04 (−0.05; −0.04) | <0.001 | −0.02 (−0.03; −0.01) | <0.001 |
| Leisure screen time (weekdays) | −0.00 (−0.01; 0.01) | 0.403 | −0.01 (−0.02; −0.00) | 0.050 | −0.01 (−0.02; −0.00) | 0.022 |
| Leisure screen time (weekends) | −0.02 (−0.03; −0.01) | <0.001 | −0.02 (−0.03; −0.01) | 0.001 | −0.02 (−0.03; −0.01) | <0.001 |
| Occupational screen time (weekdays) | −0.05 (−0.06; −0.05) | <0.001 | −0.05 (−0.05; −0.04) | <0.001 | −0.02 (−0.02; −0.01) | <0.001 |
| Occupational screen time (weekends) | −0.06 (−0.07; −0.05) | <0.001 | −0.06 (−0.07; −0.05) | <0.001 | −0.01 (−0.02; −0.00) | 0.008 |
Publisher’s Note: MDPI stays neutral with regard to jurisdictional claims in published maps and institutional affiliations. |
© 2022 by the authors. Licensee MDPI, Basel, Switzerland. This article is an open access article distributed under the terms and conditions of the Creative Commons Attribution (CC BY) license (https://creativecommons.org/licenses/by/4.0/).
Share and Cite
Moreira, P.d.A.; Matos, S.M.A.d.; Pitanga, F.J.G.; Giatti, L.; Barreto, S.M.; Harter Griep, R.; Almeida, M.d.C.C.d.; Santos, C.A.d.S.T. Association between Sedentary Behavior and Cognitive Performance in Middle-Aged and Elderly Adults: Cross-Sectional Results from ELSA-Brasil. Int. J. Environ. Res. Public Health 2022, 19, 14234. https://doi.org/10.3390/ijerph192114234
Moreira PdA, Matos SMAd, Pitanga FJG, Giatti L, Barreto SM, Harter Griep R, Almeida MdCCd, Santos CAdST. Association between Sedentary Behavior and Cognitive Performance in Middle-Aged and Elderly Adults: Cross-Sectional Results from ELSA-Brasil. International Journal of Environmental Research and Public Health. 2022; 19(21):14234. https://doi.org/10.3390/ijerph192114234
Chicago/Turabian StyleMoreira, Pricilla de Almeida, Sheila Maria Alvim de Matos, Francisco José Gondim Pitanga, Luana Giatti, Sandhi Maria Barreto, Rosane Harter Griep, Maria da Conceição Chagas de Almeida, and Carlos Antônio de Souza Teles Santos. 2022. "Association between Sedentary Behavior and Cognitive Performance in Middle-Aged and Elderly Adults: Cross-Sectional Results from ELSA-Brasil" International Journal of Environmental Research and Public Health 19, no. 21: 14234. https://doi.org/10.3390/ijerph192114234
APA StyleMoreira, P. d. A., Matos, S. M. A. d., Pitanga, F. J. G., Giatti, L., Barreto, S. M., Harter Griep, R., Almeida, M. d. C. C. d., & Santos, C. A. d. S. T. (2022). Association between Sedentary Behavior and Cognitive Performance in Middle-Aged and Elderly Adults: Cross-Sectional Results from ELSA-Brasil. International Journal of Environmental Research and Public Health, 19(21), 14234. https://doi.org/10.3390/ijerph192114234