



Impacts of Social Inequality, Air Pollution, Rural–Urban Divides, and Insufficient Green Space on Residents’ Health in China: Insight from Chinese General Social Survey Data Analysis


Abstract
1. Introduction
2. Material and Methods
2.1. Data Sources
2.2. Variable Selection
2.3. Statistical Description
2.4. Model Setting
3. Empirical Analysis
3.1. Coupled Relationships between Social Inequality, Air Pollution, Lack of Green Space, and Health
3.1.1. Age
3.1.2. Annual Income
3.1.3. Number of Family Members
3.1.4. Marriage
3.1.5. Education
3.1.6. Mode of Travel
3.1.7. Exercise Frequency
3.1.8. Air Quality (Air Pollution)
3.1.9. Housing Area Per Capita
4. Results
4.1. Modeling Results
4.2. Interpretation of Model Variables
5. Discussion
5.1. Analysis of the Mechanism of the Impact of Environmental Pollution on the Health Level of the Population
5.1.1. Subjective and Objective Air Pollution
5.1.2. Insufficient Green Space
5.1.3. Food Contamination (Food Safety)
5.2. Analysis of the Mechanisms of Socioeconomic Inequalities and Urban–Rural Differences on the Health Level of the Population
5.3. Analysis of the Mechanism of Activity Preference and Travel Behavior on the Health Level of the Population Activity Preferences and Travel Behavior Directly Affect Health
5.4. An Important Strategy to Improve the Health of the Population
5.4.1. Positive Realization of the Healthy City Plan
5.4.2. Enhancing the Scale and Accessibility of Blue-Green Spaces
5.4.3. Scientific Mechanisms for Physical Exercise
5.4.4. Bridging the Gap between Urban and Rural Areas and Increasing Residents’ Incomes
6. Conclusions
- (1)
- Significant heterogeneity was observed between subjective and objective air pollution. The correlation coefficient between subjective and objective air pollution was small and the internal association between the two was insignificant. The significance of the subjective and objective air pollution variables in the logistic model was different, with the subjective variables being significant, whereas the objective variables were excluded from the model variables. Thus, subjective air pollution has a more significant influence on the residents’ health.
- (2)
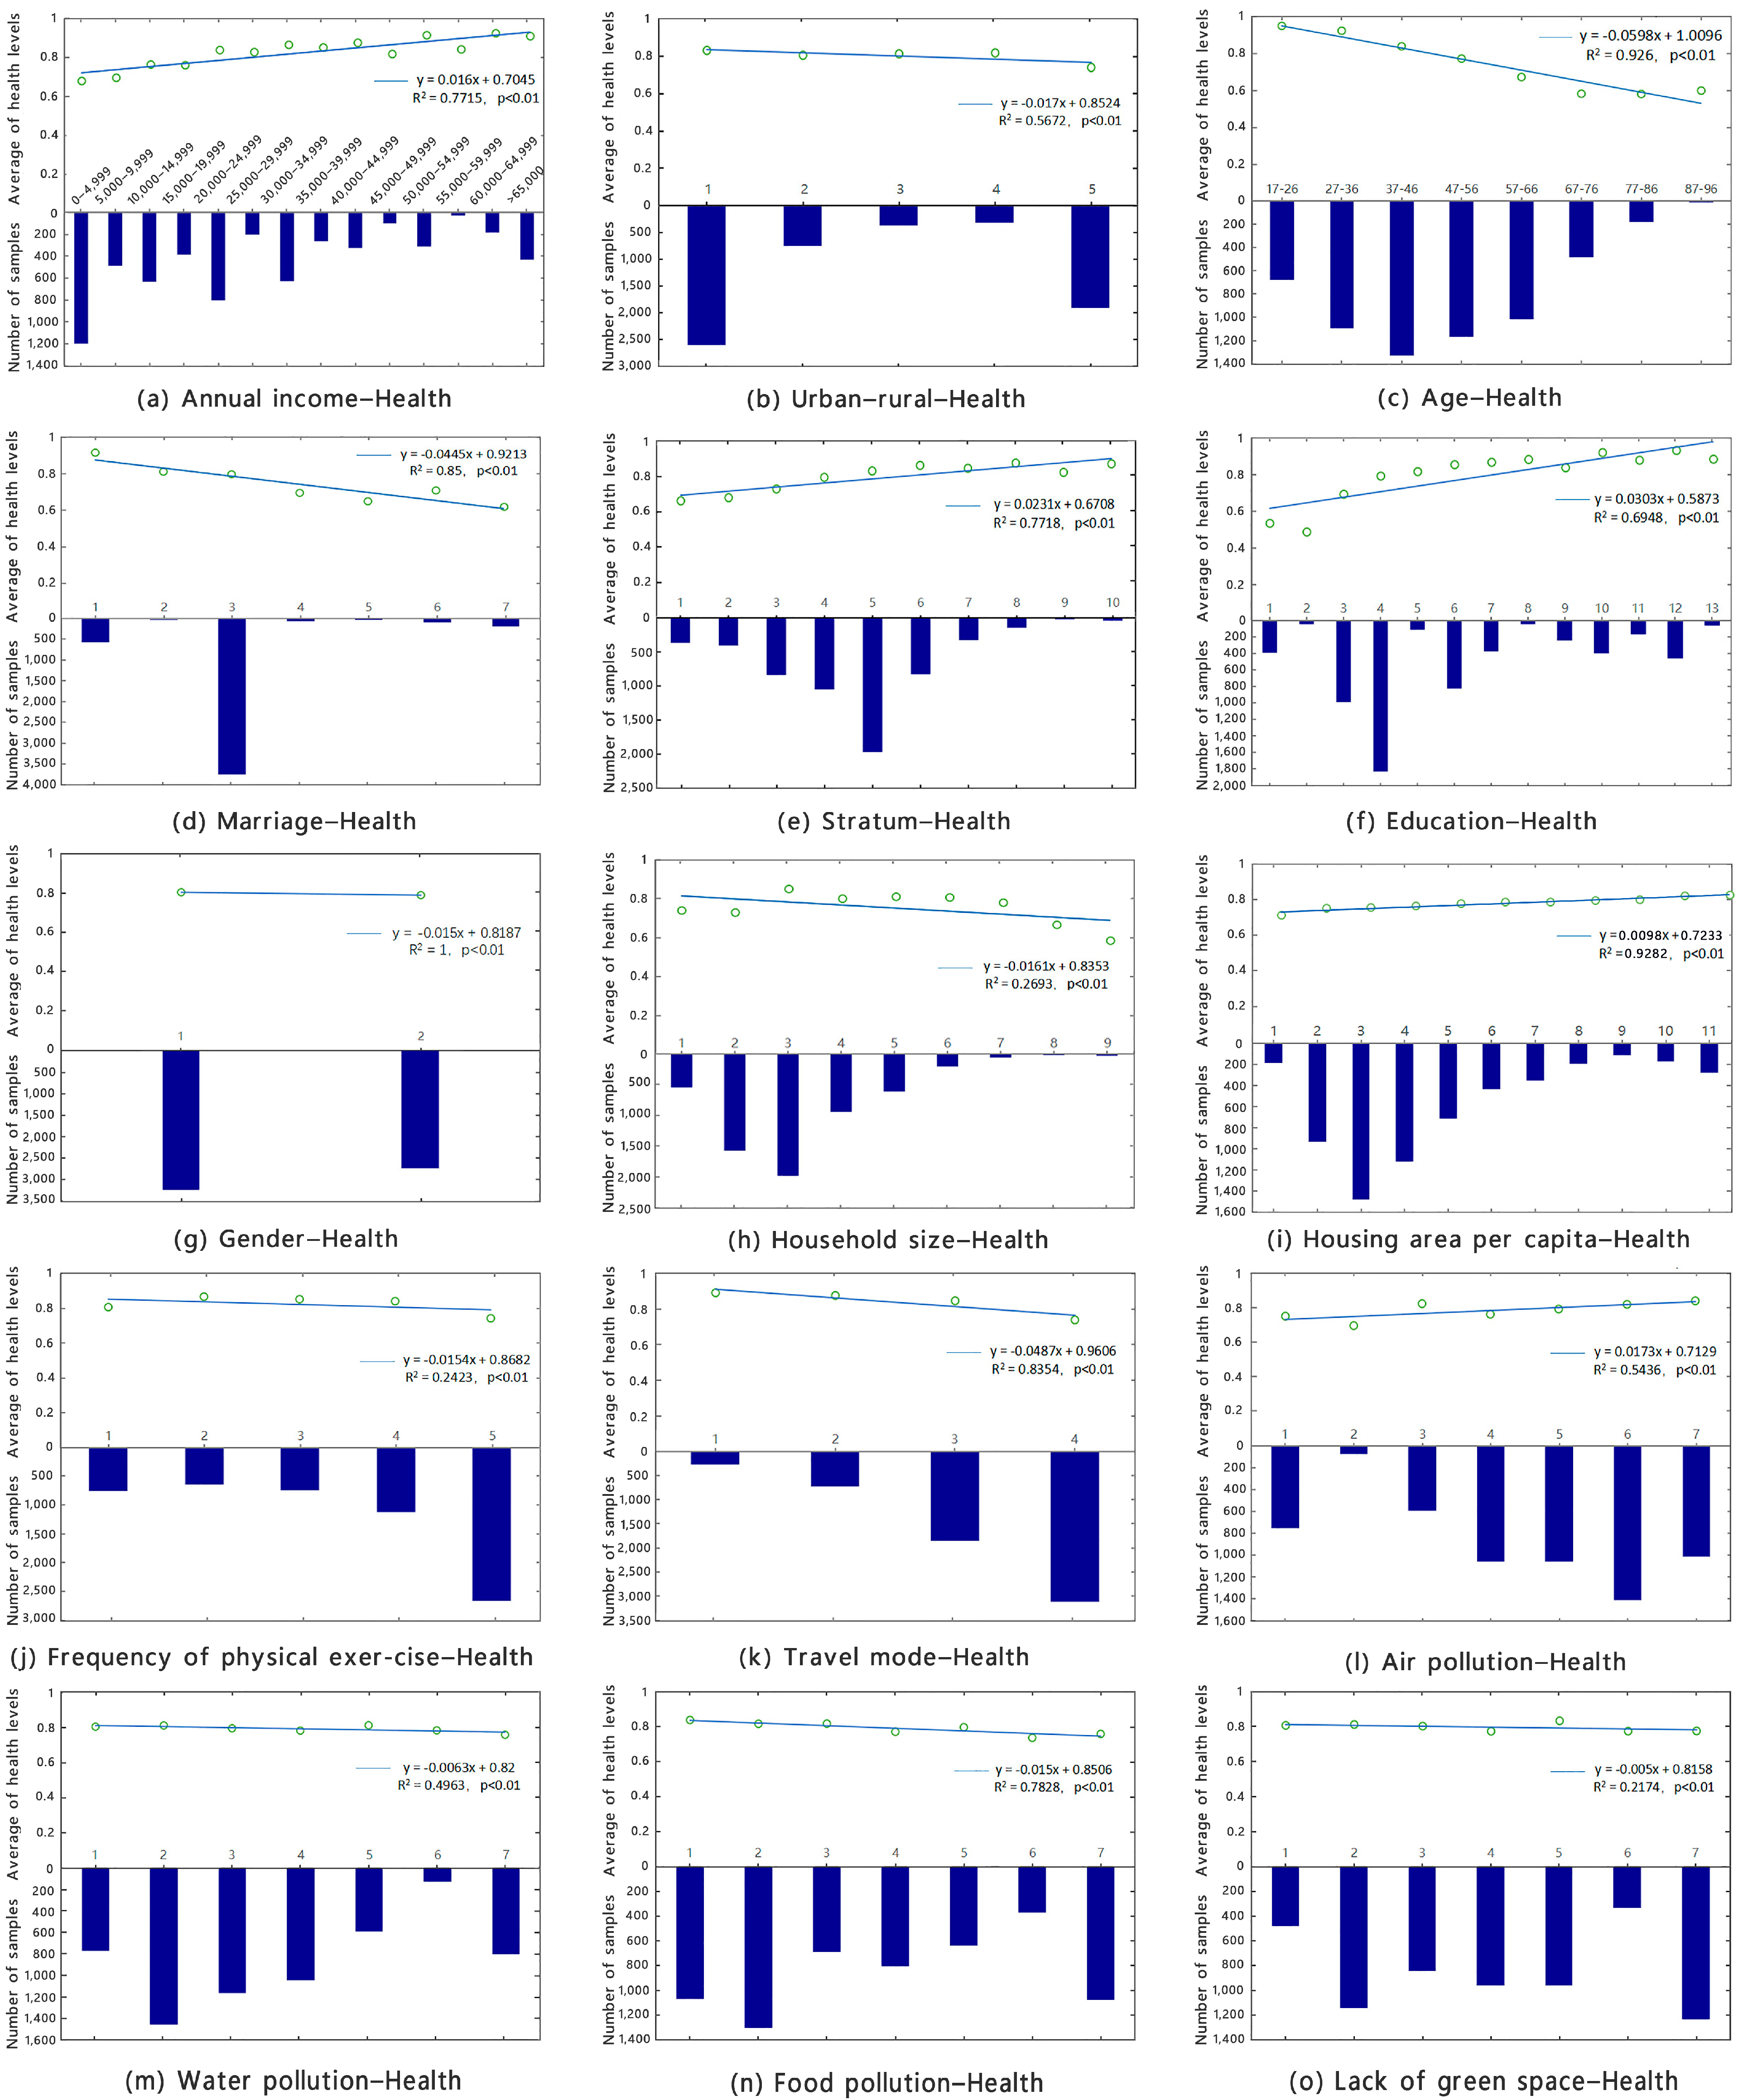
- Based on a health study of a complete sample of urban and rural residents, income inequality, air pollution, food pollution, and travel behavior can significantly affect the health level of residents, and the negative health effects of environmental pollution from air pollution, food pollution, and insufficient green space are evident. Furthermore, urban–rural health inequalities from the perspective of socioeconomic inequalities are also particularly evident, with gender, household size, travel, and physical activity having insignificant effects on the health of the rural population. Health improvement from increased income is much higher for groups with lower income levels than for those with higher income levels. The health-enhancing benefits per unit of income are much higher for rural residents than for urban residents.
- (3)
- This study found a significant urban–rural differentiation mechanism for environmental health effects from a health perspective. Logistic regressions were conducted on urban and rural samples to determine the degree of influence and significance of the variables between them based on the coefficients. The results indicate that urban residents are more concerned about health from an environmental quality perspective and are more at risk from air pollution and insufficient green space elements. In this study, food pollution variables were included in the independent variable system of the regression equation to explore the health impact factors, and a negative effect of food pollution on health was found. Furthermore, rural residents were more likely to have negative health effects when affected by food pollution due to the urban–rural divide in healthy food desertification, and their risk of exposure to food pollution exposure was greater. In this study, food contamination variables were included in the independent variable system of the exploratory regression equation for factors that influence health, and negative health effects of food contamination were found. Furthermore, an urban–rural health inequality differentiation mechanism caused by the urban–rural divide of healthy food desertification was found.
Author Contributions
Funding
Institutional Review Board Statement
Informed Consent Statement
Data Availability Statement
Acknowledgments
Conflicts of Interest
References
- Liu, W.; Xu, Z.; Yang, T. Health Effects of Air Pollution in China. Int. J. Environ. Res. Public Health 2018, 15, 1471. [Google Scholar] [CrossRef] [Scilit] [PubMed]
- Li, Z.; Folmer, H.; Xue, J. To what extent does air pollution affect happiness? The case of the Jinchuan mining area, China. Ecol. Econ. 2014, 99, 88–99. [Google Scholar] [CrossRef] [Scilit]
- Song, Y.; Li, M.; Zhang, M.; Sun, X. Study on the impact of air pollution control on urban residents’ happiness from microscopic perspective. J. Clean. Prod. 2019, 229, 1307–1318. [Google Scholar] [CrossRef] [Scilit]
- Levinson, A. Valuing public goods using happiness data: The case of air quality. J. Public Econ. 2012, 96, 869–880. [Google Scholar] [CrossRef] [Scilit]
- Ferreira, S.; Akay, A.; Brereton, F.; Cuñado, J.; Martinsson, P.; Moro, M.; Ningal, T.F. Life satisfaction and air quality in Europe. Ecol. Econ. 2013, 88, 1–10. [Google Scholar] [CrossRef] [Scilit]
- MacKerron, G.; Mourato, S. Life satisfaction and air quality in London. Ecol. Econ. 2009, 68, 1441–1453. [Google Scholar] [CrossRef] [Scilit]
- Kimic, K.; Ostrysz, K. Assessment of Blue and Green Infrastructure Solutions in Shaping Urban Public Spaces—Spatial and Functional, Environmental, and Social Aspects. Sustainability 2021, 13, 11041. [Google Scholar] [CrossRef] [Scilit]
- Chen, C.; Guo, P. Can Indoor Residents Perceive Green and Blue Spaces in Communities as Posted Sentiments? A Verification in Nanchang. Forests 2022, 13, 1421. [Google Scholar] [CrossRef] [Scilit]
- Wolch, J.R.; Byrne, J.; Newell, J.P. Urban green space, public health, and environmental justice: The challenge of making cities ‘just green enough’. Landsc. Urban Plan. 2014, 125, 234–244. [Google Scholar] [CrossRef] [Scilit]
- James, A.J.; Asal, M.J. Urban-Rural Differences in Childhood and Adolescent Obesity in the United States: A Systematic Review and Meta-Analysis. Child. Obes. 2015, 11, 233–241. [Google Scholar] [CrossRef] [Scilit]
- Abera, A.; Friberg, J.; Isaxon, C.; Jerrett, M.; Malmqvist, E.; Sjostrom, C.; Taj, T.; Vargas, A.M. Air Quality in Africa: Public Health Implications. Public Health 2021, 42, 193–210. [Google Scholar] [CrossRef] [Scilit] [PubMed]
- Sacks, J.D.; Lloyd, J.M.; Zhu, Y.; Anderton, J.; Jang, C.J.; Hubbell, B.; Fann, N. The Environmental Benefits Mapping and Analysis Program—Community Edition (BenMAP-CE): A tool to estimate the health and economic benefits of reducing air pollution. Environ. Modell. Softw. 2018, 104, 118–129. [Google Scholar] [CrossRef] [Scilit]
- Li, Z.; Liu, Q.; Zhang, Y.; Yan, K.; Yan, Y.; Xu, P. Characteristics of Urban Parks in Chengdu and Their Relation to Public Behaviour and Preferences. Sustainability 2022, 14, 6761. [Google Scholar] [CrossRef] [Scilit]
- Feng, T.; Du, H.B.; Lin, Z.G.; Zuo, J. Spatial spillover effects of environmental regulations on air pollution: Evidence from urban agglomerations in China. J. Environ. Manage. 2020, 272, 10. [Google Scholar] [CrossRef] [Scilit] [PubMed]
- Qu, L.L.; Li, Y.R.; Feng, W.L. Spatial-temporal differentiation of ecologically-sustainable land across selected settlements in China: An urban-rural perspective. Ecol. Indic. 2020, 112, 10. [Google Scholar] [CrossRef] [Scilit]
- Ma, J.; Li, C.J.; Kwan, M.P.; Chai, Y.W. A Multilevel Analysis of Perceived Noise Pollution, Geographic Contexts and Mental Health in Beijing. Int. J. Environ. Res. Public Health 2018, 15, 18. [Google Scholar] [CrossRef] [Scilit] [PubMed]
- Zhou, Q.; Zhang, X.L.; Shao, Q.L.; Wang, X.L. The non-linear effect of environmental regulation on haze pollution: Empirical evidence for 277 Chinese cities during 2002–2010. J. Environ. Manage. 2019, 248, 12. [Google Scholar] [CrossRef] [Scilit]
- Zhu, Y.; Wang, J.; Meng, B.; Ji, H.; Wang, S.; Zhi, G.; Liu, J.; Shi, C. Quantifying Spatiotemporal Heterogeneities in PM2.5-Related Health and Associated Determinants Using Geospatial Big Data: A Case Study in Beijing. Remote Sens. 2022, 14, 4012. [Google Scholar] [CrossRef] [Scilit]
- Muttoo, S.; Jeena, P.M.; Röösli, M.; de Hoogh, K.; Naidoo, R.N. A Review of Ambient Air Pollution Exposure Assessment Methods in Determining Childhood Respiratory Health Effects in Children under Five. Environments 2022, 9, 107. [Google Scholar] [CrossRef] [Scilit]
- HE, S.; CHAI, Y.w.; GUO, W.b.; TAN, Y.m.; LIU, B.c. City women’ leisure satisfaction and its influencing factors on a daily scale:a case study of Xining city. Econ. Geogr. 2019, 39, 224–231. [Google Scholar] [CrossRef]
- Liu, C.; Li, X. Air pollution and urban-rural income gap -Based on health perspective. Stat. Decis. 2021, 37, 100–103. [Google Scholar] [CrossRef]
- Ma, X.j.; Wang, C.x.; Zhang, Z.y. Quantitative Study of Residents’ Wellbeing from the Perspective of a “Two-dimensional” Environment: New Evidence from China CGSS Data. Stat. Res. 2019, 36, 56–67. [Google Scholar] [CrossRef]
- Shi, X.; Li, X.; Chen, X.; Zhang, L. Objective air quality index versus subjective perception: Which has a greater impact on life satisfaction? Environ. Dev. Sustain. 2022, 24, 6860–6877. [Google Scholar] [CrossRef] [Scilit]
- Yan, D.; Chen, G.; Lei, Y.; Zhou, Q.; Liu, C.; Su, F. Spatiotemporal Regularity and Socioeconomic Drivers of the AQI in the Yangtze River Delta of China. Int. J. Environ. Res. Public Health 2022, 19, 9017. [Google Scholar] [CrossRef] [Scilit]
- Liang, W.; Yang, M. Urbanization, economic growth and environmental pollution: Evidence from China. Sust. Comput. 2019, 21, 1–9. [Google Scholar] [CrossRef] [Scilit]
- Chen, L.L.; Shen, W. Spatiotemporal differentiation of urban-rural income disparity and its driving force in the Yangtze River Economic Belt during 2000–2017. PLoS ONE 2021, 16, e0245961. [Google Scholar] [CrossRef] [Scilit]
- Gong, P.; Liang, S.; Carlton, E.J.; Jiang, Q.W.; Wu, J.Y.; Wang, L.; Remais, J.V. Urbanisation and health in China. Lancet 2012, 379, 843–852. [Google Scholar] [CrossRef] [Scilit]
- Chen, J.M.; Li, C.L.; Ristovski, Z.; Milic, A.; Gu, Y.T.; Islam, M.S.; Wang, S.X.; Hao, J.M.; Zhang, H.F.; He, C.R.; et al. A review of biomass burning: Emissions and impacts on air quality, health and climate in China. Sci. Total Environ. 2017, 579, 1000–1034. [Google Scholar] [CrossRef] [Scilit]
- Lu, X.C.; Lin, C.Q.; Li, W.K.; Chen, Y.; Huang, Y.Q.; Fung, J.C.H.; Lau, A.K.H. Analysis of the adverse health effects of PM2.5 from 2001 to 2017 in China and the role of urbanization in aggravating the health burden. Sci. Total Environ. 2019, 652, 683–695. [Google Scholar] [CrossRef] [Scilit]
- Chen, Y.; Ke, X.; Min, M.; Zhang, Y.; Dai, Y.; Tang, L. Do We Need More Urban Green Space to Alleviate PM2.5 Pollution? A Case Study in Wuhan, China. Land 2022, 11, 776. [Google Scholar] [CrossRef] [Scilit]
- Lee, A.C.; Maheswaran, R. The health benefits of urban green spaces: A review of the evidence. J. Public Health 2011, 33, 212–222. [Google Scholar] [CrossRef] [Scilit] [PubMed]
- Costache, R.; Arabameri, A.; Moayedi, H.; Pham, Q.B.; Santosh, M.; Nguyen, H.; Pandey, M.; Pham, B.T.J.G.I. Flash-flood potential index estimation using fuzzy logic combined with deep learning neural network, naïve Bayes, XGBoost and classification and regression tree. Geocarto Int. 2022, 37, 6780–6807. [Google Scholar] [CrossRef] [Scilit]
- Ekkel, E.D.; de Vries, S. Nearby green space and human health: Evaluating accessibility metrics. Landsc. Urban Plan. 2017, 157, 214–220. [Google Scholar] [CrossRef] [Scilit]
- Browning, M.; Rigolon, A.; McAnirlin, O.; Yoon, H. Where greenspace matters most: A systematic review of urbanicity, greenspace, and physical health. Landsc. Urban Plan. 2022, 217, 13. [Google Scholar] [CrossRef] [Scilit]
- Markevych, I.; Schoierer, J.; Hartig, T.; Chudnovsky, A.; Hystad, P.; Dzhambov, A.M.; de Vries, S.; Triguero-Mas, M.; Brauer, M.; Nieuwenhuijsen, M.J.; et al. Exploring pathways linking greenspace to health: Theoretical and methodological guidance. Environ. Res. 2017, 158, 301–317. [Google Scholar] [CrossRef] [Scilit]

| Variable | Symbol 1 | Symbol 2 | Description | Relevance |
|---|---|---|---|---|
| Health level | Health | a16a | 1 | |
| Annual income | Income | a8a | Individual total annual income of last year (2012) | + |
| Urban–rural | Urban | s5a | Urban = 1 and rural = 0 | + |
| Region | Province | s41 | Survey area (province) | |
| Age | Age | a3aa | Age | − |
| Marriage | Marriage | a69 | Unmarried = 1; cohabiting = 2; first married with a spouse = 3; remarried with a spouse = 4; separated and not divorced = 5; divorced = 6; widowed = 7 | − |
| Stratum | Stratum | a43a | The highest ‘10 points’ represents the top stratum, and the lowest ‘1 point’ represents the bottom stratum. | + |
| Education | Education | a7a | 1 = no education; 2 = private school and literacy classes; 3 = primary school; 4 = junior high school; 5 = vocational high school; 6 = general high school; 7 = secondary school; 8 = technical school; 9 = university specialist (adult higher education); 10 = university specialist (formal higher education); 11 = university undergraduate (adult higher education); 12 = university undergraduate (formal higher education); 13 = graduate; 14 = doctoral students and above. | + |
| Gender | Sex | a2 | 1 = male and 2 = female | − |
| Household size | Family size | a63 | How many people usually live in your household at the moment (including yourself) | − |
| Housing area per capita | Housing area per capita | a11 | Housing area per capita | + |
| Frequency of physical exercise | Frequency of physical exercise | a3009 | 1 = daily; 2 = several times a week; 3 = several times a month; 4 = several times a year or less; 5 = never | − |
| Travel mode | Travel mode | b1105 | I always take a taxi or private car when I go out 1 = very much so; 2 = more so; 3 = not very much so; and 4 = very little so | − |
| Air pollution | Air pollution | b21b01 | 1 = very serious; 2 = more serious; 3 = less serious; 4 = not serious; 5 = average; and 6 = no such problem | + |
| Water pollution | Water pollution | b21b02 | 1 = very serious; 2 = more serious; 3 = less serious; 4 = not serious; 5 = average; and 6 = no such problem | + |
| Noise pollution | Noise pollution | b21b03 | 1 = very serious; 2 = more serious; 3 = less serious; 4 = not serious; 5 = average; and 6 = no such problem | + |
| Food pollution | Food contamination | b21b10 | 1 = very serious; 2 = more serious; 3 = less serious; 4 = not serious; 5 = average; and 6 = no such problem | + |
| Lack of green space | Insufficient green space | b21b06 | 1 = very serious; 2 = more serious; 3 = less serious; 4 = not serious; 5 = average; and 6 = no such problem | + |
| Degradation of arable land quality | Degradation of cultivated land quality | b21b08 | 1 = very serious; 2 = more serious; 3 = less serious; 4 = not serious; 5 = average; and 6 = no such problem | + |
| Variable | Symbol | Maximum | Minimum | Average |
|---|---|---|---|---|
| Health level | a16a | 1 | 0 | 0.8 |
| Annual income | a8a | 1,000,000 | 0 | 28,365.04 |
| Urban–rural | s5a | 5 | 1 | 2.691315 |
| Age | a3aa | 96 | 17 | 46.45288 |
| Marriage | a69 | 7 | 1 | 3.092723 |
| Stratum | a43a | 10 | 1 | 4.459759 |
| Education | a7a | 14 | 1 | 5.661469 |
| Gender | a2 | 2 | 1 | 1.456908 |
| Household size | a63 | 12 | 1 | 3.094903 |
| Housing area per capita | a11a | 700 | 1.5 | 41.57517 |
| Frequency of physical exercise | a3009 | 5 | 1 | 3.719651 |
| Travel mode | b1105 | 4 | 1 | 3.307344 |
| Air pollution | b21b01 | 6 | 1 | 3.348759 |
| Water pollution | b21b02 | 6 | 1 | 3.473587 |
| Food contamination (food safety) | b21b10 | 6 | 1 | 3.682428 |
| Lack of green space | b21b06 | 6 | 1 | 4.129297 |
| Variable | Code | Model 1 | Model 2 | Model 3 | |||
|---|---|---|---|---|---|---|---|
| Coe. b | Sig. | Coe. b | Sig. | Coe. b | Sig. | ||
| Gender | a2 | −0.153 | 0.034 ** | −0.154 | 0.033 ** | −0.056 | 0.000 *** |
| Age | a3aa | −0.046 | 0 *** | −0.046 | 0.000 *** | −0.017 | 0.019 ** |
| Urban-rural | s5aa | 0.189 | 0.034 ** | 0.204 | 0.020 ** | 0.096 | 0.000 *** |
| Stratum | a43a | 0.16 | 0 *** | 0.159 | 0.000 *** | 0.058 | 0.001 *** |
| Household size | a63 | 0.046 | 0.098 * | 0.045 | 0.109 | 0.020 | 0.000 *** |
| Education | a7a | 0.06 | 0 *** | 0.060 | 0.000 *** | 0.017 | 0.036 ** |
| Income | a8aaa | 0.294 | 0.08 * | 0.296 | 0.078 * | 0.080 | 0.000 *** |
| Area per capita | a11aa | 0.051 | 0.016 ** | 0.049 | 0.019 ** | 0.015 | 0.011 ** |
| Frequency of physical exercise | a3009 | −0.093 | 0 *** | −0.094 | 0.000 *** | −0.062 | 0.034 ** |
| Travel mode | b1105 | −0.125 | 0.013 ** | −0.130 | 0.009 *** | −0.039 | 0.000 *** |
| Lack of green space | b21b06 | 0.052 | 0.012 ** | 0.045 | 0.024 ** | 0.015 | 0.009 *** |
| Food contamination (food safety) | b21b08 | 0.02 | 0.173 ** | 0.018 | 0.224 | 0.003 | 0.013 ** |
| East and West | s41 East and West | 0.318 | 0 *** | 0.264 | 0.006 *** | 0.040 | 0.384 |
| Air pollution (subjective) | S6kq | 0.024 | 0.025 ** | - | - | 0.000 | 0.165 |
| PM2.5 (objective) | PM2.5 | - | 0.003 | 0.216 | −0.002 | 0.978 | |
| Constants | e | 2.577 | 0 *** | 2.678 | 0.000 *** | 4.729 | 0.000 *** |
| ROC AUC | 0.854 | 0.806 | 0.837 | ||||
| Predicted correct rate | 88.261 | 80.345 | 85.543 | ||||
| AIC | 5270 | 4988 | - | ||||
| Variables | Code | Model 1 | Model 4 | Model 5 | |||
|---|---|---|---|---|---|---|---|
| Coe. b | Sig. | Coe. b | Sig. | Coe. b | Sig. | ||
| Gender | a2 | −0.153 | 0.034 ** | −0.196 | 0.031 ** | 0.041 | 0.740 |
| Age | a3aa | −0.046 | 0.000 *** | −0.045 | 0.000 *** | −0.042 | 0.000 *** |
| Urban–rural | s5aa | 0.189 | 0.034 ** | — — | — — | — — | — — |
| Stratum | a43a | 0.16 | 0 *** | 0.178 | 0.000 *** | 0.120 | 0.001 *** |
| Household size | a63 | 0.046 | 0.098 * | 0.042 | 0.259 | 0.044 | 0.300 |
| Education | a7a | 0.06 | 0 *** | 0.050 | 0.005 *** | 0.114 | 0.003 *** |
| Income | a8aaa | 0.294 | 0.08 * | 0.053 | 0.074 * | 2.161 | 0.000 *** |
| Area per capita | a11aa | 0.051 | 0.016 ** | 0.029 | 0.341 | 0.064 | 0.032 ** |
| Frequency of physical exercise | a3009 | −0.093 | 0 *** | −0.103 | 0.001 *** | −0.051 | 0.358 |
| Travel mode | b1105 | −0.125 | 0.013 ** | −0.165 | 0.006 *** | −0.016 | 0.858 |
| Lack of green space | b21b06 | 0.052 | 0.012 ** | 0.058 | 0.052 * | 0.051 | 0.101 |
| Food contamination (food safety) | b21b08 | 0.02 | 0.173 ** | 0.017 | 0.036 ** | 0.027 | 0.330 |
| East and West | s41 East and West | 0.318 | 0 *** | 0.326 | 0.004 *** | 0.266 | 0.027 ** |
| Air pollution | S6kq | 0.024 | 0.025 ** | 0.026 | 0.032 ** | 0.025 | 0.141 |
| Constants | e | 2.577 | 0 *** | 3.072 | 0.000 *** | 1.251 | 0.071 * |
| ROC AUC | 0.854 | 0.813 | 0.727 | ||||
| Predicted correct rate | 88.261 | 82.534 | 75.457 | ||||
| AIC | 5270 | 3337 | 1942 | ||||
Publisher’s Note: MDPI stays neutral with regard to jurisdictional claims in published maps and institutional affiliations. |
© 2022 by the authors. Licensee MDPI, Basel, Switzerland. This article is an open access article distributed under the terms and conditions of the Creative Commons Attribution (CC BY) license (https://creativecommons.org/licenses/by/4.0/).
Share and Cite
Zhou, P.; Sun, S.; Chen, T.; Pan, Y.; Xu, W.; Zhang, H. Impacts of Social Inequality, Air Pollution, Rural–Urban Divides, and Insufficient Green Space on Residents’ Health in China: Insight from Chinese General Social Survey Data Analysis. Int. J. Environ. Res. Public Health 2022, 19, 14225. https://doi.org/10.3390/ijerph192114225
Zhou P, Sun S, Chen T, Pan Y, Xu W, Zhang H. Impacts of Social Inequality, Air Pollution, Rural–Urban Divides, and Insufficient Green Space on Residents’ Health in China: Insight from Chinese General Social Survey Data Analysis. International Journal of Environmental Research and Public Health. 2022; 19(21):14225. https://doi.org/10.3390/ijerph192114225
Chicago/Turabian StyleZhou, Peng, Siwei Sun, Tao Chen, Yue Pan, Wanqing Xu, and Hailu Zhang. 2022. "Impacts of Social Inequality, Air Pollution, Rural–Urban Divides, and Insufficient Green Space on Residents’ Health in China: Insight from Chinese General Social Survey Data Analysis" International Journal of Environmental Research and Public Health 19, no. 21: 14225. https://doi.org/10.3390/ijerph192114225
APA StyleZhou, P., Sun, S., Chen, T., Pan, Y., Xu, W., & Zhang, H. (2022). Impacts of Social Inequality, Air Pollution, Rural–Urban Divides, and Insufficient Green Space on Residents’ Health in China: Insight from Chinese General Social Survey Data Analysis. International Journal of Environmental Research and Public Health, 19(21), 14225. https://doi.org/10.3390/ijerph192114225

