
Are Natural or Anthropogenic Factors Influencing Potentially Toxic Elements’ Enrichment in Soils in Proglacial Zones? An Example from Kaffiøyra (Oscar II Land, Spitsbergen)
 , , and
Abstract
1. Introduction
2. Materials and Methods
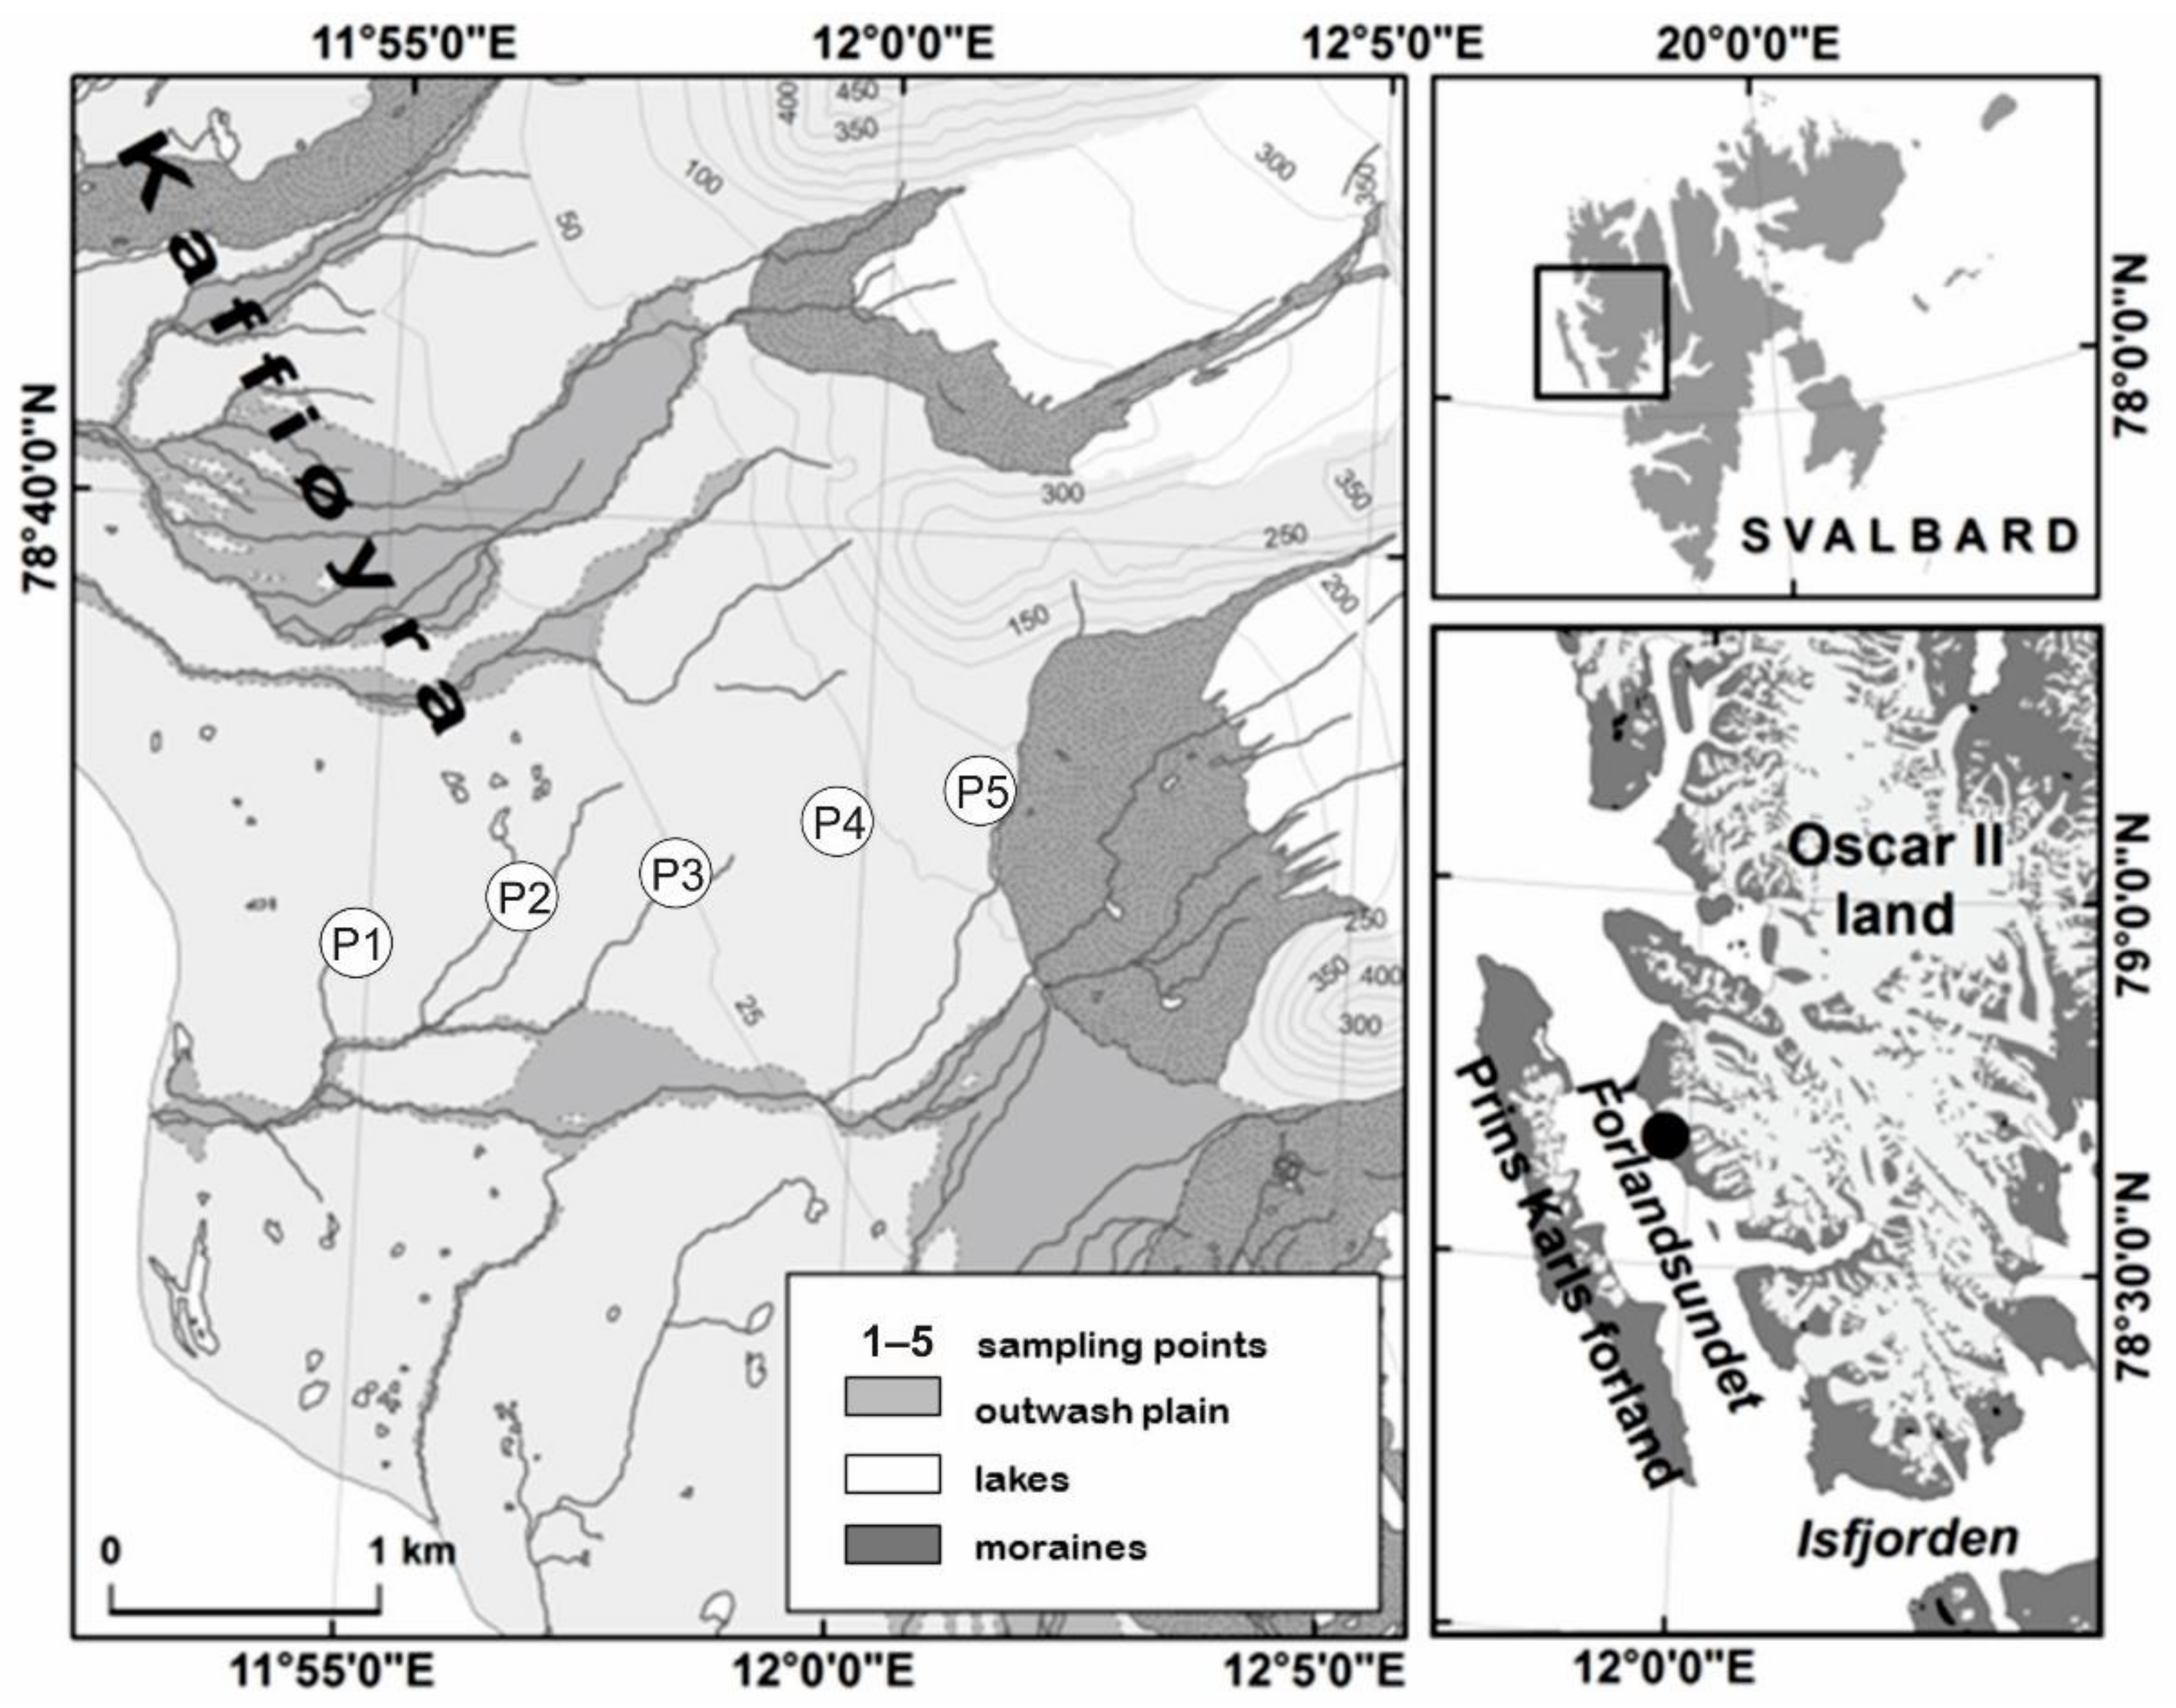
2.1. Study Area
2.2. Collecting Environmental Data and Soil Samples
2.3. Laboratory Analysis
2.4. Pollution Indices
2.5. Statistical Analysis
3. Results
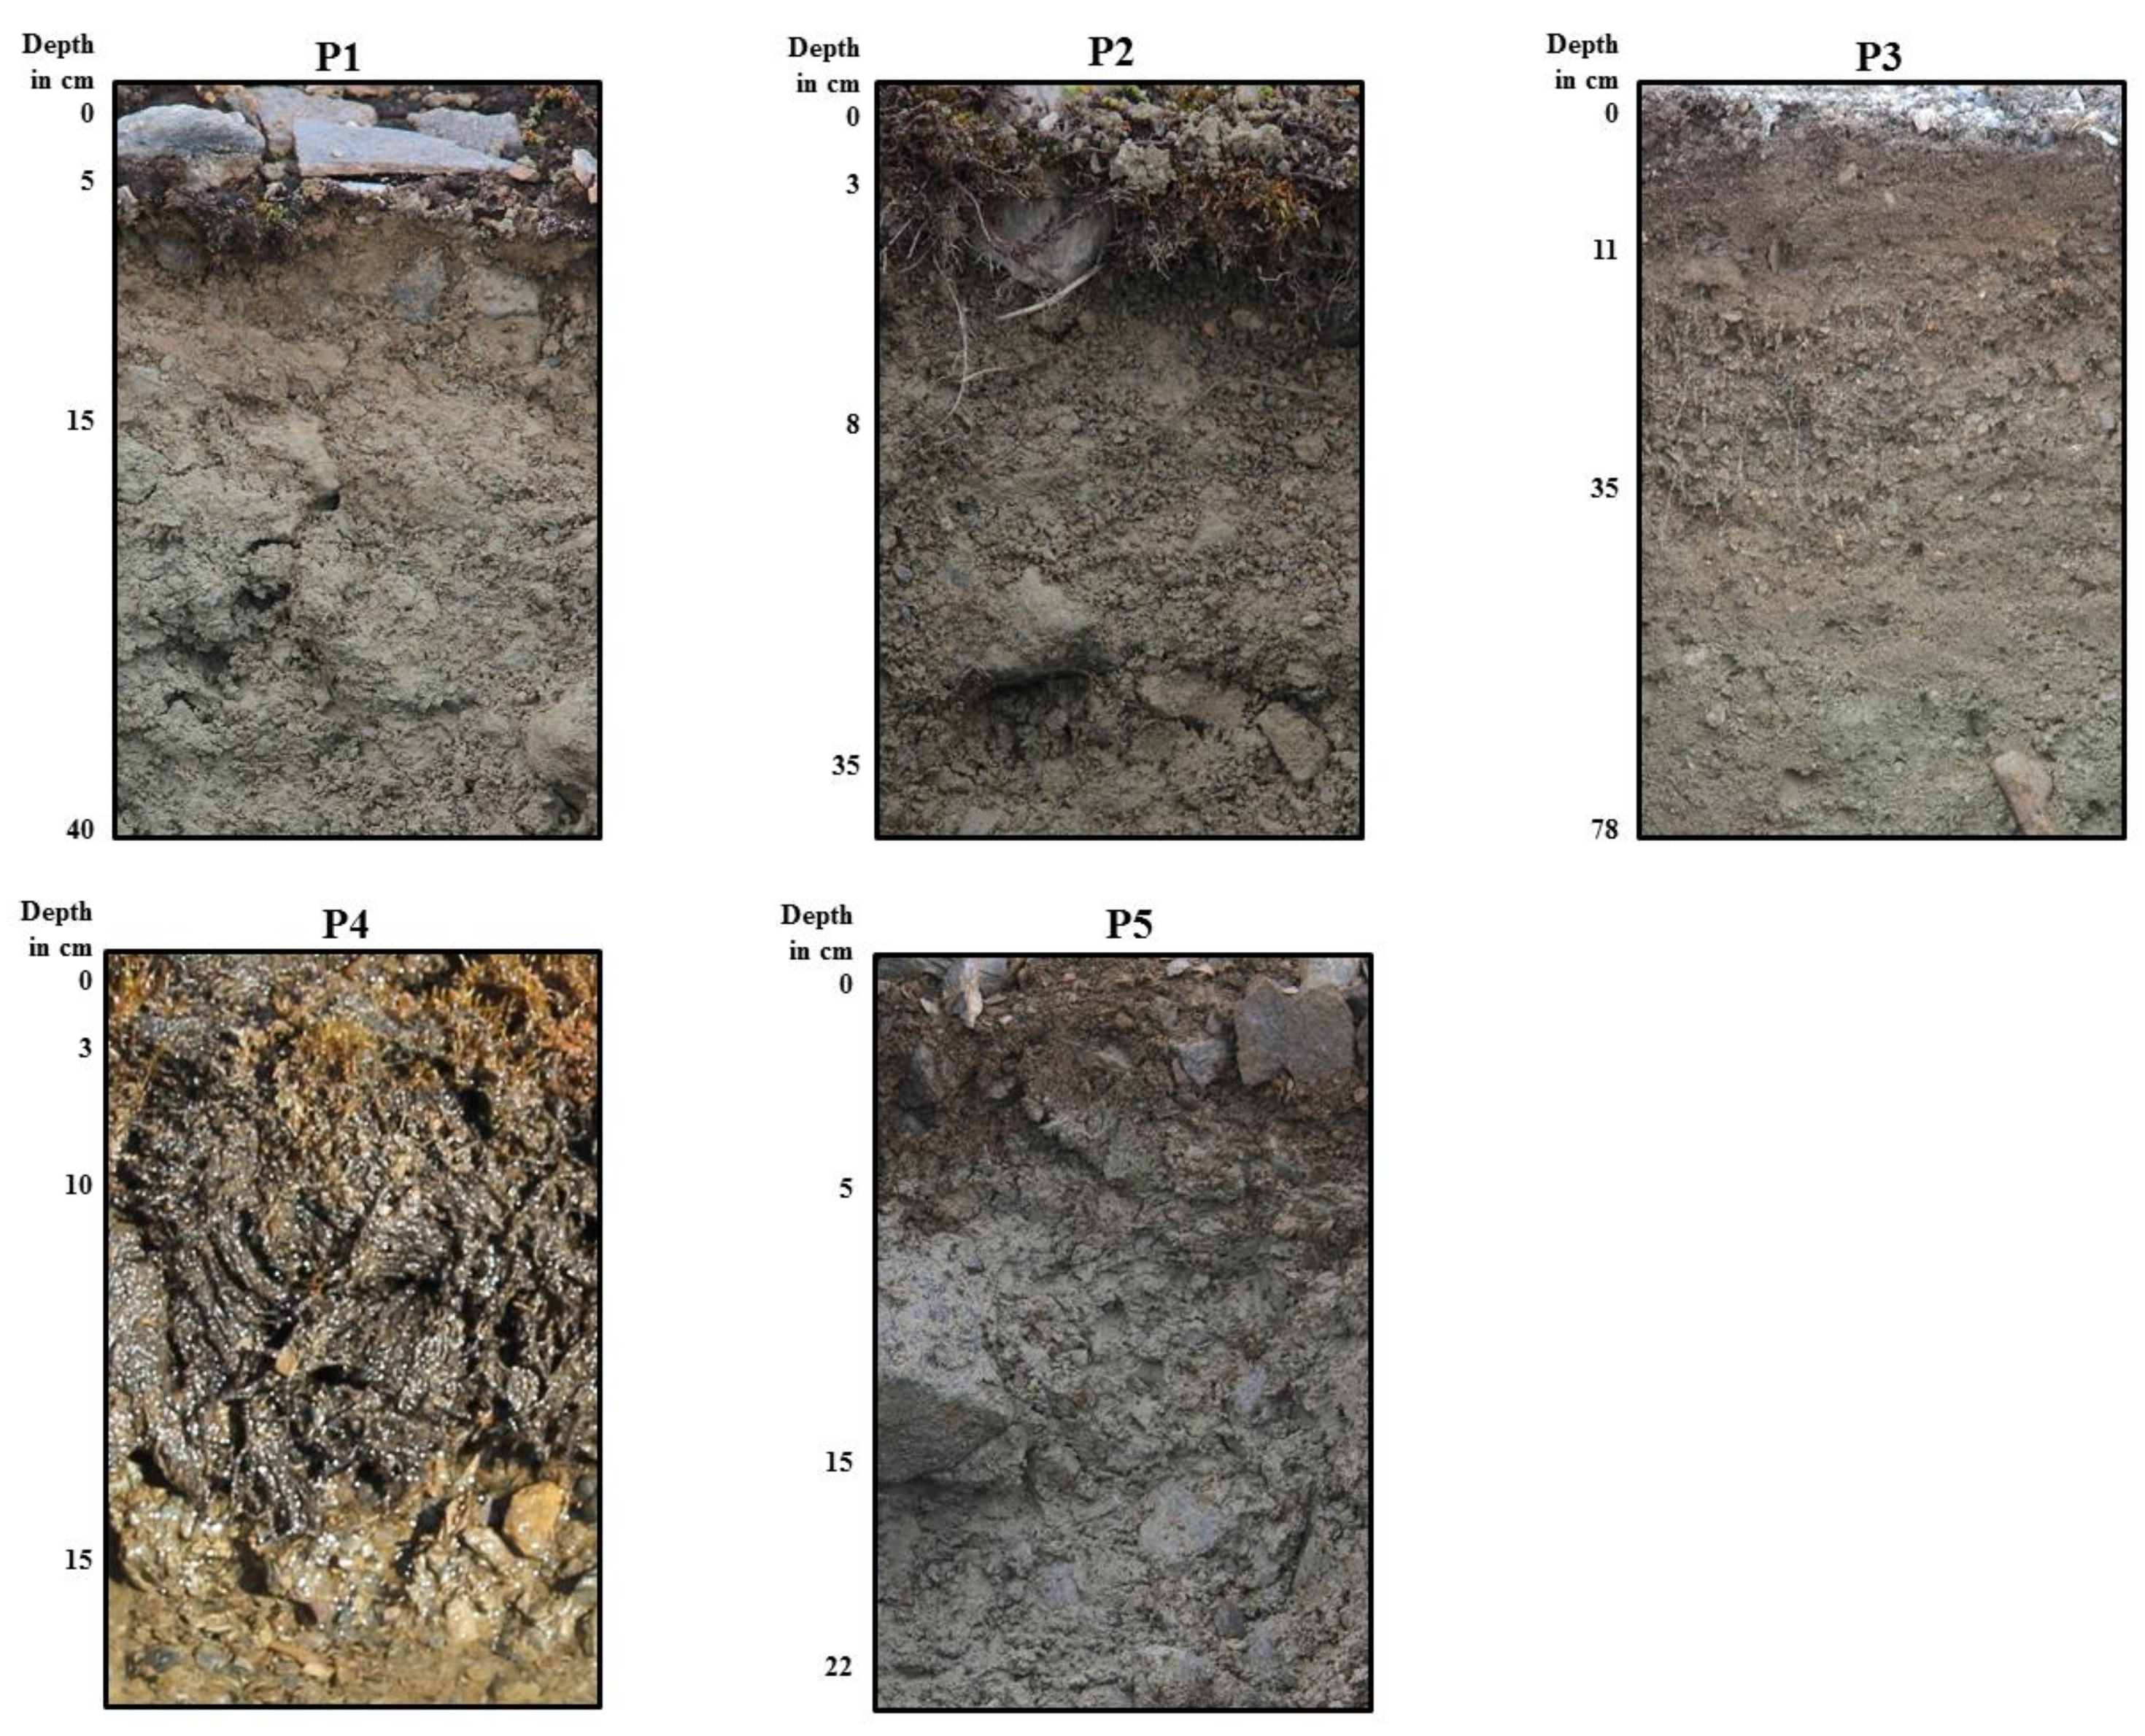
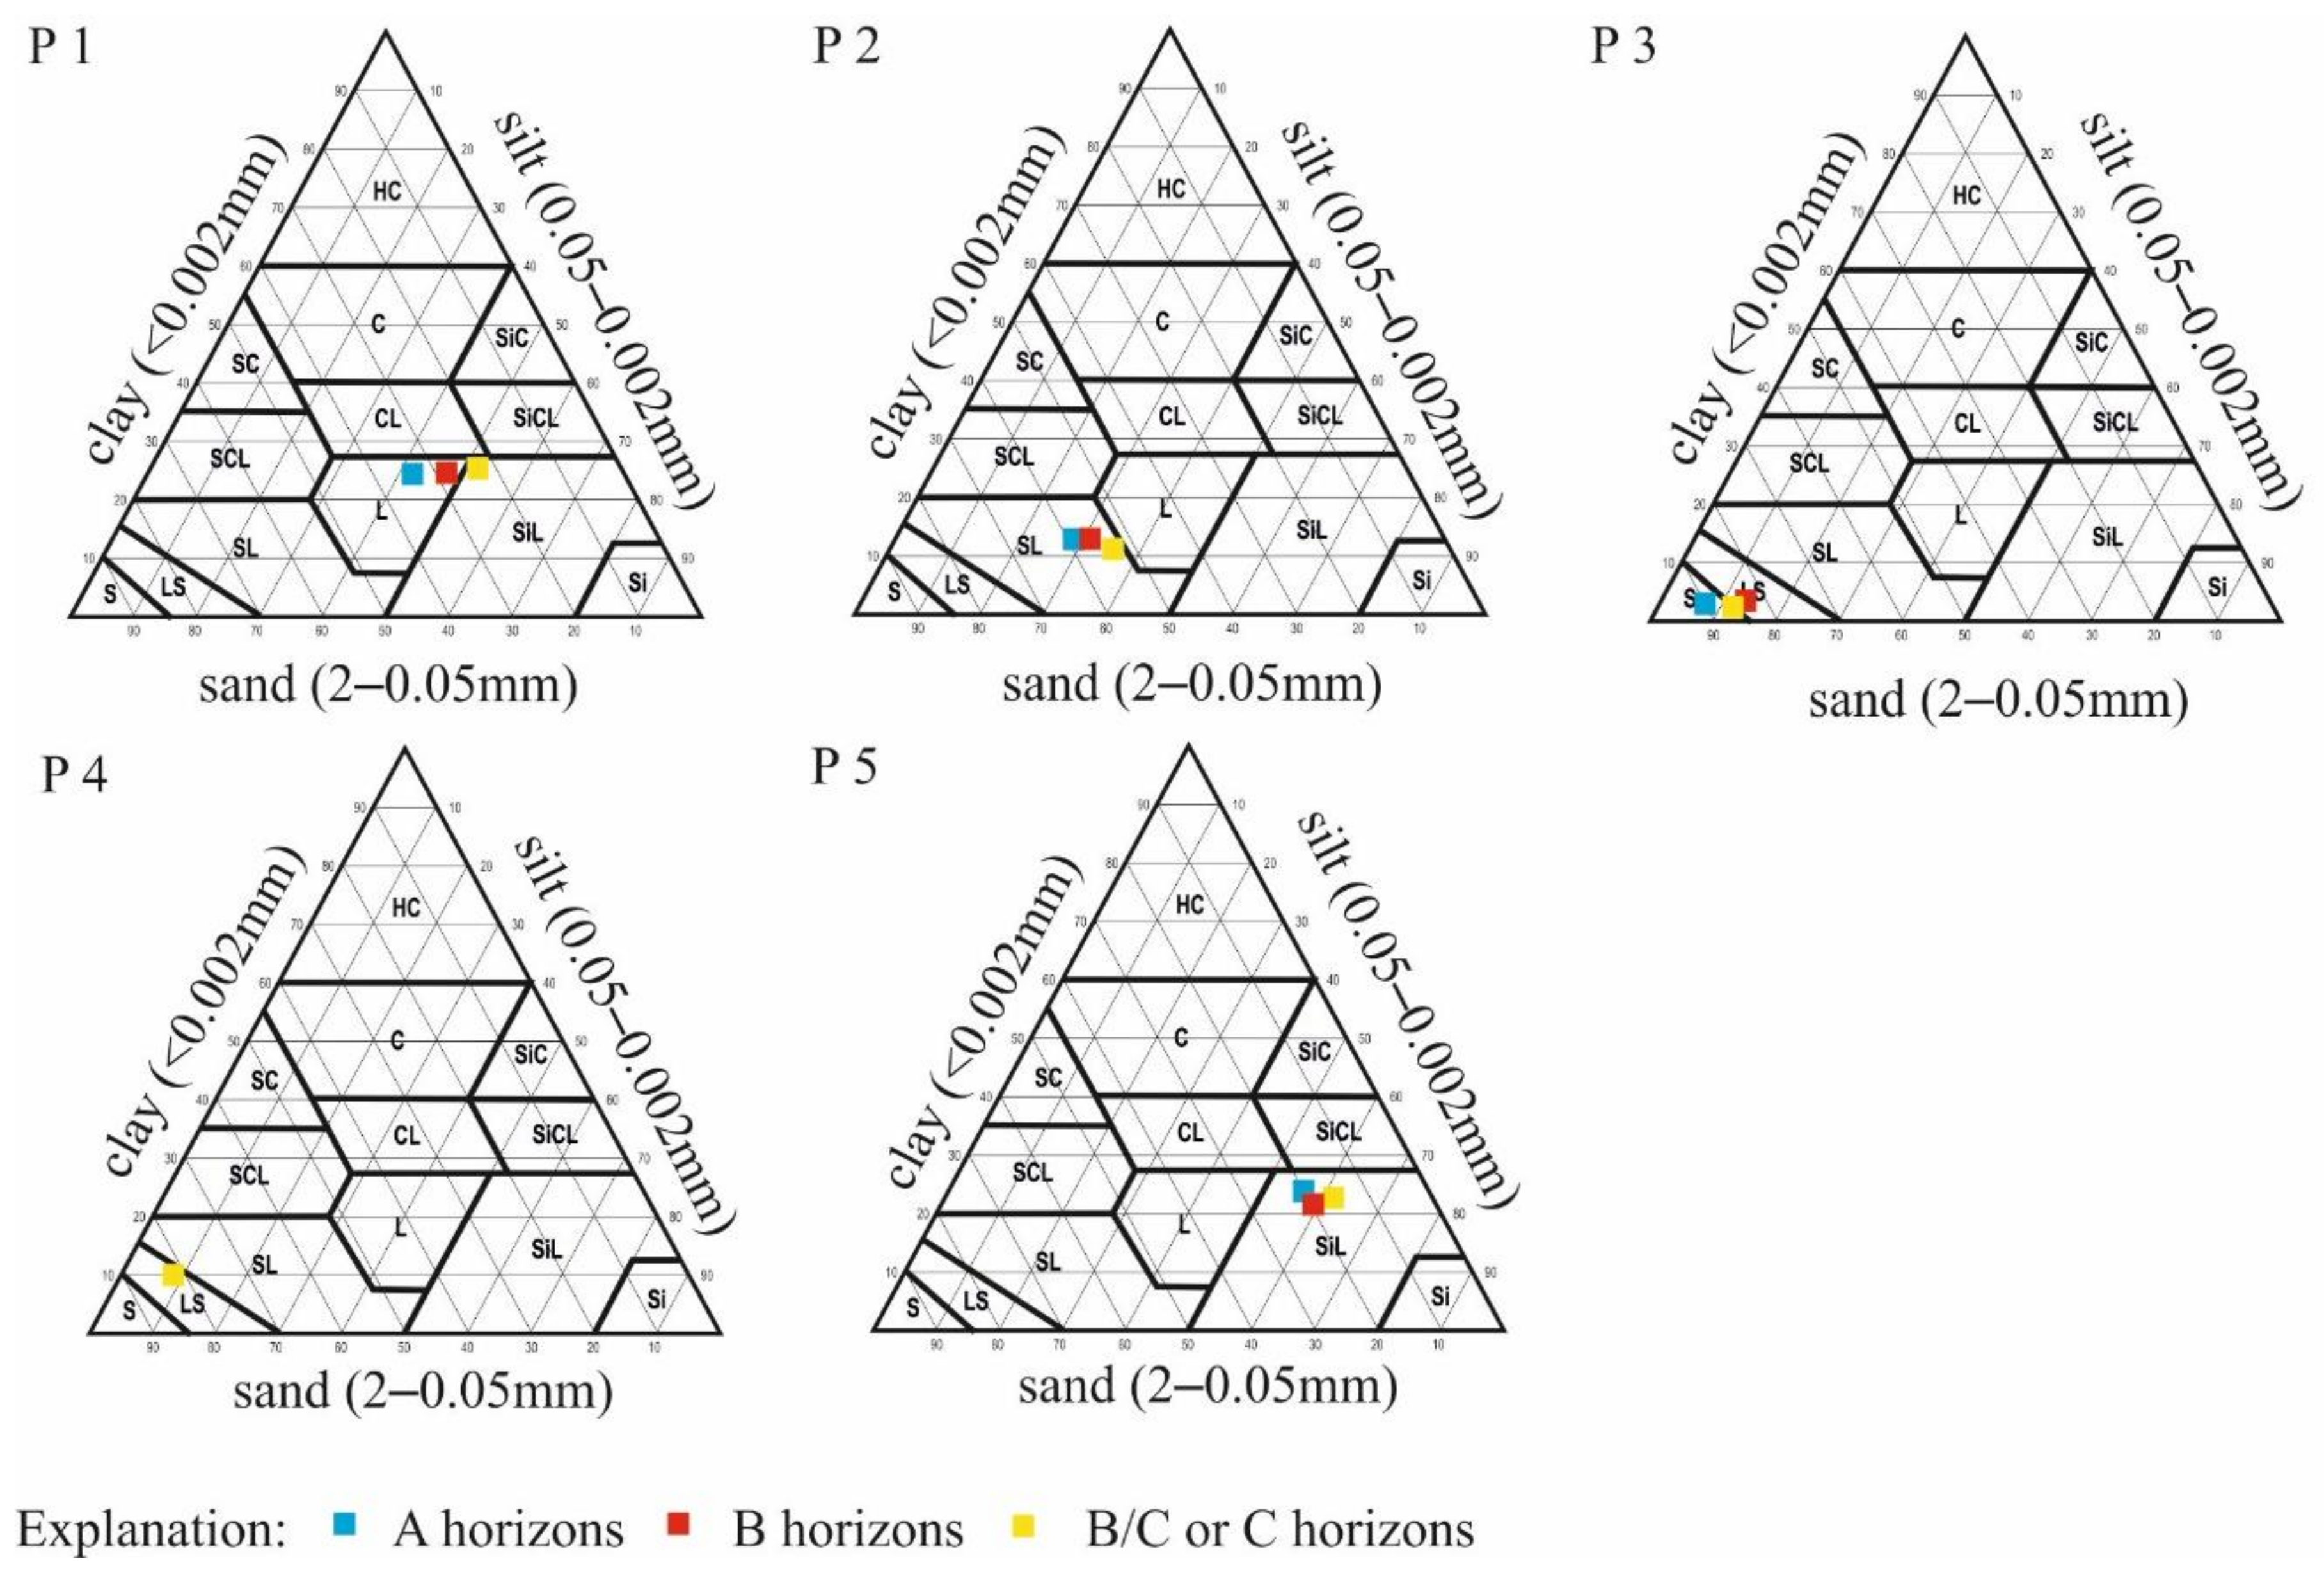
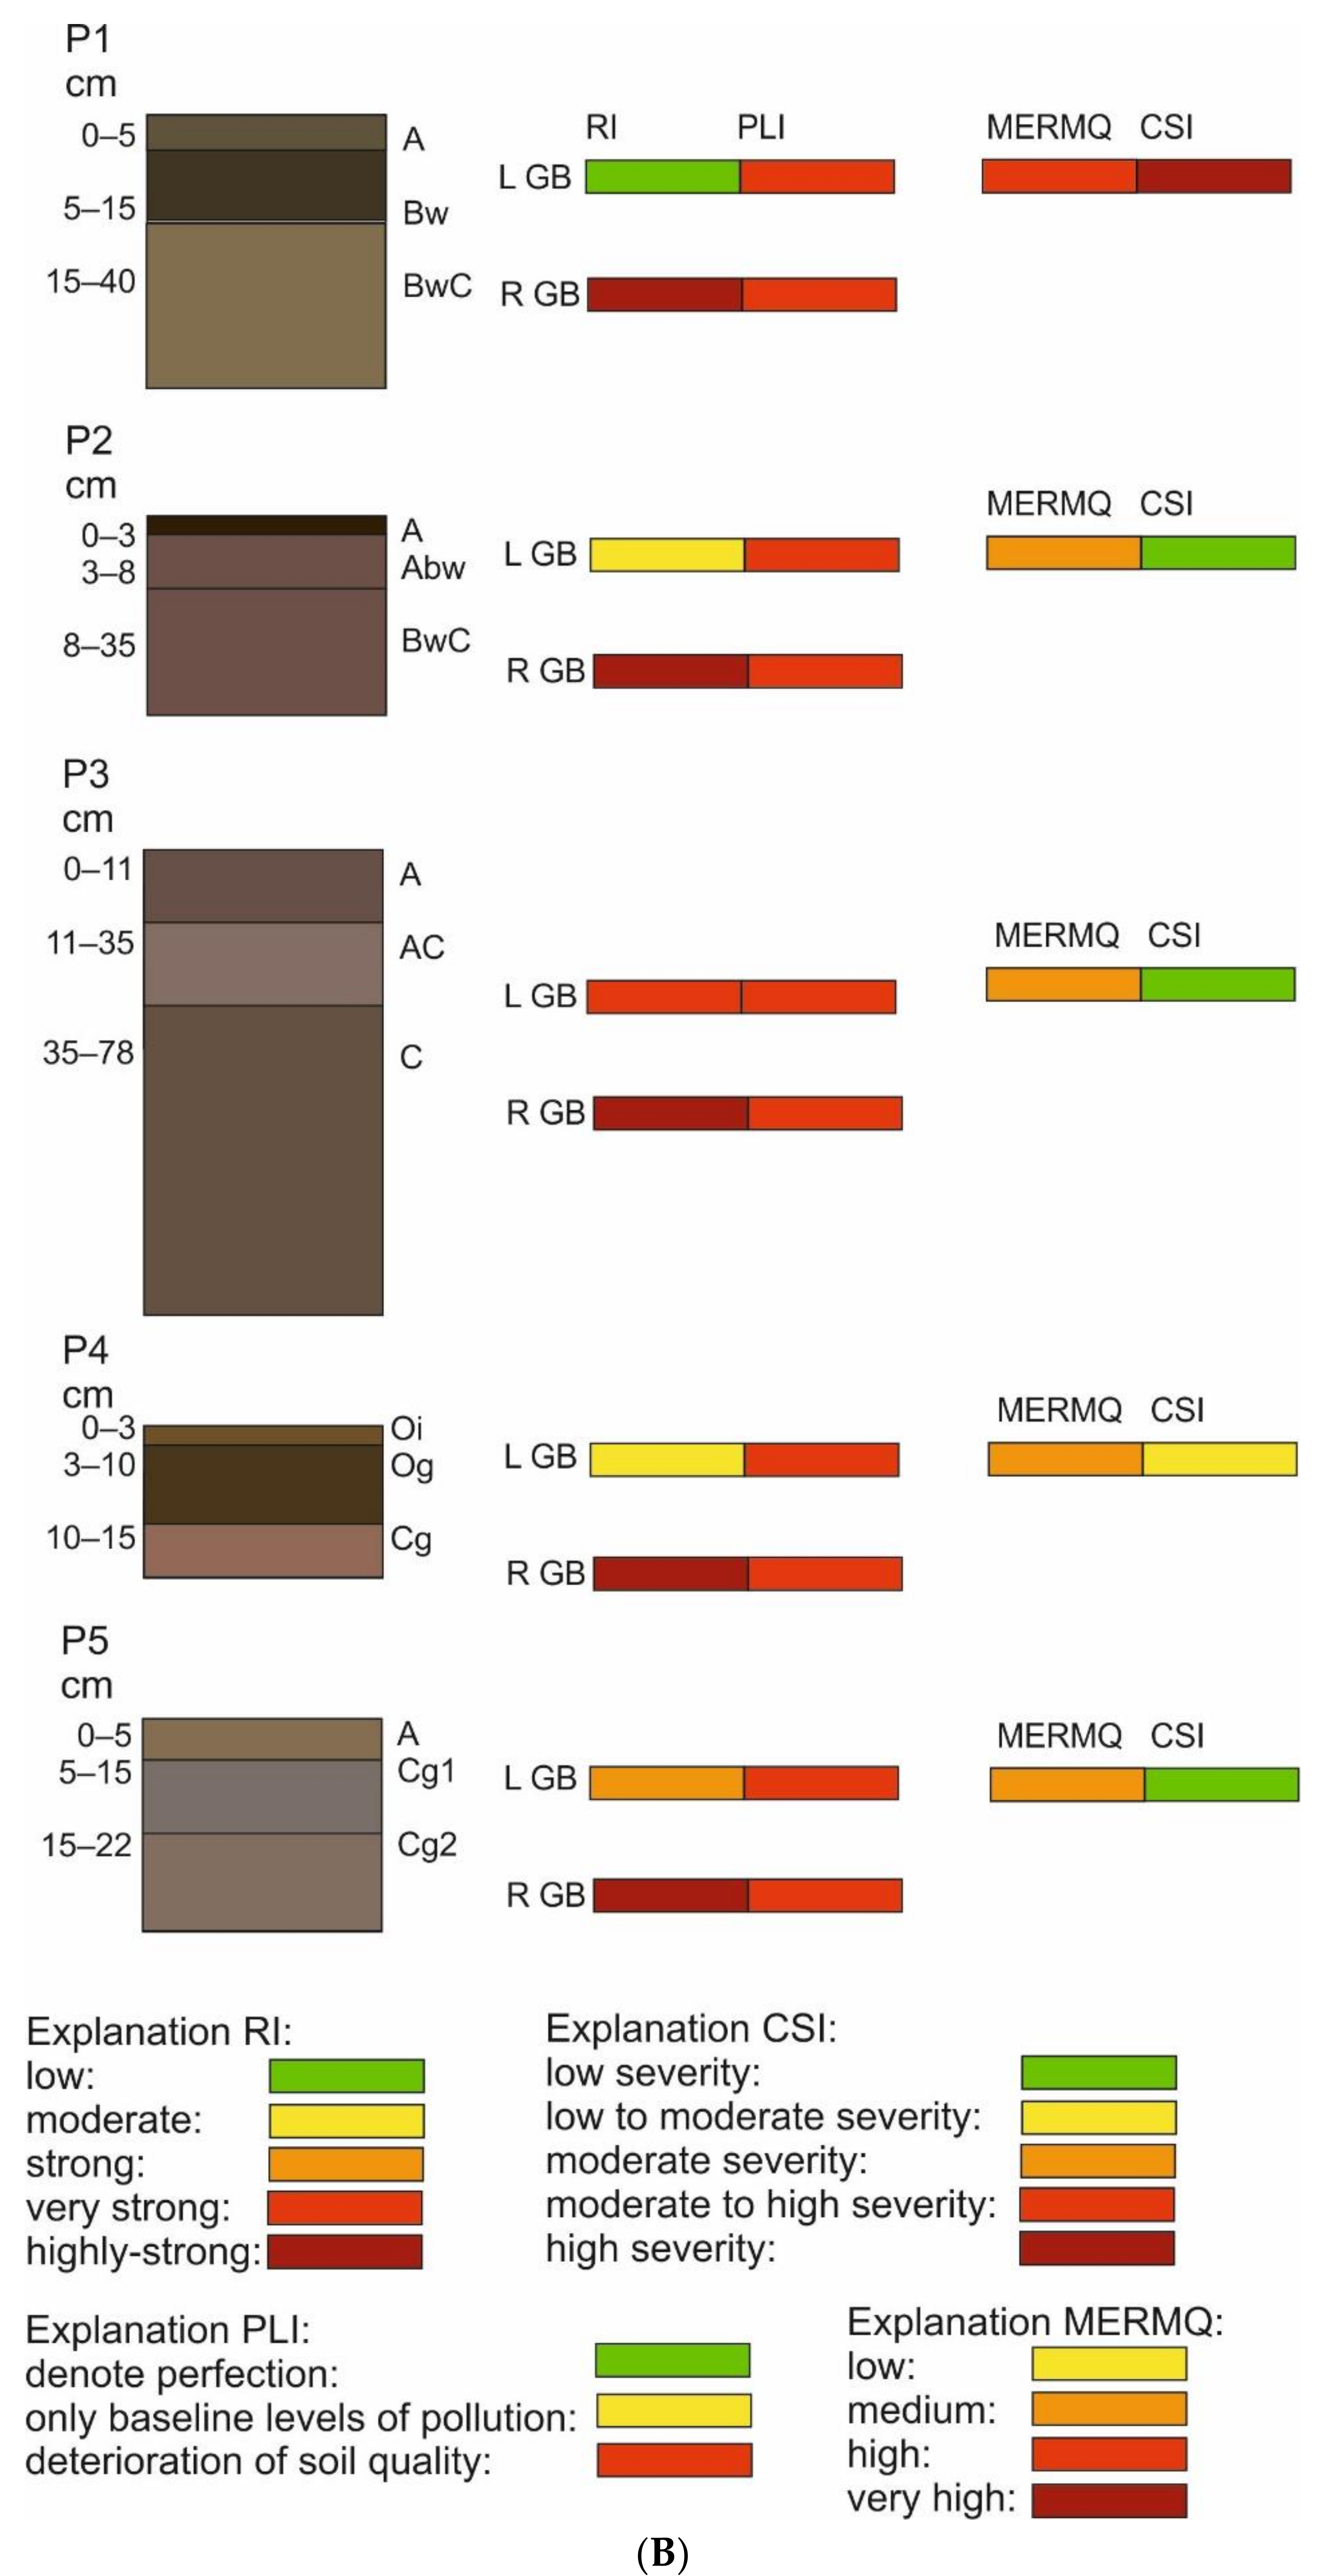
3.1. Soil Classification, Morphology and Basic Chemical and Physical Properties
3.2. Content of Potentially Toxic Elements
3.3. Analysis of the Pollution Indices
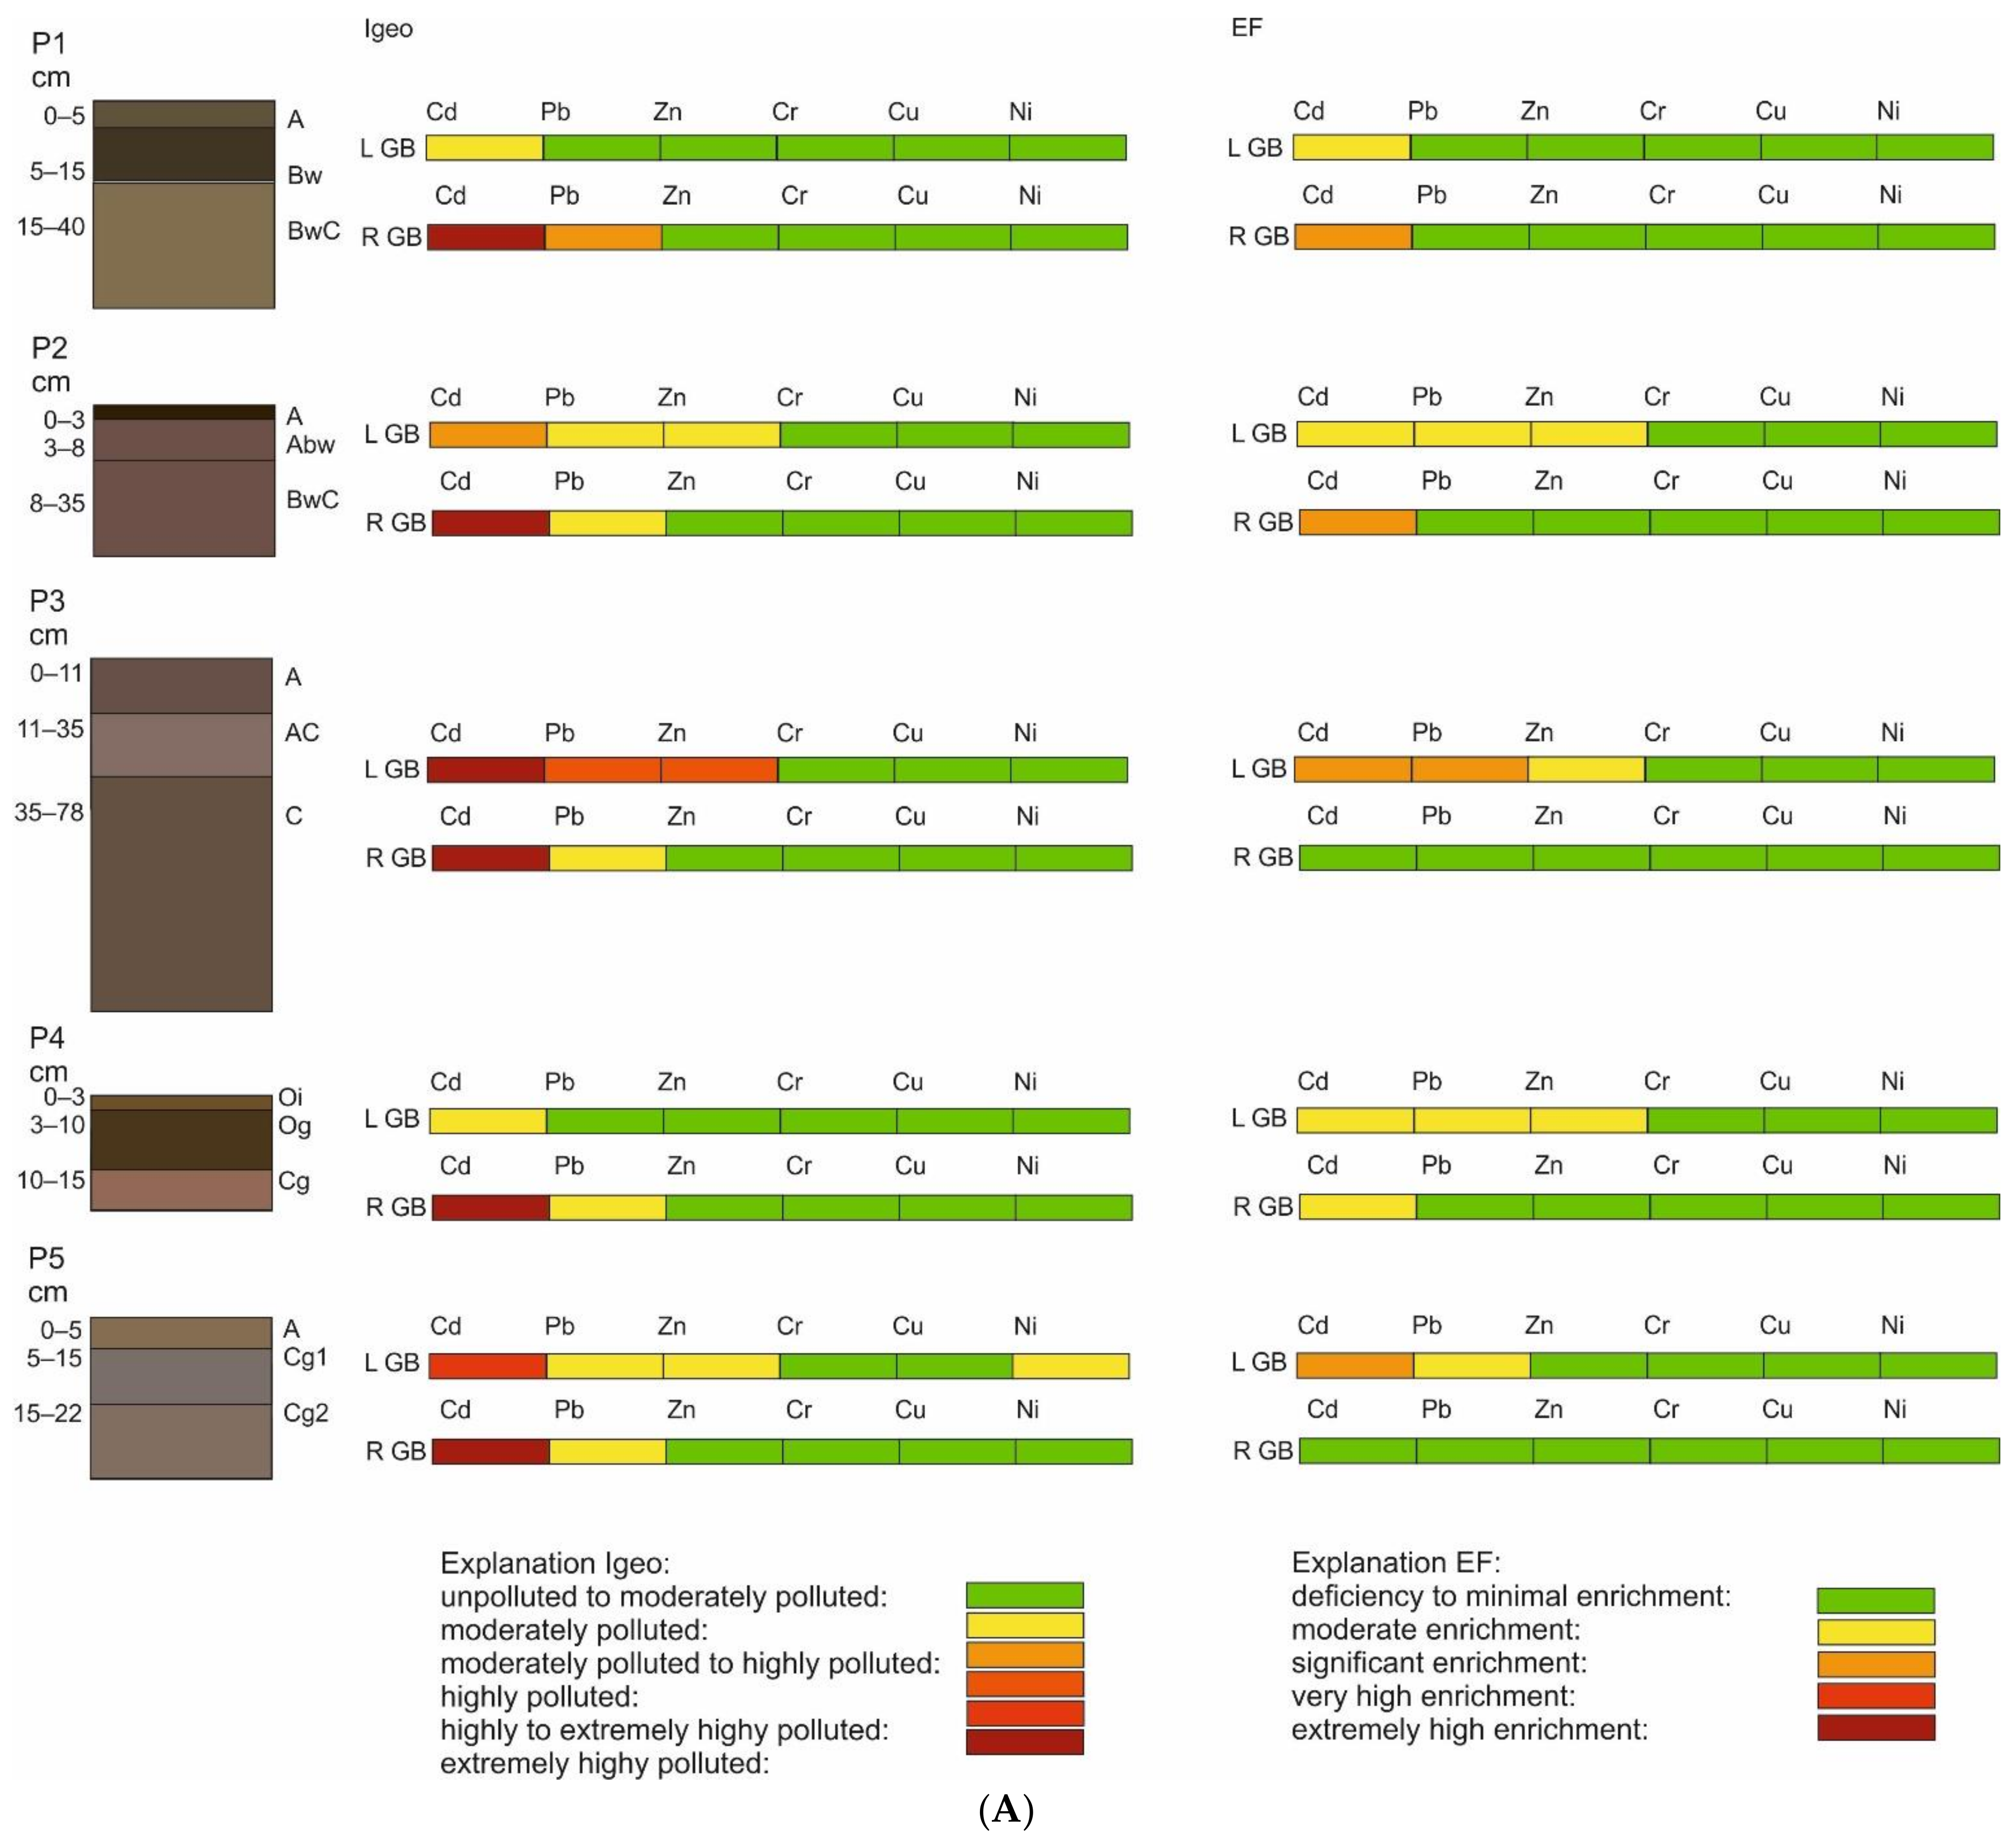
3.3.1. EF
3.3.2. Igeo
3.3.3. RI
3.3.4. PLI
3.3.5. MERMQ
3.3.6. CSI
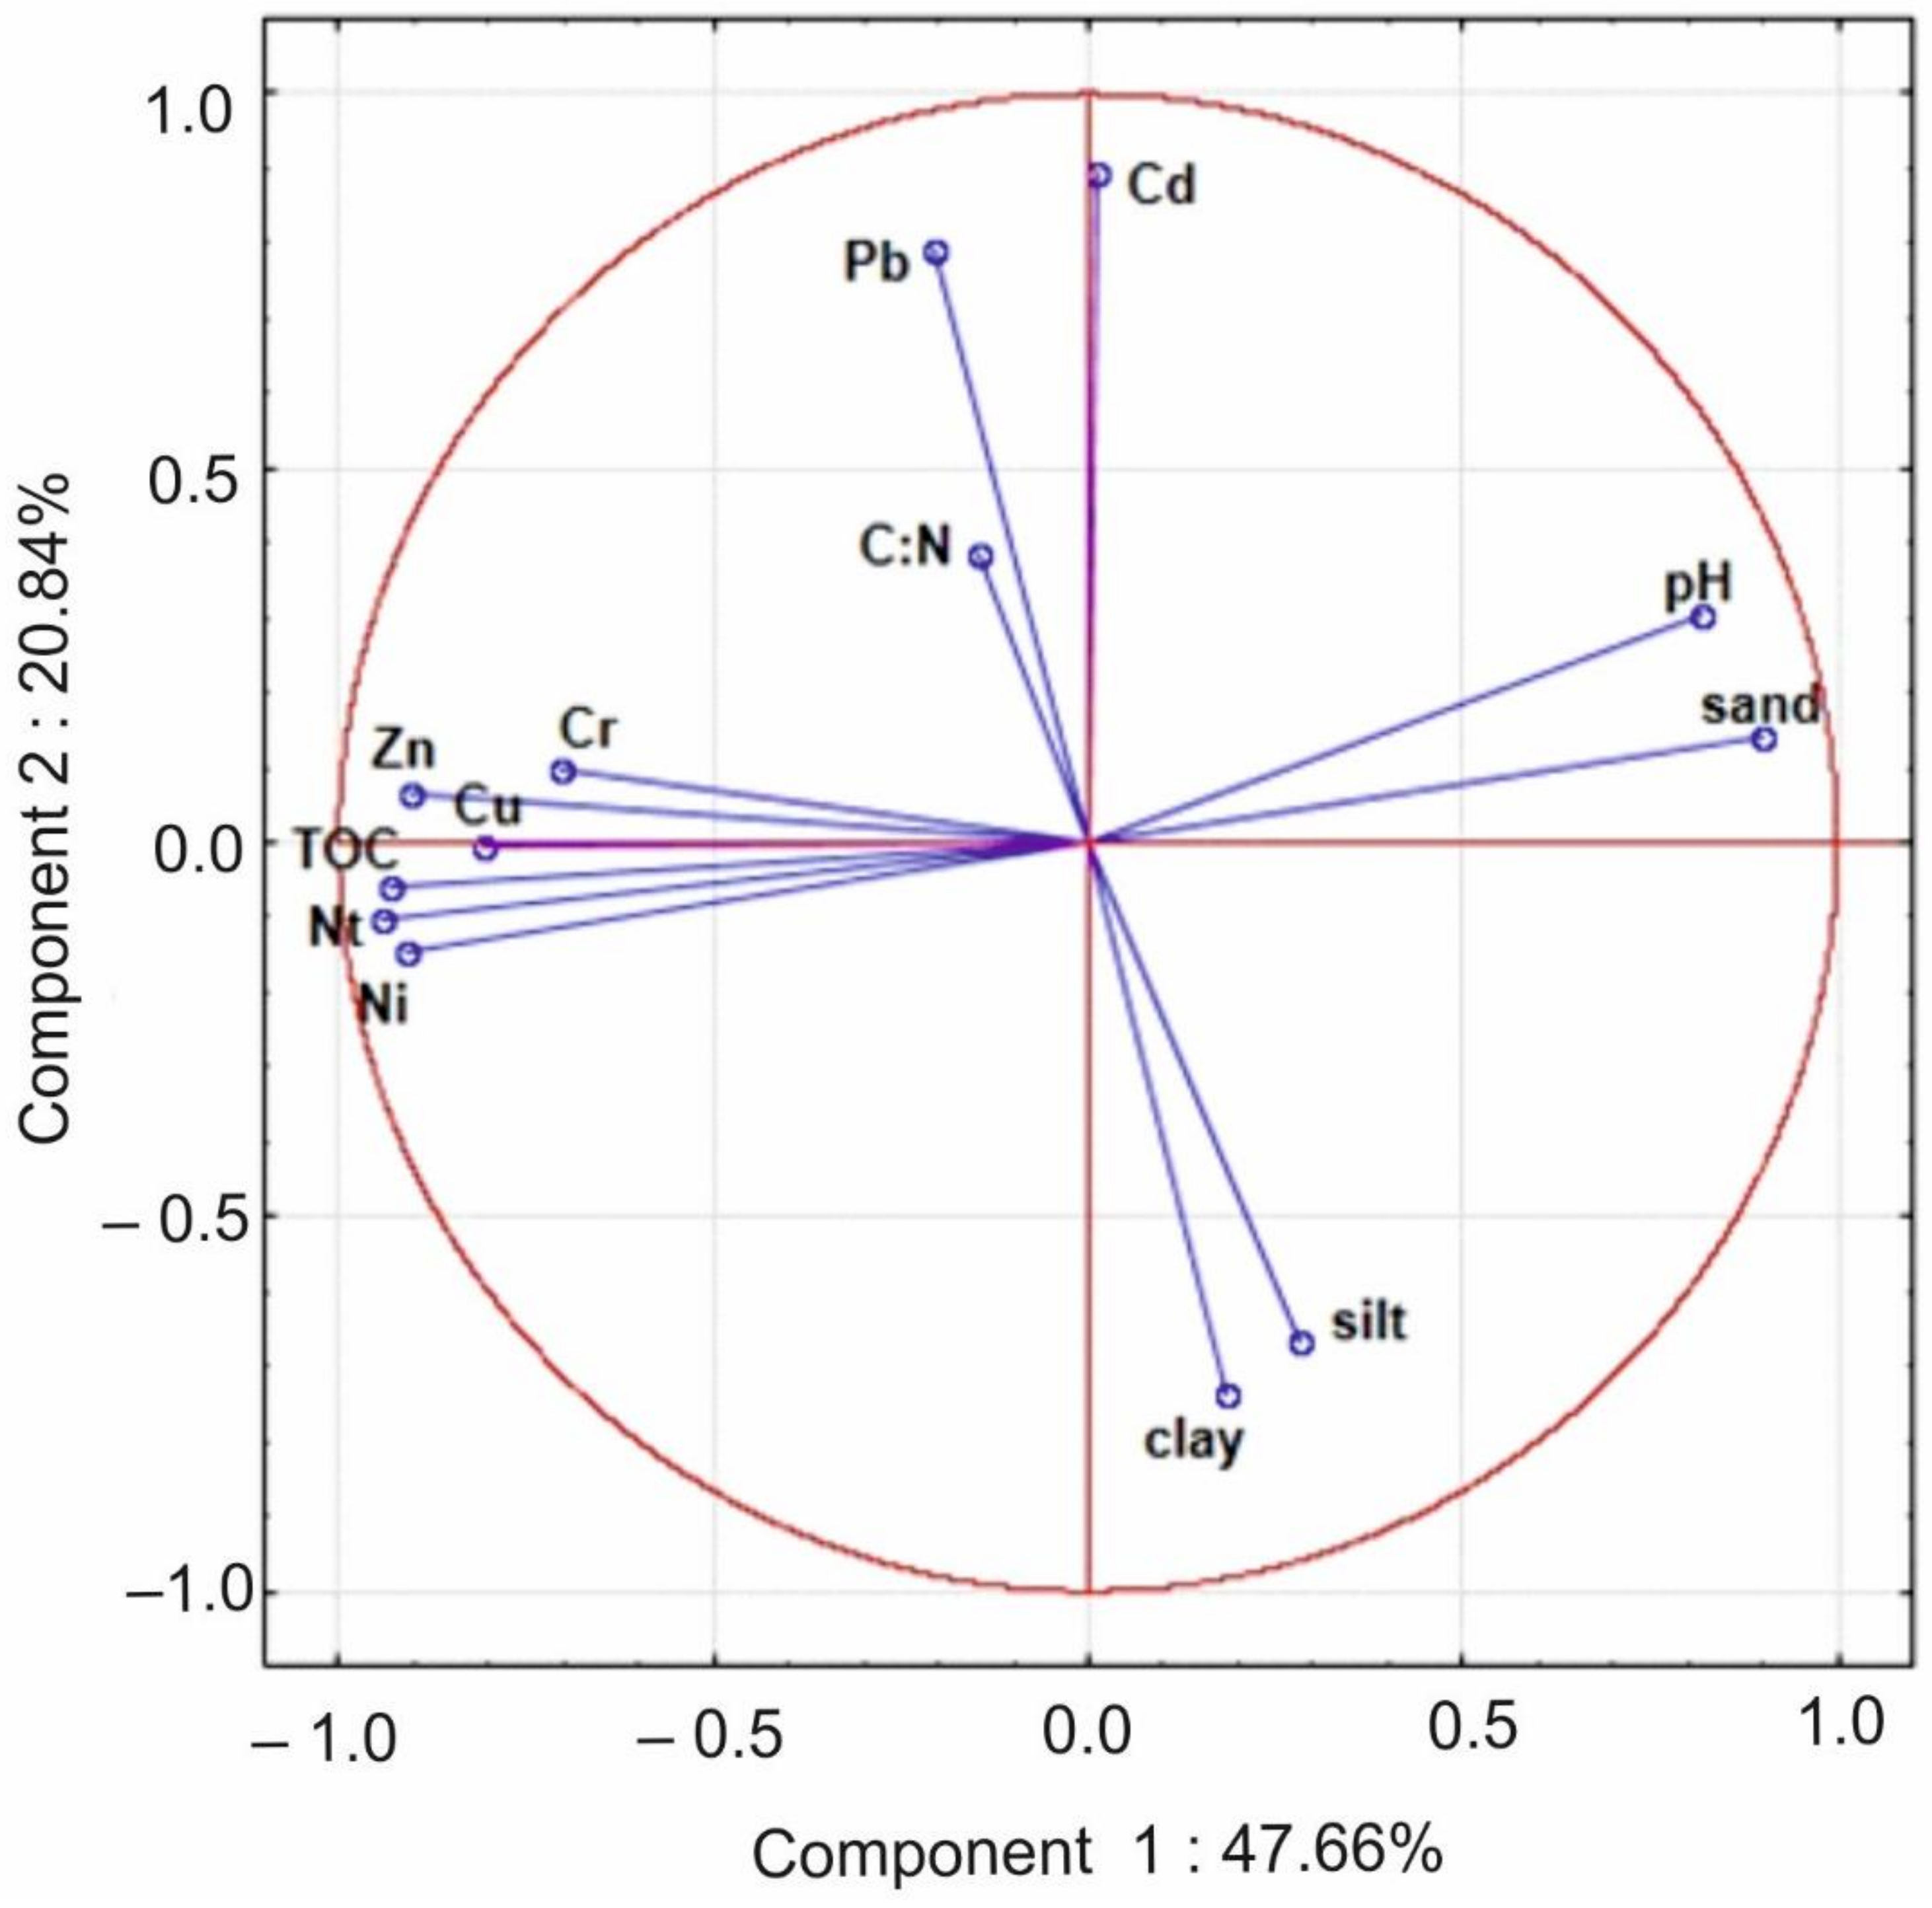
3.4. PCA Analysis
4. Discussion
4.1. Assessment of PTE Contamination of Kaffiøyra Soils on the Basis of the Analysed Pollution Indices
4.2. Determination of the Potential Sources of PTE in the Kaffiøyra Region
5. Conclusions
Author Contributions
Funding
Institutional Review Board Statement
Informed Consent Statement
Data Availability Statement
Conflicts of Interest
References
- Halbach, K.; Mikkelsen, Ø.; Berg, T.; Steinnes, E. The presence of mercury and other trace metals in surface soils in the Norwegian Arctic. Chemosphere 2017, 188, 567–574. [Google Scholar] [CrossRef] [PubMed]
- Jaworowski, Z. Pollution of the Norwegian Arctic: A review. Nor. Polarinst. Rapp. 1989, 55, 95. [Google Scholar]
- Jefferies, R.L.; Rockwell, R.F. Foraging Geese, Vegetation loss and soil degradation in an Arctic Salt Marsh. Appl. Veg. Sci. 2002, 5, 7–16. [Google Scholar] [CrossRef]
- Łokas, E.; Wachniew, P.; Jodłowski, P.; Gąsiorek, M. Airborne radionuclides in the proglacial environment as indicators of sources and transfers of soil material. J. Environ. Radioact. 2017, 178–179, 193–202. [Google Scholar] [CrossRef]
- Mann, D.H.; Sletten, R.S.; Ugolini, F.C. Soil development at Kongsfjorden, Spitsbergen. Pol. Polar Res. 1986, 4, 1–16. [Google Scholar] [CrossRef]
- Sobota, I. Snow accumulation, melt, mass loss, and the near-surface ice temperature structure of Irenebreen, Svalbard. Polar Sci. 2011, 5, 327–336. [Google Scholar] [CrossRef]
- Sobota, I. Selected problems of snow accumulation on glaciers during long-term studies in north-western Spitsbergen, Svalbard. Geogr. Ann. Ser. A Phys. Geogr. 2017, 99, 177–192. [Google Scholar] [CrossRef]
- Szymański, W.; Skiba, M.; Wojtuń, B.; Drewnik, M. Soil properties, micromorphology, and mineralogy of Cryosols from sorted and unsorted patterned grounds in the Hornsund area, SW Spitsbergen. Geoderma 2015, 253–254, 1–11. [Google Scholar] [CrossRef]
- Szymański, W. Quantity and chemistry of water-extractable organic matter in surface horizons of Arctic soils under different types of tundra vegetation—A case study from the Fuglebergsletta coastal plain (SW Spitsbergen). Geoderma 2017, 305, 30–39. [Google Scholar] [CrossRef]
- Szymański, W.; Maciejowski, W.; Ostafin, K.; Ziaja, W.; Sobucki, M. Impact of parent material, vegetation cover, and site wetness on variability of soil properties in proglacial areas of small glaciers along the northeastern coast of Sørkappland (SE Spitsbergen). Catena 2019, 183, 104209. [Google Scholar] [CrossRef]
- Chadburn, S.E.; Burke, E.J.; Cox, P.M.; Friedlingstein, P.; Hugelius, G.; Westermann, S. An observation-based constraint on permafrost loss as a function of global warming. Nat. Clim. Chang. 2017, 7, 340–344. [Google Scholar] [CrossRef]
- Straneo, F.; Heimbach, P. North Atlantic warming and the retreat of Greenland’s outlet glaciers. Nature 2013, 504, 36–43. [Google Scholar] [CrossRef]
- Evseev, A.V.; Krasovskaya, T.M. Toxic metals in soils of the Russian North. J. Geochem. Explor. 2015, 174, 128–131. [Google Scholar] [CrossRef]
- Kabała, C.; Zapart, J. Initial soil development and carbon accumulation on moraines of the rapidly retreating Werenskiold Glacier, SW Spitsbergen, Svalbard archipelago. Geoderma 2012, 175–176, 9–20. [Google Scholar] [CrossRef]
- Nikitina, M.; Popova, L.; Korobitcina, J.; Efremova, O.; Trofimova, A.; Nakvasina, E.; Volkov, A. Environmental status of the arctic soils. J. Elem. 2015, 20, 643–651. [Google Scholar] [CrossRef]
- Plichta, W.; Kuczyńska, I.; Sapek, A. Profile distribution of metals in Gelic Cambisols of Kaffiøyra, Spitsbergen. Pol. Polar Res. 1991, 2, 195–201. [Google Scholar]
- Szymański, W.; Skiba, S.; Wojtuń, B. Distribution, genesis, and properties of Arctic soils: A case study from the Fuglebekken catchment, Spitsbergen. Pol. Polar Res. 2013, 34, 289–304. [Google Scholar] [CrossRef]
- Weckwerth, P.; Sobota, I. Morphology and surficial sediments of the Waldemar River confined outwash fan. Bull. Geogr. Phys. Geogr. Ser. 2015, 13, 61–70. [Google Scholar] [CrossRef]
- Antcibor, I.; Eschenbach, A.; Zubrzycki, S.; Kutzbach, L.; Bolshiyanov, D.; Pfeiffer, E.M. Trace metal distribution in pristine permafrost-affected soils of the Lena River delta and its hinterland, northern Siberia, Russia. Biogeosciences 2014, 11, 1–15. [Google Scholar] [CrossRef]
- Skiba, S.; Ziaja, W. Influence of the twentieth-century evolution of the environment on state of preservation of the southern part of the Spitsbergen National Park. In Struktura i Funkcjonowanie Środowiska Przyrodniczego Sorkapplandu (Spitsbergen, Svalbard)—Sorkappland Landscape Structure and Functioning (Spitsbergen, Svalbard); Ziaja, W., Skiba, S., Eds.; Wyd. UJ: Kraków, Poland, 2002; pp. 107–113. (In Polish) [Google Scholar]
- Skiba, S.; Drewnik, M.; Kacprzak, A. Gleby zachodniego wybrzeża Sørkapplandu. In Struktura i Funkcjonowanie Środowiska Przyrodniczego Sorkapplandu (Spitsbergen, Svalbard)—Sorkappland Landscape Structure and Functioning (Spitsbergen, Svalbard); Ziaja, W., Skiba, S., Eds.; Wyd. UJ: Kraków, Poland, 2002; pp. 52–55. (In Polish) [Google Scholar]
- Ziaja, W. Functioning in the structure of nature environment of Sørkappland. In Struktura i Funkcjonowanie Środowiska Przyrodniczego Sorkapplandu (Spitsbergen, Svalbard)—Sorkappland Landscape Structure and Functioning (Spitsbergen, Svalbard); Ziaja, W., Skiba, S., Eds.; Wyd. UJ: Kraków, Poland, 2002; pp. 16–17. (In Polish) [Google Scholar]
- Mohan, M.; Sreelakshmi, U.; Vishnu Sagar, M.K.; Gopikrishna, V.G.; Pandit, G.G.; Sahu, S.K.; Tiwari, M.; Ajmal, P.Y.; Kannan, V.M.; Abdul Shukkur, M.; et al. Rate of sediment accumulation and historic metal contamination in a tidewater glacier fjord, Svalbard. Mar. Pollut. Bull. 2018, 131, 453–459. [Google Scholar] [CrossRef]
- Ziółek, M.; Bartmi, P.; Stach, A. The influence of seabirds on the concentration of selected heavy metals in organic soil on the Bellsund coast, western Spitsbergen. Arct. Antarct. Alp. Res. 2017, 49, 507–520. [Google Scholar] [CrossRef]
- Perryman, C.R.; Wirsing, J.; Bennett, K.A.; Brennick, O.; Perry, A.L.; Williamson, N.; Ernakovich, J.G. Heavy metals in the Arctic: Distribution and enrichment of five metals in Alaskan soils. PLoS ONE 2020, 15, e0233297. [Google Scholar] [CrossRef]
- Hao, Z.L.; Wang, F.; Yang, H.Z. Baseline values for heavy metals in soils on Ny-Alesund, Spitsbergen Island, Arctic: The extent of anthropogenic pollution. Adv. Mater. Res. 2013, 779, 1260–1265. [Google Scholar] [CrossRef]
- Lantzy, R.J.; Mackenzie, F.T. Atmospheric trace metals: Global cycles and assessment of man’s impact. Geochim. Cosmochim. Acta 1979, 43, 511–525. [Google Scholar] [CrossRef]
- Bottenheim, J.W.; Dastoor, A.; Gong, S.L.; Higuchi, K.; Li, Y.F. Long Range Transport of Air Pollution to the Arctic. In The Handbook of Environmental Chemistry; Springer: Berlin/Heidelberg, Germany, 2004; Volume 4, pp. 13–39. [Google Scholar] [CrossRef]
- MacDonald, R.W.; Barrie, L.A.; Bidleman, T.F.; Diamond, M.L.; Gregor, D.J.; Semkin, R.G.; Strachan, W.M.J.; Li, Y.F.; Wania, F.; Alaee, M.; et al. Contaminants in the Canadian Arctic: 5 years of progress in understanding sources, occurrence and pathways. Sci. Total Environ. 2000, 254, 93–234. [Google Scholar] [CrossRef]
- Askaer, L.; Schmidt, L.B.; Elberling, B.; Asmund, G.; Jónsdóttir, I.S. Environmental impact on an Arctic soil–plant system resulting from metals released from coal mine waste in Svalbard (78 N). Water Air Soil Pollut. 2008, 195, 99–114. [Google Scholar] [CrossRef]
- Gao, X.; Chen, C.T.A. Heavy metals pollution status in surface sediments of the coastal Bohai Bay. Water Res. 2012, 46, 1901–1911. [Google Scholar] [CrossRef]
- Håkanson, L. An ecological risk index for aquatic. pollution control: A sedimentological approach. Water Res. 1980, 14, 975–1001. [Google Scholar] [CrossRef]
- Kowalska, J.; Mazurek, R.; Gąsiorek, M.; Setlak, M.; Zaleski, T.; Waroszewski, J. Soil pollution indices conditioned by medieval metallurgical activity—A case study from Krakow (Poland). Environ. Pollut. 2016, 218, 1023–1036. [Google Scholar] [CrossRef]
- Kowalska, J.B.; Mazurek, R.; Gąsiorek, M.; Zaleski, T. Pollution indices as useful tools for the comprehensive evaluation of the degree of soil contamination—A review. Environ. Geochem. Health 2018, 40, 2395–2420. [Google Scholar] [CrossRef]
- Mazurek, R.; Kowalska, J.; Gąsiorek, M.; Zadrożny, P.; Józefowska, A.; Zaleski, T.; Kępka, W.; Tymczuk, M.; Orłowska, K. Assessment of heavy metals contamination in surface layers of Roztocze National Park forest soils (SE Poland) by indices of pollution. Chemosphere 2017, 168, 839–850. [Google Scholar] [CrossRef] [PubMed]
- Mazurek, R.; Kowalska, J.; Gąsiorek, M.; Zadrożny, P.; Wieczorek, J. Pollution indices as comprehensive tools for evaluation of the accumulation and provenance of PTE in soils in Ojców National Park. J. Geochem. Explor. 2019, 201, 13–30. [Google Scholar] [CrossRef]
- Müller, G. Index of geoaccumulation in sediments of the Rhine River. Geojournal 1969, 2, 108–118. [Google Scholar] [CrossRef]
- Sobota, I.; Araźny, A.; Barcikowski, A.; Birkenmajer, K.; Grześ, M.; Gugnacka-Fiedor, W.; Lankauf, K.R.; Plichta, W.; Przybylak, R.; Zubel, P. Środowisko geograficzne otoczenia Stacji Polarnej Uniwersytetu Mikołaja Kopernika—Kaffiøyra. In Dawne i Współczesne Geoekosystemy Spitsbergenu: Polskie Badania Geomorfologiczne; Zwoliński, Z., Kostrzewski, A., Pulina, M., Eds.; Bogucki Wydawnictwo Naukowe: Poznań, Poland, 2013; pp. 181–204. (In Polish) [Google Scholar]
- Przybylak, R.; Araźny, A. Klimat Kaffiøyry. In Kaffiøyra. Zarys Środowiska Geograficznego Kaffiøyry (NW Spitsbergen); Sobota, I., Grześ, M., Eds.; TURPRESS: Toruń, Poland, 2005; pp. 27–29. (In Polish) [Google Scholar]
- Sobota, I.; Dziembowski, M.; Grajewski, T.; Weckwerth, P.; Nowak, M.; Greń, K. Short-term changes in thermal conditions and active layer thickness in the tundra of the Kaffiøyra region, NW Spitsbergen. Bull. Geogr. Phys. Geogr. Ser. 2016, 11, 43–53. [Google Scholar] [CrossRef]
- Niewiarowski, W.; Pazdur, M.F.; Sienkiewicz, M. Glacial and marine episodes in Kaffiøyra, North-Western Spitsbergen, during the Weichselian (Vistulian) and the Holocene. Pol. Polar Res. 1993, 14, 21–34. [Google Scholar]
- Lankauf, K.R. Budowa geologiczna i rzeźba rejonu Kaffiøyry. In Kaffiøyra. Zarys Środowiska Geograficznego Kaffiøyry (NW Spitsbergen); Sobota, I., Grześ, M., Eds.; TURPRESS: Toruń, Poland, 2005; pp. 7–11. (In Polish) [Google Scholar]
- Plichta, W. Kaffiøyra’s Soils, Spitsbergen, Monographic Sketch; UMK: Toruń, Poland, 1993; p. 60. [Google Scholar]
- Klimaszewski, M. Geomorphological studies of the western part of Spitsbergen between Kongsfjorden and Eidembukta. Zesz. Nauk. Uniw. Jagiell. 32 Pr. Geogr. 1960, 1, 1–89. [Google Scholar]
- Niewiarowski, W. Morphology of the forefield of the Aavatsmark Glacier (Oscar II Land, NW Spitsbergen) and phases of its formation. Acta Univ. N. Copernic. Geogr. 1982, 16, 15–43. [Google Scholar]
- Szczepanik, W. Selected problems in the hydrography of the cachment basin of the Waldemar River (West Spitsbergen, Oscar II Land). Acta Univ. N. Copernic. Geogr. 1997, 13, 113–126. [Google Scholar]
- Smirnova, T.S.; Mazlova, E.A.; Kulikova, O.A.; Ostrovkin, I.M.; Gonopolsky, A.M.; Cheloznova, K.V. Chemical and biological indicators for evaluation of arctic soil degradation and its potential to remediation. J. Environ. Eng. Landsc. Manag. 2021, 29, 33–39. [Google Scholar] [CrossRef]
- Bednarek, R.; Skiba, S. Geography of world soils. In Soil Science; Mocek, A., Ed.; PWN: Warszawa, Poland, 2015; pp. 367–373. (In Polish) [Google Scholar]
- Skiba, S.; Kuczek, M. Preliminary studies of the soil cover in North-West Sorkappland. SW Spitsbergen. Sci. Noteb. Jagiellonian Univ. Geogr. Work 1993, 94, 93–103. (In Polish) [Google Scholar]
- Lev, A.; King, R.H. Spatial variation of soil development in a high arctic soil landscape: Truelove Lowland, Devon Island, Nunavut, Canada 1999. Permafr. Periglac. Process. 1999, 10, 289–307. [Google Scholar] [CrossRef]
- Negoiţǎ, T.G.; Ropotǎ, M. Heavy metals Ions Determination in the Arctic Soils. Anal. Lett. 2008, 33, 729–738. [Google Scholar] [CrossRef]
- Rachlewicz, G.; Szczuciński, W.; Ewertowski, M. Post—“Little Ice Age” retreat rates of glaciers around Billefjorden in central Spitsbergen, Svalbard. Pol. Polar Res. 2007, 28, 159–186. [Google Scholar]
- Tazaki, K.; Fyfe, W.S.; Iwatsuki, M. Clues to Arctic soil erosion from cryo-electron microscopy of smectite. Nature 1988, 333, 245–247. [Google Scholar] [CrossRef]
- Łokas, E.; Zwoliński, Z.; Rachlewicz, G.; Gąsiorek, M.; Wilkosz, G.; Samolej, K. Distribution of anthropogenic and naturally occurring radionuclides in soils and lakes of Central Spitsbergen (Arctic). J. Radioanal. Nucl. Chem. 2017, 311, 707–717. [Google Scholar] [CrossRef]
- Kasprzak, M.; Strzelecki, M.C.; Traczyk, A.; Kondracka, M.; Lim, M.; Migała, K. On the potential for a bottom active layer below coastal permafrost: The impact of seawater on permafrost degradation imaged by electrical resistivity tomography (Hornsund, SW Spitsbergen). Geomorphology 2017, 293, 347–359. [Google Scholar] [CrossRef]
- Marciniak, K.; Marszelewski, W. Wybrane problemy hydrologiczne lodowca Elizy (Ziemia Oskara II, NW Spitsbergen). Acta Univ. N. Copernic. Geogr. 1991, 22, 125–161. (In Polish) [Google Scholar]
- Sobota, I. Zarys hydrografii Kaffioyry. In Kaffioyra. Zarys Środowiska Geograficznego Kaffioyry; NW Spitsbergen: Toruń, Poland, 2005; pp. 13–16. [Google Scholar]
- Szczepanik, W. Reżim wybranych rzek Kaffiøyry (Ziemia Oskara II, NW Spitsbergen) w okresie lata polarnego. Acta Univ. N. Copernic. Geogr. 1993, 24, 55–146. (In Polish) [Google Scholar]
- Węgrzyn, M.; Wietrzyk, P.; Adamska, E.; Nicia, P. New records of driftwood lichens in the Kaffiøyra Plain (NW Spitsbergen, Svalbard). Pol. Polar Res. 2015, 36, 189–195. [Google Scholar] [CrossRef]
- Węgrzyn, M.; Wietrzyk, P. Phytosociology of snowbed and exposed ridge vegetation of Svalbard. Polar Biol. 2015, 38, 1905–1917. [Google Scholar] [CrossRef]
- Węgrzyn, M.; Wietrzyk, P.; Lisowska, M.; Klimek, B.; Nicia, P. What influences heavy metals accumulation in Arctic lichen Cetrariella delisei in Svalbard? Polar Sci. 2016, 10, 532–540. [Google Scholar] [CrossRef]
- IUSS Working Group WRB. World Reference Base for Soil Resources. In International Soil Classification System for Naming Soils and Creating Legends for Soil Maps, 4th ed.; International Union of Soil Sciences (IUSS): Vienna, Austria, 2022. [Google Scholar]
- Oyama, M.; Takehara, H. Revised Standard Soil Color Charts; Research Council for Agriculture, Forestry and Fisheries: Tsukuba, Japan, 1970; p. 810. [Google Scholar]
- Van Reeuwijk, L.P. Procedures for Soil Analysis, 6th ed.; ISRIC: Wageningen, The Netherlands, 2002. [Google Scholar]
- Nelson, D.W.; Sommers, E. Total carbon, organic carbon, and organic matter. In Methods of Soil Analysis. Part 3. Chemical Methods; Sparks, D.L., Page, A.L., Helmke, P.A., Loeppert, R.H., Soltanpour, P.N., Tabatabai, M.A., Johnstone, C.T., Sumner, M.E.l., Eds.; SSSA Book Series; SSSA and ASA: Madison, WI, USA, 1996; Volume 5, pp. 961–1010. [Google Scholar]
- Kowalenko, C.G. Assessment of Leco CNS-2000 analyzer for simultaneously measuring total carbon, nitrogen, and sulphur in soil. Commun. Soil Sci. Plant Anal. 2001, 32, 2065–2078. [Google Scholar] [CrossRef]
- Ostrowska, A.; Gawliński, S.; Szczubiałka, Z. Methods of Analysis and Evaluation of Properties of Soils and Plants; Institute of Environmental Protection: Warsaw, Poland, 1991; p. 333. (In Polish) [Google Scholar]
- Gąsiorek, M.; Kowalska, J.; Mazurek, R.; Pająk, M. Comprehensive assessment of heavy metals pollution in topsoil of historical urban park on an example of the Planty Park in Krakow (Poland). Chemosphere 2017, 179, 148–158. [Google Scholar] [CrossRef]
- Pejman, A.; Gholamrez Nabi, B.; Saeedi, M.; Baghvanda, A. A new index for assessing heavy metals contamination in sediments: A case study. Ecol. Indic. 2015, 58, 365–373. [Google Scholar] [CrossRef]
- Varol, M. Assessment of heavy metals contamination in sediments of the Tigris River (Turkey) using pollution indices and multivariate statistical techniques. J. Hazard. Mater. 2011, 195, 355–364. [Google Scholar] [CrossRef]
- Sutherland, R.A. Bed sediment-associated trace metals in an urban stream, Oahu, Hawaii. Environ. Geol. 2000, 39, 611–627. [Google Scholar] [CrossRef]
- Rudnick, R.L.; Gao, S. Composition of the continental crust. Treatise Geochem. 2003, 3, 659. [Google Scholar] [CrossRef]
- Gong, Q.; Deng, J.; Xiang, Y.; Wang, Q.; Yang, L. Calculating pollution indices by heavy metals in ecological geochemistry assessment and a case study in parks of Beijing. J. China Univ. Geosci. 2008, 19, 230–241. [Google Scholar] [CrossRef]
- FAO. Guidelines for Soil Description, 4th ed.; FAO: Rome, Italy, 2006; p. 109. [Google Scholar]
- AMAP. AMAP Assessment Report: Arctic Pollution Issues; Arctic Monitoring and Assessment Programme (AMAP): Tromsø, Norway, 1998. [Google Scholar]
- AMAP. AMAP Assessment 2002: Heavy Metals in the Arctic; Arctic Monitoring and Assessment Programme (AMAP): Tromsø, Norway, 2005. [Google Scholar]
- Gulińska, J.; Rachlewicz, G.; Szczuciński, W.; Barałkiewicz, D.; Kózka, M.; Bulska, E.; Burzyk, M. Soil contamination in high arctic areas of human impact, central Spitsbergen, Svalbard. Pol. J. Environ. Stud. 2003, 6, 701–707. [Google Scholar]
- Grodzińska, K.; Godzik, B. Heavy metals and sulphur in mosses from southern Spitsbergen. Pol. Polar Res. 1991, 2, 133–140. [Google Scholar] [CrossRef]
- Jóźwik, Z. Contents of Cu, Mn, Zn, Pb and Cd in the plants of Calypsostranda—Bellsund Region (Western Spitsbergen). In Proceedings of the 21st Polar Symposium, Warszawa, Poland, 22–23 September 1994; pp. 251–254. [Google Scholar]
- Jóźwik, Z.; Magierski, J. Trace Elements in Plants and Soils of Coastal Plains of South Bellsund (Western Spitsbergen); Geographic Expedition to Spitsbergen; UMCS: Lublin, Poland, 1992; pp. 171–177. [Google Scholar]
- Melke, J. The contents of selected trace elements in the soils of Bellsund, Spitsbergen. Pol. J. Soil Sci. 2006, 39, 21–32. [Google Scholar]
- Melke, J.; Uziak, S. Heavy metals in soils and vascular plants of the Bellsund area (Spitsbergen). Pol. J. Soil Sci. 2006, 2, 151–164. [Google Scholar]
- Hanaka, A.; Plak, A.; Zagórski, P.; Ozimek, E.; Rysiak, A.; Majewska, M.; Jaroszuk-Ściseł, J. Relationships between the properties of Spitsbergen soil, number and biodiversity of rhizosphere microorganisms, and heavy metals concentration in selected plant species. Plant Soil 2019, 436, 49–69. [Google Scholar] [CrossRef]
- Ottesen, R.T. Geochemistry of superficial deposits. In Geoscience Atlas of Svalbard; Norwegian Polar Institute Report, 148; Dallmann, W.K., Ed.; Norwegian Polar Institute: Tromsø, Norway, 2015; pp. 241–247. Available online: http://hdl.handle.net/11250/2580810 (accessed on 22 September 2022).
- Ottar, B. The transfer of airborne pollutants to the Arctic region. Atmos. Environ. 1981, 15, 1439–1445. [Google Scholar] [CrossRef]
- Landing, W.M.; Paytan, A. Marine chemistry special issue: Aerosol chemistry and impacts on the ocean. Mar. Chem. 2010, 120, 197. [Google Scholar] [CrossRef]
- Węgrzyn, W.; Lisowska, M.; Nicia, P. The value of the terricolous lichen Cetrariella delisei in the biomonitoring of trace and heavy metals levels in Svalbard. Pol. Polar Res. 2013, 4, 375–382. [Google Scholar] [CrossRef]
- Gałuszka, A. Different approaches in using and understanding the term “Geochemical background”—Practical implications for environmental studies. Pol. J. Environ. Stud. 2007, 16, 389–395. [Google Scholar]
- Matschullat, J.; Ottenstein, R.; Reimann, C. Geochemical background—Can we calculate it? Environ. Geol. 2000, 39, 990–1000. [Google Scholar] [CrossRef]
- Reinmann, C.; Garret, R.G. Geochemical background—Concept and reality. Sci. Total Environ. 2005, 350, 12–27. [Google Scholar] [CrossRef]
- Leroux, V.; Dahlin, T. Time-lapse resistivity investigations for imaging saltwater transport in glaciofluvial deposits. Environ. Geol. 2006, 49, 347–358. [Google Scholar] [CrossRef]
- Nenonen, K.; Nikkarinen, M. Natural arsenic, chromium and nickel concentrations in Finnish soil. Is Finnish soil naturally clean? In “Environmental Research in Finland Today”, Proceedings of the Second Finnish Conference of Environmental Sciences, Helsinki, Finland, 16–18 November 1995; Mikrobiologian, Julkaisuja; Saski, E., Saarinen, T., Eds.; Helsingin Yliopiston Soveltavan Kemian Ja Mikrobiologian Laitos: Helsinki, Finland, 1995; Volume 43, pp. 301–304. [Google Scholar]
- Dube, A.; Zbytniewski, R.; Kowalikowski, T.; Cukrowska, E.; Buszewski, B. Adsorption and migration of heavy metals in soil. Pol. J. Environ. Stud. 2001, 10, 1–10. [Google Scholar]
- Melke, J.; Chodorowski, J. Formation of Arctic soils in Chamberlindalen, Bellsund, Spitsbergen. Pol. Polar Res. 2006, 27, 119–132. [Google Scholar]
- Zadrożny, P.; Nicia, P.; Kowalska, J.; Bejger, R. Assessment of heavy metals pollution in the Błędowskie Swamp soils. Acta Agrophys. 2015, 22, 233–242. (In Polish) [Google Scholar]
- Mohn, W.W.; Stewart, G.R. Limiting factors for hydrocarbon biodegradation at low temperature in Arctic soils. Soil Biol. Biochem. 2000, 32, 1161–1172. [Google Scholar] [CrossRef]
- Santos, I.R.; Silva-Filho, E.; Schaefer, C.E.G.R.; Albuquerque-Filho, M.; Campos, L.S. Heavy metals contamination in coastal sediments and soils near the Brazilian AntArctic Station, King George Island. Mar. Pollut. Bull. 2005, 50, 185–194. [Google Scholar] [CrossRef]
- Yi, L.; Hong, Y.; Wang, D.; Zhu, Y. Determination of free heavy metals ion concentrations in soils around a cadmium rich zinc depo sit. Geochem. J. 2007, 41, 235–240. [Google Scholar] [CrossRef]
- Ziaja, W.; Głąb, H.; Krywult, M.; Szostek, K.; Heavy, K. Heavy metals: Pb, Cu and Cd in the soils of southernmost Spitsbergen. In Proceedings of the 23rd Polar Sympodium, Sosnowiec, Poland, 27–29 September 1996; pp. 105–110. [Google Scholar]
- Kowalska, J.B.; Gąsiorek, M.; Zadrożny, P.; Nicia, P.; Waroszewski, J. Deep Subsoil Storage of Trace Elements and Pollution Assessment in Mountain Podzols (Tatra Mts., Poland). Forest 2021, 20, 291. [Google Scholar] [CrossRef]
- Hervé, R.P.; Andriamalala, R.; Yves, M.; Marcellin, R.; Christine, R.; Andriamandimbisoa, N. Assessment of heavy metals concentrations in coastal sediments in North-Western cities of Madagascar. Afr. J. Environ. Sci. Technol. 2010, 4, 51–60. [Google Scholar]
- Wang, Z.; Wang, Y.; Chen, L.; Yan, C.; Yan, Y.; Chi, Q. Assessment of metal contamination in coastal sediments of the Maluan Bay (China) using geochemical indices and multivariate statistical approaches. Mar. Pollut. Bull. 2015, 99, 43–53. [Google Scholar] [CrossRef] [PubMed]
- Shevchenko, V.; Lisitzin, A.; Vinogradova, A.; Stein, R. Heavy metals in aerosols over the seas of the Russian Arctic. Sci. Total Environ. 2003, 306, 11–25. [Google Scholar] [CrossRef]
- European Pollutant Release and Transfer Register (E-PRTR). Available online: https://prtr.eea.europa.eu/#/home (accessed on 30 July 2020).
- Directive 98/70/EC of the European Parliament and of the Council of 13 October 1998 relating to the quality of petrol and diesel fuels and amending Council Directive 93/12/EEC.
- 106. Directive 2005/55/EC of the European Parliament and of the Council of 28 September 2005 on the approximation of the laws of the Member States relating to the measures to be taken against the emission of gaseous and particulate pollutants from compression-ignition engines for use in vehicles, and the emission of gaseous pollutants from positive-ignition engines fuelled with natural gas or liquefied petroleum gas for use in vehicles Council Directive 2005/55/EC.
- Environmental Protection Agency. Available online: https://www.epa.gov/ (accessed on 30 July 2020).
- National Pollutant Release Inventory. Available online: https://www.canada.ca/en/services/environment/pollution-waste-management/national-pollutant-release-inventory.html (accessed on 4 July 2022).
- Government of Canada. Available online: https://www.canada.ca/en/environment-climate-change/services/management-toxic-substances.html (accessed on 18 January 2021).
- Mędrek, K.; Gluza, A.; Siwek, K.; Zagórski, P. The meteorological conditions on the calypsobyen in summer 2014 on the background of multiyear 1986–2011. Probl. Klimatol. Polarn. 2014, 24, 37–50. (In Polish) [Google Scholar]
- Steinnes, E. Impact of Long-range Atmospheric Transport of Heavy metals to the Terrestrial Environment in Norway. In Lead, Mercury, Cadmium and Arsenic in the Environment; John Wiley & Sons Ltd.: Hoboken, NJ, USA, 1987; pp. 107–117. [Google Scholar]


| Index | Description and Aim of Use | Formula | Explanations | Limit Values |
|---|---|---|---|---|
| Enrichment Factor (EF) | Assessment of the degree of soil pollution, as well as the possible impact of anthropogenic activities on PTE concentrations in the soil [71]. | EF classes, according to Sutherland [71]: <2: minimal; 2–5: moderate; 5–20: significant; 20–40: very high; >40 extremely high. | ||
| Geoaccumulation Index (Igeo) | The values of Igeo allow the assessment of PTE pollution based on the ratio between the current content of the PTE (in topsoil) and the content of PTE in the bedrock or a specific geochemical background [37]. | C—PTE current content in topsoil; B—content of PTE in the bedrock or geochemical background; 1.5—constant, allowing the analysis of fluctuations of PTE content as a result of natural processes. | Igeo classes introduced by Müller [34]: ≤0: unpolluted; 0–1: unpolluted to moderately polluted; 1–2: moderately polluted; 2–3: moderately to highly polluted; 3–4: highly polluted; 4–5: highly to extremely highly polluted; ≥5 extremely highly polluted. | |
| Potential Ecological Risk (RI) | RI is an indicator used to assess the degree of environmental risk caused by a concentration of PTE both in water and air, as well as in soil Håkanson [32]. | Er—single index of ecological risk factor; m—number of studied PTE; Tri—the toxicity response coefficient of PTE [32]; PI— single pollution index of PTE using reference data according to Rudnick and Gao [72]. | Classes of RI according to Håkanson [32]: ≤90: low; 90–180: moderate; 180–360: strong; 360–720: very strong; ≥720 highly strong. | |
| Pollution Load Index (PLI) | This indicator provides an easy way to prove the deterioration of the soil as a result of the accumulation of PTE [34,70]. | n—number of analysed PTE; PI—calculated values of the Single Pollution Index. | <1 denotes perfection; 1 only baseline levels of pollution; >1 deterioration of soil quality. | |
| Single Pollution Index (PI) | PI is helpful in the assessment of the most dangerous PTE within the studied elements [34]; PI is also used in the calculation of, e.g., Potential Ecological Risk (RI) [34]. | Ci—determined PTE content in the layer; B– geochemical background according to Rudnick and Gao [72]. | Evidence of contamination are values higher than 1.0. | |
| The Probability of Toxicity (MERMQ) | MERMQ is used as a useful tool to recognize PTE’s harmful impact [34]. | Cn—concentration of each analysed PTE; ERM—values [34] n—number of analysed PTE. | <0.1 low; 0.1–0.5 medium; 0.5–1.5 high; >1.5 very high. | |
| Contamination Security Index (CSI) | CSI informs about the intensity of concentration of PTE in the soil [69]. In order to calculate the CSI, the effects range low (ERL) and effects range median (ERM) should be used [60]. CSI is also helpful to determine the limit of toxicity above which the adverse impact on the soil environment is observed. | W—weight of each PTE according to Pejman et al. (2015); C—concentration of PTE; ERL, ERM values [34]. | <0.5: uncontaminated; 0.5–1: very low severity; 1–1.5: low severity; 1.5–2: low to moderate severity; 2–2.5: moderate severity; 2.5–3: moderate to high severity; 3–4: high severity; 4–5: very high severity; >5: ultra-high severity. |
| Profile | Horizon | Depth (cm) | Parent Material | Colour * (Moist) | Boundary | Structure | Consistence (Moist) | Skeleton Grains | Moisture | Abundance of Roots | Soil Classification |
|---|---|---|---|---|---|---|---|---|---|---|---|
| P1 | A | 0–5 | Silt deposits | 2,5Y 4/2 | A | VF SB MO | FR | A | M | V | Eutric Skeletic Leptic Cambisol (Gelic) |
| Bw | 5–15 | 2,5Y 3/2 | C | VF SB ST | FI | A | M | N | |||
| BwC | 15–40 | 2,5Y 5/3 | FI SB MO | VFI | A | M | N | ||||
| P2 | A | 0–3 | Gravels and sands | 10YR 2/3 | A | ME GR MO | FR | A | M | M | Eutric Skeletic Leptic Cambisol (Gelic Humic) |
| ABw | 3–8 | 10YR 4/4 | C | VF SB MO | FI | A | M | V | |||
| BwC | 8–35 | 10YR 4/4 | VF SB MO | VFI | A | M | N | ||||
| P3 | A | 0–11 | Gravels and sands | 2,5YR 4/2 | A | SG | FR | M | SM | C | Eutric Sketetic Regosol (Gelic Humic) |
| AC | 11–35 | 2,5YR 5/2 | C | FI GR WE | FI | D | SM | C | |||
| C | 35–78 | 7,5Y 4/2 | ME GR MO | FI | A | M | N | ||||
| P4 | Oi | 0–3 | Organic matter and sands | 10YR 4/4 | A | D3 | LO | N | W | M | Dystric Histic Leptosol (Gelic) |
| Oe | 3–10 | 10YR 3/3 | C | D4 | LO | VF | W | F | |||
| Cg | 10–15 | 2,5Y 5/4 | SG | FR | D | W | N | ||||
| P5 | A | 0–5 | Silt deposits | 10YR 5/3 | A | FI SB WE | FR | A | SM | N | Eutric Skeletic Gleyic Regosol (Gelic) |
| Cg1 | 5–15 | 5Y 5/1 | C | FI AB ST | VFI | A | M | N | |||
| Cg2 | 15–22 | 5Y 5/2 | FI AB ST | VFI | A | M | N |
| Profile | Depth | Horizon | pH | TOC | TN | C:N | Coarse Fragments (%) | Texture * | |
|---|---|---|---|---|---|---|---|---|---|
| (cm) | H2O | KCl | g·kg−1 | >2.0 | |||||
| P1 | 0–5 | A | 7.9 | 7.5 | 11.6 | 0.45 | 25 | 50 | L |
| 5–15 | Bw | 7.7 | 7.5 | 7.58 | 0.36 | 20 | 30 | L | |
| 15–40 | BwC | 7.8 | 7.6 | 4.51 | 0.24 | 18 | 30 | SiL | |
| P2 | 0–3 | A | 7.3 | 6.9 | 47.2 | 1.04 | 45 | 50 | SL |
| 3–8 | ABw | 7.8 | 8.0 | 19.1 | 1.14 | 16 | 45 | SL | |
| 8–35 | BwC | 7.9 | 7.9 | 18.2 | 1.12 | 16 | 40 | SL | |
| P3 | 0–11 | A | 6.7 | 6.6 | 48.2 | 2.35 | 20 | 20 | S |
| 11–35 | AC | 7.3 | 7.2 | 25.6 | 1.45 | 17 | 95 | LS | |
| 35–78 | C | 7.6 | 7.2 | 9.58 | 0.49 | 19 | 60 | LS | |
| P4 | 0–3 | Oi | 6.3 | 5.8 | 321 | 12.7 | 25 | - | - |
| 3–10 | Oe | 6.5 | 5.9 | 245 | 12.0 | 20 | - | - | |
| 10–15 | Cg | 7.2 | 6.4 | 88.5 | 4.54 | 19 | 5 | LS | |
| P5 | 0–5 | A | 7.0 | 6.7 | 10.2 | 0.42 | 24 | 90 | SiL |
| 5–15 | Cg1 | 7.2 | 7.0 | 6.52 | 0.24 | 27 | 95 | SiL | |
| 15–22 | Cg2 | 7.2 | 7.1 | 1.14 | 0.14 | 8 | 95 | SiL | |
| Profile | Depth (cm) | Horizon | Cd | Cr | Cu | Ni | Pb | Zn |
|---|---|---|---|---|---|---|---|---|
| mg∙kg−1 | ||||||||
| P1 | 0–5 | A | 21.2 | 31.2 | 30.4 | 22.2 | 65.9 | 75.5 |
| 5–15 | Bw | 17.5 | 32.1 | 31.2 | 22.0 | 64.2 | 72.3 | |
| 15–40 | BwC | 10.2 | 32.3 | 30.2 | 22.5 | 64.2 | 65.4 | |
| P2 | 0–3 | A | 9.35 | 10.9 | 21.0 | 11.2 | 28.8 | 79.4 |
| 3–8 | ABw | 3.95 | 11.2 | 19.3 | 10.2 | 13.6 | 58.6 | |
| 8–35 | BwC | 2.38 | 12.8 | 19.7 | 11.9 | 11.1 | 47.5 | |
| P3 | 0–11 | A | 8.35 | 12.3 | 10.2 | 8.35 | 29.3 | 65.2 |
| 11–35 | AC | 4.64 | 13.2 | 5.68 | 9.35 | 24.2 | 41.2 | |
| 35–78 | C | 0.74 | 14.5 | 12.2 | 12.3 | 5.42 | 21.1 | |
| P4 | 0–3 | Oi | 5.90 | 28.8 | 39.2 | 48.8 | 32.5 | 148 |
| 3–10 | Oe | 3.27 | 47.5 | 54.5 | 67.7 | 32.4 | 125 | |
| 10–15 | Cg | 2.27 | 57.2 | 42.1 | 64.4 | 27.3 | 115 | |
| P5 | 0–5 | A | 3.50 | 7.51 | 31.2 | 16.5 | 29.3 | 98.6 |
| 5–15 | Cg1 | 0.89 | 8.24 | 30.2 | 17.2 | 25.2 | 84.3 | |
| 15–22 | Cg2 | 0.42 | 9.58 | 30.2 | 10.2 | 14.2 | 45.2 | |
| CV * | 97.5 | 70.2 | 47.3 | 84.1 | 61.6 | 44.9 | ||
Publisher’s Note: MDPI stays neutral with regard to jurisdictional claims in published maps and institutional affiliations. |
© 2022 by the authors. Licensee MDPI, Basel, Switzerland. This article is an open access article distributed under the terms and conditions of the Creative Commons Attribution (CC BY) license (https://creativecommons.org/licenses/by/4.0/).
Share and Cite
Kowalska, J.B.; Nicia, P.; Gąsiorek, M.; Zadrożny, P.; Węgrzyn, M.H.; Waroszewski, J. Are Natural or Anthropogenic Factors Influencing Potentially Toxic Elements’ Enrichment in Soils in Proglacial Zones? An Example from Kaffiøyra (Oscar II Land, Spitsbergen). Int. J. Environ. Res. Public Health 2022, 19, 13703. https://doi.org/10.3390/ijerph192013703
Kowalska JB, Nicia P, Gąsiorek M, Zadrożny P, Węgrzyn MH, Waroszewski J. Are Natural or Anthropogenic Factors Influencing Potentially Toxic Elements’ Enrichment in Soils in Proglacial Zones? An Example from Kaffiøyra (Oscar II Land, Spitsbergen). International Journal of Environmental Research and Public Health. 2022; 19(20):13703. https://doi.org/10.3390/ijerph192013703
Chicago/Turabian StyleKowalska, Joanna Beata, Paweł Nicia, Michał Gąsiorek, Paweł Zadrożny, Michał Hubert Węgrzyn, and Jarosław Waroszewski. 2022. "Are Natural or Anthropogenic Factors Influencing Potentially Toxic Elements’ Enrichment in Soils in Proglacial Zones? An Example from Kaffiøyra (Oscar II Land, Spitsbergen)" International Journal of Environmental Research and Public Health 19, no. 20: 13703. https://doi.org/10.3390/ijerph192013703
APA StyleKowalska, J. B., Nicia, P., Gąsiorek, M., Zadrożny, P., Węgrzyn, M. H., & Waroszewski, J. (2022). Are Natural or Anthropogenic Factors Influencing Potentially Toxic Elements’ Enrichment in Soils in Proglacial Zones? An Example from Kaffiøyra (Oscar II Land, Spitsbergen). International Journal of Environmental Research and Public Health, 19(20), 13703. https://doi.org/10.3390/ijerph192013703