
Effects of a Resistance Training Protocol on Physical Performance, Body Composition, Bone Metabolism, and Systemic Homeostasis in Patients Diagnosed with Parkinson’s Disease: A Pilot Study


 ,
,  , ,
, ,  , ,
, , 
Abstract
1. Introduction
2. Materials and Methods
2.1. Motor Performance Tests
2.1.1. Postural and Static Analysis
2.1.2. Cervical ROM
2.1.3. Timed Up and Go
2.1.4. Five Times Sit to Stand (5TSTS)
2.1.5. Functional Reach Test
2.1.6. Grooved Pegboard Test
2.1.7. Handgrip Test
2.1.8. Eye-Hand Reaction and the Foot-Reaction Time Test
2.2. Body Composition Analysis
2.3. Blood Sample Analysis
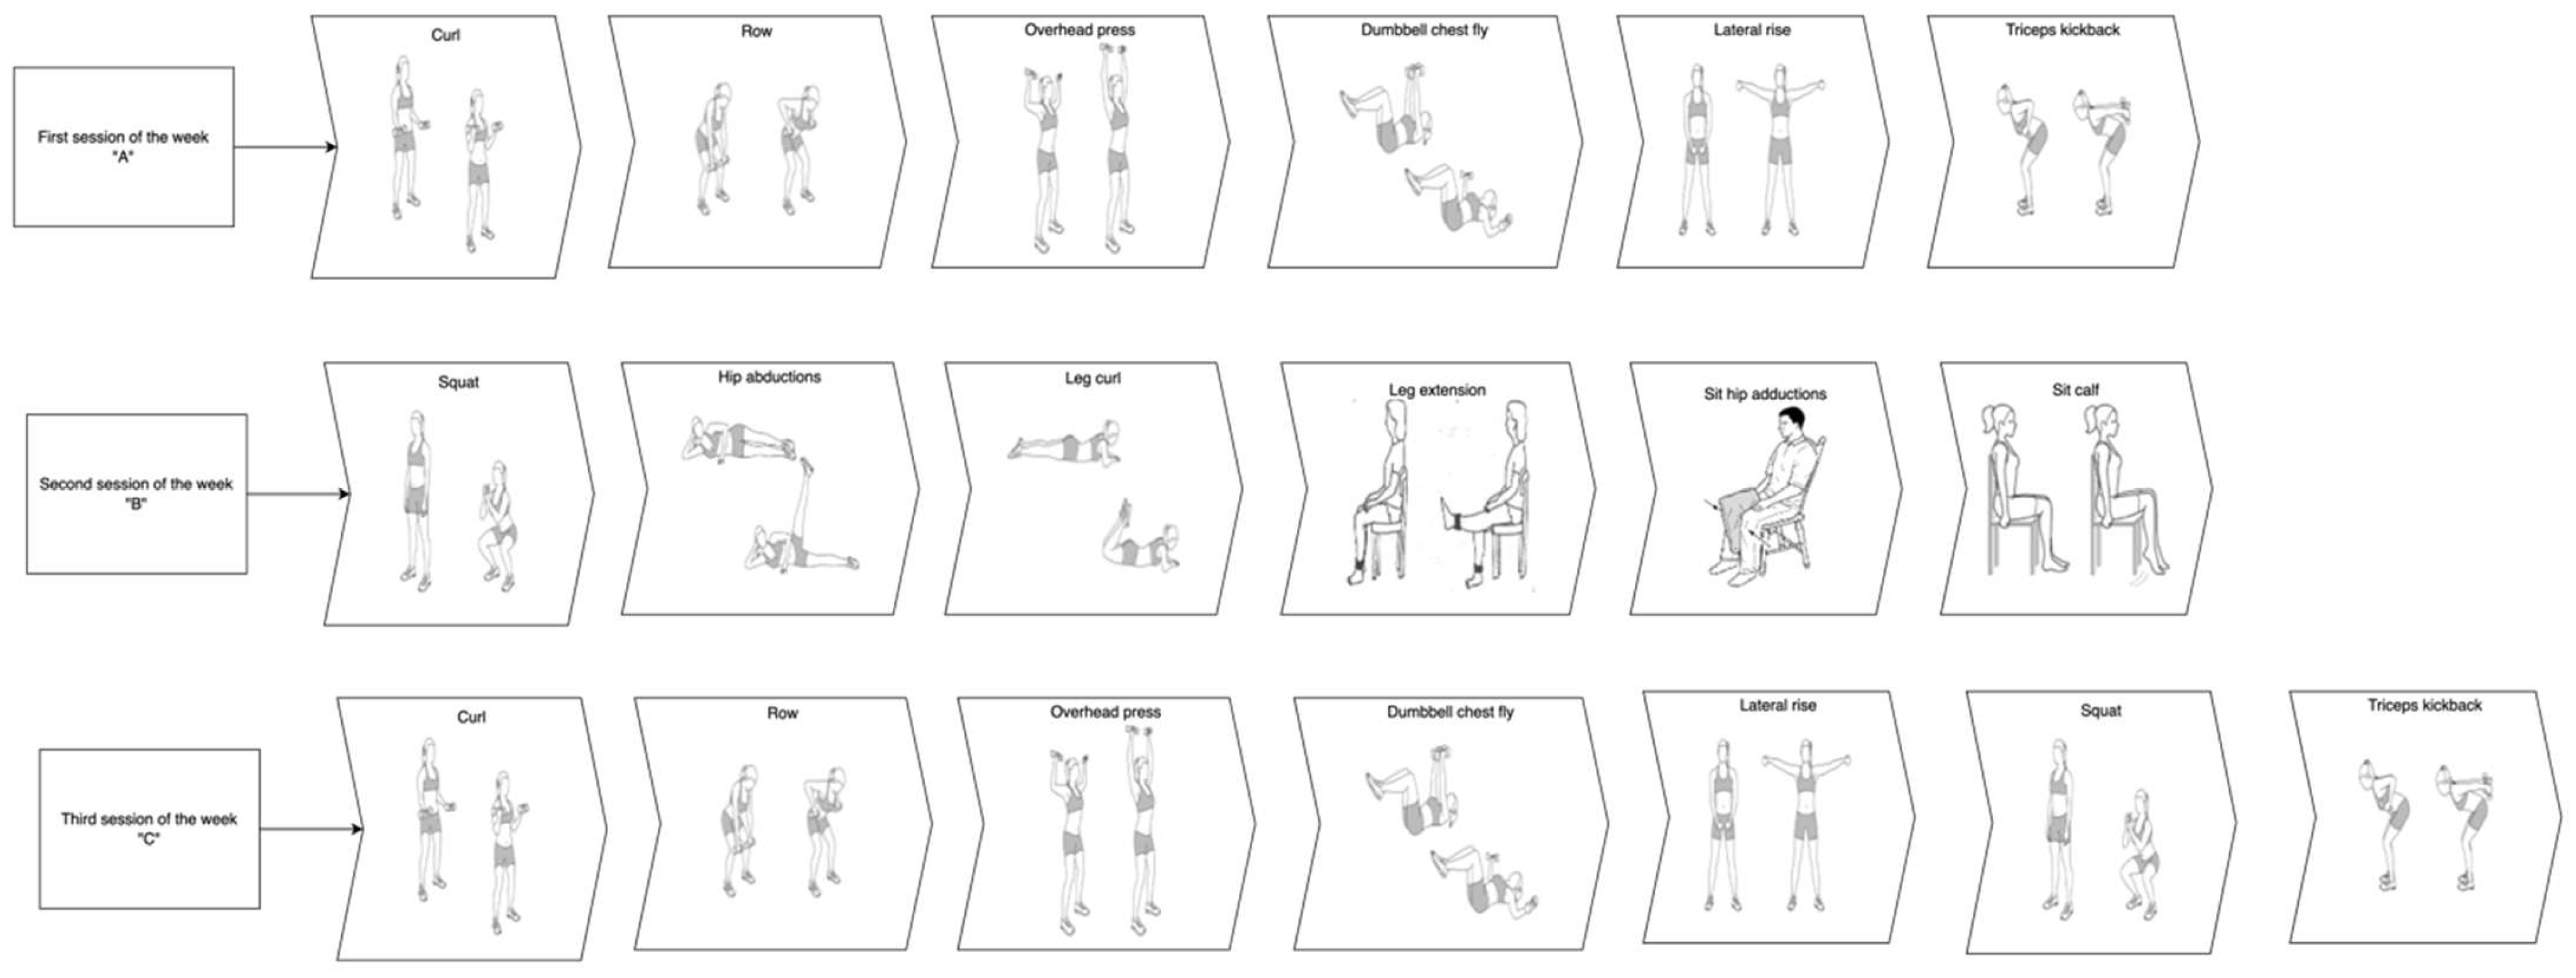
2.4. Training Protocol
2.5. Ethics
3. Statistical Analysis
4. Results
4.1. Motor Performance Test and Body Composition Analysis
4.2. Blood Sample Analysis
5. Discussion
6. Limitations
7. Conclusions
Author Contributions
Funding
Institutional Review Board Statement
Informed Consent Statement
Acknowledgments
Conflicts of Interest
References
- Sato, Y.; Kaji, M.; Tsuru, T.; Oizumi, K. Risk factors for hip fracture among elderly patients with Parkinson’s disease. J. Neurol. Sci. 2001, 182, 89–93. [Google Scholar] [CrossRef]
- Vaidya, B.; Dhamija, K.; Guru, P.; Sharma, S.S. Parkinson’s disease in women: Mechanisms underlying sex differences. Eur. J. Pharmacol. 2021, 895, 173862. [Google Scholar] [CrossRef]
- Choi, S.M.; Cho, S.H.; Kim, B.C. Association between freezing of gait and bone mineral density in patients with Parkinson’s disease. Neurol. Sci. 2021, 42, 2921–2925. [Google Scholar] [CrossRef]
- Prenger, M.T.M.; Madray, R.; Van Hedger, K.; Anello, M.; MacDonald, P.A. Social Symptoms of Parkinson’s Disease. Park. Dis. 2020, 2020, 8846544. [Google Scholar] [CrossRef]
- Hoehn, M.M.; Yahr, M.D. Parkinsonism. Onset Progress. Mortal. 1967, 17, 427. [Google Scholar]
- Ou, Z.; Pan, J.; Tang, S.; Duan, D.; Yu, D.; Nong, H.; Wang, Z. Global Trends in the Incidence, Prevalence, and Years Lived With Disability of Parkinson’s Disease in 204 Countries/Territories From 1990 to 2019. Front. Public Health 2021, 9, 776847. [Google Scholar] [CrossRef]
- Yang, W.; Hamilton, J.L.; Kopil, C.; Beck, J.C.; Tanner, C.M.; Albin, R.L.; Ray Dorsey, E.; Dahodwala, N.; Cintina, I.; Hogan, P.; et al. Current and projected future economic burden of Parkinson’s disease in the U.S. Npj Park. Dis. 2020, 6, 15. [Google Scholar] [CrossRef]
- Riccò, M.; Vezzosi, L.; Balzarini, F.; Gualerzi, G.; Ranzieri, S.; Signorelli, C.; Colucci, M.E.; Bragazzi, N.L. Prevalence of Parkinson Disease in Italy: A systematic review and meta-analysis. Acta Bio Med. Atenei Parm. 2020, 91, e2020088. [Google Scholar]
- Miyasaki, J.M.; Martin, W.; Suchowersky, O.; Weiner, W.J.; Lang, A.E. Practice parameter: Initiation of treatment for Parkinson’s disease: An evidence-based review: Report of the Quality Standards Subcommittee of the American Academy of Neurology. Neurology 2002, 58, 11–17. [Google Scholar] [CrossRef] [PubMed]
- Pringsheim, T.; Day, G.S.; Smith, D.B.; Rae-Grant, A.; Licking, N.; Armstrong, M.J.; de Bie, R.M.A.; Roze, E.; Miyasaki, J.M.; Hauser, R.A.; et al. Dopaminergic Therapy for Motor Symptoms in Early Parkinson Disease Practice Guideline Summary: A Report of the AAN Guideline Subcommittee. Neurology 2021, 97, 942–957. [Google Scholar] [CrossRef] [PubMed]
- Adams, J.D. Possible causes of Parkinson’s disease. Front. Biosci. 2021, 26, 387–394. [Google Scholar]
- Proia, P.; Di Liegro, C.M.; Schiera, G.; Fricano, A.; Di Liegro, I. Lactate as a Metabolite and a Regulator in the Central Nervous System. Int. J. Mol. Sci. 2016, 17, 1450. [Google Scholar] [CrossRef] [PubMed]
- Amato, A.; Ragonese, P.; Ingoglia, S.; Schiera, G.; Schirò, G.; Di Liegro, C.M.; Salemi, G.; Di Liegro, I.; Proia, P. Lactate Threshold Training Program on Patients with Multiple Sclerosis: A Multidisciplinary Approach. Nutrients 2021, 13, 4284. [Google Scholar] [CrossRef] [PubMed]
- Vasto, S.; Amato, A.; Proia, P.; Baldassano, S. Is the Secret in the Gut? SuperJump Activity Improves Bone Remodeling and Glucose Homeostasis by GLP-1 and GIP Peptides in Eumenorrheic Women. Biology 2022, 11, 296. [Google Scholar] [CrossRef] [PubMed]
- Vasto, S.; Amato, A.; Proia, P.; Caldarella, R.; Cortis, C.; Baldassano, S. Dare to Jump: The Effect of New High Impact Activity SuperJump on Bone Remodeling. A New Tool to Be Fit During COVID-19 Home Confinement. Biol. Sport 2022, 39, 1011–1019. [Google Scholar] [CrossRef]
- Proia, P.; Amato, A.; Drid, P.; Korovljev, D.; Vasto, S.; Baldassano, S. The Impact of Diet and Physical Activity on Bone Health in Children and Adolescents. Front. Endocrinol. 2021, 12, 704647. [Google Scholar] [CrossRef] [PubMed]
- Iannaccone, A.; Fusco, A.; Jaime, S.J.; Baldassano, S.; Cooper, J.; Proia, P.; Cortis, C. Stay Home, Stay Active with SuperJump®: A Home-Based Activity to Prevent Sedentary Lifestyle during COVID-19 Outbreak. Sustainability 2020, 12, 10135. [Google Scholar] [CrossRef]
- Amato, A.; Proia, P.; Caldara, G.F.; Alongi, A.; Ferrantelli, V.; Baldassano, S. Analysis of Body Perception, Preworkout Meal Habits and Bone Resorption in Child Gymnasts. Int. J Environ. Res. Public Health 2021, 18, 2184. [Google Scholar] [CrossRef] [PubMed]
- Messina, G.; Amato, A.; D’Amico, G.; Baldassano, S.; Proia, P. Effects of protein supplementation in fitness world: A 12-week cross-over studio. J. Hum. Sport Exerc. 2019, 15, S308–S314. [Google Scholar]
- Amato, A.; Baldassano, S.; Cortis, C.; Cooper, J.; Proia, P. Physical activity, nutrition, and bone health. Hum. Mov. 2018, 19, 1–10. [Google Scholar] [CrossRef]
- Baldassano, S.; Polizzi, M.R.; Sabatino, L.; Caldarella, R.; Macaluso, A.; Alongi, A.; Caldara, G.F.; Ferrantelli, V.; Vasto, S. A New Potential Dietary Approach to Supply Micronutrients to Physically Active People through Consumption of Biofortified Vegetables. Nutrients 2022, 14, 2971. [Google Scholar] [CrossRef] [PubMed]
- Baldassano, S.; Di Gaudio, F.; Sabatino, L.; Caldarella, R.; De Pasquale, C.; Di Rosa, L.; Nuzzo, D.; Picone, P.; Vasto, S. Biofortification: Effect of Iodine Fortified Food in the Healthy Population, Double-Arm Nutritional Study. Front. Nutr. 2022, 9, 426. [Google Scholar] [CrossRef]
- Frost, H.M. Skeletal structural adaptations to mechanical usage (SATMU): 2. Redefining Wolff’s law: The remodeling problem. Anat. Rec. 1990, 226, 414–422. [Google Scholar] [CrossRef]
- Guo, Y.; Wang, Y.; Liu, Y.; Liu, Y.; Zeng, Q.; Zhao, Y.; Zhang, X.; Zhang, X. MicroRNA-218, microRNA-191*, microRNA-3070a and microRNA-33 are responsive to mechanical strain exerted on osteoblastic cells. Mol. Med. Rep. 2015, 12, 3033–3038. [Google Scholar] [CrossRef]
- Schleip, R.; Baker, A.; Avison, J. Fascia in Sport and Movement; Handspring: Edinburgh, UK, 2015. [Google Scholar]
- Handa, K.; Kiyohara, S.; Yamakawa, T.; Ishikawa, K.; Hosonuma, M.; Sakai, N.; Karakawa, A.; Chatani, M.; Tsuji, M.; Inagaki, K.; et al. Bone loss caused by dopaminergic degeneration and levodopa treatment in Parkinson’s disease model mice. Sci. Rep. 2019, 9, 13768. [Google Scholar] [CrossRef] [PubMed]
- Fink, H.A.; Kuskowski, M.A.; Taylor, B.C.; Schousboe, J.T.; Orwoll, E.S.; Ensrud, K.E. Association of Parkinson’s disease with accelerated bone loss, fractures and mortality in older men: The Osteoporotic Fractures in Men (MrOS) study. Osteoporos. Int. 2008, 19, 1277–1282. [Google Scholar] [CrossRef] [PubMed]
- Postuma, R.B.; Lang, A.E. Homocysteine and levodopa: Should Parkinson disease patients receive preventative therapy? Neurology 2004, 63, 886–891. [Google Scholar] [CrossRef] [PubMed]
- Van Meurs, J.B.; Dhonukshe-Rutten, R.A.; Pluijm, S.M.; van der Klift, M.; de Jonge, R.; Lindemans, J.; de Groot, L.C.; Hofman, A.; Witteman, J.C.; van Leeuwen, J.P.; et al. Homocysteine levels and the risk of osteoporotic fracture. N. Engl. J. Med. 2004, 350, 2033–2041. [Google Scholar] [CrossRef]
- Zimprich, A.; Biskup, S.; Leitner, P.; Lichtner, P.; Farrer, M.; Lincoln, S.; Kachergus, J.; Hulihan, M.; Uitti, R.J.; Calne, D.B.; et al. Mutations in LRRK2 cause autosomal-dominant parkinsonism with pleomorphic pathology. Neuron 2004, 44, 601–607. [Google Scholar] [CrossRef] [PubMed]
- Lesage, S.; Brice, A. Parkinson’s disease: From monogenic forms to genetic susceptibility factors. Hum. Mol. Genet. 2009, 18, R48–R59. [Google Scholar] [CrossRef] [PubMed]
- Deng, H.; Wang, P.; Jankovic, J. The genetics of Parkinson disease. Ageing Res. Rev. 2018, 42, 72–85. [Google Scholar] [CrossRef] [PubMed]
- Xiong, L.; Pan, J.X.; Guo, H.H.; Mei, L.; Xiong, W.C. Parkinson’s in the bone. Cell Biosci. 2021, 11, 190. [Google Scholar] [CrossRef]
- Miyake, Y.; Tanaka, K.; Fukushima, W.; Kiyohara, C.; Sasaki, S.; Tsuboi, Y.; Yamada, T.; Oeda, T.; Shimada, H.; Kawamura, N.; et al. UCHL1 S18Y variant is a risk factor for Parkinson’s disease in Japan. BMC Neurol. 2012, 12, 62. [Google Scholar] [CrossRef]
- Berwick, D.C.; Javaheri, B.; Wetzel, A.; Hopkinson, M.; Nixon-Abell, J.; Grannò, S.; Pitsillides, A.A.; Harvey, K. Pathogenic LRRK2 variants are gain-of-function mutations that enhance LRRK2-mediated repression of β-catenin signaling. Mol. Neurodegener. 2017, 12, 9. [Google Scholar] [CrossRef] [PubMed]
- Kim, H.S.; Nam, S.T.; Mun, S.H.; Lee, S.-K.; Kim, H.W.; Park, Y.H.; Kim, B.; Won, K.-J.; Kim, H.-R.; Park, Y.-M.; et al. DJ-1 controls bone homeostasis through the regulation of osteoclast differentiation. Nat. Commun. 2017, 8, 1519. [Google Scholar] [CrossRef]
- Cui, Y.; Song, M.; Xiao, B.; Huang, W.; Zhang, J.; Zhang, X.; Shao, B.; Han, Y.; Li, Y. PINK1/Parkin-Mediated Mitophagy Plays a Protective Role in the Bone Impairment Caused by Aluminum Exposure. J. Agric. Food Chem. 2021, 69, 6054–6063. [Google Scholar] [CrossRef] [PubMed]
- Xu, Z.; Lin, J.; Xie, Y.; Tang, H.; Xie, J.; Zeng, R. HtrA2 is required for inflammatory responses in BMDMs via controlling TRAF2 stability in collagen-induced arthritis. Mol. Immunol. 2021, 129, 78–85. [Google Scholar] [CrossRef] [PubMed]
- Lorefält, B.; Toss, G.; Granérus, A.K. Bone mass in elderly patients with Parkinson’s disease. Acta Neurol. Scand. 2007, 116, 248–254. [Google Scholar] [CrossRef]
- Khlebtovsky, A.; Djaldetti, R.; Rodity, Y.; Keret, O.; Tsvetov, G.; Slutzcki-Shraga, I.; Benninger, F. Progression of postural changes in Parkinson’s disease: Quantitative assessment. J. Neurol. 2017, 264, 675–683. [Google Scholar] [CrossRef] [PubMed]
- Postuma, R.B.; Berg, D.; Stern, M.; Poewe, W.; Olanow, C.W.; Oertel, W.; Obeso, J.; Marek, K.; Litvan, I.; Lang, A.E.; et al. MDS clinical diagnostic criteria for Parkinson’s disease. Mov. Disord. 2015, 30, 1591–1601. [Google Scholar] [CrossRef]
- Van Melick, N.; Meddeler, B.M.; Hoogeboom, T.J.; Nijhuis-van der Sanden, M.W.G.; van Cingel, R.E.H. How to determine leg dominance: The agreement between self-reported and observed performance in healthy adults. PLoS ONE 2017, 12, e0189876. [Google Scholar] [CrossRef]
- Goetz, C.G.; Poewe, W.; Rascol, O.; Sampaio, C.; Stebbins, G.T.; Counsell, C.; Giladi, N.; Holloway, R.G.; Moore, C.G.; Wenning, G.K.; et al. Movement Disorder Society Task Force report on the Hoehn and Yahr staging scale: Status and recommendations. Mov. Disord. 2004, 19, 1020–1028. [Google Scholar] [CrossRef]
- Ramaker, C.; Marinus, J.; Stiggelbout, A.M.; Van Hilten, B.J. Systematic evaluation of rating scales for impairment and disability in Parkinson’s disease. Mov. Disord. 2002, 17, 867–876. [Google Scholar] [CrossRef] [PubMed]
- Biundo, R.; Weis, L.; Pilleri, M.; Facchini, S.; Formento-Dojot, P.; Vallelunga, A.; Antonini, A. Diagnostic and screening power of neuropsychological testing in detecting mild cognitive impairment in Parkinson’s disease. J. Neural. Transm. 2013, 120, 627–633. [Google Scholar] [CrossRef]
- Julien, C.; Hache, G.; Dulac, M.; Dubrou, C.; Castelnovo, G.; Giordana, C.; Azulay, J.P.; Fluchere, F. The clinical meaning of levodopa equivalent daily dose in Parkinson’s disease. Fundam. Clin. Pharmacol. 2021, 35, 620–630. [Google Scholar] [CrossRef]
- Bohannon, R.W. Reference values for the timed up and go test: A descriptive meta-analysis. J. Geriatr. Phys. Ther. 2006, 29, 64–68. [Google Scholar] [CrossRef] [PubMed]
- Bischoff, H.A.; Stähelin, H.B.; Monsch, A.U.; Iversen, M.D.; Weyh, A.; von Dechend, M.; Akos, R.; Conzelmann, M.; Dick, W.; Theiler, R. Identifying a cut-off point for normal mobility: A comparison of the timed ‘up and go’ test in community-dwelling and institutionalised elderly women. Age Ageing 2003, 32, 315–320. [Google Scholar] [CrossRef] [PubMed]
- Academy of Neurologic Physical Therapy. Core Measure: Five Times Sit-to-Stand (5TSTS). Available online: http://neuropt.org/practice-resources/anpt-clinical-practice-guidelines/core-outcome-measures-cpg (accessed on 4 March 2022).
- Duncan, P.W.; Weiner, D.K.; Chandler, J.; Studenski, S. Functional reach: A new clinical measure of balance. J. Gerontol. 1990, 45, M192–M197. [Google Scholar] [CrossRef]
- Wang, Y.C.; Magasi, S.R.; Bohannon, R.W.; Reuben, D.B.; McCreath, H.E.; Bubela, D.J.; Gershon, R.C.; Rymer, W.Z. Assessing dexterity function: A comparison of two alternatives for the NIH Toolbox. J. Hand Ther. 2011, 24, 313–320, quiz 321. [Google Scholar] [CrossRef] [PubMed]
- Karatrantou, K. Dynamic Handgrip Strength Endurance: A Reliable Measurement in Older Women. J. Geriatr. Phys. Ther. 2019, 42, E51–E56. [Google Scholar] [CrossRef] [PubMed]
- Baldassano, S.; Gasbjerg, L.S.; Kizilkaya, H.S.; Rosenkilde, M.M.; Holst, J.J.; Hartmann, B. Increased Body Weight and Fat Mass After Subchronic GIP Receptor Antagonist, but Not GLP-2 Receptor Antagonist, Administration in Rats. Front. Endocrinol. 2019, 10, 492. [Google Scholar] [CrossRef]
- Baldassano, S.; Accardi, G.; Aiello, A.; Buscemi, S.; Di Miceli, G.; Galimberti, D.; Candore, G.; Ruisi, P.; Caruso, C.; Vasto, S. Fibres as functional foods and the effects on gut hormones: The example of β-glucans in a single arm pilot study. J. Funct. Foods 2018, 47, 264–269. [Google Scholar] [CrossRef]
- Vasto, S.; Di Gaudio, F.; Raso, M.; Sabatino, L.; Caldarella, R.; De Pasquale, C.; Di Rosa, L.; Baldassano, S. Impact on Glucose Homeostasis: Is Food Biofortified with Molybdenum a Workable Solution? A Two-Arm Study. Nutrients 2022, 14, 1351. [Google Scholar] [CrossRef]
- Wallace, T.M.; Levy, J.C.; Matthews, D.R. Use and abuse of HOMA modeling. Diabetes Care 2004, 27, 1487–1495. [Google Scholar] [CrossRef] [PubMed]
- Ghasemi, A.; Tohidi, M.; Derakhshan, A.; Hasheminia, M.; Azizi, F.; Hadaegh, F. Cut-off points of homeostasis model assessment of insulin resistance, beta-cell function, and fasting serum insulin to identify future type 2 diabetes: Tehran Lipid and Glucose Study. Acta Diabetol. 2015, 52, 905–915. [Google Scholar] [CrossRef] [PubMed]
- Carvalho, A.; Barbirato, D.; Araujo, N.; Martins, J.V.; Cavalcanti, J.L.; Santos, T.M.; Coutinho, E.S.; Laks, J.; Deslandes, A.C. Comparison of strength training, aerobic training, and additional physical therapy as supplementary treatments for Parkinson’s disease: Pilot study. Clin. Interv. Aging 2015, 10, 183–191. [Google Scholar] [CrossRef]
- Corcos, D.M.; Robichaud, J.A.; David, F.J.; Leurgans, S.E.; Vaillancourt, D.E.; Poon, C.; Rafferty, M.R.; Kohrt, W.M.; Comella, C.L. A two-year randomized controlled trial of progressive resistance exercise for Parkinson’s disease. Mov. Disord. 2013, 28, 1230–1240. [Google Scholar] [CrossRef]
- Demonceau, M.; Maquet, D.; Jidovtseff, B.; Donneau, A.F.; Bury, T.; Croisier, J.L.; Crielaard, J.M.; Rodriguez de la Cruz, C.; Delvaux, V.; Garraux, G. Effects of twelve weeks of aerobic or strength training in addition to standard care in Parkinson’s disease: A controlled study. Eur. J. Phys. Rehabil. Med. 2017, 53, 184–200. [Google Scholar] [CrossRef] [PubMed]
- DiFrancisco-Donoghue, J.; Lamberg, E.M.; Rabin, E.; Elokda, A.; Fazzini, E.; Werner, W.G. Effects of exercise and B vitamins on homocysteine and glutathione in Parkinson’s disease: A randomized trial. Neurodegener. Dis. 2012, 10, 127–134. [Google Scholar] [CrossRef]
- Helgerud, J.; Thomsen, S.N.; Hoff, J.; Strandbraten, A.; Leivseth, G.; Unhjem, R.; Wang, E. Maximal strength training in patients with Parkinson’s disease: Impact on efferent neural drive, force-generating capacity, and functional performance. J. Appl. Physiol. 2020, 129, 683–690. [Google Scholar] [CrossRef]
- Hulbert, S.; Chivers-Seymour, K.; Summers, R.; Lamb, S.; Goodwin, V.; Rochester, L.; Nieuwboer, A.; Rowsell, A.; Ewing, S.; Ashburn, A.; et al. ‘PDSAFE’—A multi-dimensional model of falls-rehabilitation for people with Parkinson’s. A mixed methods analysis of therapists’ delivery and experience. Physiotherapy 2021, 110, 77–84. [Google Scholar] [CrossRef] [PubMed]
- Silva-Batista, C.; de Lima-Pardini, A.C.; Nucci, M.P.; Coelho, D.B.; Batista, A.; Piemonte, M.E.P.; Barbosa, E.R.; Teixeira, L.A.; Corcos, D.M.; Amaro, E., Jr.; et al. A Randomized, Controlled Trial of Exercise for Parkinsonian Individuals With Freezing of Gait. Mov. Disord. 2020, 35, 1607–1617. [Google Scholar] [CrossRef] [PubMed]
- Alves, W.M.; Alves, T.G.; Ferreira, R.M.; Lima, T.A.; Pimentel, C.P.; Sousa, E.C.; Abrahin, O.; Alves, E.A. Strength training improves the respiratory muscle strength and quality of life of elderly with Parkinson disease. J. Sports Med. Phys. Fitness 2019, 59, 1756–1762. [Google Scholar] [CrossRef] [PubMed]
- Claus, I.; Muhle, P.; Czechowski, J.; Ahring, S.; Labeit, B.; Suntrup-Krueger, S.; Wiendl, H.; Dziewas, R.; Warnecke, T. Expiratory Muscle Strength Training for Therapy of Pharyngeal Dysphagia in Parkinson’s Disease. Mov. Disord. 2021, 36, 1815–1824. [Google Scholar] [CrossRef] [PubMed]
- Troche, M.S.; Okun, M.S.; Rosenbek, J.C.; Musson, N.; Fernandez, H.H.; Rodriguez, R.; Romrell, J.; Pitts, T.; Wheeler-Hegland, K.M.; Sapienza, C.M. Aspiration and swallowing in Parkinson disease and rehabilitation with EMST: A randomized trial. Neurology 2010, 75, 1912–1919. [Google Scholar] [CrossRef] [PubMed]
- Troche, M.S.; Rosenbek, J.C.; Okun, M.S.; Sapienza, C.M. Detraining outcomes with expiratory muscle strength training in Parkinson disease. J. Rehabil. Res. Dev. 2014, 51, 305–310. [Google Scholar] [CrossRef] [PubMed]
- Sapienza, C.; Troche, M.; Pitts, T.; Davenport, P. Respiratory strength training: Concept and intervention outcomes. Semin. Speech Lang. 2011, 32, 21–30. [Google Scholar] [CrossRef]
- Cherup, N.P.; Buskard, A.N.L.; Strand, K.L.; Roberson, K.B.; Michiels, E.R.; Kuhn, J.E.; Lopez, F.A.; Signorile, J.F. Power vs. strength training to improve muscular strength, power, balance and functional movement in individuals diagnosed with Parkinson’s disease. Exp. Gerontol. 2019, 128, 110740. [Google Scholar] [CrossRef]
- Morris, M.E.; Martin, C.; McGinley, J.L.; Huxham, F.E.; Menz, H.B.; Taylor, N.F.; Danoudis, M.; Watts, J.J.; Soh, S.E.; Evans, A.H.; et al. Protocol for a home-based integrated physical therapy program to reduce falls and improve mobility in people with Parkinson’s disease. BMC Neurol. 2012, 12, 54. [Google Scholar] [CrossRef] [PubMed]
- Morris, M.E.; Menz, H.B.; McGinley, J.L.; Huxham, F.E.; Murphy, A.T.; Iansek, R.; Danoudis, M.; Soh, S.E.; Kelly, D.; Watts, J.J. Falls and mobility in Parkinson’s disease: Protocol for a randomised controlled clinical trial. BMC Neurol. 2011, 11, 93. [Google Scholar] [CrossRef] [PubMed]
- Morris, M.E.; Menz, H.B.; McGinley, J.L.; Watts, J.J.; Huxham, F.E.; Murphy, A.T.; Danoudis, M.E.; Iansek, R. A Randomized Controlled Trial to Reduce Falls in People With Parkinson’s Disease. Neurorehabil. Neural. Repair. 2015, 29, 777–785. [Google Scholar] [CrossRef] [PubMed]
- Morris, M.E.; Taylor, N.F.; Watts, J.J.; Evans, A.; Horne, M.; Kempster, P.; Danoudis, M.; McGinley, J.; Martin, C.; Menz, H.B. A home program of strength training, movement strategy training and education did not prevent falls in people with Parkinson’s disease: A randomised trial. J. Physiother. 2017, 63, 94–100. [Google Scholar] [CrossRef] [PubMed]
- Shen, X.; Mak, M.K. Repetitive step training with preparatory signals improves stability limits in patients with Parkinson’s disease. J. Rehabil. Med. 2012, 44, 944–949. [Google Scholar] [CrossRef] [PubMed]
- Shen, X.; Mak, M.K. Balance and Gait Training With Augmented Feedback Improves Balance Confidence in People With Parkinson’s Disease: A Randomized Controlled Trial. Neurorehabil. Neural. Repair. 2014, 28, 524–535. [Google Scholar] [CrossRef]
- Silva-Batista, C.; Corcos, D.M.; Kanegusuku, H.; Piemonte, M.E.P.; Gobbi, L.T.B.; de Lima-Pardini, A.C.; de Mello, M.T.; Forjaz, C.L.M.; Ugrinowitsch, C. Balance and fear of falling in subjects with Parkinson’s disease is improved after exercises with motor complexity. Gait Posture 2018, 61, 90–97. [Google Scholar] [CrossRef]
- De Lima, T.A.; Ferreira-Moraes, R.; Alves, W.; Alves, T.G.G.; Pimentel, C.P.; Sousa, E.C.; Abrahin, O.; Cortinhas-Alves, E.A. Resistance training reduces depressive symptoms in elderly people with Parkinson disease: A controlled randomized study. Scand. J. Med. Sci. Sports 2019, 29, 1957–1967. [Google Scholar] [CrossRef] [PubMed]
- Papaioannou, A.; Adachi, J.D.; Winegard, K.; Ferko, N.; Parkinson, W.; Cook, R.J.; Webber, C.; McCartney, N. Efficacy of home-based exercise for improving quality of life among elderly women with symptomatic osteoporosis-related vertebral fractures. Osteoporos. Int. 2003, 14, 677–682. [Google Scholar] [CrossRef] [PubMed]
- Silva-Batista, C.; de Brito, L.C.; Corcos, D.M.; Roschel, H.; de Mello, M.T.; Piemonte, M.E.P.; Tricoli, V.; Ugrinowitsch, C. Resistance Training Improves Sleep Quality in Subjects With Moderate Parkinson’s Disease. J. Strength Cond. Res. 2017, 31, 2270–2277. [Google Scholar] [CrossRef] [PubMed]
- Benedetti, M.G.; Furlini, G.; Zati, A.; Letizia Mauro, G. The Effectiveness of Physical Exercise on Bone Density in Osteoporotic Patients. Biomed. Res. Int. 2018, 2018, 4840531. [Google Scholar] [CrossRef] [PubMed]
- Haakonssen, E.C.; Ross, M.L.; Knight, E.J.; Cato, L.E.; Nana, A.; Wluka, A.E.; Cicuttini, F.M.; Wang, B.H.; Jenkins, D.G.; Burke, L.M. The effects of a calcium-rich pre-exercise meal on biomarkers of calcium homeostasis in competitive female cyclists: A randomised crossover trial. PLoS ONE 2015, 10, e0123302. [Google Scholar] [CrossRef]
- Harding, A.T.; Weeks, B.K.; Lambert, C.; Watson, S.L.; Weis, L.J.; Beck, B.R. Effects of supervised high-intensity resistance and impact training or machine-based isometric training on regional bone geometry and strength in middle-aged and older men with low bone mass: The LIFTMOR-M semi-randomised controlled trial. Bone 2020, 136, 115362. [Google Scholar] [CrossRef] [PubMed]
- MacMahon Copas, A.N.; McComish, S.F.; Fletcher, J.M.; Caldwell, M.A. The Pathogenesis of Parkinson’s Disease: A Complex Interplay Between Astrocytes, Microglia, and T Lymphocytes? Front. Neurol. 2021, 12, 666737. [Google Scholar] [CrossRef] [PubMed]
- Anastasopoulos, D.; Maurer, C.; Nasios, G.; Mergner, T. Neck rigidity in Parkinson’s disease patients is related to incomplete suppression of reflexive head stabilization. Exp. Neurol. 2009, 217, 336–346. [Google Scholar] [CrossRef] [PubMed]
- Hotting, K.; Roder, B. Beneficial effects of physical exercise on neuroplasticity and cognition. Neurosci. Biobehav. Rev. 2013, 37 (Pt B), 2243–2257. [Google Scholar] [CrossRef]
- Singh, A.M.; Neva, J.L.; Staines, W.R. Aerobic exercise enhances neural correlates of motor skill learning. Behav. Brain Res. 2016, 301, 19–26. [Google Scholar] [CrossRef]
- Schlaffke, L.; Lissek, S.; Lenz, M.; Brune, M.; Juckel, G.; Hinrichs, T.; Platen, P.; Tegenthoff, M.; Schmidt-Wilcke, T. Sports and brain morphology—A voxel-based morphometry study with endurance athletes and martial artists. Neuroscience 2014, 259, 35–42. [Google Scholar] [CrossRef] [PubMed]
- Hu, N.; Avela, J.; Kidgell, D.J.; Piirainen, J.M.; Walker, S. Modulations of corticospinal excitability following rapid ankle dorsiflexion in skill- and endurance-trained athletes. Eur. J. Appl. Physiol. 2022, 122, 2099–2109. [Google Scholar] [CrossRef] [PubMed]
- Franzén, E.; Paquette, C.; Gurfinkel, V.S.; Cordo, P.J.; Nutt, J.G.; Horak, F.B. Reduced performance in balance, walking and turning tasks is associated with increased neck tone in Parkinson’s disease. Exp. Neurol. 2009, 219, 430–438. [Google Scholar] [CrossRef]
- Ohlendorf, D.; Kerth, K.; Osiander, W.; Holzgreve, F.; Fraeulin, L.; Ackermann, H.; Groneberg, D.A. Standard reference values of weight and maximum pressure distribution in healthy adults aged 18-65 years in Germany. J. Physiol. Anthropol. 2020, 39, 39. [Google Scholar] [CrossRef]
- Tsakanikas, V.D.; Dimopoulos, D.G.; Tachos, N.S.; Chatzaki, C.; Skaramagkas, V.; Christodoulakis, G.; Tsiknakis, M.; Fotiadis, D.I. Gait and balance patterns related to Free-Walking and TUG tests in Parkinson’s Disease based on plantar pressure data. Annu. Int. Conf. IEEE Eng. Med. Biol. Soc. 2021, 2021, 236–239. [Google Scholar] [PubMed]
- Genoves, G.G.; Cruz, C.F.; Dona, F.; Andrade, T.A.M.; Ferraz, H.B.; Barela, J.A. Detection of passive movement in lower limb joints is impaired in individuals with Parkinson’s disease. Neurophysiol. Clin. 2021, 51, 279–285. [Google Scholar] [CrossRef] [PubMed]
- Rahman, S.; Siddique, U.; Choudhury, S.; Islam, N.; Roy, A.; Basu, P.; Anand, S.S.; Islam, M.A.; Shahi, M.S.; Nayeem, A.; et al. Comparing Stop Signal Reaction Times in Alzheimer’s and Parkinson’s Disease. Can. J. Neurol. Sci. J. Can. Des Sci. Neurol. 2022, 49, 662–671. [Google Scholar] [CrossRef] [PubMed]
- Morrison, S.; Moxey, J.; Reilly, N.; Russell, D.M.; Thomas, K.M.; Grunsfeld, A.A. The relation between falls risk and movement variability in Parkinson’s disease. Exp. Brain Res. 2021, 239, 2077–2087. [Google Scholar] [CrossRef] [PubMed]
- Firouzi, M.; Baetens, K.; Swinnen, E.; Duta, C.; Baeken, C.; Van Overwalle, F.; Deroost, N. Implicit learning of perceptual sequences is preserved in Parkinson’s disease. Neuropsychology 2021, 35, 679–690. [Google Scholar] [CrossRef] [PubMed]
- Monaghan, A.S.; Finley, J.M.; Mehta, S.H.; Peterson, D.S. Assessing the impact of dual-task reactive step practice in people with Parkinson’s disease: A feasibility study. Hum. Mov. Sci. 2021, 80, 102876. [Google Scholar] [CrossRef]
- Gershon, R.C.; Cella, D.; Fox, N.A.; Havlik, R.J.; Hendrie, H.C.; Wagster, M.V. Assessment of neurological and behavioural function: The NIH Toolbox. Lancet Neurol. 2010, 9, 138–139. [Google Scholar] [CrossRef]
- Earhart, G.M.; Cavanaugh, J.T.; Ellis, T.; Ford, M.P.; Foreman, K.B.; Dibble, L. The 9-hole PEG test of upper extremity function: Average values, test-retest reliability, and factors contributing to performance in people with Parkinson disease. J. Neurol. Phys. Ther. 2011, 35, 157–163. [Google Scholar] [CrossRef]
- Hinkle, J.T.; Pontone, G.M. Psychomotor processing and functional decline in Parkinson’s disease predicted by the Purdue Pegboard test. Int. J. Geriatr. Psychiatry 2021, 36, 909–916. [Google Scholar] [CrossRef]
- Duncan, R.P.; Leddy, A.L.; Earhart, G.M. Five times sit-to-stand test performance in Parkinson’s disease. Arch. Phys. Med. Rehabil. 2011, 92, 1431–1436. [Google Scholar] [CrossRef] [PubMed]
- Song, S.; Luo, Z.; Li, C.; Huang, X.; Shiroma, E.J.; Simonsick, E.M.; Chen, H. Changes in Body Composition Before and After Parkinson’s Disease Diagnosis. Mov. Disord. 2021, 36, 1617–1623. [Google Scholar] [CrossRef]
- Lorefält, B.; Toss, G.; Granérus, A.K. Weight loss, body fat mass, and leptin in Parkinson’s disease. Mov. Disord. 2009, 24, 885–890. [Google Scholar] [CrossRef] [PubMed]
- Uc, E.Y.; Struck, L.K.; Rodnitzky, R.L.; Zimmerman, B.; Dobson, J.; Evans, W.J. Predictors of weight loss in Parkinson’s disease. Mov. Disord. 2006, 21, 930–936. [Google Scholar] [CrossRef] [PubMed]
- Cumming, K.; Macleod, A.D.; Myint, P.K.; Counsell, C.E. Early weight loss in parkinsonism predicts poor outcomes: Evidence from an incident cohort study. Neurology 2017, 89, 2254–2261. [Google Scholar] [CrossRef] [PubMed]


| Sessions | Weeks of Training | ||||
|---|---|---|---|---|---|
| A | 1 Set × Reps tool | 2, 3 Set × Reps tool | 4–6 Set × Reps tool | 7–10 Set × Reps tool | 11 Set × Reps tool |
| Curl | 3 × 15 ws | 3 × 15 ws | 2 × 15 d | 3 × 15 d | 3 × 20 d |
| Row | 2 × 15 ws | 2 × 15 ws | 2 × 10 d | 2 × 15 d | 2 × 20 d |
| Overhead press | 2 × 10 ws | 2 × 10 ws | 2 × 6 d | 2 × 8 d | 2 × 15 d |
| Dumbbell Chest Fly | 3 × 10 bw | 3 × 10 bw | 3 × 8 d | 3 × 10 d | 2 × 15 d |
| Lateral Raise | 3 × 10 bw | 3 × 10 bw | 3 × 6 d | 3 × 8 d | 2 × 20 d |
| Triceps Kickback | 2 × 10 bw | 2 × 10 bw | 2 × 6 d | 2 × 6 d | 2 × 10 d |
| B | |||||
| Squat | 2 × 10 bw | 2 × 10 bw | 2 × 10 d | 2 × 15 d | 2 × 15 d + 10″ isometric |
| Hip abductions | 2 × 10 bw | 2 × 10 bw | 3 × 8 bw | 3 × 12 bw | 3 × 15 eb |
| Leg Curl | 2 × 10 bw | 2 × 10 bw | 3 × 8 bw | 3 × 12 bw | 3 × 12 eb |
| Leg Extension | 2 × 10 bw | 2 × 10 bw | 3 × 8 bw | 3 × 12 bw | 3 × 15 bw |
| Sit Hip adductions | 2 × 10 p | 2 × 10 p | 3 × 8 p | 3 × 12 p | 3 × 15 p |
| Sit Calf | 2 × 10 ws | 2 × 10 ws | 3 × 8 ws | 3 × 12 ws | 3 × 15 (stand) |
| C | |||||
| Curl | 3 × 15 ws | 3 × 15 ws | 2 × 15 d | 3 × 15 d | 3 × 20 d |
| Row | 2 × 15 ws | 2 × 15 ws | 2 × 10 d | 2 × 15 d | 2 × 20 d |
| Overhead press | 2 × 10 ws | 2 × 10 ws | 2 × 6 d | 2 × 8 d | 2 × 15 d |
| Dumbbell Chest Flys | 3 × 10 bw | 3 × 10 bw | 3 × 8 d | 3 × 10 d | 2 × 15 d |
| Lateral Raise | 3 × 10 bw | 3 × 10 bw | 3 × 6 d | 3 × 8 d | 2 × 20 d |
| Squat | 2 × 10 bw | 2 × 10 bw | 2 × 10 d | 2 × 15 d | 2 × 15 d + 10″ isometric |
| Triceps Kickback | 2 × 10 bw | 2 × 10 bw | 2 × 6 d | 2 × 6 d | 2 × 10 d |
| Parameters | Mean ± SD |
|---|---|
| Number of participants | 13 |
| Age | 64.83 ± 5.70 |
| Height | 171.58 ± 7.30 |
| weight | 76.93 ± 13.54 |
| Disease duration | 5.7 ± 3.08 |
| Hoehn and Yahr | 1.5 ± 0.5 |
| UPDRS 1 | 7 ± 2.4 |
| UPDRS 2 | 23.2 ± 4.5 |
| UPDRS 3 | 25.2 ± 7.1 |
| MoCA | 24.5 ± 2.3 |
| LEDD | 288.5 ± 109.7 |
| T0 | T1 | p-Value | |||
|---|---|---|---|---|---|
| Mean | Std. Deviation | Mean | Std. Deviation | ||
| Postural analysis | |||||
| Sway area OE (cm2) | 155.63 | 133.96 | 285.57 | 317.60 | 0.30 |
| Sway paths length OE (mm) | 649.09 | 147.48 | 827.91 | 286.62 | 0.03 ^ |
| Sway average speed OE (mm/s) | 13.15 | 2.93 | 16.68 | 5.80 | 0.04 ^ |
| Sway area CE (cm2) | 429.90 | 516.67 | 287.15 | 333.63 | 0.30 |
| Sway paths length CE (mm) | 740.45 | 141.64 | 888.92 | 338.72 | 0.06 |
| Sway average speed CE (mm/s) | 14.90 | 2.70 | 17.87 | 6.84 | 0.06 |
| Static analysis | |||||
| L foot area (cm2) | 93.58 | 17.50 | 83.08 | 20.05 | 0.03 ^ |
| R foot area (cm2) | 94.75 | 21.11 | 88.67 | 23.18 | 0.22 |
| R forefoot load (%) | 57.75 | 13.47 | 53.75 | 14.16 | 0.10 |
| L forefoot load (%) | 47.25 | 12.14 | 40.00 | 12.53 | 0.01 * |
| R hindfoot load (%) | 42.25 | 13.47 | 46.25 | 14.16 | 0.10 |
| L hindfoot load (%) | 52.75 | 12.14 | 60.00 | 12.53 | 0.01 * |
| Cervical ROM | |||||
| R lateral rotation (°) | 54.98 | 9.14 | 59.84 | 16.47 | 0.18 |
| L lateral rotation (°) | 55.10 | 16.21 | 59.77 | 14.18 | 0.13 |
| R lateral bending (°) | 25.85 | 8.67 | 29.51 | 9.64 | 0.03 * |
| L lateral bending (°) | 26.46 | 12.37 | 28.18 | 11.15 | 0.36 |
| Flexion (°) | 43.05 | 9.29 | 45.53 | 12.88 | 0.47 |
| Extension (°) | 38.62 | 17.70 | 47.77 | 10.98 | 0.49 |
| Motor function tests | |||||
| Timed up and go (s) | 12.47 | 2.69 | 9.29 | 2.16 | 0.00 ^^ |
| 5× sit-to- stand test (s) | 21.86 | 8.52 | 14.19 | 4.22 | 0.00 ^^ |
| Functional reach test (cm) | 31.37 | 7.06 | 38.73 | 5.34 | 0.01 * |
| D peg board test (s) | 137.00 | 49.61 | 126.87 | 51.59 | 0.02 ^ |
| D hand-grip (n) | 34.71 | 11.07 | 34.53 | 11.81 | 0.78 |
| ND hand-grip (n) | 31.88 | 10.53 | 33.28 | 11.22 | 0.18 |
| D eye-hands reaction test (s) | 0.54 | 0.36 | 0.41 | 0.11 | 0.07 |
| ND foot-reaction time (s) | 0.83 | 0.28 | 0.61 | 0.09 | 0.05 |
| D foot-reaction time (s) | 0.72 | 0.15 | 0.61 | 0.08 | 0.00 ^^ |
| Body composition | |||||
| BMI | 25.99 | 3.63 | 25.88 | 3.68 | 0.61 |
| TBW (l) | 39.99 | 6.35 | 40.78 | 8.16 | 0.60 |
| FFM (Kg) | 53.58 | 8.25 | 54.73 | 10.65 | 0.57 |
| Fat (Kg) | 23.33 | 9.34 | 21.84 | 8.61 | 0.45 |
| SM (Kg) | 28.57 | 5.80 | 28.62 | 6.61 | 0.95 |
| SMI (kg/m2) | 9.63 | 1.44 | 9.63 | 1.75 | 0.98 |
| BMR (Kcal) | 1527.33 | 178.18 | 1552.00 | 229.99 | 0.57 |
| T0 | T1 | p-Value | |||
|---|---|---|---|---|---|
| Mean | Std. Deviation | Mean | Std. Deviation | ||
| Glucose metabolism markers | |||||
| Glycemia (mg/dL) | 88.50 | 12.17 | 93.08 | 7.42 | 0.20 |
| Insulin (mUI/L) | 12.05 | 5.15 | 11.05 | 3.81 | 0.43 |
| Insulin Sensitivity (%) | 77.26 | 32.66 | 78.61 | 30.06 | 0.85 |
| Insulin resistance | 1.53 | 0.64 | 1.44 | 0.50 | 0.57 |
| Lipid metabolism markers | |||||
| Total Cholesterol (mg/dL) | 166.67 | 33.34 | 170.42 | 32.77 | 0.37 |
| HDL Cholesterol (mg/dL) | 49.33 | 9.59 | 52.08 | 10.13 | 0.11 |
| Total HDL Cholesterol (mg/dL) | 3.50 | 0.95 | 3.43 | 1.10 | 0.68 |
| Triglycerides (mg/dL) | 103.33 | 32.82 | 99.42 | 48.90 | 0.58 |
| LDL Cholesterol (mg/dL) | 96.67 | 30.79 | 98.45 | 30.00 | 0.58 |
| LDL/HDL Cholesterol (mg/dL) | 2.05 | 0.79 | 2.01 | 0.87 | 0.74 |
| Thyroid function markers | |||||
| FT3 (ng/L) | 3.25 | 0.70 | 4.64 | 0.47 | 0.00 ^^ |
| FT4 (ng/L) | 1.24 | 0.14 | 1.29 | 0.16 | 0.27 |
| TSH (mlU/L) | 1.79 | 1.05 | 1.80 | 0.87 | 0.79 |
| Bone metabolism markers | |||||
| PTH (ng/L) | 39.84 | 17.99 | 58.50 | 22.86 | 0.00 ^^ |
| Osteocalcin (mcg/dL) | 21.08 | 6.66 | 23.58 | 6.58 | 0.01 * |
| CTX (ng/L) | 0.30 | 0.12 | 0.44 | 0.15 | 0.00 ** |
| Vitamin D (mcg/dL) | 23.38 | 4.83 | 18.58 | 7.04 | 0.04 * |
| Calcium (mg/dL) | 8.71 | 0.28 | 9.07 | 0.21 | 0.00 ** |
Publisher’s Note: MDPI stays neutral with regard to jurisdictional claims in published maps and institutional affiliations. |
© 2022 by the authors. Licensee MDPI, Basel, Switzerland. This article is an open access article distributed under the terms and conditions of the Creative Commons Attribution (CC BY) license (https://creativecommons.org/licenses/by/4.0/).
Share and Cite
Amato, A.; Baldassano, S.; Vasto, S.; Schirò, G.; Davì, C.; Drid, P.; Dos Santos Mendes, F.A.; Caldarella, R.; D’Amelio, M.; Proia, P. Effects of a Resistance Training Protocol on Physical Performance, Body Composition, Bone Metabolism, and Systemic Homeostasis in Patients Diagnosed with Parkinson’s Disease: A Pilot Study. Int. J. Environ. Res. Public Health 2022, 19, 13022. https://doi.org/10.3390/ijerph192013022
Amato A, Baldassano S, Vasto S, Schirò G, Davì C, Drid P, Dos Santos Mendes FA, Caldarella R, D’Amelio M, Proia P. Effects of a Resistance Training Protocol on Physical Performance, Body Composition, Bone Metabolism, and Systemic Homeostasis in Patients Diagnosed with Parkinson’s Disease: A Pilot Study. International Journal of Environmental Research and Public Health. 2022; 19(20):13022. https://doi.org/10.3390/ijerph192013022
Chicago/Turabian StyleAmato, Alessandra, Sara Baldassano, Sonya Vasto, Giuseppe Schirò, Chiara Davì, Patrik Drid, Felipe Augusto Dos Santos Mendes, Rosalia Caldarella, Marco D’Amelio, and Patrizia Proia. 2022. "Effects of a Resistance Training Protocol on Physical Performance, Body Composition, Bone Metabolism, and Systemic Homeostasis in Patients Diagnosed with Parkinson’s Disease: A Pilot Study" International Journal of Environmental Research and Public Health 19, no. 20: 13022. https://doi.org/10.3390/ijerph192013022
APA StyleAmato, A., Baldassano, S., Vasto, S., Schirò, G., Davì, C., Drid, P., Dos Santos Mendes, F. A., Caldarella, R., D’Amelio, M., & Proia, P. (2022). Effects of a Resistance Training Protocol on Physical Performance, Body Composition, Bone Metabolism, and Systemic Homeostasis in Patients Diagnosed with Parkinson’s Disease: A Pilot Study. International Journal of Environmental Research and Public Health, 19(20), 13022. https://doi.org/10.3390/ijerph192013022