
Does the Prevalence of Obesity Affect the Demand for Soft Drinks? Evidence from Cross-Country Panel Data


Abstract
:1. Introduction
2. Materials and Methods
2.1. Data
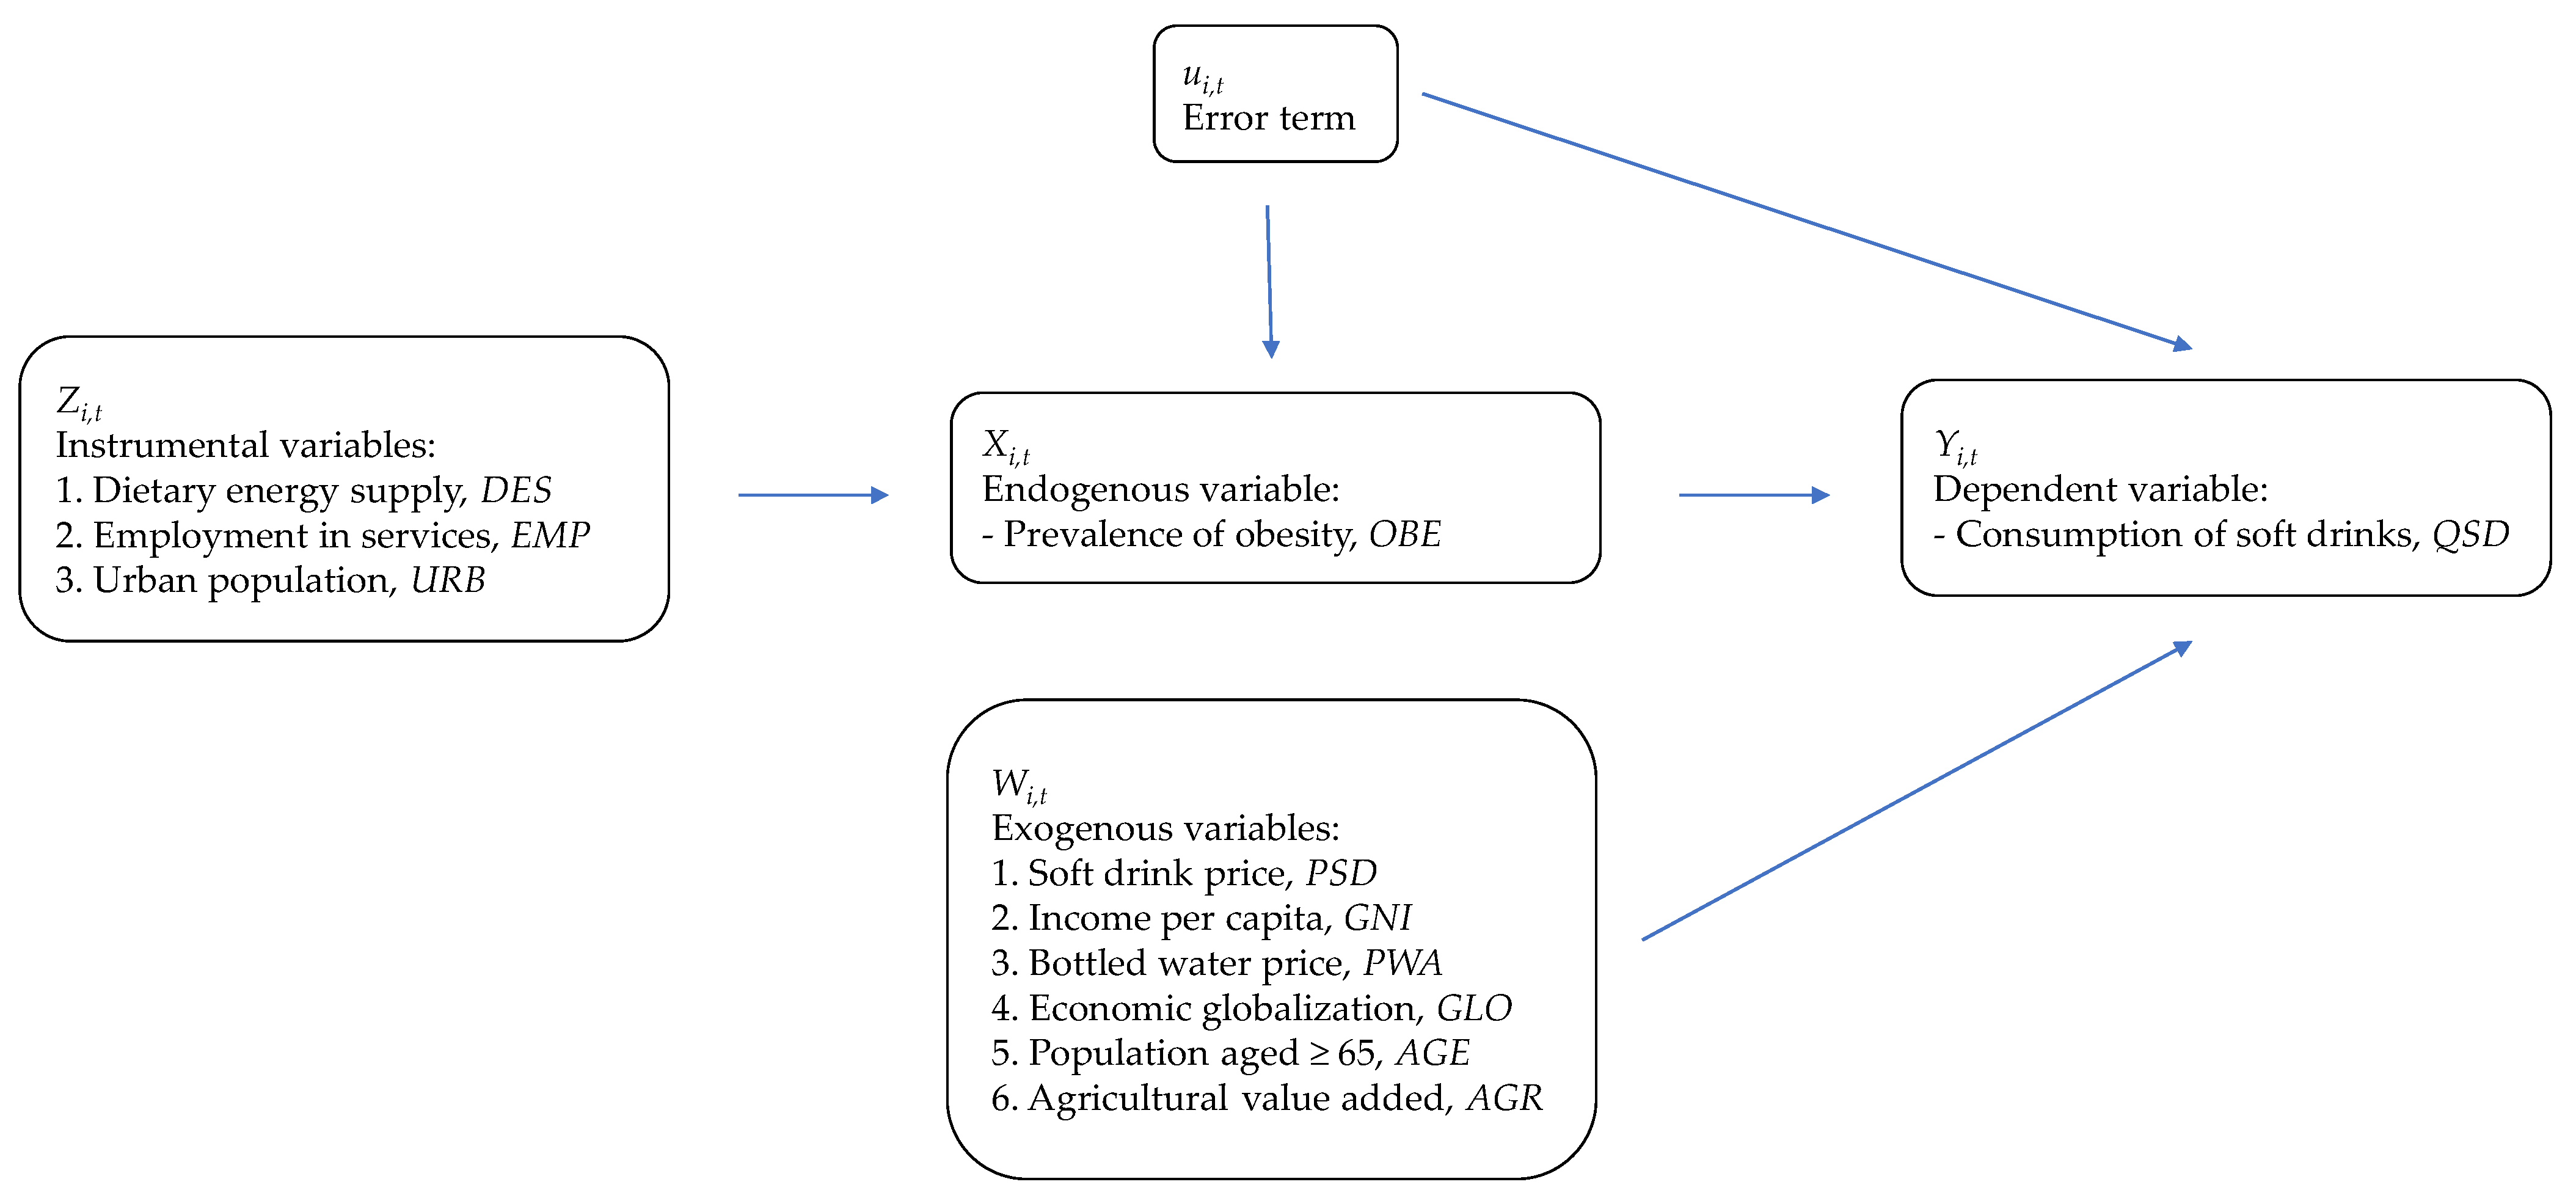
2.2. Methods
3. Results
4. Discussion
Limitations
5. Conclusions
Supplementary Materials
Author Contributions
Funding
Institutional Review Board Statement
Informed Consent Statement
Data Availability Statement
Acknowledgments
Conflicts of Interest
Appendix A

| High-Income Countries |
| Australia (WPA), Austria (EUR), Belgium (EUR), Canada, (AME), Chile (AME), Croatia (EUR), Czech Republic (EUR), Denmark (EUR), Estonia (EUR), Finland (EUR), France (EUR), Germany (EUR), Greece (EUR), Hong Kong (WPA), Hungary (EUR), Ireland (EUR), Israel (EME), Italy (EUR), Japan (WPA), Kuwait (EME), Latvia (EUR), Lithuania (EUR), Netherlands (EUR), New Zealand (WPA), Norway (EUR), Oman (EME), Panama (AME), Poland (EUR), Portugal (EUR), Qatar (EME), Saudi Arabia (EME), Singapore (WPA), Slovakia (EUR), Slovenia (EUR), South Korea (WPA), Spain (EUR), Sweden (EUR), Switzerland (EUR), Taiwan (WPA), United Arab Emirates (EME), United Kingdom (EUR), Uruguay (AME), United States of America (AME). No. = 43 |
| Upper-Middle Income Countries |
| Algeria (AFR), Argentina (AME), Azerbaijan (EUR), Belarus (EUR), Bosnia and Herzegovina (EUR), Brazil (AME), Bulgaria (EUR), China (WPA), Colombia (AME), Costa Rica (AME), Dominican Republic (AME), Ecuador (AME), Georgia (EUR), Guatemala (AME), Iraq (EME), Jordan (EME), Kazakhstan (EUR), Lebanon (EME), Malaysia (WPA), Mexico (AME), North Macedonia (EUR), Paraguay (AME), Peru (AME), Romania (EUR), Russia (EUR), Serbia (EUR), South Africa (AFR), Sri Lanka (SEA), Thailand (SEA), Turkey (EUR). No. = 30 |
| Lower-Middle Income Countries |
| Angola (AFR), Bangladesh (SEA), Bolivia (AME), Cambodia (WPA), Cameroon (AFR), Côte d’Ivoire (AFR), Egypt (EME), El Salvador (AME), Ghana (AFR), Honduras (AME), India (SEA), Indonesia (SEA), Kenya (AFR), Laos (WPA), Morocco (EME), Myanmar (SEA), Nigeria (AFR), Pakistan (EME), Philippines (WPA), Tunisia (EME), Ukraine (EUR), Uzbekistan (EUR), Vietnam (WPA). No. = 23 |
| Low-Income Countries |
| Ethiopia (AFR), Tanzania (AFR), Uganda (AFR). No. = 3 |
Appendix B
References
- Hu, F.B. Resolved: There is sufficient scientific evidence that decreasing sugar-sweetened beverage consumption will reduce the prevalence of obesity and obesity-related diseases. Obes Rev. 2013, 14, 606–619. [Google Scholar] [CrossRef] [PubMed]
- Luger, M.; Lafontan, M.; Bes-Rastrollo, M.; Winzer, E.; Yumuk, V.; Farpour-Lambert, N. Sugar-Sweetened Beverages and Weight Gain in Children and Adults: A Systematic Review from 2013 to 2015 and a Comparison with Previous Studies. Obes. Facts 2017, 10, 674–693. [Google Scholar] [CrossRef]
- Ruanpeng, D.; Thongprayoon, C.; Cheungpasitporn, W.; Harindhanavudhi, T. Sugar and artificially sweetened beverages linked to obesity: A systematic review and meta-analysis. QJM 2017, 110, 513–520. [Google Scholar] [CrossRef] [PubMed] [Green Version]
- Colchero, M.A.; Salgado, J.C.; Unar-Munguía, M.; Hernández-Ávila, M.; Rivera-Dommarco, J.A. Price elasticity of the demand for sugar sweetened beverages and soft drinks in Mexico. Econ. Hum. Biol. 2015, 19, 129–137. [Google Scholar] [CrossRef] [Green Version]
- Guerrero-López, C.M.; Unar-Munguía, M.; Colchero, M.A. Price elasticity of the demand for soft drinks, other sugar-sweetened beverages and energy dense food in Chile. BMC Public Health 2017, 17, 180. [Google Scholar] [CrossRef] [PubMed] [Green Version]
- Muhammad, A.; Meade, B.; Marquardt, D.R.; Mozaffarian, D. Global patterns in price elasticities of sugar-sweetened beverage intake and potential effectiveness of tax policy: A cross-sectional study of 164 countries by sex, age and global-income decile. BMJ Open. 2019, 9, e026390. [Google Scholar] [CrossRef] [Green Version]
- Ferretti, F.; Mariani, M.; Sarti, E. Is the development of obesogenic food environments a self-reinforcing process? Evidence from soft drink consumption. Glob. Health 2021, 18, 17. [Google Scholar] [CrossRef]
- Kumanyika, S.K.; Parker, L.; Sim, L.J. Bridging the Evidence Gap in Obesity Prevention: A Framework to Inform. Decision Making; National Academies Press: Washington, DC, USA, 2010. [Google Scholar]
- Gill, T. Managing and preventing obesity. In Behavioural Factors and Dietary Interventions; Woodhead Publishing: Cambridge, UK, 2015. [Google Scholar]
- World Health Organization. Obesity: Preventing and Managing the Global Epidemic; World Health Organization: Geneva, Switzerland, 2000. [Google Scholar]
- World Health Organization. Global Strategy on Diet, Physical Activity, and Health; World Health Organization: Geneva, Switzerland, 2004.
- Cawley, J. The Oxford Handbook of the Social Science of Obesity; Oxford University Press: Oxford, UK, 2011. [Google Scholar] [CrossRef]
- Swinburn, B.A.; Sacks, G.; Hall, K.D.; McPherson, K.; Finegood, D.T.; Moodie, M.L.; Gortmaker, S.L. The global obesity pandemic: Shaped by global drivers and local environments. Lancet 2011, 378, 804–814. [Google Scholar] [CrossRef]
- Popkin, B.M.; Hawkes, C. Sweetening of the global diet, particularly beverages: Patterns, trends, and policy responses. Lancet Diabetes Endocrinol. 2016, 4, 174–186. [Google Scholar] [CrossRef] [Green Version]
- Fry, C.; Spector, C.; Williamson, K.A.; Mujeeb, A. Breaking down the chain: A guide to the soft drink industry. In National Policy and Legal Analysis Network to Prevent Childhood Obesity; Change Lab Solutions: Oakland, CA, USA, 2012. [Google Scholar]
- Wambogo, E.; Reedy, J.; Shams-White, M.; Herrick, K.; Lerman, J.; O’Connor, L. Sources of energy, empty calories, added sugars, and solid fats among children and adolescents 2–18 years in the United States. Curr. Dev. Nutr. 2020, 4, 296. [Google Scholar] [CrossRef]
- An, R. Beverage consumption in relation to discretionary food intake and diet quality among US adults, 2003 to 2012. J. Acad. Nutr. Diet. 2016, 116, 28–37. [Google Scholar] [CrossRef]
- Pinho, M.G.M.; Mackenbach, J.D.; Charreire, H.; Oppert, J.-M.; Bárdos, H.; Glonti, K.; Rutter, H.; Compernolle, S.; De Bourdeaudhuij, I.; Beulens, J.W.J.; et al. Exploring the relationship between perceived barriers to healthy eating and dietary behaviours in European adults. Eur. J. Nutr. 2017, 57, 1761–1770. [Google Scholar] [CrossRef] [Green Version]
- Passport Global Market Information Database. Euromonitor International, London. 2020. Available online: https://go.euromonitor.com/passport.html (accessed on 5 October 2020).
- The World Bank Open Data Repository. The World Bank: Washington, DC, USA, 2020. Available online: https://data.worldbank.org/ (accessed on 6 October 2020).
- The World Bank International Comparison Program (ICP). The World Bank: Washington, DC, USA, 2020. Available online: https://www.worldbank.org/en/programs/icp#1 (accessed on 8 October 2020).
- Taylor, A.L.; Jacobson, M.F. Carbonating the World; Center for Science in the Public Interest: Washington, DC, USA, 2016. [Google Scholar]
- Hawkes, C. Uneven dietary development: Linking the policies and processes of globalization with the nutrition transition, obesity and diet-related chronic diseases. Global Health 2006, 2, 4. [Google Scholar] [CrossRef] [Green Version]
- Lin, T.K.; Teymourian, Y.; Tursini, M.S. The effect of sugar and processed food imports on the prevalence of overweight and obesity in 172 countries. Global Health 2018, 14, 35. [Google Scholar] [CrossRef] [PubMed]
- Monteiro, C.A.; Moubarac, J.C.; Cannon, G.; Ng, S.W.; Popkin, B. Ultra-processed products are becoming dominant in the global food system. Obes. Rev. 2013, 14, 21–28. [Google Scholar] [CrossRef] [PubMed]
- Gygli, S.; Haelg, F.; Potrafke, N.; Sturm, J.-E. The KOF Globalisation Index—revisited. Rev. Int. Organ. 2019, 14, 543–574. [Google Scholar] [CrossRef] [Green Version]
- Yang, L.; Bovet, P.; Liu, Y.; Zhao, M.; Ma, C.; Liang, Y.; Xi, B. Consumption of carbonated soft drinks among young adolescents aged 12 to 15 years in 53 low- and middle-income countries. Am. J. Public Health 2017, 107, 1095–1100. [Google Scholar] [CrossRef]
- Brownbill, A.L.; Miller, C.L.; Braunack-Mayer, A.J. The marketing of sugar-sweetened beverages to young people on Facebook. Aust. N. Z. J. Public Health 2018, 42, 354–360. [Google Scholar] [CrossRef]
- The Global Health Observatory. World Health Organization, Geneva; 2020. Available online: https://www.who.int/data/gho (accessed on 3 October 2020).
- Goryakin, Y.; Monsivais, P.; Suhrcke, M. Soft drink prices, sales, body mass index and diabetes: Evidence from a panel of low-, middle- and high-income countries. Food Policy 2017, 73, 88–94. [Google Scholar] [CrossRef] [Green Version]
- Vandevijvere, S.; Chow, C.C.; Hall, K.D.; Umali, E.; Swinburn, B.A. Increased food energy supply as a major driver of the obesity epidemic: A global analysis. Bull. World Health Organ. 2015, 93, 446–456. [Google Scholar] [CrossRef]
- Faostat. The Food and Agriculture Organisation. Rome, 2020. Available online: http://www.fao.org/faostat/en/#data/FS (accessed on 10 October 2020).
- Church, T.; Martin, C.K. The obesity epidemic: A consequence of reduced energy expenditure and the uncoupling of energy intake? Obesity 2018, 26, 14–16. [Google Scholar] [CrossRef] [PubMed]
- Stock, J.; Watson, M. Introduction to Econometrics; Pearson Education: London, UK, 2019. [Google Scholar]
- Basu, S.; McKee, M.; Galea, G.; Stuckler, D. Relationship of soft drink consumption to global overweight, obesity, and diabetes: A cross-national analysis of 75 countries. Am. J. Public Health 2013, 103, 2071–2077. [Google Scholar] [CrossRef] [PubMed]
- Singh, G.M.; Micha, R.; Khatibzadeh, S.; Shi, P.; Lim, S.; Andrews, G.K.; Engell, R.E.; Ezzati, M.; Mozaffarian, D.; Global Burden of Diseases Nutrition and Chronic Diseases Expert Group (NutriCoDE). Global, regional, and national consumption of sugar-sweetened beverages, fruit juices, and milk: A systematic assessment of beverage intake in 187 countries. PLoS ONE 2015, 10, e0124845. [Google Scholar] [CrossRef] [PubMed] [Green Version]
- Ventura, E.E.; Davis, J.N.; Goran, M.I. Sugar content of popular sweetened beverages based on objective laboratory analysis: Focus on fructose content. Obesity 2011, 19, 868–874. [Google Scholar] [CrossRef]
- Shekar, M.; Popkin, B. Obesity: Health and Economic Consequences of an Impending Global Challenge; The World Bank: Washington, DC, USA, 2020. [Google Scholar] [CrossRef] [Green Version]
- Ferretti, F. Sugar-Sweetened Beverage Taxes: Origins, Mechanisms, and Current Worldwide Status. In Obesity and Diabetes; Faintuch, J., Faintuch, S., Eds.; Springer: Cham, Switzerland, 2020. [Google Scholar] [CrossRef]
- Wooldridge, J.M. Introductory Econometrics: A Modern Approach; South-Western Cengage Learning: Mason, OH, USA, 2012. [Google Scholar]
| Variable | Description | Mean | Std. Dev. | Min | Max | N. of Obs. |
|---|---|---|---|---|---|---|
| QSD | Soft drink consumption per capita (liters/person/year) | 75.38 | 49.00 | 1.69 | 270.95 | 1485 |
| OBE | Prevalence of obesity (BMI ≥ 30 kg/m2. Age-stand. rate, both sexes, 18+ years, %) | 18.62 | 8.78 | 0.90 | 39.70 | 1.455 |
| PSD | Soft drink price (average per liter PPP, constant 2017 international $) | 3.44 | 1.23 | 1.58 | 15.12 | 1470 |
| GNI | Gross national income per capita (PPP, constant 2017 international $) | 24,410.07 | 20,070.88 | 892.83 | 97,094.19 | 1470 |
| PWA | Bottled still and carbonated water price (average per liter PPP, constant 2017 international $) | 1.73 | 0.75 | 0.30 | 5.58 | 1470 |
| GLO | KOF index of economic globalization (min = 0, max = 100) | 63.17 | 15.73 | 25.5 | 95.3 | 1470 |
| AGE | Population aged 65 and above (as % of total population) | 10.17 | 6.16 | 0.69 | 28.00 | 1470 |
| AGR | Agricultural value added (as % of total value added, GDP) | 7.97 | 8.37 | 0.03 | 46.69 | 1470 |
| DES | Dietary energy supply (kcal/person/day) | 2989.13 | 422.89 | 1729 | 3847 | 1485 |
| EMP | Employment in services (both sexes, as % of total employment) | 59.27 | 16.79 | 14.76 | 88.29 | 1470 |
| URB | Urban population (as % of total population) | 65.36 | 20.27 | 15.70 | 100.00 | 1470 |
| QCA | Carbonated soft drink consumption per capita (liters/person/year) | 49.70 | 35.70 | 1.38 | 186.89 | 1485 |
| PCA | Carbonated soft drink price (average per liter PPP, constant 2017 international $) | 3.03 | 1.14 | 1.26 | 12.38 | 1470 |
| PNC | Non-carbonated soft drink price (average per liter PPP, constant 2017 international $) | 4.64 | 2.64 | 1.80 | 35.57 | 1470 |
| Dependent Variable | |||||||
|---|---|---|---|---|---|---|---|
| Soft Drink Consumption, QSD | Carbonated Soft Drink Consumption, QCA | ||||||
| Independent Variables | Coefficient | Std. Error 1 | Independent Variables | Coefficient | Std. Error 1 | ||
| Prevalence of obesity | OBE | 2.3660 *** | 0.2267 | Prevalence of obesity | OBE | 1.1150 *** | 0.1574 |
| Soft drink price | PSD | −2.8759 *** | 0.8378 | Carbonated soft drink price | PCA | −3.0533 *** | 0.7151 |
| Income per capita | GNI | 0.0007 *** | 0.0001 | Income per capita | GNI | 0.0003 *** | 0.0001 |
| Bottled water price | PWA | 3.0471 *** | 1.0276 | Bottled water price | PWA | 2.7238 *** | 0.8639 |
| Economic globalization | GLO | 0.3393 *** | 0.0908 | Economic globalization | GLO | 0.2706 *** | 0.0734 |
| Population aged 65 and above | AGE | −5.0116 *** | 0.4848 | Population aged 65 and above | AGE | −3.4424 *** | 0.3390 |
| Agricultural value added | AGR | −0.3045 *** | 0.0903 | Agricultural value added | AGR | −0.2515 *** | 0.0590 |
| Non-carbonated soft drink price | PNC | 0.0466 | 0.1844 | ||||
| N. of obs. | 1455 | N. of obs. | 1455 | ||||
| F-statistic, F(7, 1351) | 39.62, Prob. 0.000 | F-statistic, F(8, 1350) | 21.77, Prob. 0.000 | ||||
| Underidentification test | 206.808, P-val. 0.000 | Underidentification test | 197.131, P-val. 0.000 | ||||
| Weak identification test | 327.346 | Weak identification test | 323.315 | ||||
| Sargan–Hansen J statistic | 0.668, P-val. 0.716 | Sargan–Hansen J statistic | 4.379, P-val. 0.112 | ||||
Publisher’s Note: MDPI stays neutral with regard to jurisdictional claims in published maps and institutional affiliations. |
© 2022 by the authors. Licensee MDPI, Basel, Switzerland. This article is an open access article distributed under the terms and conditions of the Creative Commons Attribution (CC BY) license (https://creativecommons.org/licenses/by/4.0/).
Share and Cite
Ferretti, F.; Mariani, M.; Sarti, E. Does the Prevalence of Obesity Affect the Demand for Soft Drinks? Evidence from Cross-Country Panel Data. Int. J. Environ. Res. Public Health 2022, 19, 938. https://doi.org/10.3390/ijerph19020938
Ferretti F, Mariani M, Sarti E. Does the Prevalence of Obesity Affect the Demand for Soft Drinks? Evidence from Cross-Country Panel Data. International Journal of Environmental Research and Public Health. 2022; 19(2):938. https://doi.org/10.3390/ijerph19020938
Chicago/Turabian StyleFerretti, Fabrizio, Michele Mariani, and Elena Sarti. 2022. "Does the Prevalence of Obesity Affect the Demand for Soft Drinks? Evidence from Cross-Country Panel Data" International Journal of Environmental Research and Public Health 19, no. 2: 938. https://doi.org/10.3390/ijerph19020938
APA StyleFerretti, F., Mariani, M., & Sarti, E. (2022). Does the Prevalence of Obesity Affect the Demand for Soft Drinks? Evidence from Cross-Country Panel Data. International Journal of Environmental Research and Public Health, 19(2), 938. https://doi.org/10.3390/ijerph19020938