
Mental Well-Being: 2010–2018 Trends among Italian Adolescents


 ,
,  ,
, 
 ,
,  ,
,  ,
,  and
and
Abstract
1. Introduction
1.1. The Concept of Health as Well-Being
1.2. Mental Health during Adolescence: Theorization and Consequences
1.3. Trends and Determinants
2. Materials and Methods
2.1. Study Population
2.2. Measures
- Life Satisfaction (LS) was assessed with the Cantril ladder [35], a reliable instrument for subjective well-being among adolescents [36]. Participants were asked to rate their life satisfaction using a visual analogue scale (range 0–10): higher the score, greater the feeling of life satisfaction. Respondents were asked to indicate the ladder step at which they would place their lives at present. The findings presented here were categorized as low (0–8)/high LS (≥9) [37].
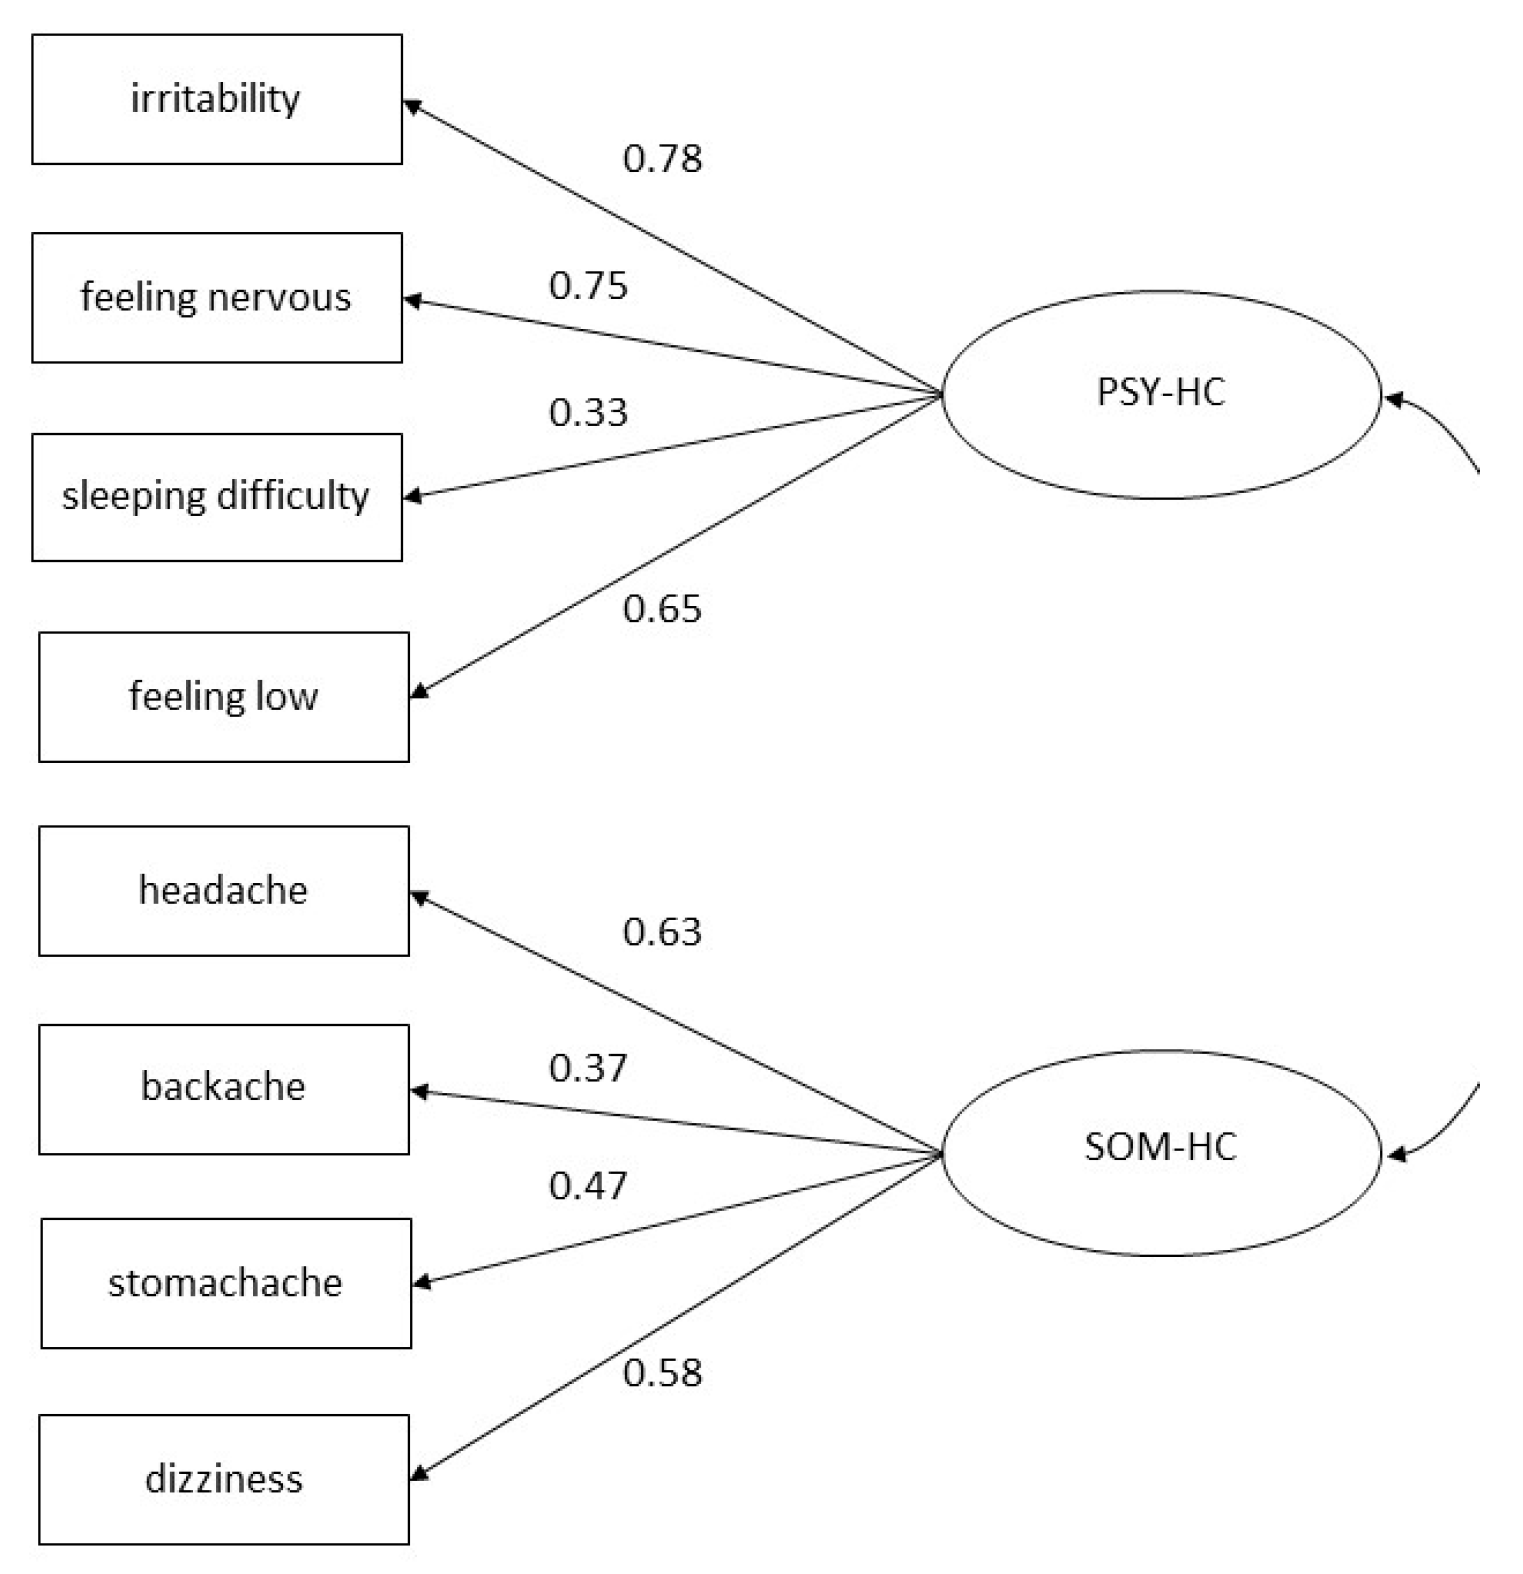
- Psychosomatic Health Complaints (HC) were evaluated through the HBSC Symptom Checklist (HBSC-SCL), a non-clinical measure consisting of eight items (headache, stomachache, backache, feeling low, irritability or bad-tempered, feeling nervous, sleeping difficulties, and dizziness). Adolescents indicated how often they had experienced each complaint over the last six months. Response options for each symptom ranged from about every day to rarely or never. According to the binary cut-off used in the international report [15], findings presented here were categorized as participants with multiple (two or more) health complaints more than once a week/other (reference category). This instrument has adequate test-retest reliability and psychometric properties [38,39] and is commonly used to assess adolescent mental well-being [40]. HBSC-SCL can be thought of as constituting two dimensions: somatic (SOM-HC) (i.e., headache, stomachache, backache, and dizziness) and psychological complaints (PSY-HC) (i.e., feeling low, irritability, feeling nervous, and sleeping difficulties) [41]. SOM-HC and PSY-HC were dichotomized as participants perceiving multiple (two or more) complaints more than once a week/other (reference category).
2.3. Explanatory Variables
- Gender and age. Participants were asked to indicate whether they were a boy or a girl, as well as their month and year of birth.
- Geographic area. The geographic area is derived from the school address and classified into Northern, Central, and Southern Italy [42].
- Socioeconomic Status (SES) was measured according to the family affluence scale (FAS), which has been recognized as a reliable indicator of family wealth [43]. The scale consisted of four items: family car ownership, whether adolescents have their own bedroom, number of holidays trips taken in the last year, and number of computers owned by the family. The obtained score (0–7) was categorized on a 3-point ordinal scale: low (0–3), medium (4–5), and high (≥6) SES.
- Schoolwork Pressure. Adolescents responded to the question, “How pressured do you feel by the schoolwork you have to do?”. The response options available were “not at all” (1), “a little” (2), “some’’ (3), and “a lot” (4). The responses were re-coded into high (3–4) and low (1–2) pressure, as classified by the international HBSC report [15].
- Classmate Support was measured by three items: (1) “The students in my class enjoy being together”, (2) “Most of the students in my class are kind and helpful”, and (3) “Other students accept me as I am”. Response categories for all the above items ranged from strongly agree (1) to strongly disagree (5). Original codes were reversed: strongly disagree (0) to strongly agree (4), and a sum-score was generated for each domain (range 0–12) and then divided by three. The resulting average score was categorized as low (<2.5) or high (≥2.5) classmate support [44].
- Family Support was assessed by two items. Young people were asked how easy it is for them to talk to their mother or father about things that really bother them. Response options ranged from very easy to very difficult. In this study, we dichotomized finding as easy or very easy/difficult or very difficult. Communication in the family is an indicator of social support and of the family’s connectedness [45,46,47].
- Immigration background was defined by the country of birth of the adolescents and their parents. If at least one parent was born abroad, adolescents were classified as having an immigrant status [45].
- Family structure was determined by asking adolescents to identify the people who live, most of the time, in the same house with them. Adolescents were then classified as “living with both biological parents” (traditional family) or “living with other adults” (non-traditional family) [48].
2.4. Statistical Analyses
3. Results
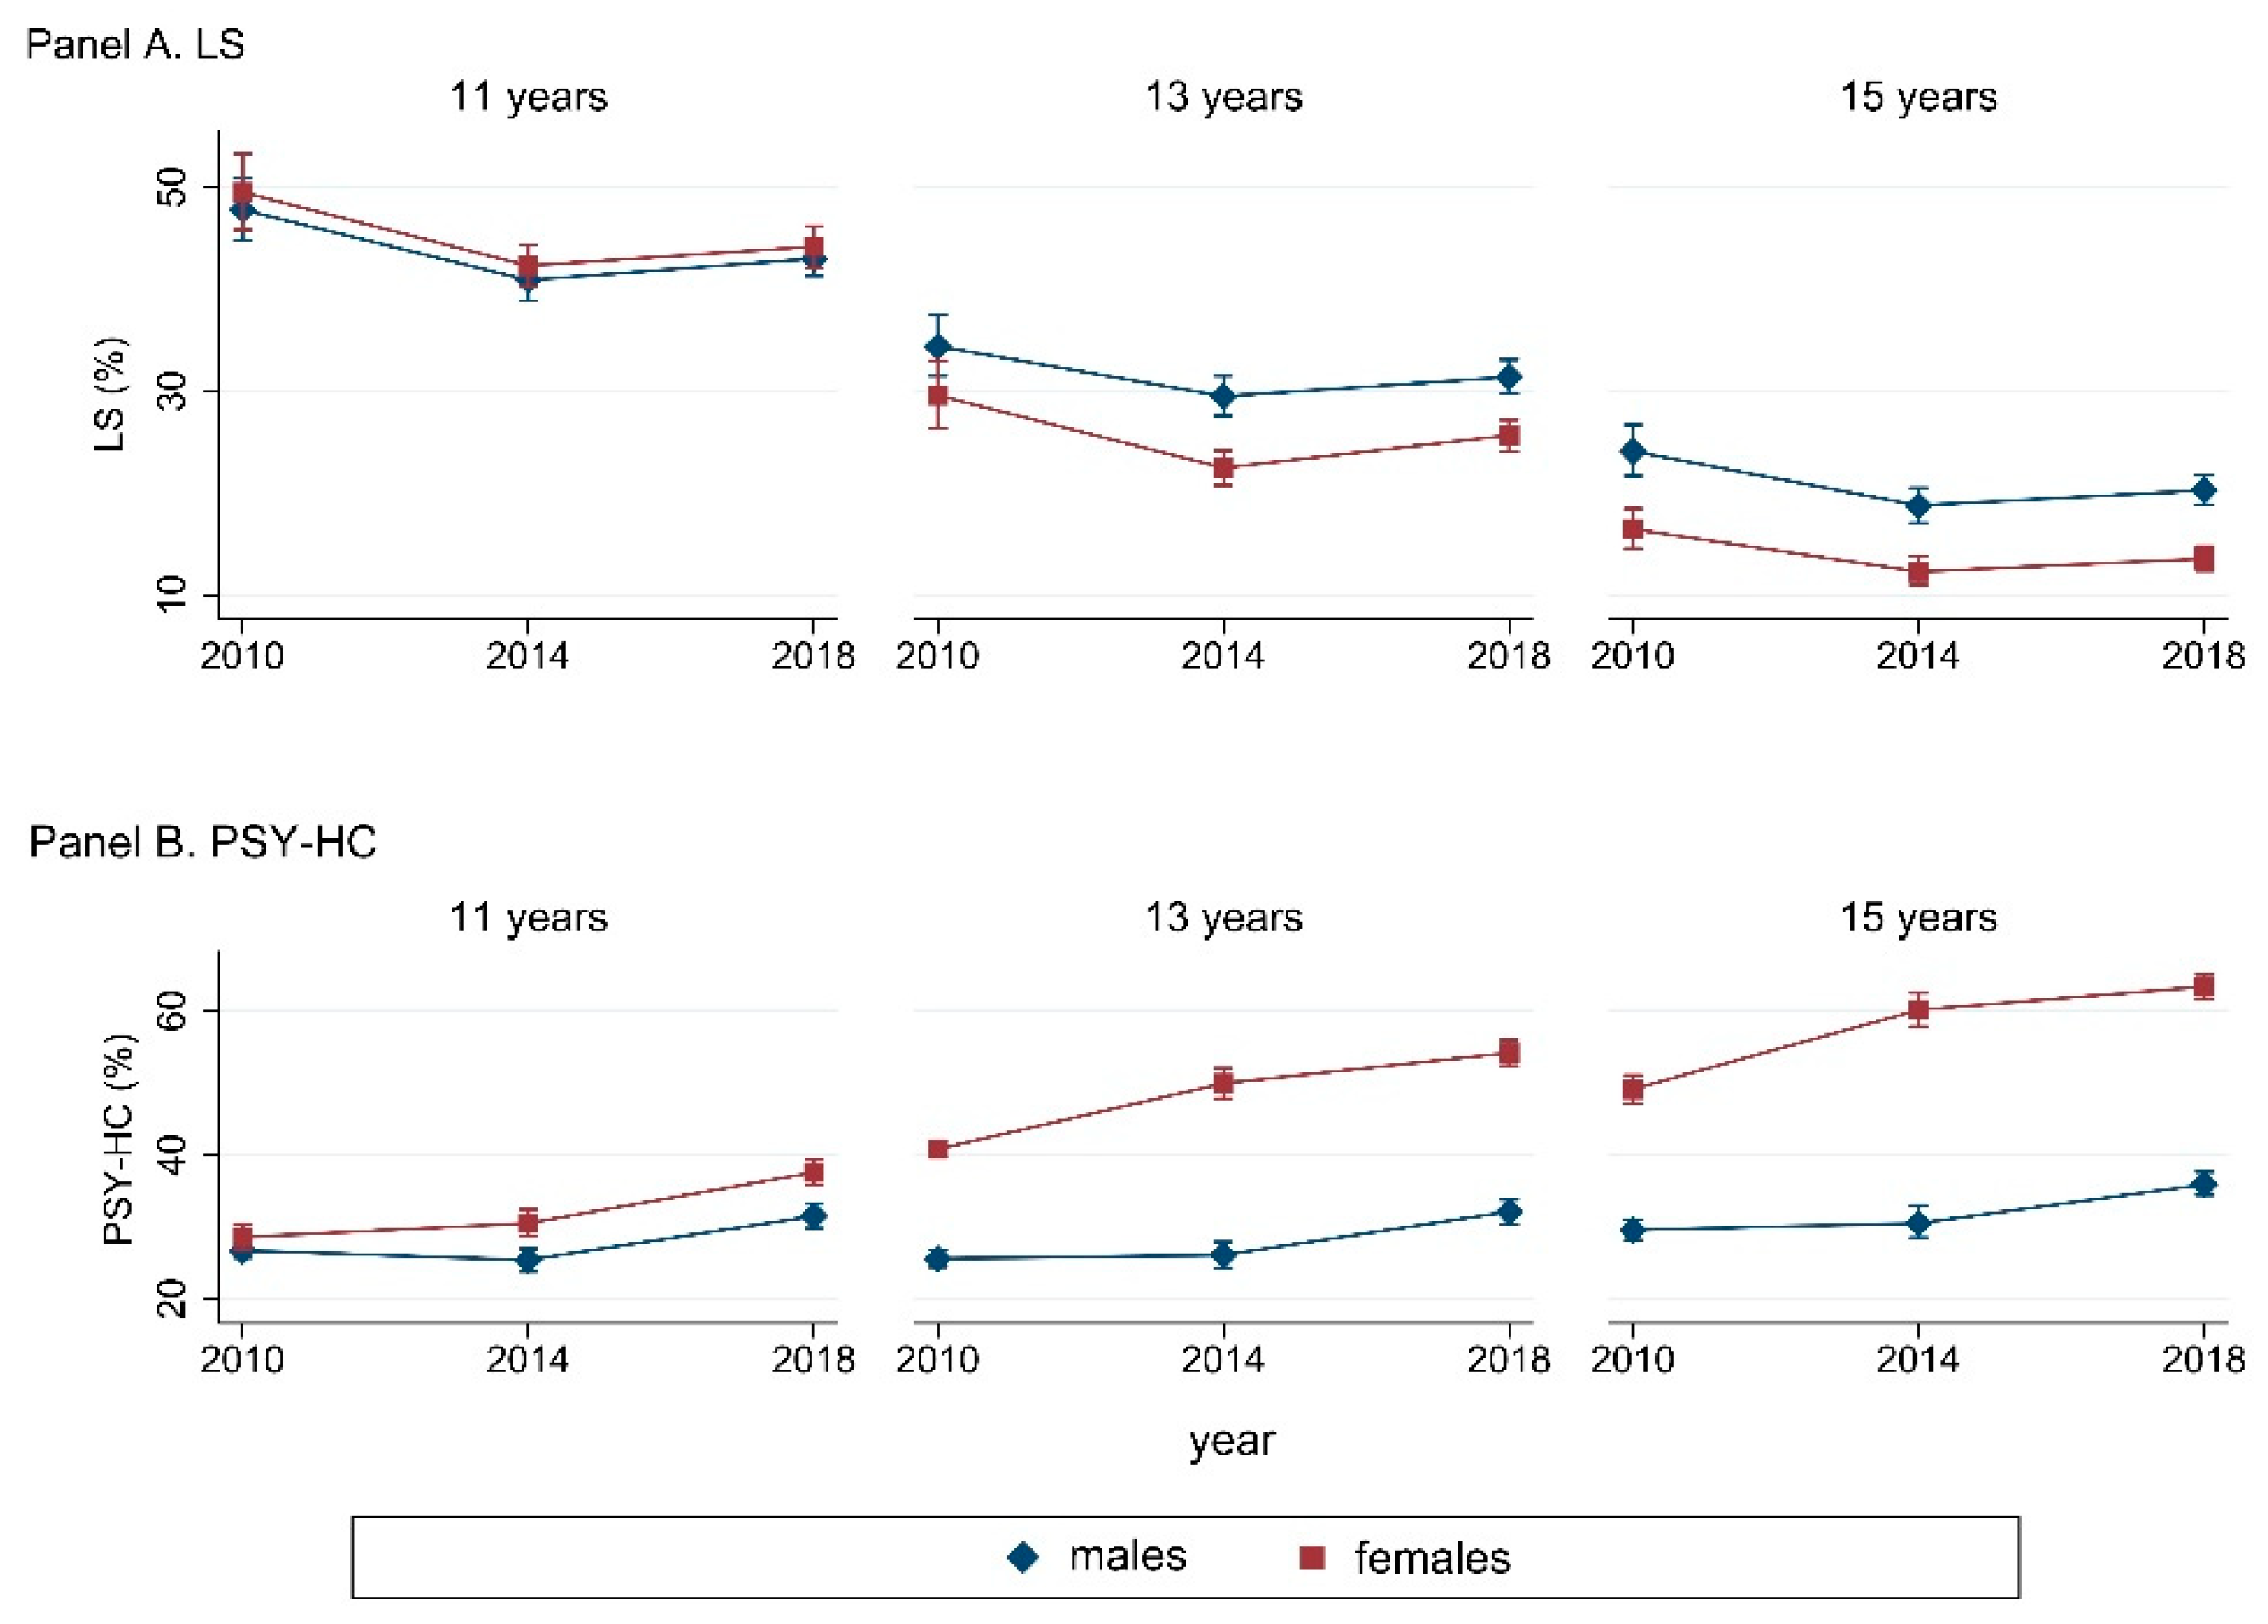
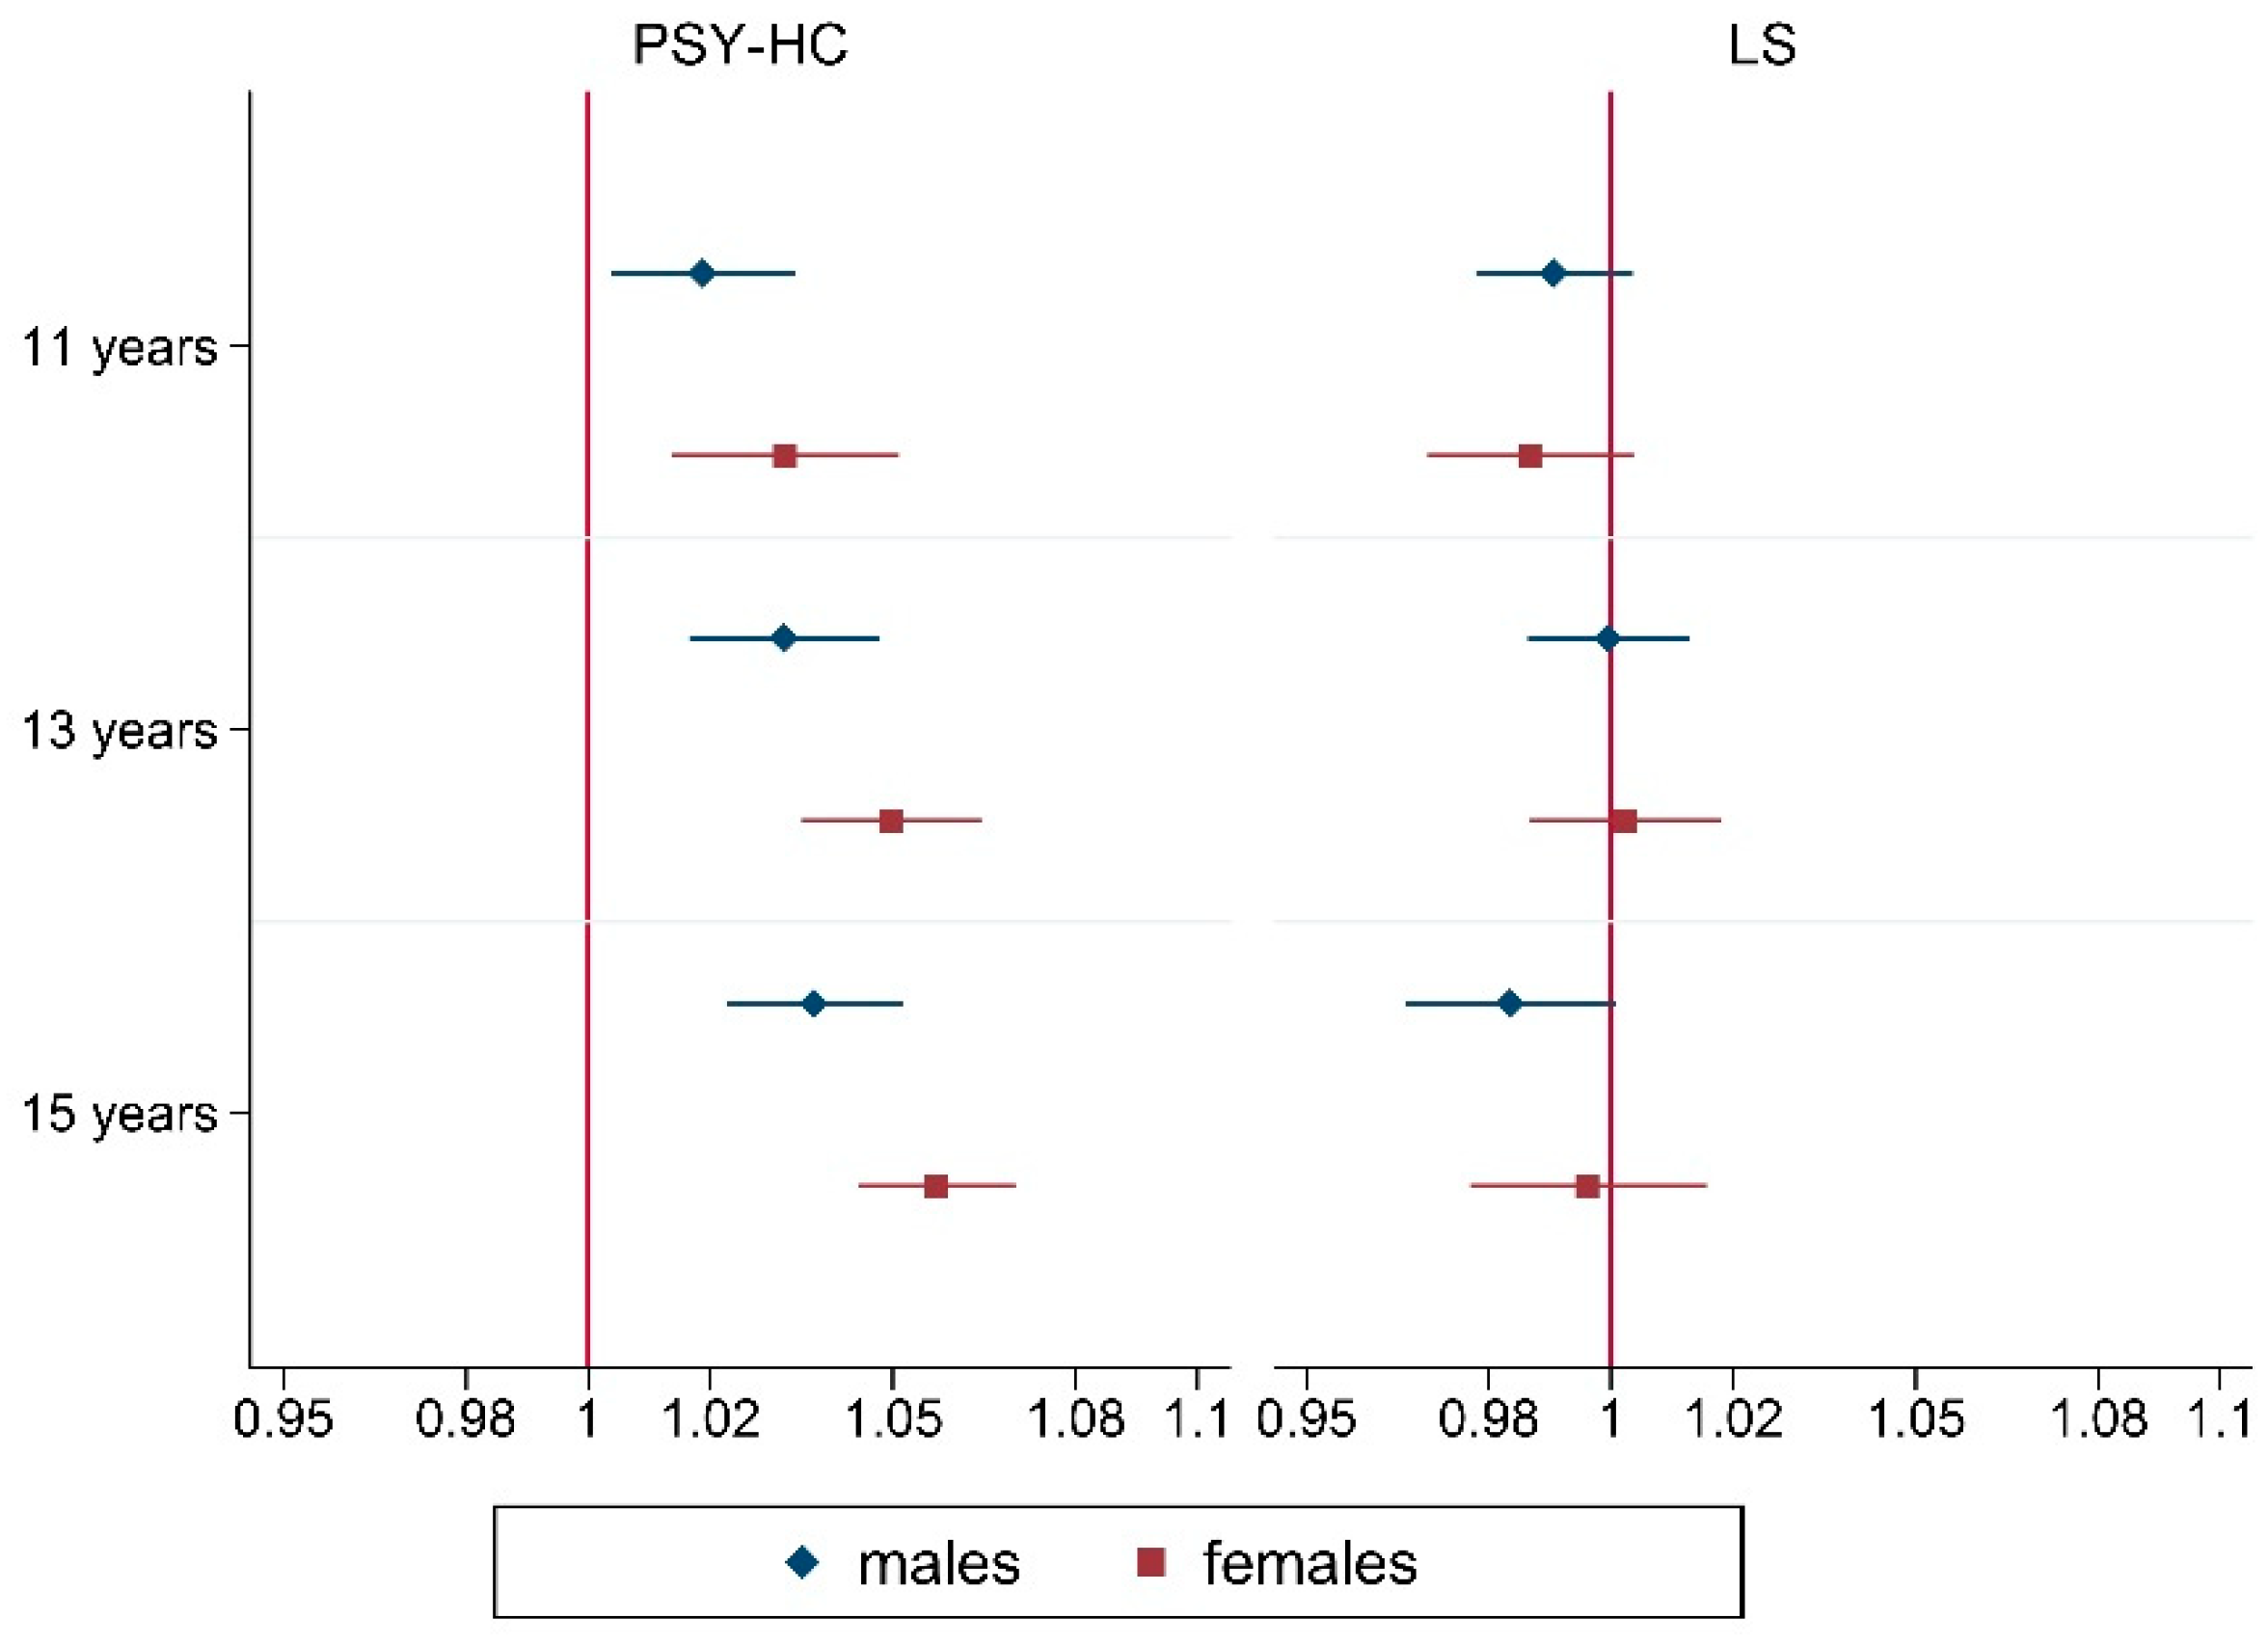
3.1. Trend in Well-being Measures (LS, HC, PSY-HC and SOM-HC): Gender and Age Disparities
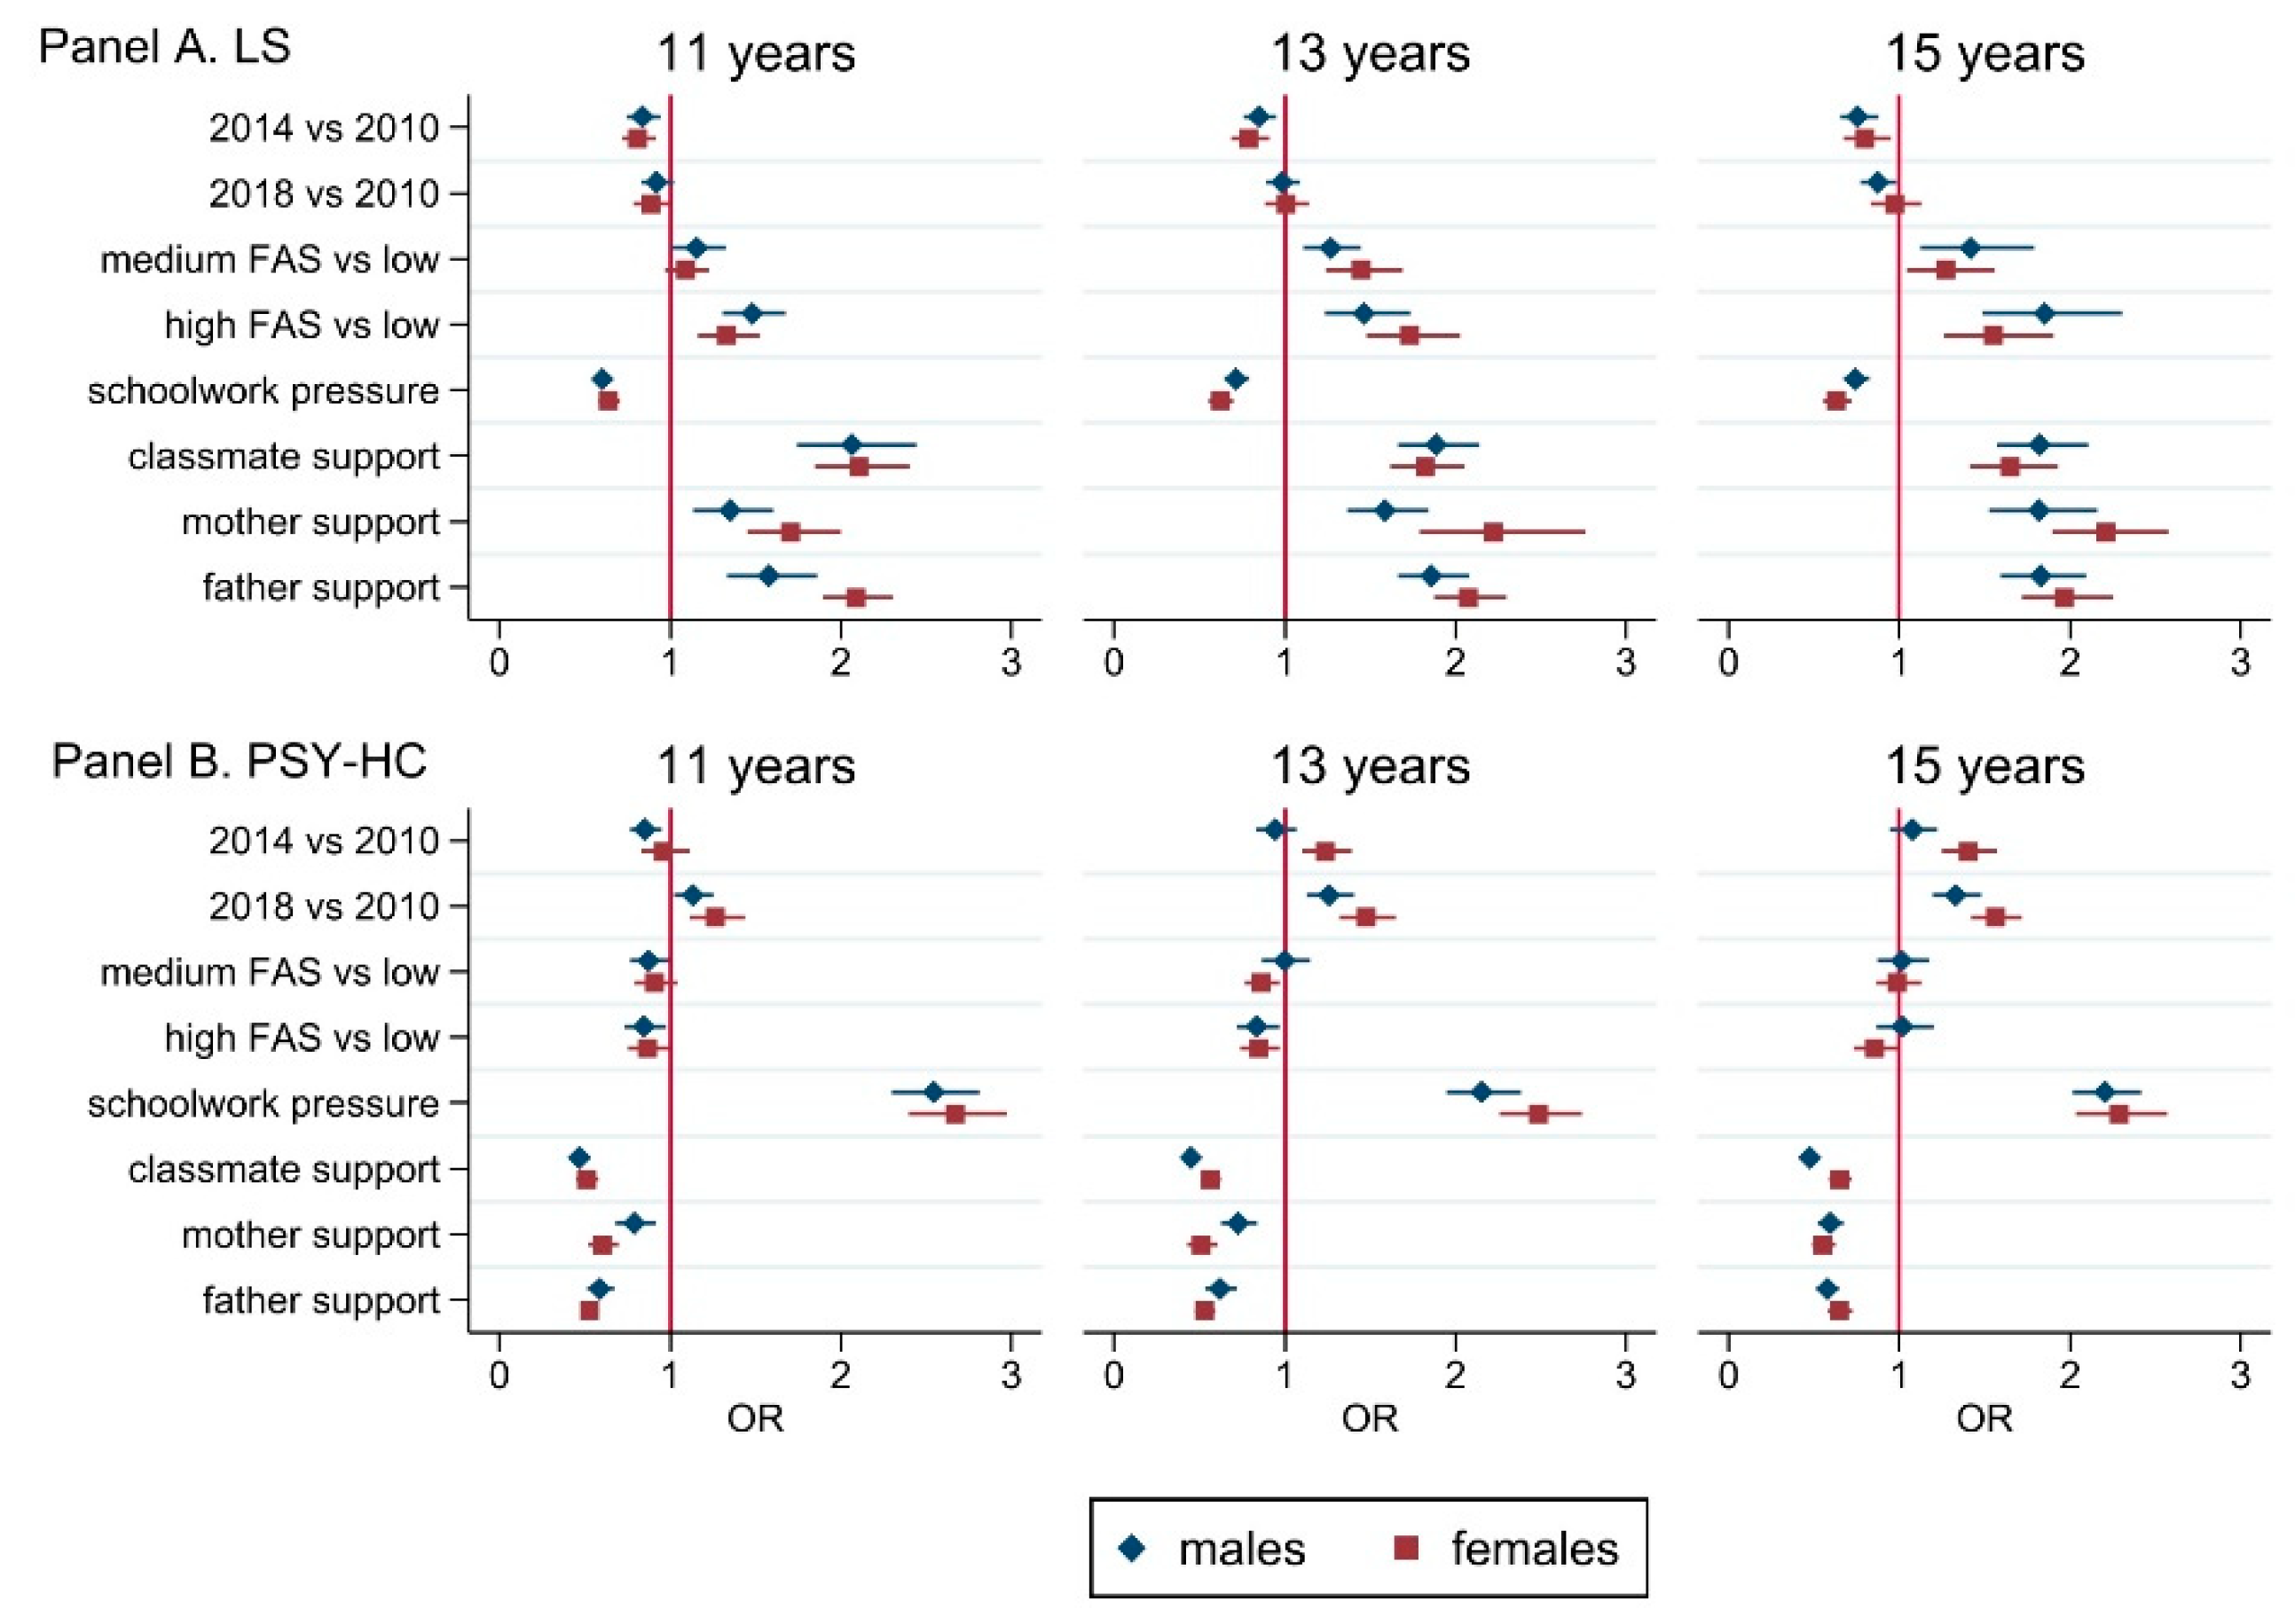
3.2. Social Determinants of Well-Being
4. Discussion
Strengths and Limitations
5. Conclusions
Author Contributions
Funding
Institutional Review Board Statement
Informed Consent Statement
Data Availability Statement
Acknowledgments
Conflicts of Interest
Appendix A


| AIC | BIC | df | |
|---|---|---|---|
| Continuous (SEM) | |||
| single factor | 4,101,076 | 4,101,316 | 24 |
| double factor | 4,057,805 | 4,058,056 | 25 |
| Dichotomized (GSEM) | |||
| single factor | 1,171,920 | 1,172,160 | 24 |
| double factor | 1,141,340 | 1,141,591 | 25 |
| Males | Females | |||||||
|---|---|---|---|---|---|---|---|---|
| 2010 | 2014 | 2018 | Overall | 2010 | 2014 | 2018 | Overall | |
| LS | ||||||||
| Age | ||||||||
| 11 years | 47.8 | 40.9 | 43.0 | 44.0 | 49.5 | 42.3 | 44.2 | 45.3 |
| 13 years | 34.4 | 29.5 | 31.4 | 31.8 | 29.6 | 22.5 | 25.7 | 26.0 |
| 15 years | 24.1 | 18.8 | 20.3 | 21.1 | 16.5 | 12.3 | 13.6 | 14.2 |
| HC | ||||||||
| Age | ||||||||
| 11 years | 41.7 | 36 | 42.9 | 40.4 | 48.4 | 46.4 | 50.7 | 48.6 |
| 13 years | 36.5 | 35.3 | 41.5 | 38.0 | 55.9 | 61.3 | 64.3 | 60.6 |
| 15 years | 38.2 | 39.4 | 44.2 | 40.7 | 63.5 | 69.9 | 72.9 | 68.7 |
| PSY-HC | ||||||||
| Age | ||||||||
| 11 years | 26.7 | 25.4 | 31.5 | 28.0 | 28.6 | 30.5 | 37.6 | 32.5 |
| 13 years | 25.6 | 26.1 | 32.1 | 28.2 | 40.8 | 49.9 | 54.1 | 48.4 |
| 15 years | 29.6 | 30.5 | 35.9 | 32.1 | 49.1 | 60.1 | 63.3 | 57.3 |
| SOM-HC | ||||||||
| Age | ||||||||
| 11 years | 16.9 | 12.3 | 15.2 | 14.9 | 23.6 | 22.8 | 22.6 | 23.0 |
| 13 years | 12.1 | 11.2 | 13.7 | 12.4 | 23.1 | 27.5 | 28.2 | 26.3 |
| 15 years | 11.5 | 11.2 | 13.6 | 12.1 | 27.3 | 31.8 | 32.1 | 30.3 |
| Males | Females | |||||
|---|---|---|---|---|---|---|
| 11 Years | 13 Years | 15 Years | 11 Years | 13 Years | 15 Years | |
| Feelinglow | ||||||
| Overall trend from 2010 to 2018 (per year) | 0.99 (0.98–1.01) | 1.00 (0.98–1.01) | 1.00 (0.98–1.01) | 1.00 (0.98–1.02) | 1.00 (0.98–1.01) | 1.01 (0.99–1.02) |
| Survey | ||||||
| 2014 vs. 2010 | 0.93 (0.82–1.06) | 0.99 (0.88–1.13) | 0.97 (0.85–1.11) | 0.98 (0.83–1.16) | 1.07 (0.95–1.22) | 1.23 (1.08–1.40) |
| 2018 vs. 2010 | 0.93 (0.83–1.04) | 0.99 (0.88–1.12) | 0.98 (0.87–1.10) | 1.02 (0.87–1.19) | 0.99 (0.88–1.11) | 1.06 (0.94–1.18) |
| Irritability | ||||||
| Overall trend from 2010 to 2018 (per year) | 1.03 (1.01–1.04) | 1.03 (1.02–1.04) | 1.03 (1.02–1.05) | 1.03 (1.02–1.04) | 1.06 (1.04–1.08) | 1.07 (1.05–1.08) |
| Survey | ||||||
| 2014 vs. 2010 | 0.89 (0.78–1.01) | 0.95 (0.84–1.07) | 0.99 (0.87–1.12) | 1.09 (0.96–1.23) | 1.30 (1.12–1.51) | 1.32 (1.19–1.48) |
| 2018 vs. 2010 | 1.17 (1.05–1.31) | 1.21 (1.08–1.35) | 1.27 (1.14–1.40) | 1.26 (1.13–1.40) | 1.62 (1.41–1.85) | 1.68 (1.53–1.85) |
| Feelingnervous | ||||||
| Overall trend from 2010 to 2018 (per year) | 1.02 (1.00–1.04) | 1.03 (1.01–1.04) | 1.04 (1.02–1.06) | 1.03 (1.01–1.04) | 1.05 (1.04–1.07) | 1.05 (1.04–1.07) |
| Survey | ||||||
| 2014 vs. 2010 | 0.77 (0.67–0.88) | 0.81 (0.80–1.03) | 1.03 (0.90–1.18) | 0.89 (0.79–0.99) | 1.23 (1.07–1.41) | 1.14 (1.01–1.28) |
| 2018 vs. 2010 | 1.14 (1.00–1.30) | 1.21 (1.07–1.36) | 1.34 (1.20–1.51) | 1.22 (1.10–1.34) | 1.51 (1.33–1.72) | 1.46 (1.31–1.61) |
| Sleepingdifficulty | ||||||
| Overall trend from 2010 to 2018 (per year) | 1.03 (1.00–1.06) | 1.04 (1.02–1.06) | 1.08 (1.06–1.10) | 1.04 (1.01–1.07) | 1.09 (1.07–1.10) | 1.07 (1.06–1.09) |
| Survey | ||||||
| 2014 vs. 2010 | 0.83 (0.71–0.97) | 1.07 (0.92–1.25) | 1.27 (1.07–1.49) | 1.01 (0.79–1.28) | 1.37 (1.17–1.60) | 1.32 (1.17–1.48) |
| 2018 vs. 2010 | 1.22 (1.05–1.41) | 1.31 (1.14–1.51) | 1.79 (1.56–2.07) | 1.37 (1.10–1.71) | 1.91 (1.65–2.21) | 1.75 (1.58–1.94) |
| Males | Females | |||||
|---|---|---|---|---|---|---|
| 11 Years | 13 Years | 15 Years | 11 Years | 13 Years | 15 Years | |
| LS | ||||||
| Survey | ||||||
| 2014 vs. 2010 | 0.84 (0.74–0.94) | 0.85 (0.76–0.95) | 0.75 (0.65–0.88) | 0.81 (0.72–0.91) | 0.79 (0.69–0.91) | 0.80 (0.67–0.95) |
| 2018 vs. 2010 | 0.92 (0.83–1.02) | 0.99 (0.89–1.09) | 0.97 (0.77–0.99) | 0.89 (0.79–1.00) | 1.01 (0.89–1.14) | 0.97 (0.83–1.13) |
| FAS | ||||||
| Middle vs. low | 1.15 (1.00–1.33) | 1.27 (1.11–1.45) | 1.42 (1.12–1.79) | 1.09 (0.97–1.23) | 1.45 (1.24–1.69) | 1.27 (1.04–1.56) |
| High vs. low | 1.48 (1.31–1.68) | 1.46 (1.23–1.74) | 1.85 (1.49–2.30) | 1.33 (1.16–1.52) | 1.73 (1.48–2.03) | 1.55 (1.26–1.90) |
| High school work pressure | 0.60 (0.55–0.66) | 0.71 (0.65–0.79) | 0.74 (1.67–0.82) | 0.64 (0.58–0.70) | 0.62 (0.56–0.70) | 0.63 (0.55–0.72) |
| Nontraditional family structure | 0.64 (0.57–0.72) | 0.70 (0.62–0.79) | 0.89 (0.7–1.08) | 0.68 (0.58–0.81) | 0.60 (0.49–0.71) | 0.84 (0.63–1.11) |
| Good mother support | 1.35 (1.14–1.60) | 1.59 (1.37–1.84) | 1.82 (1.53–2.16) | 1.71 (1.45–2.00) | 2.22 (1.79–2.76) | 2.21 (1.90–2.58) |
| Good father support | 1.58 (1.34–1.86) | 1.86 (1.66–2.08) | 1.83 (1.59–2.10) | 2.09 (1.89–2.30) | 2.08 (1.87–2.30) | 1.97 (1.72–2.25) |
| Good classmate support | 2.06 (1.75–2.44) | 1.89 (1.66–2.14) | 1.82 (1.57–2.11) | 2.11 (1.85–2.40) | 1.82 (1.62–2.06) | 1.65 (1.41–1.93) |
| Geographic area | ||||||
| Centre vs. northern | 1.15 (1.04–1.28) | 1.17 (1.04–1.32) | 1.10 (0.96–1.27) | 1.07 (0.94–1.21) | 1.07 (0.94–1.22) | 0.93 (0.79–1.08) |
| Southern vs. northern | 1.21 (1.09–1.35) | 1.46 (1.23–1.74) | 1.19 (1.04–1.36) | 1.20 (1.07–1.34) | 1.12 (0.99–1.27) | 1.09 (0.93–1.26) |
| Immigration background | 0.91 (0.79–1.05) | 0.95 (0.82–1.09) | 1.16 (0.96–1.41) | 0.91 (0.80–1.03) | 0.89 (0.77–1.03) | 1.01 (0.83–1.24) |
| HC | ||||||
| Survey | ||||||
| 2014 vs. 2010 | 0.70 (0.63–0.78) | 0.90 (0.79–1.01) | 1.04 (0.93–1.17) | 0.83 (0.72–0.94) | 1.11 (0.99–1.24) | 1.17 (1.02–1.33) |
| 2018 vs. 2010 | 0.92 (0.83–1.02) | 1.13 (1.01–1.26) | 1.20 (1.09–1.32) | 0.93 (0.83–1.05) | 1.26 (1.14–1.38) | 1.33 (1.19–1.49) |
| FAS | ||||||
| Middle vs. low | 0.81 (0.72–0.91) | 0.96 (0.85–1.09) | 0.89 (0.77–1.04) | 0.88 (0.77–0.99) | 0.82 (0.71–0.94) | 0.85 (0.74–0.97) |
| High vs. low | 0.77 (0.67–0.89) | 0.84 (0.73–0.95) | 0.84 (0.71–0.98) | 0.83 (0.72–0.96) | 0.77 (0.67–0.88) | 0.75 (0.64–0.88) |
| High school work pressure | 2.50 (2.29–2.74) | 2.15 (1.95–2.37) | 2.21 (2.03–2.41) | 2.64 (2.40–2.90) | 2.55 (2.32–2.80) | 2.22 (2.00–2.47) |
| Nontraditional family structure | 1.29 (1.12–1.49) | 1.37 (1.19–1.58) | 1.23 (1.06–1.44) | 1.35 (1.19–1.53) | 1.25 (1.09–1.44) | 1.20 (1.02–1.41) |
| Good mother support | 0.77 (0.66–0.90) | 0.77 (0.68–0.87) | 0.67 (0.59–0.76) | 0.69 (0.57–0.79) | 0.56 (0.45–0.70) | 0.57 (0.51–0.64) |
| Good father support | 0.63 (0.56–0.71) | 0.62 (0.54–0.72) | 0.59 (0.54–0.66) | 0.56 (0.51–0.61) | 0.49 (0.44–0.55) | 0.66 (0.59–0.73) |
| Good classmate support | 0.49 (0.43–0.55) | 0.50 (0.45–0.55) | 0.51 (0.46–0.56) | 0.54 (0.46–0.63) | 0.61 (0.56–0.67) | 0.64 (0.57–0.73) |
| Geographic area | ||||||
| Centre vs. northern | 1.24 (1.11–1.40) | 1.10 (0.98–1.24) | 1.08 (0.98–1.20) | 1.19 (1.07–1.33) | 1.19 (1.07–1.33) | 1.36 (1.22–1.53) |
| Southern vs. northern | 1.35 (1.22–1.49) | 1.19 (1.06–1.33) | 1.24 (1.06–1.44) | 1.53 (1.36–1.72) | 1.59 (1.44–1.76) | 1.63 (1.44–1.85) |
| Immigration background | 1.17 (1.02–1.35) | 0.90 (0.79–1.04) | 1.03 (0.89–1.19) | 0.98 (0.85–1.12) | 1.10 (0.91–1.33) | 1.04 (0.87–1.24) |
| SOM-HC | ||||||
| Survey | ||||||
| 2014 vs. 2010 | 0.67 (0.57–0.78) | 0.88 (0.75–1.03) | 0.85 (0.66–1.10) | 0.93 (0.82–1.05) | 1.17 (1.04–1.31) | 1.15 (0.98–1.36) |
| 2018 vs. 2010 | 0.86 (0.74–0.99) | 1.04 (0.91–1.19) | 1.07 (0.85–1.33) | 0.86 (0.76–0.96) | 1.20 (1.09–1.33) | 1.20 (1.03–1.39) |
| FAS | ||||||
| Middle vs. low | 0.79 (0.67–0.93) | 0.98 (0.83–1.18) | 0.75 (0.62–0.90) | 0.84 (0.74–0.97) | 0.95 (0.92–1.10) | 0.83 (0.72–0.94) |
| High vs. low | 0.85 (0.71–1.02) | 0.89 (0.73–1.09) | 0.69 (0.56–0.84) | 0.86 (0.75–1.00) | 0.95 (0.83–1.08) | 0.82 (0.71–0.94) |
| High school work pressure | 1.91 (1.65–2.21) | 1.92 (1.63–2.27) | 1.74 (1.53–1.99) | 1.89 (1.69–2.11) | 1.87 (1.68–2.09) | 1.79 (1.61–2.00) |
| Nontraditional family structure | 1.12 (0.95–1.33) | 1.39 (1.13–1.71) | 1.12 (0.87–1.43) | 1.31 (1.10–1.57) | 1.30 (1.09–1.55) | 1.02 (0.85–1.23) |
| Good mother support | 0.79 (0.66–0.96) | 0.83 (0.71–0.98) | 0.90 (0.77–1.05) | 0.74 (0.61–0.89) | 0.75 (0.65–0.87) | 0.78 (0.71–0.86) |
| Good father support | 0.84 (0.71–0.99) | 0.80 (0.69–0.92) | 0.73 (0.63–0.86) | 0.74 (0.66–0.83) | 0.69 (0.63–0.77) | 0.77 (0.70–0.85) |
| Good classmate support | 0.74 (0.64–0.87) | 0.66 (0.56–0.77) | 0.63 (0.53–0.73) | 0.79 (0.68–0.92) | 0.72 (0.64–0.81) | 0.78 (0.70–0.86) |
| Geographic area | ||||||
| Centre vs. northern | 1.21 (1.03–1.43) | 1.08 (0.93–1.29) | 1.11 (0.95–1.30) | 1.28 (1.13–1.45) | 1.10 (0.96–1.25) | 1.30 (1.15–1.46) |
| Southern vs. northern | 1.63 (1.42–1.88) | 1.30 (1.12–1.51) | 1.22 (1.02–1.47) | 1.65 (1.46–1.87) | 1.53 (1.38–1.69) | 1.41 (1.24–1.59) |
| Immigration background | 1.09 (0.90–1.32) | 0.92 (0.76–1.11) | 1.13 (0.92–1.38) | 1.01 (0.86–1.19) | 1.03 (0.87–1.21) | 1.10 (0.94–1.27) |
| PSY-HC | ||||||
| Survey | ||||||
| 2014 vs. 2010 | 0.85 (0.76–0.95) | 0.94 (0.83–1.07) | 1.08 (0.95–1.22) | 0.96 (0.83–1.11) | 1.24 (1.10–1.39) | 1.40 (1.25–1.57) |
| 2018 vs. 2010 | 1.13 (1.02–1.25) | 1.26 (1.13–1.41) | 1.33 (1.20–1.48) | 1.26 (1.11–1.44) | 1.48 (1.32–1.65) | 1.56 (1.42–1.72) |
| FAS | ||||||
| Middle vs. low | 0.87 (0.77–0.99) | 1.00 (0.87–1.15) | 1.01 (0.87–1.18) | 0.91 (0.79–1.04) | 0.86 (0.77–0.97) | 0.99 (0.86–1.13) |
| High vs. low | 0.85 (0.73–0.98) | 0.84 (0.72–0.97) | 1.02 (0.86–1.20) | 0.87 (0.75–1.00) | 0.85 (0.74–0.97) | 0.85 (0.74–0.99) |
| High school work pressure | 2.54 (2.30–2.81) | 2.15 (1.95–2.38) | 2.20 (2.01–2.42) | 2.67 (2.60–2.97) | 2.49 (2.26–2.74) | 2.29 (2.04–2.57) |
| Nontraditional family structure | 1.25 (1.08–1.44) | 1.37 (1.18–1.59) | 1.21 (1.05–1.40) | 1.28 (1.11–1.48) | 1.23 (1.06–1.43) | 1.30 (1.11–1.51) |
| Good mother support | 0.79 (0.68–0.92) | 0.73 (0.63–0.84) | 0.59 (0.52–0.67) | 0.60 (0.52–0.70) | 0.51 (0.43–0.61) | 0.55 (0.59–0.63) |
| Good father support | 0.59 (0.51–0.67) | 0.62 (0.53–0.72) | 0.58 (0.51–0.65) | 0.53 (0.48–0.58) | 0.53 (0.48–0.59) | 0.65 (0.58–0.73) |
| Good classmate support | 0.47 (0.41–0.54) | 0.45 (0.40–0.51) | 0.48 (0.43–0.53) | 0.51 (0.45–0.58) | 0.57 (0.51–0.63) | 0.65 (0.59–0.72) |
| Geographic area | ||||||
| Centre vs. northern | 1.20 (1.06–1.34) | 1.10 (0.96–1.24)) | 1.10 (0.99–1.23) | 1.06 (0.94–1.19) | 1.09 (0.96–1.24) | 1.28 (1.15–1.42) |
| Southern vs. northern | 1.20 (1.08–1.34) | 1.10 (0.98–1.24) | 1.19 (1.06–1.33) | 1.23 (1.08–1.40) | 1.40 (1.26–1.57) | 1.61 (1.44–1.79) |
| Immigration background | 1.18 (1.03–1.36) | 0.94 (0.81--1.08) | 0.98 (0.84–1.14) | 0.98 (0.86–1.13) | 1.10 (0.93–1.30) | 1.08 (0.92–1.27) |
References
- WHO. Preamble to the Constitution of the World Health Organization as Adopted by the International Health Conference, New York, 19–22 June 1946; World Health Organization: Geneva, Switzerland, 1948; p. 2. [Google Scholar]
- Giltay, E.J.; Geleijnse, J.M.; Zitman, F.G.; Hoekstra, T.; Schouten, E.G. Dispositional Optimism and All-Cause and Cardiovascular Mortality In a Prospective Cohort of Elderly Dutch Men and Women. Arch. Gen. Psychiatry 2004, 61, 1126. [Google Scholar] [CrossRef] [PubMed]
- Bronfenbrenner, U. Ecological Systems Theory. In Six Theories of Child Development: Revised Formulations and Current Issues; Jessica Kingsley Publishers: London, UK, 1992; pp. 187–249. ISBN 1-85302-137-7. [Google Scholar]
- Bronfenbrenner, U.; Ceci, S.J. Nature-Nurture Reconceptualized in Developmental Perspective: A Bioecological Model. Psychol. Rev. 1994, 101, 568–586. [Google Scholar] [CrossRef] [PubMed]
- Herrman, H.; Saxena, S.; Moodie, R.; World Health Organization; Victorian Health Promotion Foundation; University of Melbourne (Eds.) Promoting Mental Health: Concepts, Emerging Evidence, Practice; World Health Organization: Geneva, Switzerland, 2005; ISBN 978-92-4-156294-2.
- Murray, C.J.L.; Lopez, A.D.; Harvard School of Public Health; World Health Organization; World Bank (Eds.) The Global Burden of Disease: A Comprehensive Assessment of Mortality and Disability from Diseases, Injuries, and Risk Factors in 1990 and Projected to 2020; Global Burden of Disease and Injury Series; Harvard School of Public Health on behalf of the World Health Organization and the World Bank: Cambridge, MA, USA, 1996; ISBN 978-0-674-35448-7. [Google Scholar]
- Sawyer, S.M.; Afifi, R.A.; Bearinger, L.H.; Blakemore, S.-J.; Dick, B.; Ezeh, A.C.; Patton, G.C. Adolescence: A Foundation for Future Health. Lancet 2012, 379, 1630–1640. [Google Scholar] [CrossRef]
- Solmi, M.; Radua, J.; Olivola, M.; Croce, E.; Soardo, L.; Salazar de Pablo, G.; Il Shin, J.; Kirkbride, J.B.; Jones, P.; Kim, J.H.; et al. Age at Onset of Mental Disorders Worldwide: Large-Scale Meta-Analysis of 192 Epidemiological Studies. Mol. Psychiatry 2021. [Google Scholar] [CrossRef] [PubMed]
- Levin, K.A.; Currie, C.; Muldoon, J. Mental Well-Being and Subjective Health of 11- to 15-Year-Old Boys and Girls in Scotland, 1994–2006. Eur. J. Public Health 2009, 19, 605–610. [Google Scholar] [CrossRef]
- Braverman, M.T.; Stawski, R.S.; Samdal, O.; Aarø, L.E. Daily Smoking and Subjective Health Complaints in Adolescence. Nicotine Tob. Res. 2017, 19, 102–110. [Google Scholar] [CrossRef]
- Dey, M.; Jorm, A.F.; Mackinnon, A.J. Cross-Sectional Time Trends in Psychological and Somatic Health Complaints among Adolescents: A Structural Equation Modelling Analysis of ‘Health Behaviour in School-Aged Children’ Data from Switzerland. Soc. Psychiatry Psychiatr. Epidemiol. 2015, 50, 1189–1198. [Google Scholar] [CrossRef]
- Savoye, I.; Moreau, N.; Brault, M.-C.; Levêque, A.; Godin, I. Well-Being, Gender, and Psychological Health in School-Aged Children. Arch. Public Health 2015, 73, 52. [Google Scholar] [CrossRef]
- Kim, K.J.; Conger, R.D.; Elder, G.H.; Lorenz, F.O. Reciprocal Influences Between Stressful Life Events and Adolescent Internalizing and Externalizing Problems. Child Dev. 2003, 74, 127–143. [Google Scholar] [CrossRef]
- Kessler, R.C.; Angermeyer, M.; Anthony, J.C.; DE Graaf, R.; Demyttenaere, K.; Gasquet, I.; DE Girolamo, G.; Gluzman, S.; Gureje, O.; Haro, J.M.; et al. Lifetime Prevalence and Age-of-Onset Distributions of Mental Disorders in the World Health Organization’s World Mental Health Survey Initiative. World Psychiatry 2007, 6, 168–176. [Google Scholar]
- Inchley, J.; Currie, D.; Budisavljević, S.; Torsheim, T.; Jaastad, A.; Cosma, A.; Kelly, C.; Arnarsson, A.; Samdal, O.; Weber, M. Spotlight on Adolescent Health and Well-Being Findings from the 2017/2018 Health Behaviour in School-Aged Children (HBSC) Survey in Europe and Canada International Report Volume 2. Key Data; WHO Regional Office for Europe: Copenhagen, Denmark, 2020; ISBN 978-92-890-5501-7. [Google Scholar]
- Cosma, A.; Stevens, G.; Martin, G.; Duinhof, E.L.; Walsh, S.D.; Garcia-Moya, I.; Költő, A.; Gobina, I.; Canale, N.; Catunda, C.; et al. Cross-National Time Trends in Adolescent Mental Well-Being From 2002 to 2018 and the Explanatory Role of Schoolwork Pressure. J. Adolesc. Health 2020, 66, S50–S58. [Google Scholar] [CrossRef]
- Potrebny, T.; Wiium, N.; Lundegård, M.M.-I. Temporal Trends in Adolescents’ Self-Reported Psychosomatic Health Complaints from 1980-2016: A Systematic Review and Meta-Analysis. PLoS ONE 2017, 12, e0188374. [Google Scholar] [CrossRef]
- Gariépy, G.; Elgar, F.J. Trends in Psychological Symptoms among Canadian Adolescents from 2002 to 2014: Gender and Socioeconomic Differences. Can. J. Psychiatry 2016, 61, 797–802. [Google Scholar] [CrossRef] [PubMed]
- Hagquist, C. Discrepant Trends in Mental Health Complaints Among Younger and Older Adolescents in Sweden: An Analysis of WHO Data 1985–2005. J. Adolesc. Health 2010, 46, 258–264. [Google Scholar] [CrossRef] [PubMed]
- Potrebny, T.; Wiium, N.; Haugstvedt, A.; Sollesnes, R.; Torsheim, T.; Wold, B.; Thuen, F. Health Complaints among Adolescents in Norway: A Twenty-Year Perspective on Trends. PLoS ONE 2019, 14, e0210509. [Google Scholar] [CrossRef] [PubMed]
- Fink, E.; Patalay, P.; Sharpe, H.; Holley, S.; Deighton, J.; Wolpert, M. Mental Health Difficulties in Early Adolescence: A Comparison of Two Cross-Sectional Studies in England From 2009 to 2014. J. Adolesc. Health 2015, 56, 502–507. [Google Scholar] [CrossRef]
- Cavallo, F.; Dalmasso, P.; Ottova-Jordan, V.; Brooks, F.; Mazur, J.; Valimaa, R.; Gobina, I.; Gaspar de Matos, M.; Raven-Sieberer, U. The Positive Health Focus Group Trends in Life Satisfaction in European and North-American Adolescents from 2002 to 2010 in over 30 Countries. Eur. J. Public Health 2015, 25, 80–82. [Google Scholar] [CrossRef] [PubMed]
- Hodačová, L.; Hlaváčková, E.; Sigmundová, D.; Kalman, M.; Kopčáková, J. Trends in Life Satisfaction and Self-Rated Health in Czech School-Aged Children: HBSC Study. Cent. Eur. J. Public Health 2017, 25, S51–S56. [Google Scholar] [CrossRef]
- Högberg, B.; Strandh, M.; Hagquist, C. Gender and Secular Trends in Adolescent Mental Health over 24 Years—The Role of School-Related Stress. Soc. Sci. Med. 2020, 250, 112890. [Google Scholar] [CrossRef]
- Bi, S.; Stevens, G.W.J.M.; Maes, M.; Boer, M.; Delaruelle, K.; Eriksson, C.; Brooks, F.M.; Tesler, R.; van der Schuur, W.A.; Finkenauer, C. Perceived Social Support from Different Sources and Adolescent Life Satisfaction Across 42 Countries/Regions: The Moderating Role of National-Level Generalized Trust. J. Youth Adolesc. 2021, 50, 1384–1409. [Google Scholar] [CrossRef] [PubMed]
- Levin, K.A.; Currie, C. Family Structure, Mother-child Communication, Father-child Communication, and Adolescent Life Satisfaction: A Cross-sectional Multilevel Analysis. Health Educ. 2010, 110, 152–168. [Google Scholar] [CrossRef]
- Moore, G.F.; Cox, R.; Evans, R.E.; Hallingberg, B.; Hawkins, J.; Littlecott, H.J.; Long, S.J.; Murphy, S. School, Peer and Family Relationships and Adolescent Substance Use, Subjective Wellbeing and Mental Health Symptoms in Wales: A Cross Sectional Study. Child Indic. Res. 2018, 11, 1951–1965. [Google Scholar] [CrossRef] [PubMed]
- Zozaya, N.; Vallejo, L. The Effect of the Economic Crisis on Adolescents’ Perceived Health and Risk Behaviors: A Multilevel Analysis. Int. J. Environ. Res. Public Health 2020, 17, 643. [Google Scholar] [CrossRef]
- Walsh, S.D.; Harel-Fisch, Y.; Fogel-Grinvald, H. Parents, Teachers and Peer Relations as Predictors of Risk Behaviors and Mental Well-Being among Immigrant and Israeli Born Adolescents. Soc. Sci. Med. 2010, 70, 976–984. [Google Scholar] [CrossRef]
- Kim, Y.; Hagquist, C. Trends in Adolescent Mental Health during Economic Upturns and Downturns: A Multilevel Analysis of Swedish Data 1988-2008. J. Epidemiol. Community Health 2018, 72, 101–108. [Google Scholar] [CrossRef] [PubMed]
- Weinberg, D.; Stevens, G.W.J.M.; Duinhof, E.L.; Finkenauer, C. Adolescent Socioeconomic Status and Mental Health Inequalities in the Netherlands, 2001–2017. Int. J. Environ. Res. Public Health 2019, 16, 3605. [Google Scholar] [CrossRef] [PubMed]
- Lazzeri, G.; Giacchi, M.V.; Dalmasso, P. The Methodology of the Italian HBSC 2010 Study (Health Behaviour in School-Aged Children). Ann. Ig. Med. Prev. E Comunità 2013, 25, 225–233. [Google Scholar] [CrossRef]
- Cavallo, F.; Lemma, P.; Dalmasso, P.; Vieno, A.; Lazzeri, G.; Galeone, D. Report Nazionale dati HBSC Italia 2014: 4° Rapporto sui dati HBSC Italia 2014; Stampatre s.r.l: Torino, Italy, 2016. [Google Scholar]
- Nardone, P.; Pierannunzio, D.; Ciardullo, S.; Lazzeri, G.; Cappello, N.; Spinelli, A. 2018 HBSC-Italia Group; the 2018 HBSC-Italia Group. Dietary Habits among Italian Adolescents and Their Relation to Socio-Demographic Characteristics. Ann. Dell'istituto Super Sanità 2020, 56, 504–513. [Google Scholar] [CrossRef]
- Cantril, H. Pattern of Human Concerns; Rutgers University Press: New Brunswick, NJ, USA, 1965. [Google Scholar]
- Levin, K.A.; Currie, C. Reliability and Validity of an Adapted Version of the Cantril Ladder for Use with Adolescent Samples. Soc. Indic. Res. 2014, 119, 1047–1063. [Google Scholar] [CrossRef]
- Mazur, J.; Szkultecka-Dębek, M.; Dzielska, A.; Drozd, M.; Małkowska-Szkutnik, A. What Does the Cantril Ladder Measure in Adolescence? Arch. Med. Sci. 2018, 1, 182–189. [Google Scholar] [CrossRef]
- Haugland, S.; Wold, B. Subjective Health Complaints in Adolescence—Reliability and Validity of Survey Methods. J. Adolesc. 2001, 24, 611–624. [Google Scholar] [CrossRef]
- Ravens-Sieberer, U.; Gosch, A.; Rajmil, L.; Erhart, M.; Bruil, J.; Power, M.; Duer, W.; Auquier, P.; Cloetta, B.; Czemy, L.; et al. The KIDSCREEN-52 Quality of Life Measure for Children and Adolescents: Psychometric Results from a Cross-Cultural Survey in 13 European Countries. Value Health 2008, 11, 645–658. [Google Scholar] [CrossRef]
- Hagquist, C.; Välimaa, R.; Simonsen, N.; Suominen, S. Differential Item Functioning in Trend Analyses of Adolescent Mental Health—Illustrative Examples Using HBSC-Data from Finland. Child Indic. Res. 2017, 10, 673–691. [Google Scholar] [CrossRef]
- Haugland, S. Subjective Health Complaints in Adolescence: A Cross-National Comparison of Prevalence and Dimensionality. Eur. J. Public Health 2001, 11, 4–10. [Google Scholar] [CrossRef] [PubMed]
- Istituto Nazionale di Statistica—ISTAT. Annuario Statistico Italiano 2019; ISTAT: Roma, Italy, 2019. [Google Scholar]
- Currie, C.; Molcho, M.; Boyce, W.; Holstein, B.; Torsheim, T.; Richter, M. Researching Health Inequalities in Adolescents: The Development of the Health Behaviour in School-Aged Children (HBSC) Family Affluence Scale. Soc. Sci. Med. 2008, 66, 1429–1436. [Google Scholar] [CrossRef]
- Torsheim, T.; Wold, B.; Samdal, O. The Teacher and Classmate Support Scale: Factor Structure, Test-Retest Reliability and Validity in Samples of 13-and 15-Year-Old Adolescents. Sch. Psychol. Int. 2000, 21, 195–212. [Google Scholar] [CrossRef]
- Growing up Unequal: Gender and Socioeconomic Differences in Young People’s Health and Well-Being: Health Behaviour in School-Aged Children (HBSC) Study: International Report from the 2013/2014 Survey; Health policy for children and adolescents; Inchley, J., Currie, D., Young, T., Samdal, O., Torsheim, T., Augustson, L., Mathison, F., Aleman-Diaz, A.Y., Molcho, M., Weber, M.W., et al., Eds.; World Health Organization Regional Office for Europe: Copenhagen, Denmark, 2016; ISBN 978-92-890-5136-1. [Google Scholar]
- Le Poire, B.A. Family Communication Nurturing and Control in a Changing World; SAGE: Thousand Oaks, CA, USA; London, UK, 2006; ISBN 978-1-4522-3304-8. [Google Scholar]
- Inchley, J.; Currie, D.; Cosma, A.; Samdal, O. (Eds.) Health Behaviour in School-Aged Children (HBSC) Study Protocol: Background, Methodology and Mandatory Items for the 2017/18 Survey; CAHRU: St Andrews, UK, 2018. [Google Scholar]
- Bjarnason, T.; Bendtsen, P.; Arnarsson, A.M.; Borup, I.; Iannotti, R.J.; Löfstedt, P.; Haapasalo, I.; Niclasen, B. Life Satisfaction Among Children in Different Family Structures: A Comparative Study of 36 Western Societies: Life Satisfaction and Family Structures. Child. Soc. 2012, 26, 51–62. [Google Scholar] [CrossRef]
- Hetland, J.; Torsheim, T.; Aarø, L.E. Subjective Health Complaints in Adolescence: Dimensional Structure and Variation across Gender and Age. Scand. J. Public Health 2002, 30, 223–230. [Google Scholar] [CrossRef] [PubMed][Green Version]
- Greenspoon, P.J.; Saklofske, D.H. Toward an Integration of Subjective Well-Being and Psychopathology. Soc. Indic. Res. 2001, 54, 81–108. [Google Scholar] [CrossRef]
- Westerhof, G.J.; Keyes, C.L.M. Mental Illness and Mental Health: The Two Continua Model Across the Lifespan. J. Adult Dev. 2010, 17, 110–119. [Google Scholar] [CrossRef] [PubMed]
- Keyes, C.L.M. Mental Health as a Complete State: How the Salutogenic Perspective Completes the Picture. In Bridging Occupational, Organizational and Public Health; Springer: Dordrecht, The Netherlands, 2014; pp. 179–192. ISBN 978-94-007-5639-7. [Google Scholar]
- Wang, H.; Lin, S.L.; Leung, G.M.; Schooling, C.M. Age at Onset of Puberty and Adolescent Depression: “Children of 1997” Birth Cohort. Pediatrics 2016, 137, e20153231. [Google Scholar] [CrossRef] [PubMed]
- Galvao, T.F.; Silva, M.T.; Zimmermann, I.R.; Souza, K.M.; Martins, S.S.; Pereira, M.G. Pubertal Timing in Girls and Depression: A Systematic Review. J. Affect. Disord. 2014, 155, 13–19. [Google Scholar] [CrossRef] [PubMed]
- Bor, W.; Dean, A.J.; Najman, J.; Hayatbakhsh, R. Are Child and Adolescent Mental Health Problems Increasing in the 21st Century? A Systematic Review. Aust. N. Z. J. Psychiatry 2014, 48, 606–616. [Google Scholar] [CrossRef] [PubMed]
- Kramer, M.D.; Krueger, R.F.; Hicks, B.M. The Role of Internalizing and Externalizing Liability Factors in Accounting for Gender Differences in the Prevalence of Common Psychopathological Syndromes. Psychol. Med. 2008, 38, 51–61. [Google Scholar] [CrossRef]
- Högberg, B.; Lindgren, J.; Johansson, K.; Strandh, M.; Petersen, S. Consequences of School Grading Systems on Adolescent Health: Evidence from a Swedish School Reform. J. Educ. Policy 2021, 36, 84–106. [Google Scholar] [CrossRef]
- West, P.; Sweeting, H. Fifteen, Female and Stressed: Changing Patterns of Psychological Distress over Time: Increased Psychological Distress among Females over Time. J. Child Psychol. Psychiatry 2003, 44, 399–411. [Google Scholar] [CrossRef] [PubMed]
- Wiklund, M.; Malmgren-Olsson, E.-B.; Öhman, A.; Bergström, E.; Fjellman-Wiklund, A. Subjective Health Complaints in Older Adolescents Are Related to Perceived Stress, Anxiety and Gender—A Cross-Sectional School Study in Northern Sweden. BMC Public Health 2012, 12, 993. [Google Scholar] [CrossRef] [PubMed]
- Levin, K.A.; Dallago, L.; Currie, C. The Association Between Adolescent Life Satisfaction, Family Structure, Family Affluence and Gender Differences in Parent–Child Communication. Soc. Indic. Res. 2012, 106, 287–305. [Google Scholar] [CrossRef]
- Elgar, F.J.; Craig, W.; Trites, S.J. Family Dinners, Communication, and Mental Health in Canadian Adolescents. J. Adolesc. Health 2013, 52, 433–438. [Google Scholar] [CrossRef]
- Matos, M.G.; Dadds, M.R.; Barrett, P.M. Family-Related School Issues and the Mental Health of Adolescents: Post Hoc Analyses of the Portuguese National Health Behaviour in School-Aged Children Survey Data 1. J. Fam. Stud. 2006, 12, 261–275. [Google Scholar] [CrossRef]
- Freeman, J.G.; Samdal, O.; Băban, A.; Bancila, D. The Relationship Between School Perceptions and Psychosomatic Complaints: Cross-Country Differences Across Canada, Norway, and Romania. Sch. Ment. Health 2012, 4, 95–104. [Google Scholar] [CrossRef]
- Torsheim, T.; Wold, B. School-Related Stress, Support, and Subjective Health Complaints among Early Adolescents: A Multilevel Approach. J. Adolesc. 2001, 24, 701–713. [Google Scholar] [CrossRef]
- Moreno, C.; Sánchez-Queija, I.; Muñoz-Tinoco, V.; de Matos, M.G.; Dallago, L.; Bogt, T.T.; Camacho, I.; Rivera, F. The HBSC Peer Culture Focus Group Cross-National Associations between Parent and Peer Communication and Psychological Complaints. Int. J. Public Health 2009, 54, 235–242. [Google Scholar] [CrossRef] [PubMed]
- Ottova-Jordan, V.; Smith, O.R.F.; Augustine, L.; Gobina, I.; Rathmann, K.; Torsheim, T.; Mazur, J.; Valimaa, R.; Cavallo, F.; Jericek Klanscek, H.; et al. Trends in Health Complaints from 2002 to 2010 in 34 Countries and Their Association with Health Behaviours and Social Context Factors at Individual and Macro-Level. Eur. J. Public Health 2015, 25, 83–89. [Google Scholar] [CrossRef]
- Marino, C.; Lenzi, M.; Canale, N.; Pierannunzio, D.; Dalmasso, P.; Borraccino, A.; Cappello, N.; Lemma, P.; Vieno, A. Problematic Social Media Use: Associations with Health Complaints among Adolescents. Ann. Dell'istituto Super. Di Sanità 2020, 56, 514–521. [Google Scholar] [CrossRef]
- Nelson, M.C.; Neumark-Stzainer, D.; Hannan, P.J.; Sirard, J.R.; Story, M. Longitudinal and Secular Trends in Physical Activity and Sedentary Behavior during Adolescence. Pediatrics 2006, 118, e1627–e1634. [Google Scholar] [CrossRef]
- Torsheim, T.; Eriksson, L.; Schnohr, C.W.; Hansen, F.; Bjarnason, T.; Välimaa, R. Screen-Based Activities and Physical Complaints among Adolescents from the Nordic Countries. BMC Public Health 2010, 10, 324. [Google Scholar] [CrossRef] [PubMed]
- Kelly, Y.; Zilanawala, A.; Booker, C.; Sacker, A. Social Media Use and Adolescent Mental Health: Findings From the UK Millennium Cohort Study. EClinicalMedicine 2018, 6, 59–68. [Google Scholar] [CrossRef]
- Lin, L.Y.; Sidani, J.E.; Shensa, A.; Radovic, A.; Miller, E.; Colditz, J.B.; Hoffman, B.L.; Giles, L.M.; Primack, B.A. Association Between Social Media Use and Depression Among U.S. Young Adults. Depress. Anxiety 2016, 33, 323–331. [Google Scholar] [CrossRef]
- Nesi, J.; Prinstein, M.J. Using Social Media for Social Comparison and Feedback-Seeking: Gender and Popularity Moderate Associations with Depressive Symptoms. J. Abnorm. Child Psychol. 2015, 43, 1427–1438. [Google Scholar] [CrossRef] [PubMed]
- Paakkari, L.; Tynjälä, J.; Lahti, H.; Ojala, K.; Lyyra, N. Problematic Social Media Use and Health among Adolescents. Int. J. Environ. Res. Public Health 2021, 18, 1885. [Google Scholar] [CrossRef] [PubMed]
- Twenge, J.M.; Joiner, T.E.; Rogers, M.L.; Martin, G.N. Increases in Depressive Symptoms, Suicide-Related Outcomes, and Suicide Rates Among U.S. Adolescents After 2010 and Links to Increased New Media Screen Time. Clin. Psychol. Sci. 2018, 6, 3–17. [Google Scholar] [CrossRef]
- Ghekiere, A.; Van Cauwenberg, J.; Vandendriessche, A.; Inchley, J.; Gaspar de Matos, M.; Borraccino, A.; Gobina, I.; Tynjälä, J.; Deforche, B.; De Clercq, B. Trends in Sleeping Difficulties among European Adolescents: Are These Associated with Physical Inactivity and Excessive Screen Time? Int. J. Public Health 2019, 64, 487–498. [Google Scholar] [CrossRef] [PubMed]


| 2010 (n = 58,928) | 2014 (n = 47,799) | 2018 (n = 58,976) | Overall (n = 165,703) | |
|---|---|---|---|---|
| Males | 50.1 | 50.5 | 50.7 | 50.4 |
| Age | ||||
| 11 years | 35.7 | 36.4 | 36.6 | 36.2 |
| 13 years | 34.5 | 35.2 | 36.0 | 35.3 |
| 15 years | 29.8 | 28.4 | 27.5 | 28.5 |
| FAS | ||||
| Low | 13.3 | 24.7 | 22.3 | 20.0 |
| Medium | 43.9 | 51.7 | 51.0 | 48.9 |
| High | 42.9 | 23.6 | 26.7 | 31.1 |
| Geographic area | ||||
| Northern | 34.1 | 41.4 | 45.6 | 40.5 |
| Centre | 17.5 | 16.4 | 17.6 | 17.2 |
| Southern | 48.4 | 42.2 | 36.8 | 42.3 |
| Immigration background | 10.6 | 14.1 | 13.2 | 12.6 |
| High school work pressure | 41.8 | 51.3 | 54.9 | 49.4 |
| Good classmate support | 81.0 | 74.9 | 75.7 | 77.2 |
| Nontraditional family structure | 14.7 | 15.7 | 18.0 | 16.2 |
| Good mother support | 81.4 | 81.2 | 80.0 | 80.8 |
| Good father support | 61.1 | 66.1 | 63.9 | 63.7 |
| LS | 34.4 | 28.7 | 30.9 | 31.4 |
| HC | 47.3 | 47.5 | 52.2 | 49.1 |
| PSY-HC | 33.2 | 36.4 | 41.7 | 37.3 |
| SOM-HC | 19.1 | 19.3 | 20.7 | 19.7 |
| Health complaints (more than once a week) | ||||
| Headache | 26.1 | 24.4 | 24.7 | 25.1 |
| Stomachache | 15.3 | 14.2 | 16.0 | 15.2 |
| Backache | 14.0 | 16.1 | 17.1 | 15.7 |
| Dizziness | 13.8 | 15.5 | 16.4 | 15.2 |
| Feeling low | 31.7 | 34.1 | 34.0 | 33.3 |
| Irritability | 27.1 | 30.2 | 35.1 | 30.9 |
| Feeling nervous | 34.5 | 36.1 | 42.6 | 37.9 |
| Sleeping difficulty | 16.5 | 19.5 | 25.3 | 20.6 |
| Males | Females | |||||
|---|---|---|---|---|---|---|
| 11 years | 13 years | 15 years | 11 years | 13 years | 15 years | |
| LS | ||||||
| Overall trend from 2010 to 2018 (per year) | 0.99 (0.98–1.00) | 1.00 (0.99–1.01) | 0.98 (0.97–1.00) | 0.99 (0.97–1.00) | 1.00 (0.99–1.02) | 1.00 (0.98–1.02) |
| Survey | ||||||
| 2014 vs. 2010 | 0.84 (0.74–0.94) | 0.85 (0.76–0.95) | 0.75 (0.65–0.88) | 0.81 (0.72–0.91) | 0.79 (0.69–0.91) | 0.80 (0.67–0.95) |
| 2018 vs. 2010 | 0.92 (0.83–1.02) | 0.99 (0.89–1.09) | 0.97 (0.77–0.99) | 0.89 (0.79–1.00) | 1.01 (0.89–1.14) | 0.97 (0.83–1.13) |
| HC | ||||||
| Overall trend from 2010 to 2018 (per year) | 0.99 (0.98–1.01) | 1.02 (1.00–1.03) | 1.02 (1.01–1.04) | 0.99 (0.98–1.01) | 1.03 (1.02–1.04) | 1.04 (1.02–1.05) |
| Survey | ||||||
| 2014 vs. 2010 | 0.70 (0.63–0.78) | 0.90 (0.79–1.01) | 1.04 (0.93–1.17) | 0.83 (0.72–0.94) | 1.11 (0.99–1.24) | 1.17 (1.02–1.33) |
| 2018 vs. 2010 | 0.92 (0.83–1.02) | 1.13 (1.01–1.26) | 1.20 (1.09–1.32) | 0.93 (0.83–1.05) | 1.26 (1.14–1.38) | 1.33 (1.19–1.49) |
| SOM-HC | ||||||
| Overall trend from 2010 to 2018 (per year) | 0.98 (0.96–1.01) | 1.01 (0.99–1.03) | 1.01 (0.98–1.04) | 0.98 (0.97–1.00) | 1.02 (1.01–1.04) | 1.02 (1.00–1.04) |
| Survey | ||||||
| 2014 vs. 2010 | 0.67 (0.57–0.78) | 0.88 (0.75–1.03) | 0.85 (0.66–1.10) | 0.93 (0.82–1.05) | 1.17 (1.04–1.31) | 1.15 (0.98–1.36) |
| 2018 vs. 2010 | 0.86 (0.74–0.99) | 1.04 (0.91–1.19) | 1.07 (0.85–1.33) | 0.86 (0.76–0.96) | 1.20 (1.09–1.33) | 1.20 (1.03–1.39) |
| PSY-HC | ||||||
| Overall trend from 2010 to 2018 (per year) | 1.02 (1.00–1.03) | 1.03 (1.02–1.05) | 1.04 (1.02–1.05) | 1.03 (1.01–1.05) | 1.05 (1.04–1.07) | 1.06 (1.05–1.07) |
| Survey | ||||||
| 2014 vs. 2010 | 0.85 (0.76–0.95) | 0.94 (0.83–1.07) | 1.08 (0.95–1.22) | 0.96 (0.83–1.11) | 1.24 (1.10–1.39) | 1.40 (1.25–1.57) |
| 2018 vs. 2010 | 1.13 (1.02–1.25) | 1.26 (1.13–1.41) | 1.33 (1.20–1.48) | 1.26 (1.11–1.44) | 1.48 (1.32–1.65) | 1.56 (1.42–1.72) |
Publisher’s Note: MDPI stays neutral with regard to jurisdictional claims in published maps and institutional affiliations. |
© 2022 by the authors. Licensee MDPI, Basel, Switzerland. This article is an open access article distributed under the terms and conditions of the Creative Commons Attribution (CC BY) license (https://creativecommons.org/licenses/by/4.0/).
Share and Cite
Bersia, M.; Berchialla, P.; Charrier, L.; Lemma, P.; Borraccino, A.; Nardone, P.; Pierannunzio, D.; Ciardullo, S.; Comoretto, R.I.; Dalmasso, P. Mental Well-Being: 2010–2018 Trends among Italian Adolescents. Int. J. Environ. Res. Public Health 2022, 19, 863. https://doi.org/10.3390/ijerph19020863
Bersia M, Berchialla P, Charrier L, Lemma P, Borraccino A, Nardone P, Pierannunzio D, Ciardullo S, Comoretto RI, Dalmasso P. Mental Well-Being: 2010–2018 Trends among Italian Adolescents. International Journal of Environmental Research and Public Health. 2022; 19(2):863. https://doi.org/10.3390/ijerph19020863
Chicago/Turabian StyleBersia, Michela, Paola Berchialla, Lorena Charrier, Patrizia Lemma, Alberto Borraccino, Paola Nardone, Daniela Pierannunzio, Silvia Ciardullo, Rosanna Irene Comoretto, and Paola Dalmasso. 2022. "Mental Well-Being: 2010–2018 Trends among Italian Adolescents" International Journal of Environmental Research and Public Health 19, no. 2: 863. https://doi.org/10.3390/ijerph19020863
APA StyleBersia, M., Berchialla, P., Charrier, L., Lemma, P., Borraccino, A., Nardone, P., Pierannunzio, D., Ciardullo, S., Comoretto, R. I., & Dalmasso, P. (2022). Mental Well-Being: 2010–2018 Trends among Italian Adolescents. International Journal of Environmental Research and Public Health, 19(2), 863. https://doi.org/10.3390/ijerph19020863