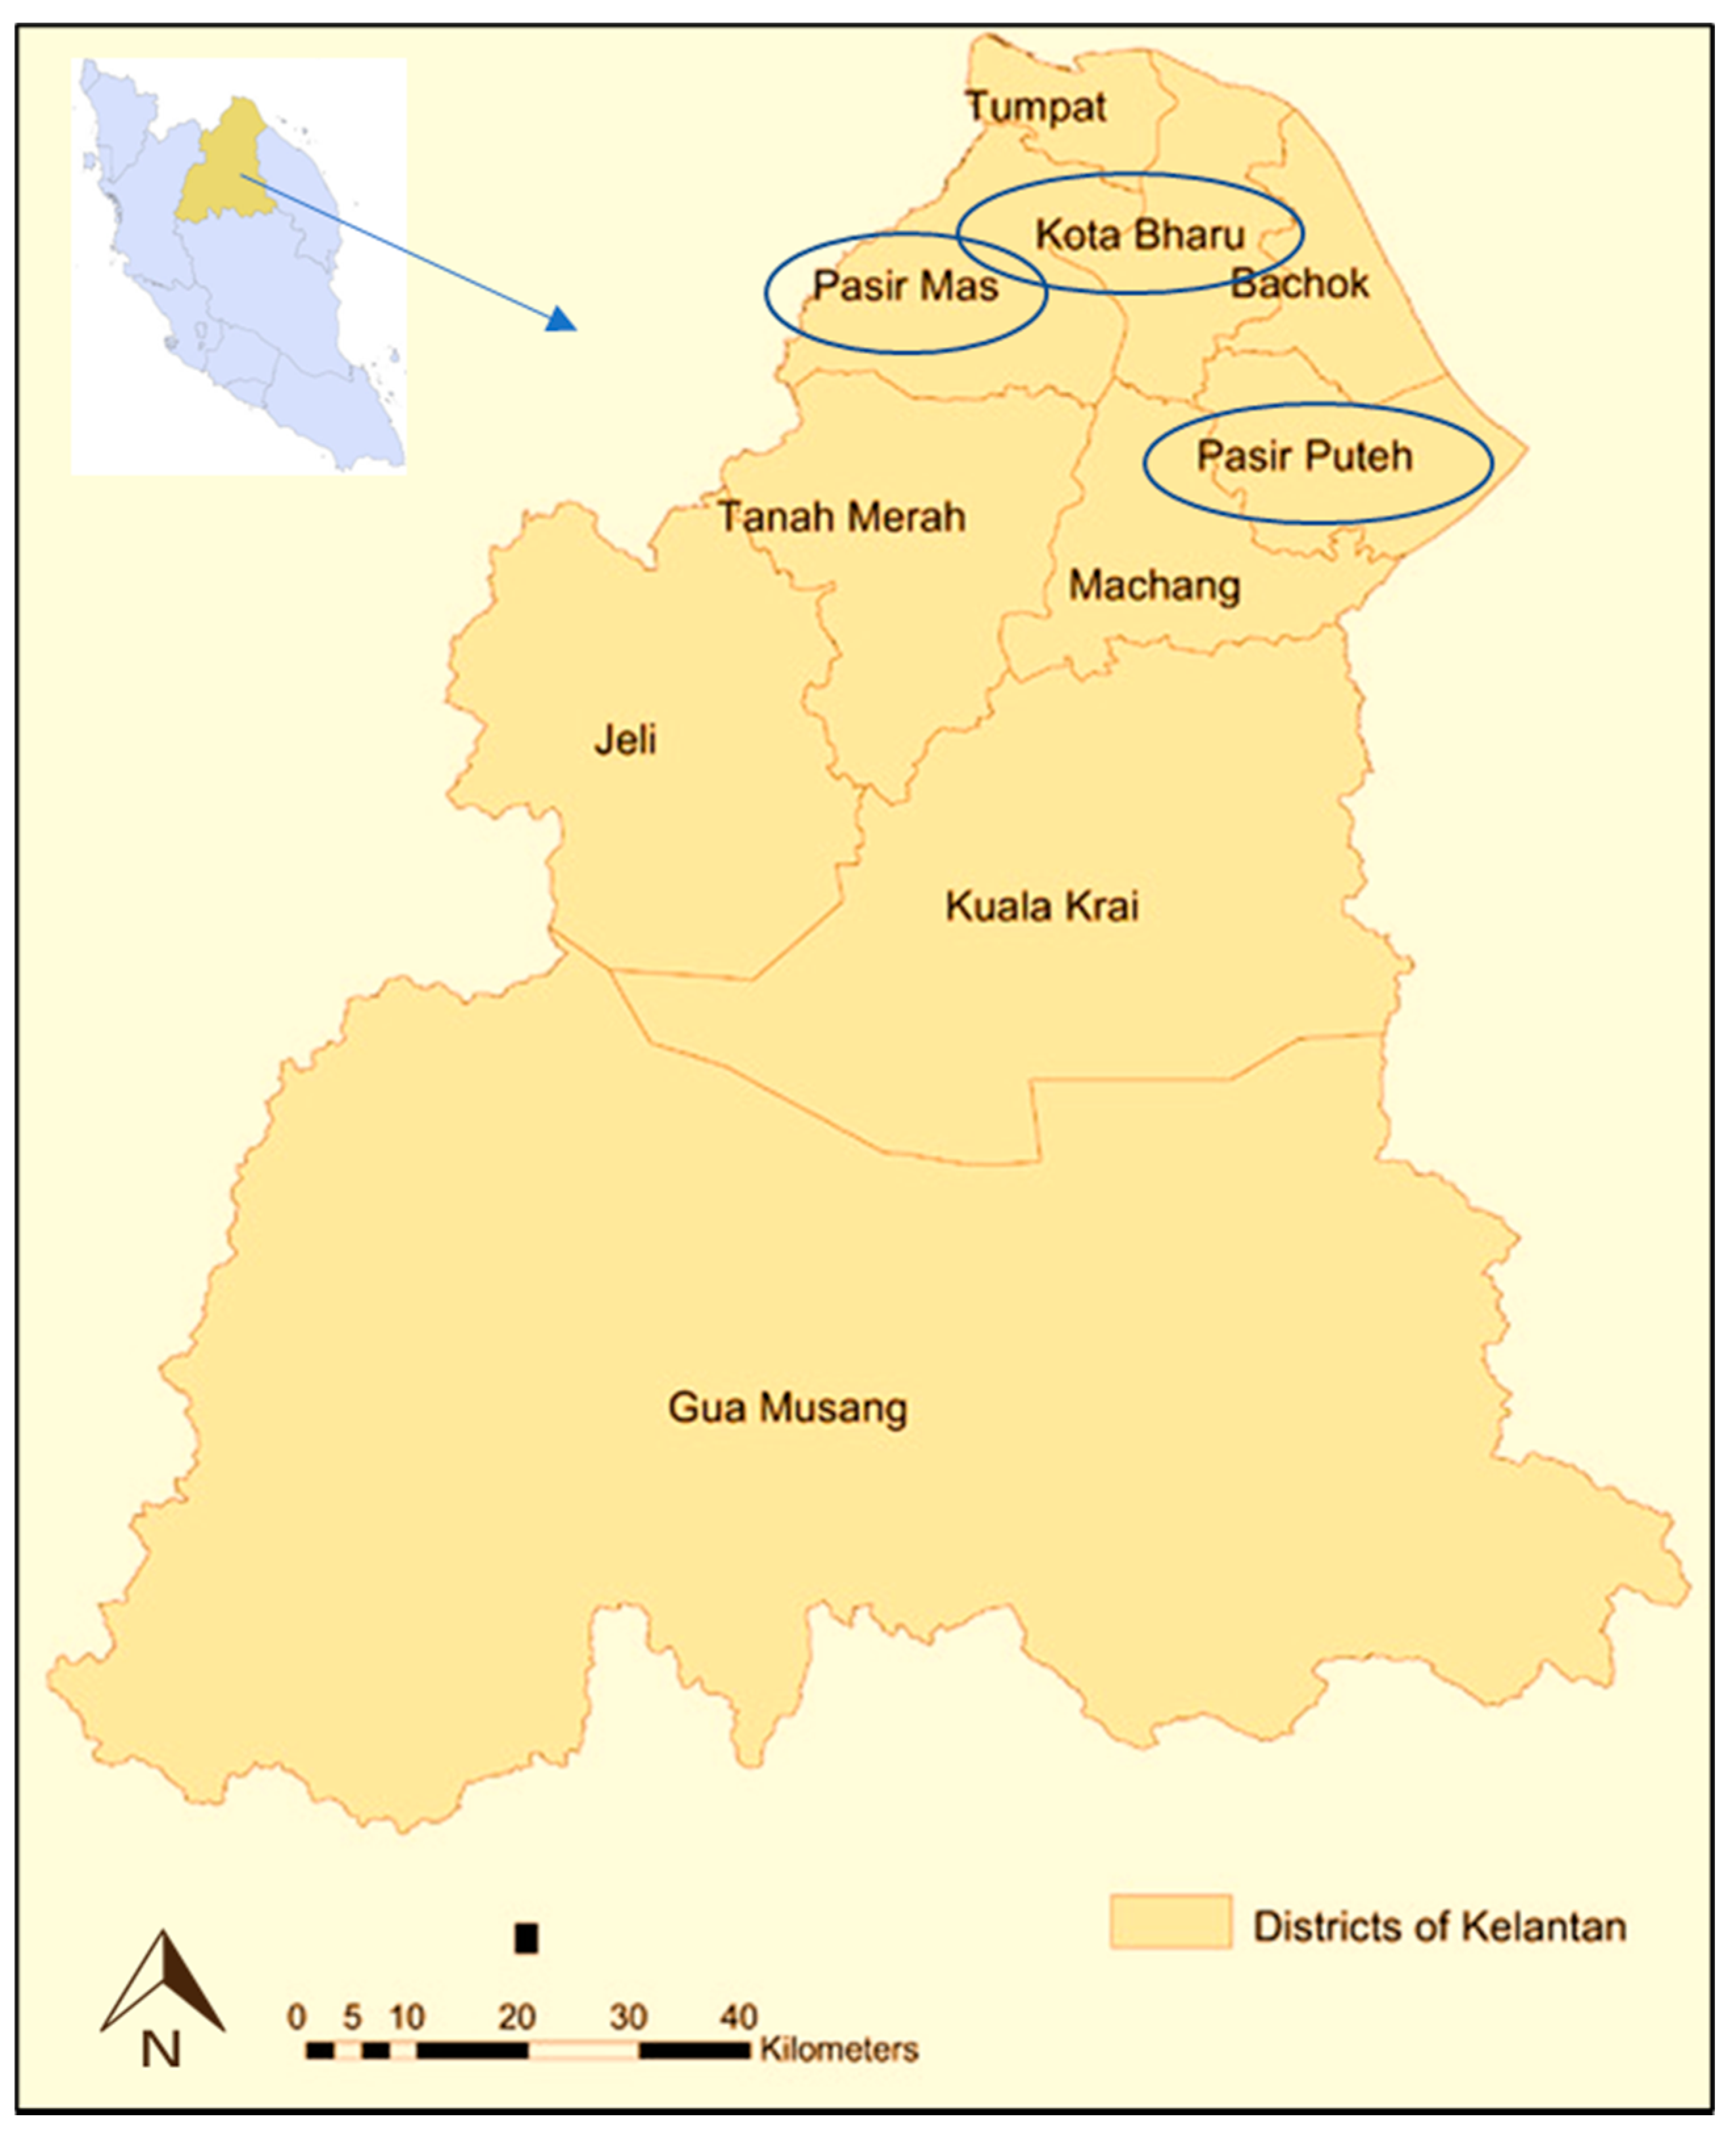
Figure 1.
Map showing the sampling areas at Kelantan, Malaysia Eastern region.
Figure 1.
Map showing the sampling areas at Kelantan, Malaysia Eastern region.
Figure 2.
Enrichment factor (EF) of the heavy metals in the different sampling sites. KBP1: Kota Bharu Plot 1, KBP2: Kota Bharu Plot 2, KBP3: Kota Bharu Plot 3, PMP1: Pasir Mas Plot 1, PMP2: Pasir Mas Plot 2, PMP3: Pasir Mas Plot 3, PPP1: Pasir Puteh Plot 1, PPP2: Pasir Puteh Plot 2, and PPP3: Pasir Puteh Plot 3.
Figure 3.
PCA score and loading plots showing the clustering pattern of different sampling sites based on the heavy metal concentration in paddy soil and paddy plant parts. (A,B) Score and loading plots of arsenic concentration, (C,D) cadmium concentration, (E,F) lead concentration, (G,H) copper concentration and (I,J) chromium concentration in different sampling sites.
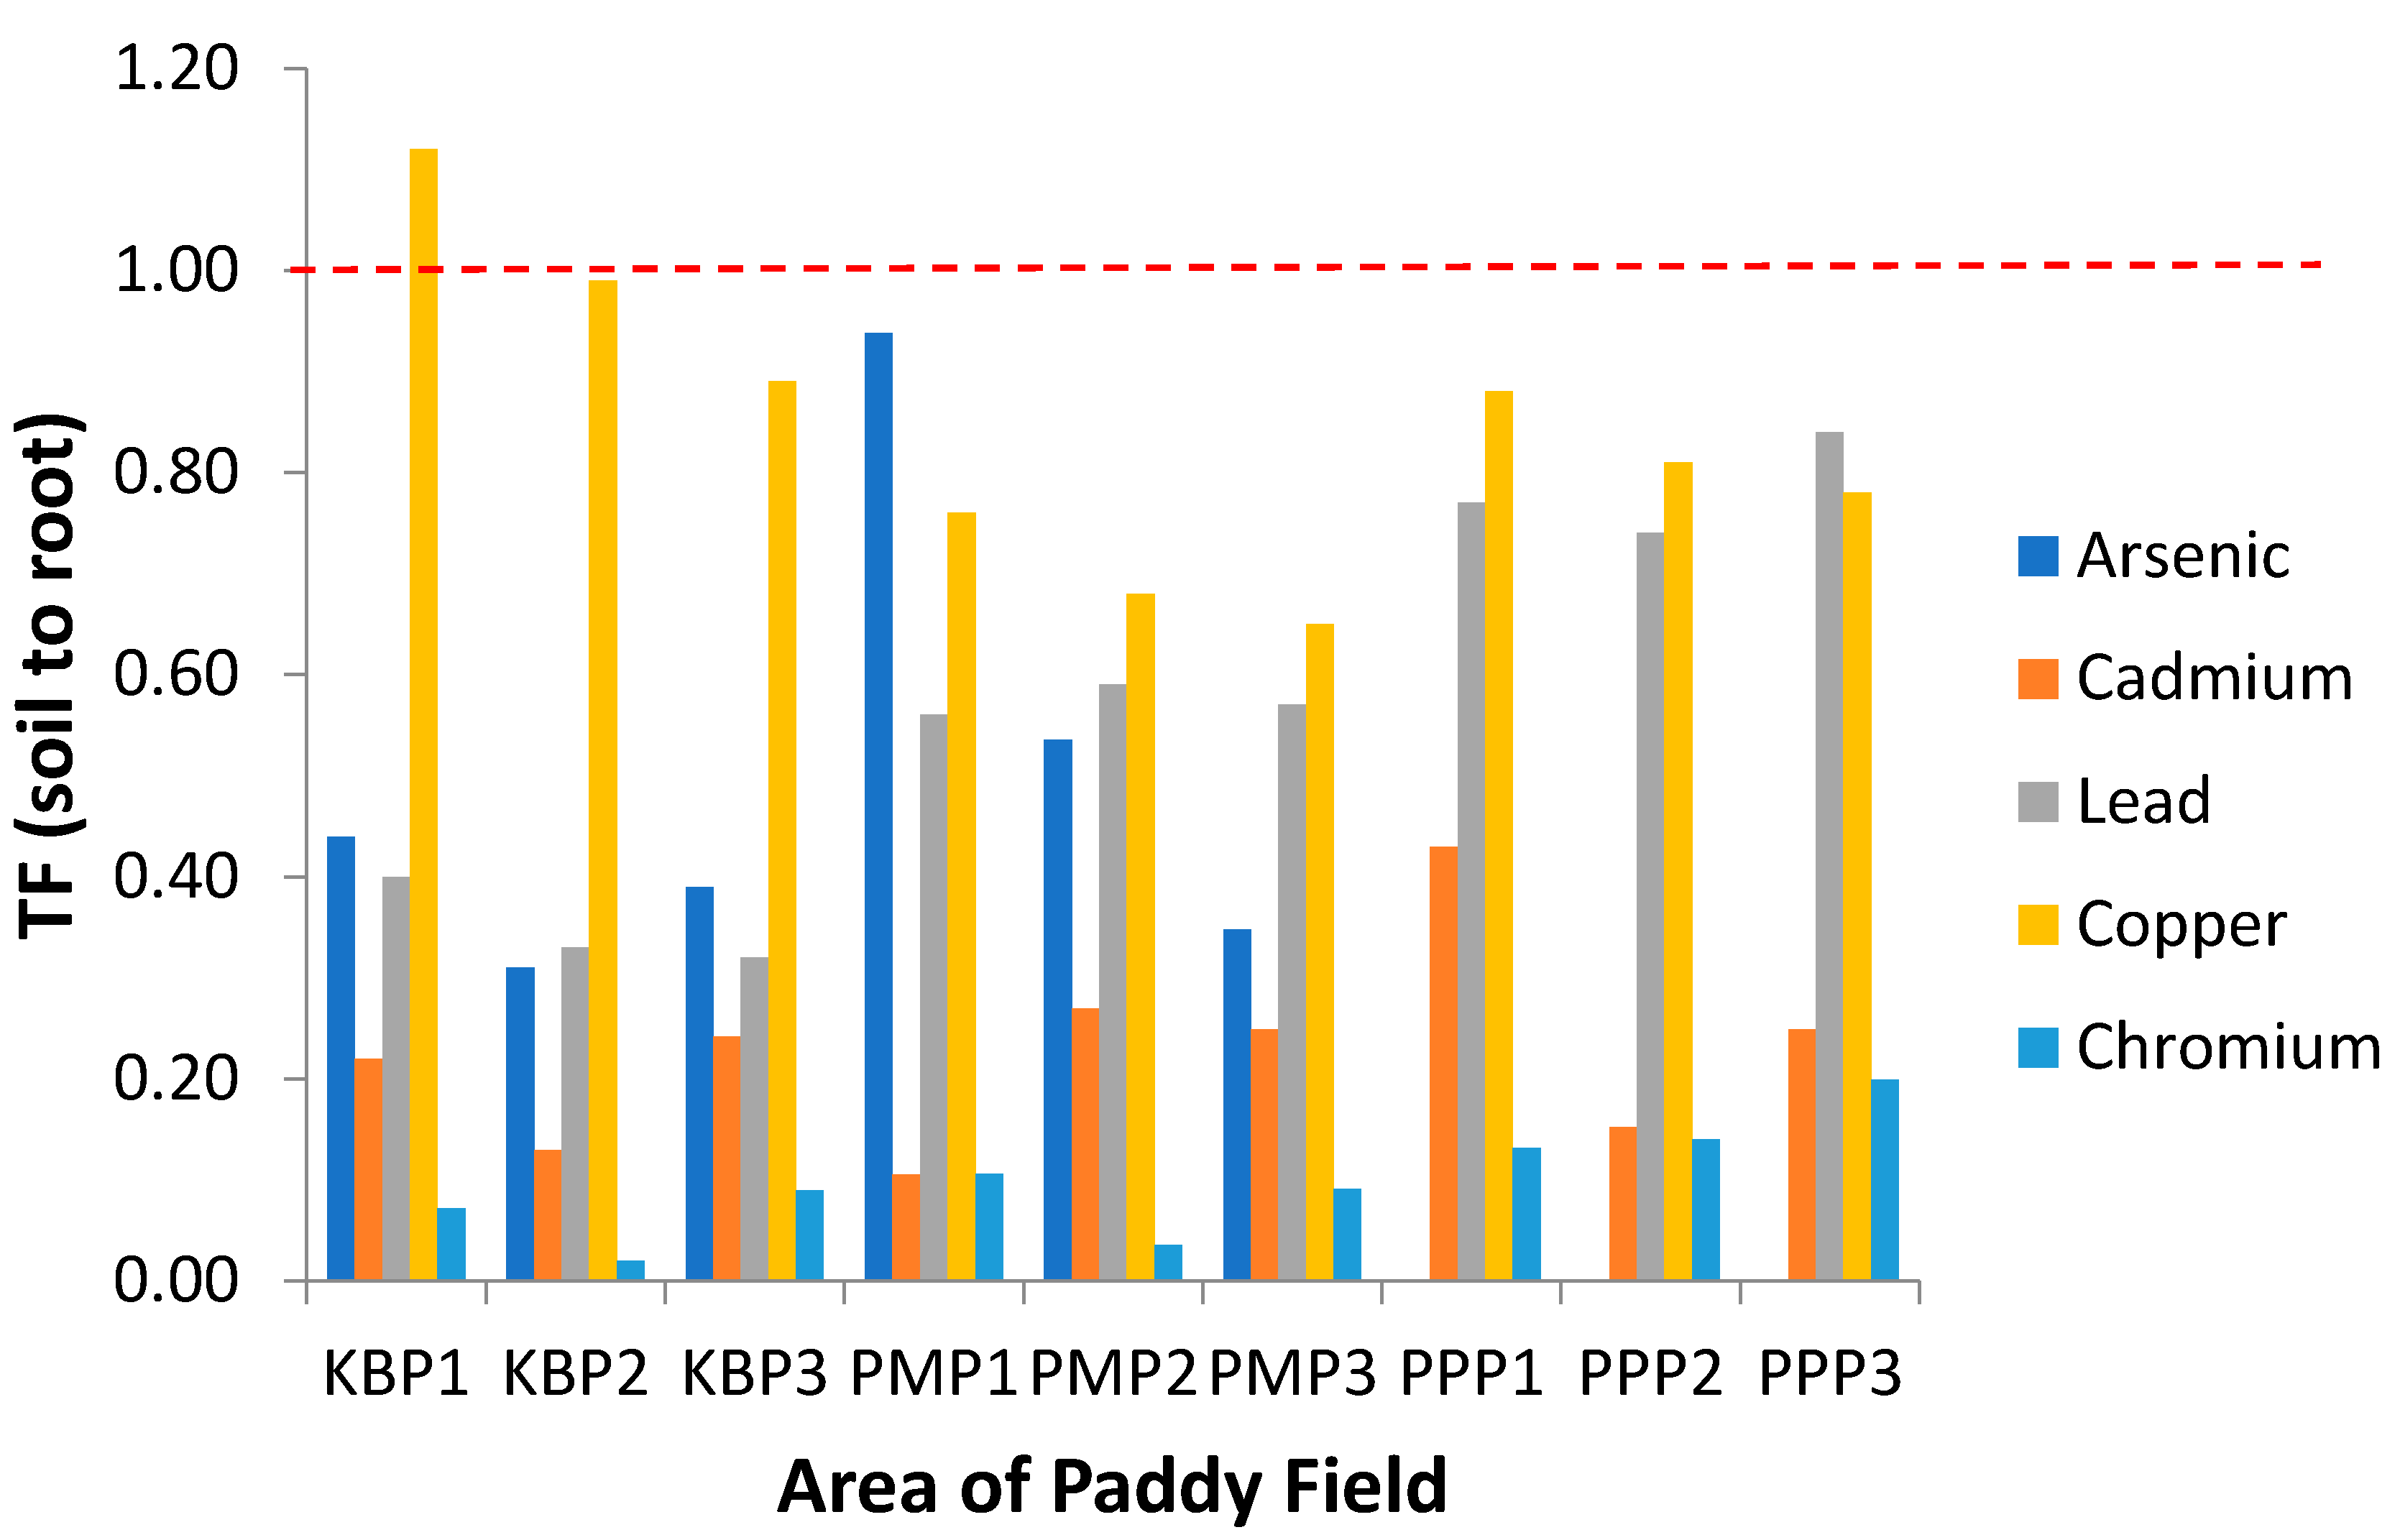
Figure 4.
Translocation factor of the heavy metals from soil to root (TFSoil) at different sampling sites. KBP1: Kota Bharu Plot 1, KBP2: Kota Bharu Plot 2, KBP3: Kota Bharu Plot 3, PMP1: Pasir Mas Plot 1, PMP2: Pasir Mas Plot 2, PMP3: Pasir Mas Plot 3, PPP1: Pasir Puteh Plot 1, PPP2: Pasir Puteh Plot 2, and PPP3: Pasir Puteh Plot 3.
Figure 5.
Translocation factor of the heavy metals from root to stem (TFRoot) at different sampling sites. KBP1: Kota Bharu Plot 1, KBP2: Kota Bharu Plot 2, KBP3: Kota Bharu Plot 3, PMP1: Pasir Mas Plot 1, PMP2: Pasir Mas Plot 2, PMP3: Pasir Mas Plot 3, PPP1: Pasir Puteh Plot 1, PPP2: Pasir Puteh Plot 2, and PPP3: Pasir Puteh Plot 3.
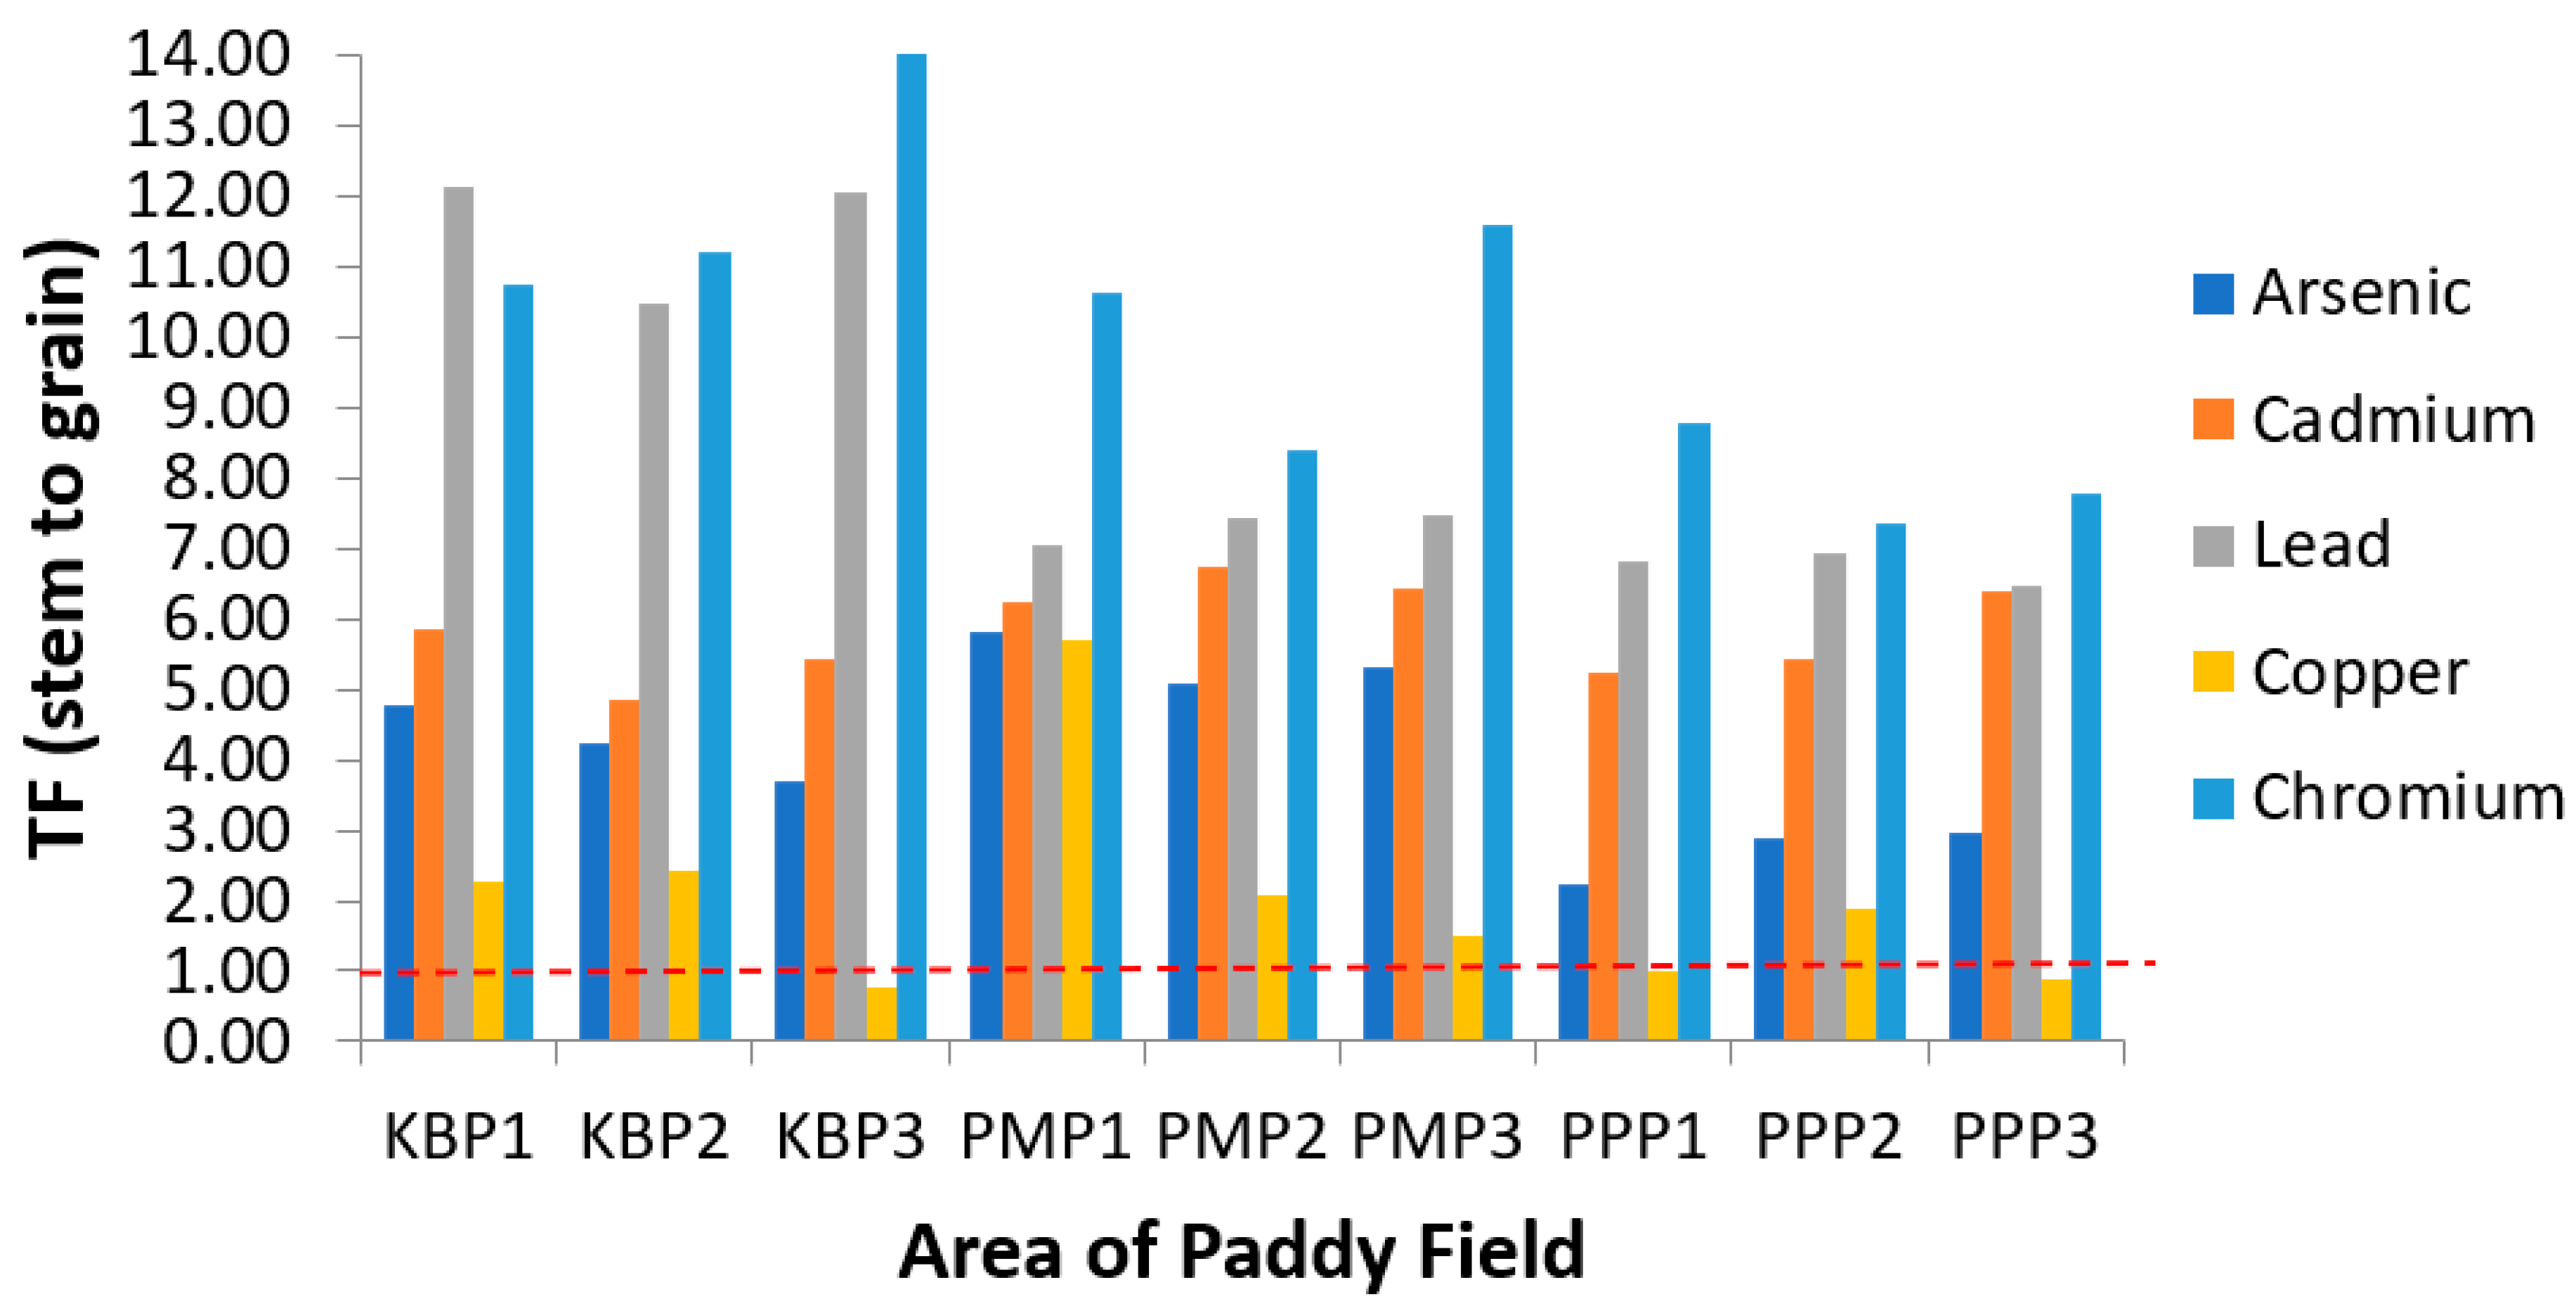
Figure 6.
Translocation factor of the heavy metals from stem to grain (TFStem) at different sampling sites. KBP1: Kota Bharu Plot 1, KBP2: Kota Bharu Plot 2, KBP3: Kota Bharu Plot 3, PMP1: Pasir Mas Plot 1, PMP2: Pasir Mas Plot 2, PMP3: Pasir Mas Plot 3, PPP1: Pasir Puteh Plot 1, PPP2: Pasir Puteh Plot 2, and PPP3: Pasir Puteh Plot 3.
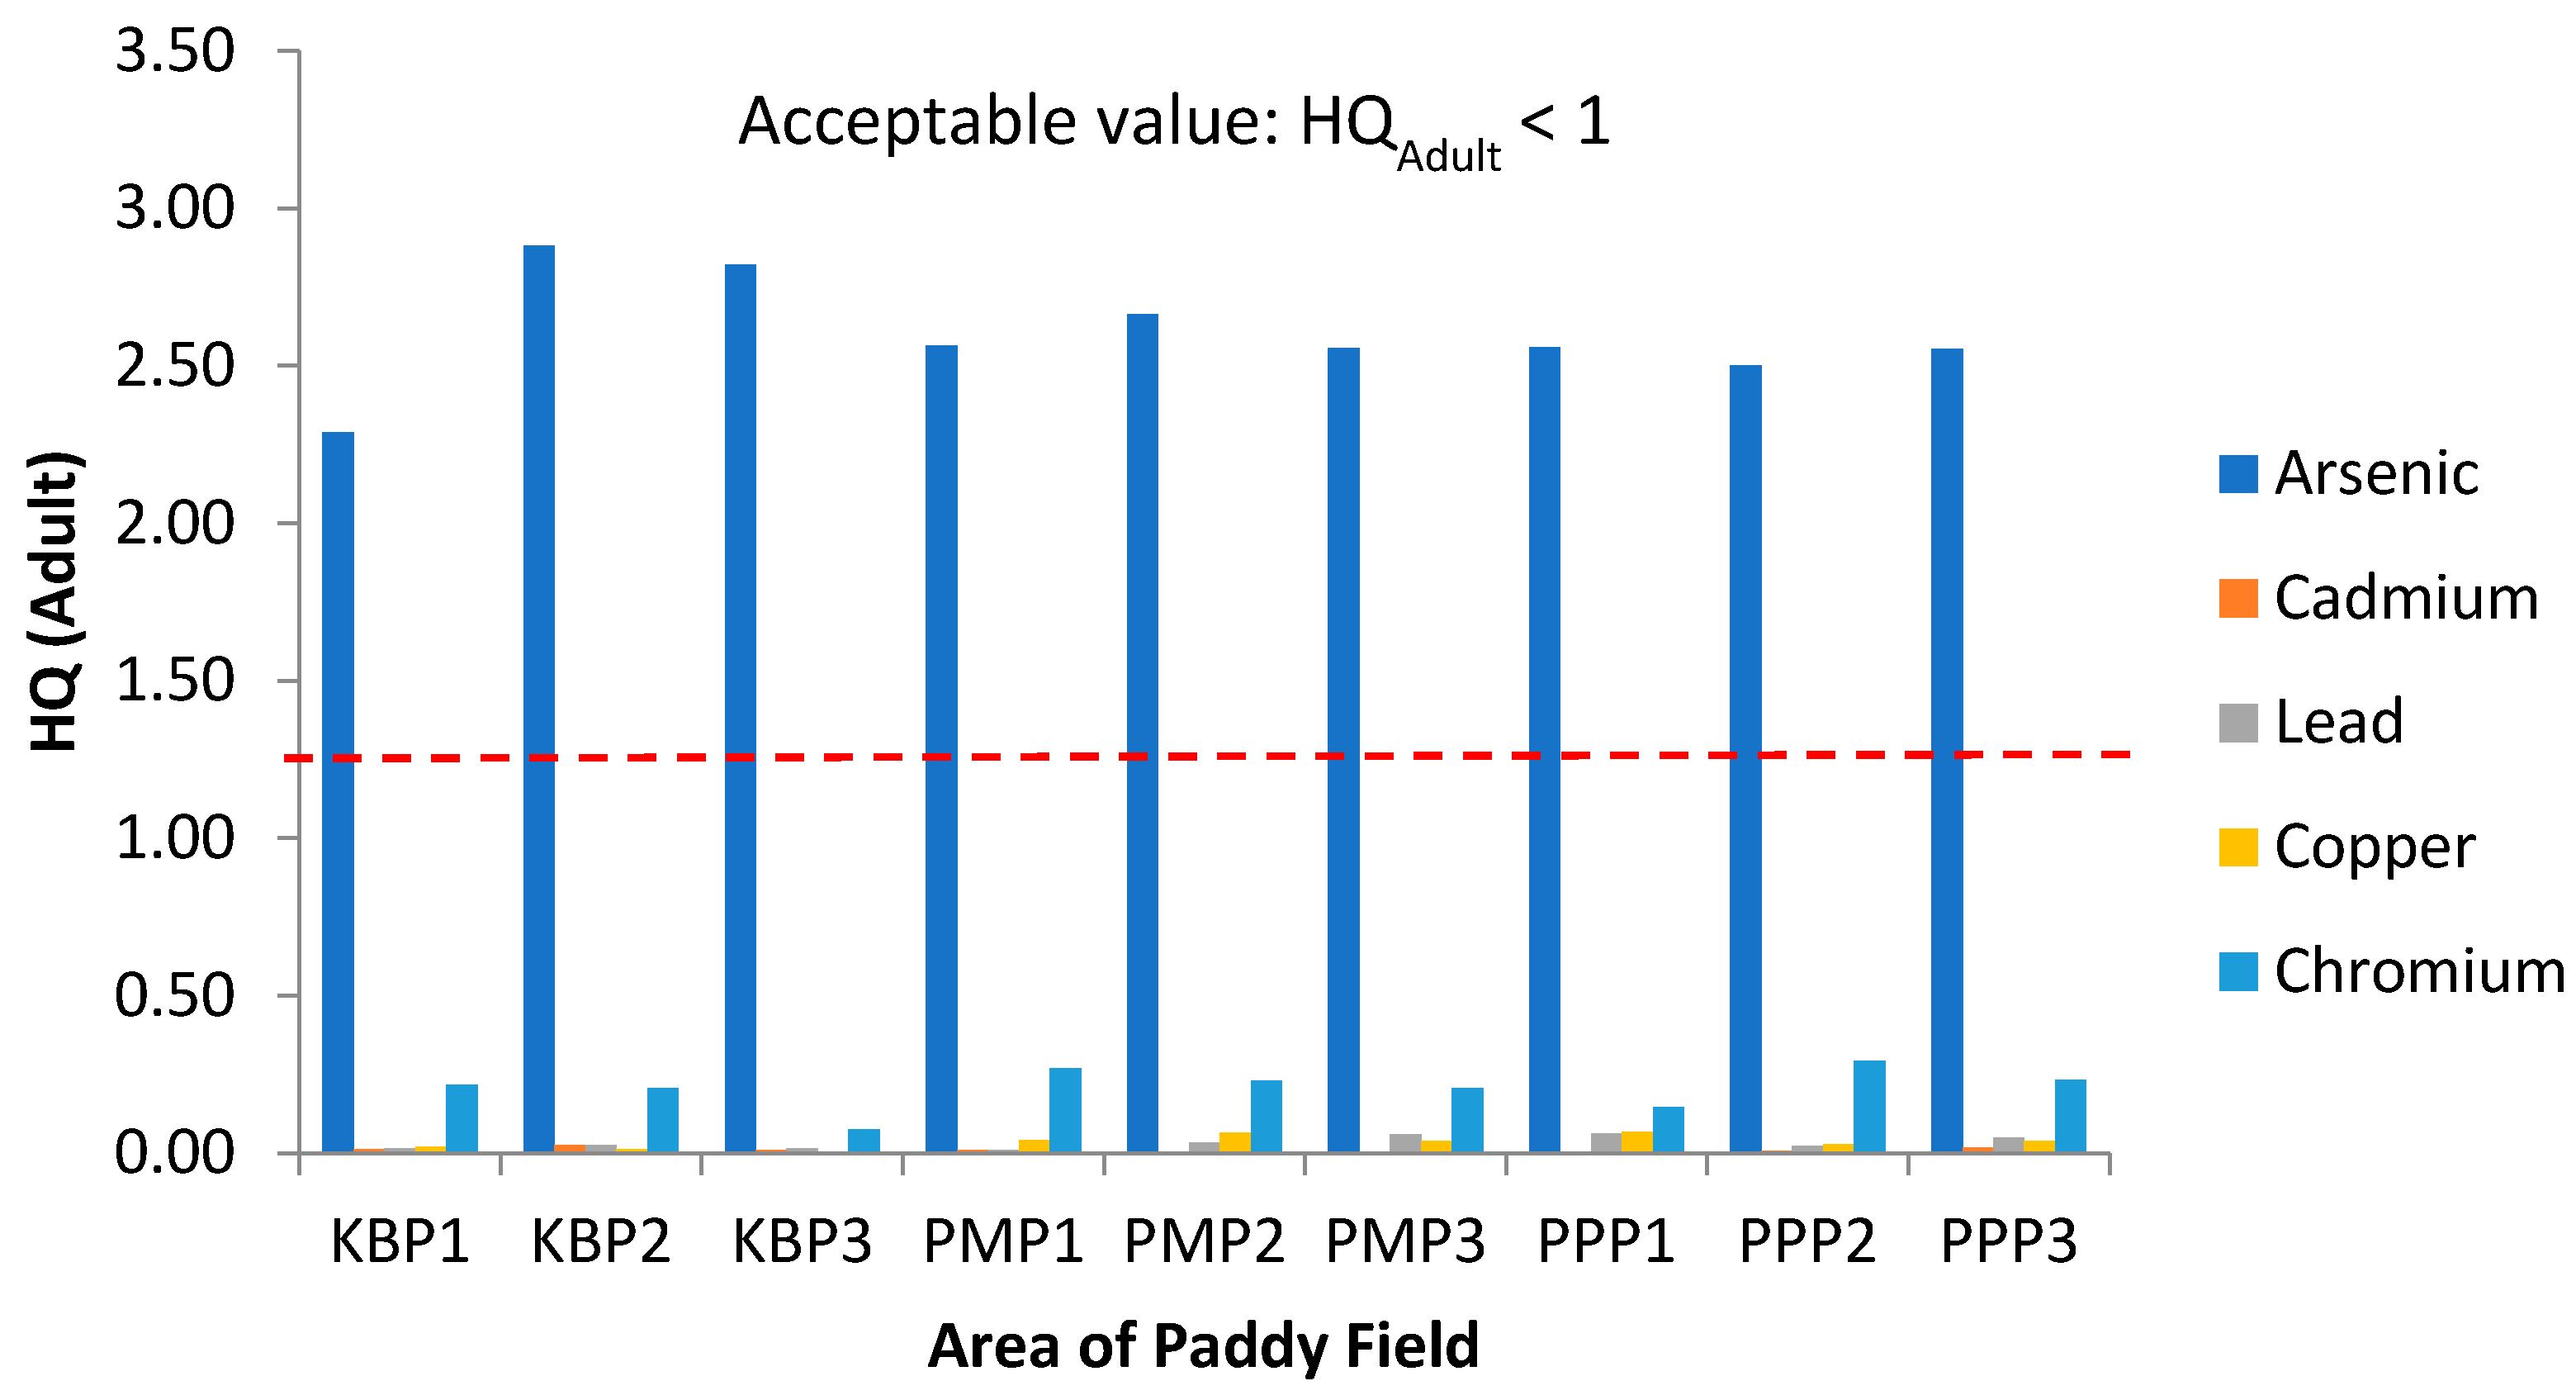
Figure 7.
Hazard Quotient (HQ) values for adults via intake of rice from the three plots of sampling sites. KBP1: Kota Bharu Plot 1, KBP2: Kota Bharu Plot 2, KBP3: Kota Bharu Plot 3, PMP1: Pasir Mas Plot 1, PMP2: Pasir Mas Plot 2, PMP3: Pasir Mas Plot 3, PPP1: Pasir Puteh Plot 1, PPP2: Pasir Puteh Plot 2, and PPP3: Pasir Puteh Plot 3.
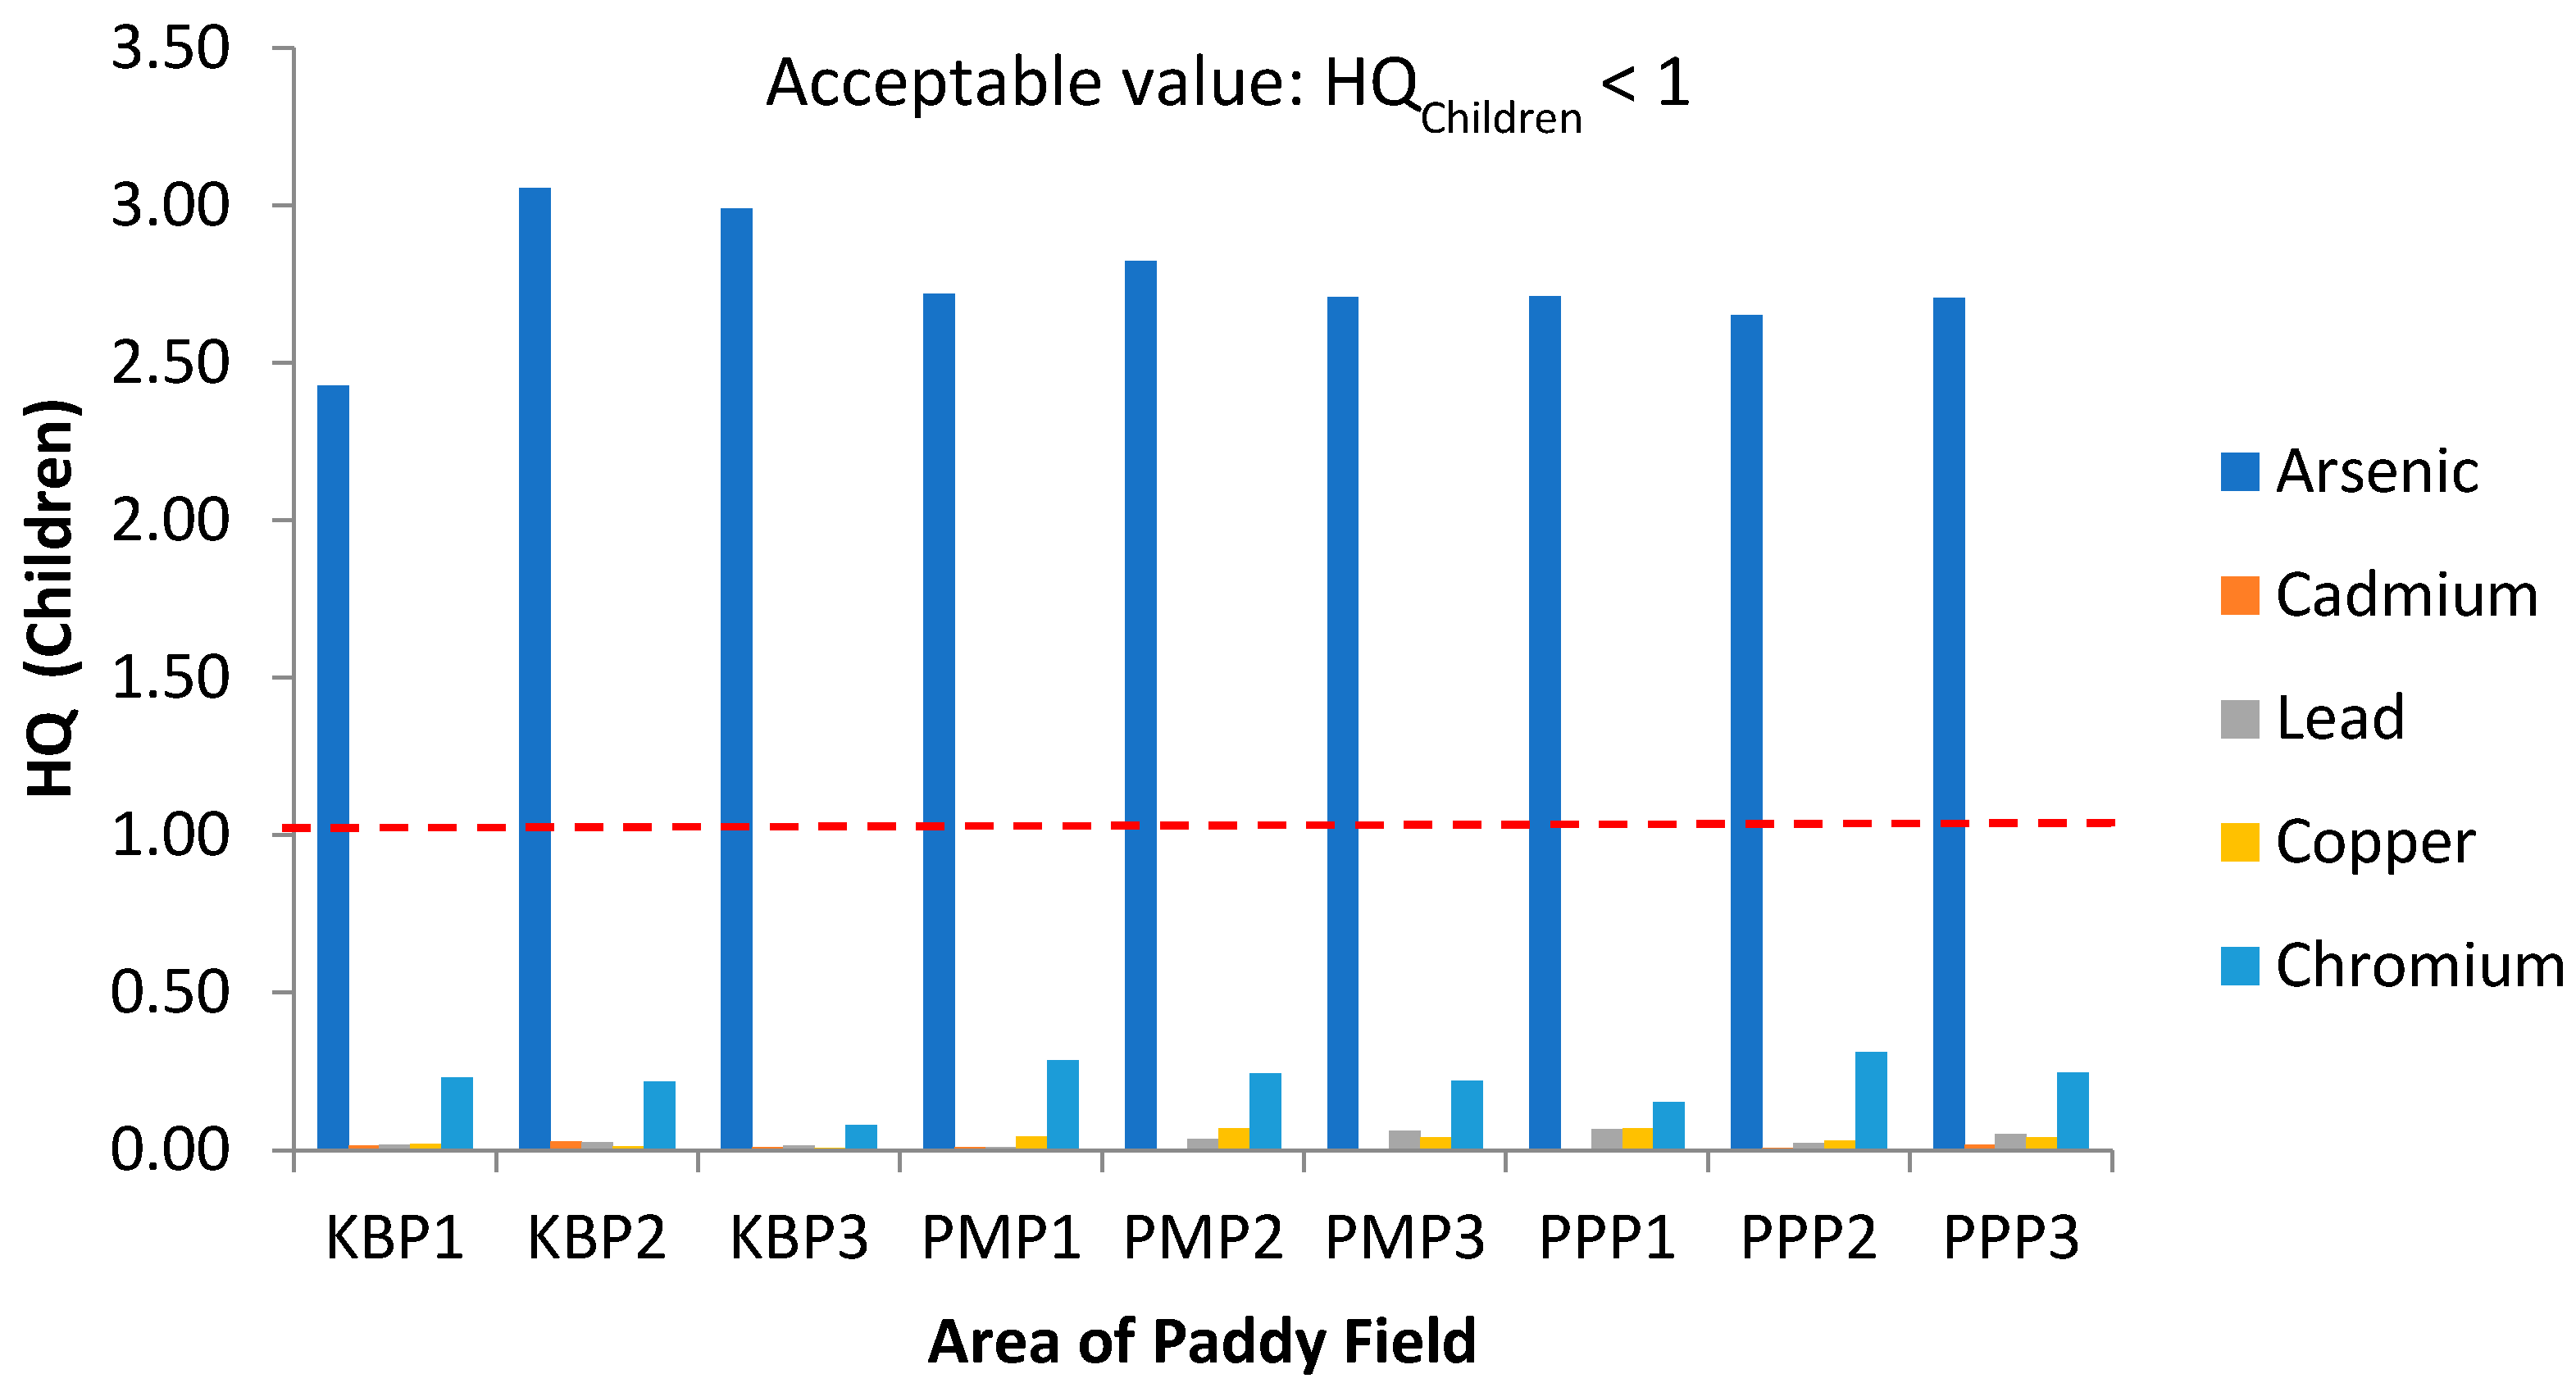
Figure 8.
Hazard Quotient (HQ) values for children via intake of rice from the three plots of sampling sites. KBP1: Kota Bharu Plot 1, KBP2: Kota Bharu Plot 2, KBP3: Kota Bharu Plot 3, PMP1: Pasir Mas Plot 1, PMP2: Pasir Mas Plot 2, PMP3: Pasir Mas Plot 3, PPP1: Pasir Puteh Plot 1, PPP2: Pasir Puteh Plot 2, and PPP3: Pasir Puteh Plot 3.
Figure 9.
Hazard Index (HI) values of adults and children via intake of rice from the three plots of sampling sites. KBP1: Kota Bharu Plot 1, KBP2: Kota Bharu Plot 2, KBP3: Kota Bharu Plot 3, PMP1: Pasir Mas Plot 1, PMP2: Pasir Mas Plot 2, PMP3: Pasir Mas Plot 3, PPP1: Pasir Puteh Plot 1, PPP2: Pasir Puteh Plot 2, and PPP3: Pasir Puteh Plot 3.
Figure 10.
Lifetime cancer risk (LCR) values for adults via intake of rice from the different sampling sites in Kelantan. KBP1: Kota Bharu Plot 1, KBP2: Kota Bharu Plot 2, KBP3: Kota Bharu Plot 3, PMP1: Pasir Mas Plot 1, PMP2: Pasir Mas Plot 2, PMP3: Pasir Mas Plot 3, PPP1: Pasir Puteh Plot 1, PPP2: Pasir Puteh Plot 2, and PPP3: Pasir Puteh Plot 3.
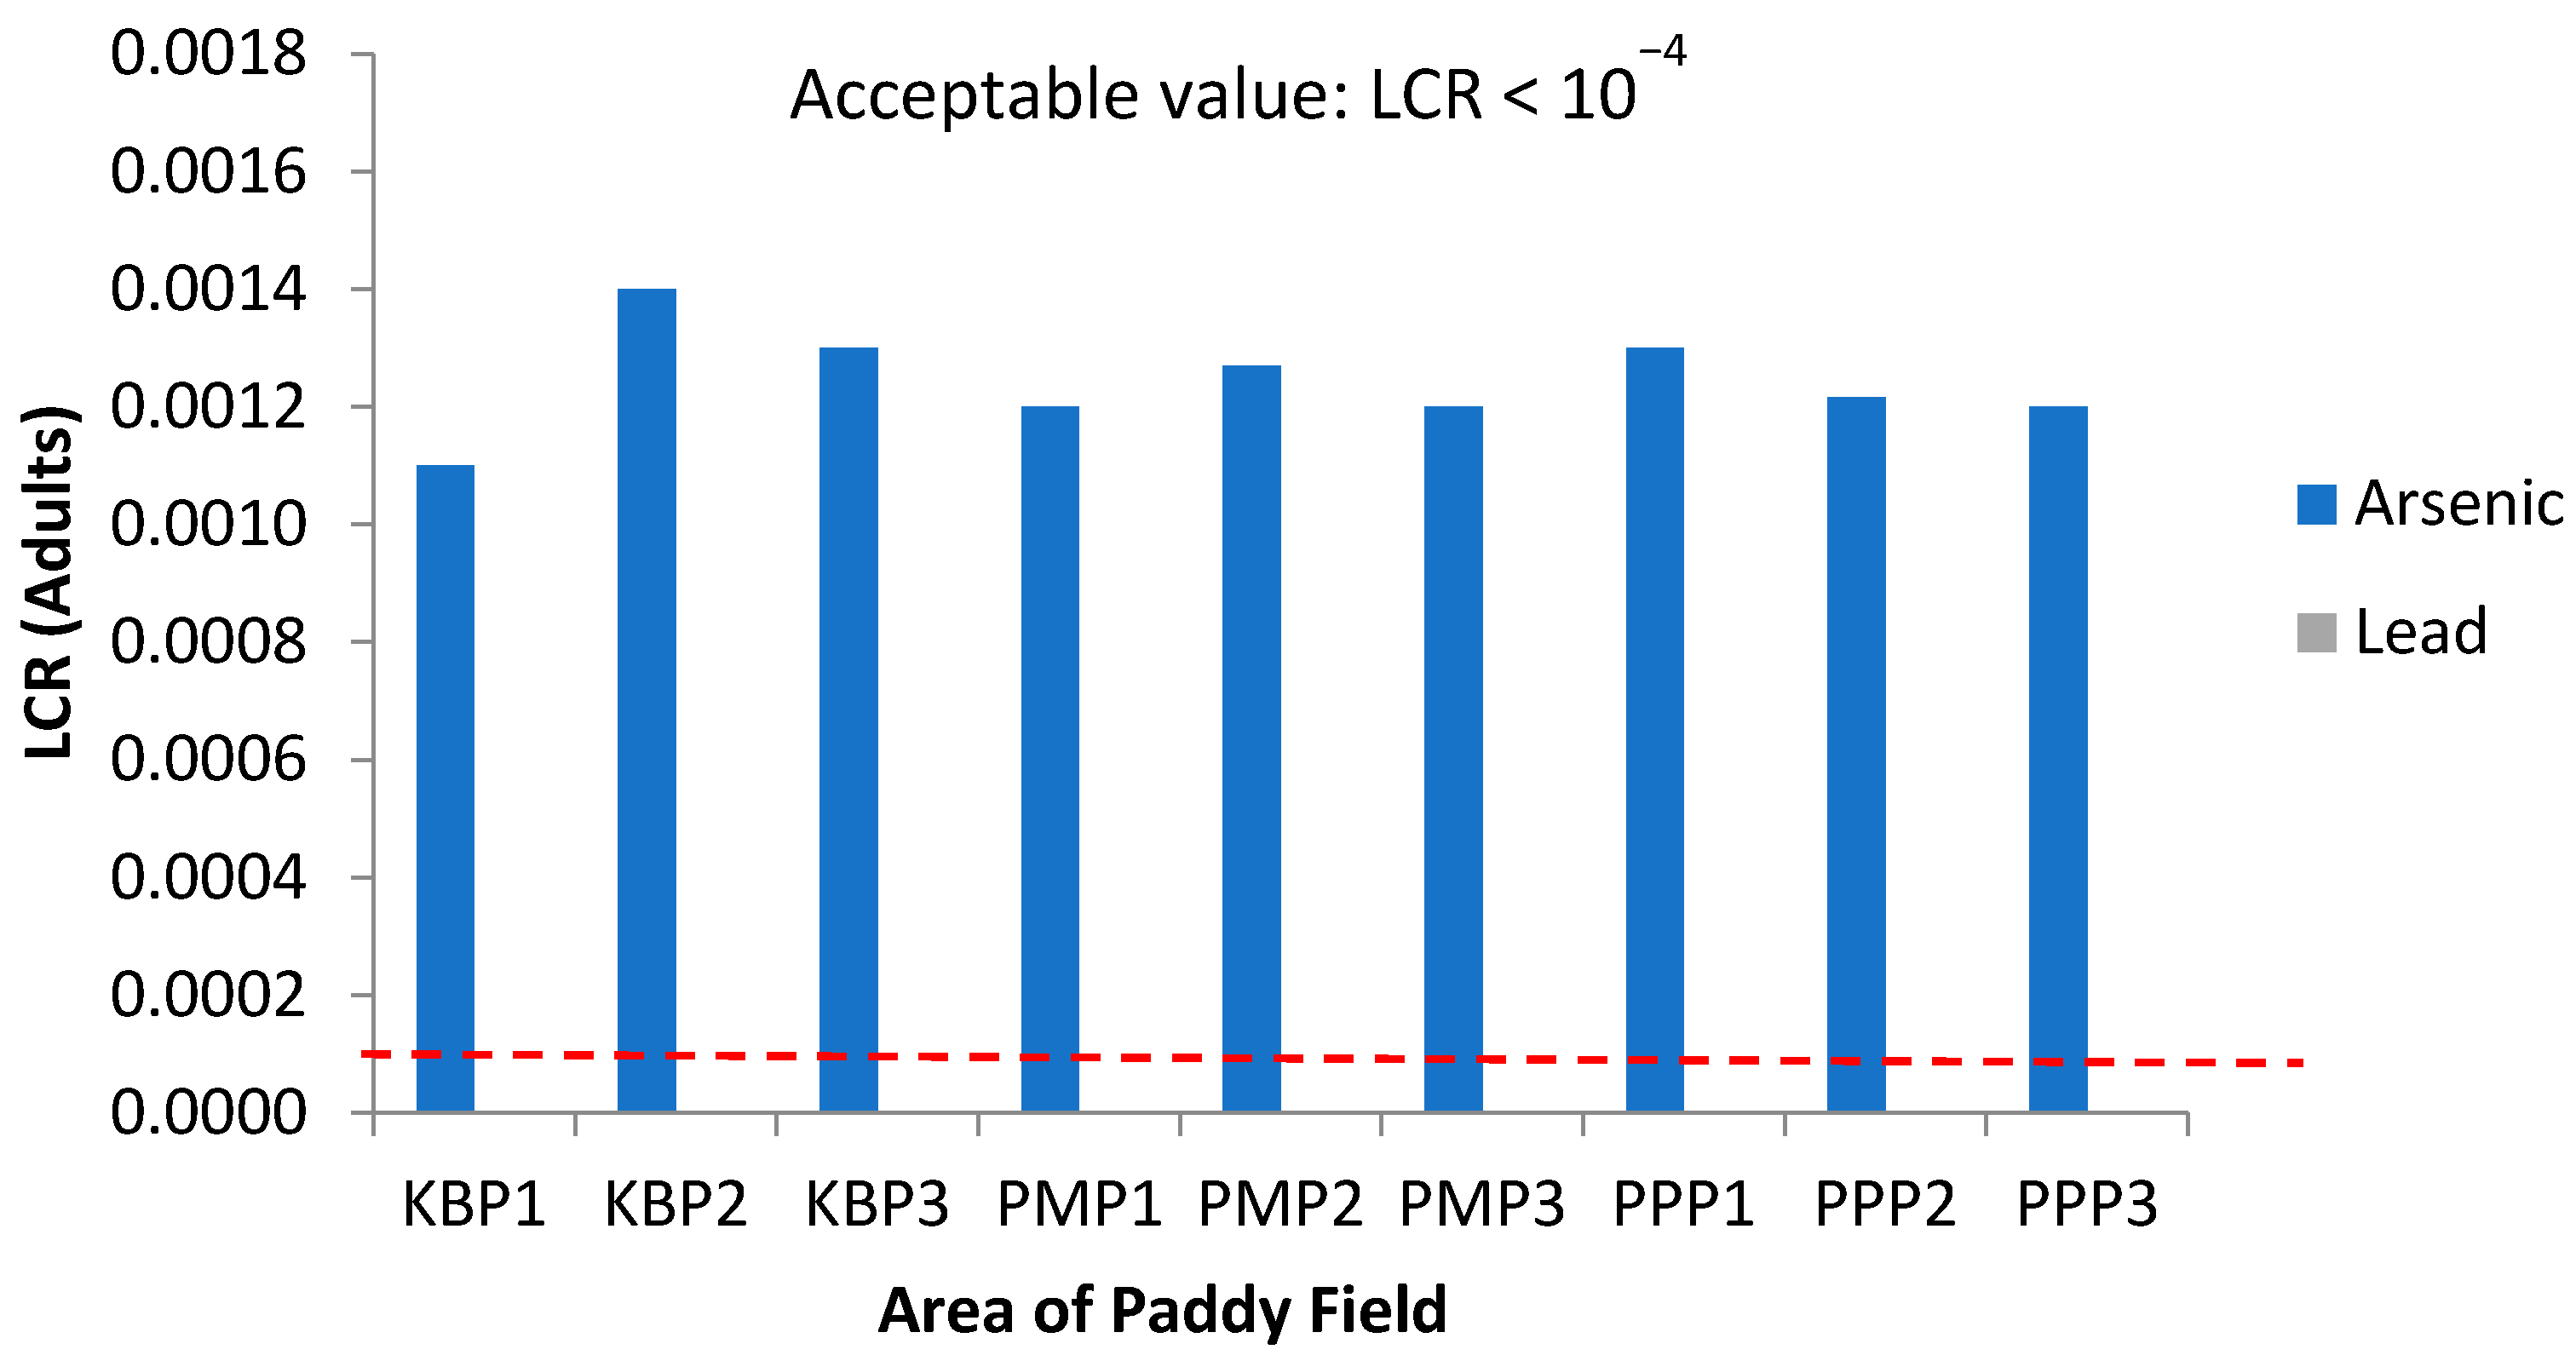
Figure 11.
Lifetime cancer risk (LCR) values for children via intake of rice from the different sampling sites in Kelantan. KBP1: Kota Bharu Plot 1, KBP2: Kota Bharu Plot 2, KBP3: Kota Bharu Plot 3, PMP1: Pasir Mas Plot 1, PMP2: Pasir Mas Plot 2, PMP3: Pasir Mas Plot 3, PPP1: Pasir Puteh Plot 1, PPP2: Pasir Puteh Plot 2, and PPP3: Pasir Puteh Plot 3.
Figure 12.
The total cancer risk (CRt) for adults and children via intake of rice from the different sampling sites in Kelantan. KBP1: Kota Bharu Plot 1, KBP2: Kota Bharu Plot 2, KBP3: Kota Bharu Plot 3, PMP1: Pasir Mas Plot 1, PMP2: Pasir Mas Plot 2, PMP3: Pasir Mas Plot 3, PPP1: Pasir Puteh Plot 1, PPP2: Pasir Puteh Plot 2, and PPP3: Pasir Puteh Plot 3.
Table 1.
Reference doses (RfD) of five heavy metals.
Table 1.
Reference doses (RfD) of five heavy metals.
| Elements | RfD (mg/kg/day) | Source |
|---|
| Cd | 1.00 × 10⁻³ | IRIS a |
| Cr | 1.5 | IRIS |
| Cu | 4.00 × 10⁻² | IRIS |
| As | 3.00 × 10⁻⁴ | IRIS |
| Pb | 3.6 × 10⁻³ c | WHO b |
Table 2.
Concentration of heavy metals in paddy soils collected from Kelantan.
Table 2.
Concentration of heavy metals in paddy soils collected from Kelantan.
| Plot | Concentration of Heavy Metals in Paddy Soil (mg/kg) |
|---|
| Arsenic (As) | Cadmium (Cd) | Lead (Pb) | Copper (Cu) | Chromium (Cr) |
|---|
| KBP | 0.265 ± 0.04 c | 0.012 ± 0.000 a | 0.423 ± 0.136 a | 0.344 ± 0.033 ab | 0.146 ± 0.015 a |
| PMP | 0.429 ± 0.03 b | 0.012 ± 0.000 a | 0.223 ± 0.046 a | 0.381 ± 0.055 a | 0.193 ± 0.029 a |
| PPP | 0.544 ± 0.02 a | 0.012 ± 0.000 a | 0.480 ± 0.210 a | 0.260 ± 0.024 b | 0.155 ± 0.007 a |
Table 3.
Concentration of arsenic in different parts of paddy plants collected from Kelantan.
Table 3.
Concentration of arsenic in different parts of paddy plants collected from Kelantan.
| Plot | Concentration of Arsenic (As) (mg/kg) |
|---|
| Root | Stem | Leaf | Grain |
|---|
| KBP | 0.079 ± 0.001 a | 0.125 ± 0.035 a | 0.021 ± 0.001 b | 0.081 ± 0.004 a |
| PMP | 0.071 ± 0.006 a | 0.039 ± 0.005 b | 0.029 ± 0.003 b | 0.087 ± 0.005 a |
| PPP | 0.078 ± 0.001 a | 0.079 ± 0.003 ab | 0.147 ± 0.008 a | 0.087 ± 0.002 a |
Table 4.
Concentration of cadmium in different parts of paddy plants collected from Kelantan.
Table 4.
Concentration of cadmium in different parts of paddy plants collected from Kelantan.
| Plot | Concentration of Cadmium (Cd) (mg/kg) |
|---|
| Root | Stem | Leaf | Grain |
|---|
| KBP | 0.002 ± 0.001 a | 0.003 ± 0.002 a | 0.001 ± 0.000 a | 0.002 ± 0.001 a |
| PMP | 0.001 ± 0.000 a | 0.009 ± 0.005 a | 0.013 ± 0.004 a | 0.000 ± 0.000 a |
| PPP | 0.001 ± 0.000 a | 0.002 ± 0.000 a | 0.013 ± 0.012 a | 0.001 ± 0.000 a |
Table 5.
Concentration of lead in different parts of paddy plants collected from Kelantan.
Table 5.
Concentration of lead in different parts of paddy plants collected from Kelantan.
| Plot | Concentration of Lead (Pb) (mg/kg) |
|---|
| Root | Stem | Leaf | Grain |
|---|
| KBP | 0.007 ± 0.001 a | 0.037 ± 0.016 a | 0.016 ± 0.006 ab | 0.007 ± 0.001 a |
| PMP | 0.004 ± 0.003 a | 0.003 ± 0.000 b | 0.007 ± 0.005 b | 0.005 ± 0.004 a |
| PPP | 0.011 ± 0.005 a | 0.011 ± 0.001 b | 0.040 ± 0.017 a | 0.013 ± 0.005 a |
Table 6.
Concentration of copper in different parts of paddy plants collected from Kelantan.
Table 6.
Concentration of copper in different parts of paddy plants collected from Kelantan.
| Plot | Concentration of Copper (Cu) (mg/kg) |
|---|
| Root | Stem | Leaf | Grain |
|---|
| KBP | 0.052 ± 0.045 a | 0.573 ± 0.866 a | 0.628 ± 0.391 a | 0.015 ± 0.008 b |
| PMP | 0.035 ± 0.003 a | 0.066 ± 0.009 a | 0.043 ± 0.022 b | 0.044 ± 0.001 a |
| PPP | 0.032 ± 0.007 a | 0.030 ± 0.005 a | 0.048 ± 0.010 b | 0.032 ± 0.008 a |
Table 7.
Concentration of chromium in different parts of paddy plants collected from Kelantan.
Table 7.
Concentration of chromium in different parts of paddy plants collected from Kelantan.
| Plot | Concentration of Chromium (Cr) (mg/kg) |
|---|
| Root | Stem | Leaf | Grain |
|---|
| KBP | 0.075 ± 0.006 a | 0.055 ± 0.016 a | 0.070 ± 0.010 a | 0.068 ± 0.002 a |
| PMP | 0.070 ± 0.019 a | 0.078 ± 0.007 a | 0.020 ± 0.013 b | 0.086 ± 0.015 a |
| PPP | 0.080 ± 0.006 a | 0.052 ± 0.006 a | 0.081 ± 0.026 a | 0.082 ± 0.005 a |
Table 8.
Average daily dose (ADD) of heavy metals for adults and children via rice consumption.
Table 8.
Average daily dose (ADD) of heavy metals for adults and children via rice consumption.
| Metals | ADD (Adults) (mg/kg/day) | Safe Value (mg/kg/day) |
| KBP1 | KBP2 | KBP3 | PMP1 | PMP2 | PMP3 | PPP1 | PPP2 | PPP3 |
| As | 0.0009 | 0.00086 | 0.00085 | 0.00077 | 0.00080 | 0.00077 | 0.00077 | 0.00079 | 0.00077 | 0.003 |
| Cd | 0.00001 | 0.00002 | 0.00001 | 0.00001 | 0.00000 | 0.00000 | 0.00000 | 0.00001 | 0.00002 | 0.0008 |
| Pb | 0.00005 | 0.00009 | 0.00005 | 0.00003 | 0.00012 | 0.00021 | 0.00022 | 0.00008 | 0.00017 | 0.0015 |
| Cu | 0.00019 | 0.00012 | 0.00005 | 0.00042 | 0.00065 | 0.00038 | 0.00066 | 0.00029 | 0.00038 | 0.7–0.9 |
| Cr | 0.00065 | 0.00062 | 0.00076 | 0.00081 | 0.00069 | 0.00062 | 0.00043 | 0.00084 | 0.00070 | 0.020–0.035 |
| Metals | ADD (Children) (mg/kg/day) | Safe Value (mg/kg/day) |
| KBP1 | KBP2 | KBP3 | PMP1 | PMP2 | PMP3 | PPP1 | PPP2 | PPP3 |
| As | 0.00096 | 0.00092 | 0.00090 | 0.00082 | 0.00085 | 0.00081 | 0.00081 | 0.00083 | 0.00081 | 0.003 |
| Cd | 0.00001 | 0.00003 | 0.00001 | 0.00001 | 0.00000 | 0.00000 | 0.00000 | 0.00001 | 0.00002 | 0.0008 |
| Pb | 0.00006 | 0.00009 | 0.00005 | 0.00003 | 0.00013 | 0.00022 | 0.00024 | 0.00008 | 0.00018 | 0.0015 |
| Cu | 0.00020 | 0.00013 | 0.00005 | 0.00044 | 0.00068 | 0.00040 | 0.00070 | 0.00031 | 0.00041 | 0.340–0.440 |
| Cr | 0.00069 | 0.00065 | 0.00081 | 0.00086 | 0.00073 | 0.00066 | 0.00046 | 0.00089 | 0.00074 | 0.011–0.015 |


 ,
, 


