Abstract
The nutrition facts table is a nutrition labeling tool designed to inform consumers of food nutritional contents and enable them to make healthier choices by comparing the nutritional values of similar foods. However, its adoption level is considerably low in China. This study employed the Chi-squared Automatic Interaction Detection (CHAID) algorithm to explore the factors associated with respondents’ adoption of nutrition facts table to compare the nutritional values of similar foods. Data were gathered through a nationally representative online survey of 1500 samples. Results suggested that consumers’ comprehension of the nutrition facts table was a direct explanatory factor for its use. The usage was also indirectly explained by people’s nutrition knowledge, the usage of nutrition facts table by their relatives and friends, and their focus on a healthy diet. Therefore, to increase the use of nutrition facts table by Chinese consumers, the first consideration should be given to enhancing consumers’ comprehension of the labeling
1. Introduction
As a description of the nutritional properties of food [1], nutrition labeling is regarded as a critical instrument to meet consumers’ need for accurate and comprehensible nutrition information to make healthier choices [2]. The nutrition facts table is a standardized statement of the nutrient content of foods [1], and it has been applied in the United States, Britain, and Canada. As a food label in China since 2013, the nutrition facts table has mandatorily provided the information about energy value and the amounts of protein, fat, carbohydrates, and sodium, as well as the percentages of Nutrient Reference Values (NRV) per 100 g/mL on all prepackaged food items regulated by the national standard [3]. Under the circumstance that Chinese people are increasingly buying unhealthy prepackaged foods such as fatty foods and sugary drinks [4], the nutrition facts table is designed to help Chinese consumers to understand the nutritional status of food, which is expected to enable them to choose healthy food (i.e., low-calorie, low-fat, low-sodium, and high-protein) by comparing the nutritional information of food products among various brands or different series of the same brand. However, a low level (19.2%) of Chinese residents’ health literacy was found in the 2019 national health literacy monitoring results [5], and it is likely to influence people’s ability to or interest in reading food labels [6]. In practice, a nutrition facts table is rarely used in China [7], not to mention using it to compare the nutritional values. A representative survey showed that 70% of Chinese participants claimed to rarely or never use nutrition labels when shopping for food [8]. Hence, more attention should be paid to understanding the drivers of nutrition facts table use by consumers and devising appropriate measures to promote its usage.
Existing studies mainly employed a logistic regression model to identify the adoption of nutrition labeling by consumers [9,10]. However, logistic regression has inherent disadvantages in studying nutrition labeling usage, a complex human behavior influenced by a wide range of interrelating factors because it cannot reflect various characteristics of such a complex practice. As a heuristic decision tree modeling method, the Chi-squared Automatic Interaction Detector (CHAID) algorithm proposed by Kass is an alternative and more efficient approach to logistic regression models as it classifies key determinants quickly and effectively by developing a decision tree [11]. In recent years, the CHAID algorithm is widely used in the medical field [12,13], yet few applications have been conducted on nutrition labeling. To the best of our knowledge, the present study is the first in China to apply the comprehensive CHAID model to examine nutrition labeling use. The findings are expected to contribute to providing a scientific basis and theoretical reference for increasing the use of nutrition labeling in China and other countries.
2. Methods and Materials
2.1. Methods
CHAID algorithm which starts with the full data set is implemented by repeatedly splitting subsets of the space (i.e., a mathematical concept where one set belongs to another) into two or more child nodes (i.e., a node that has a node attached to itself rather than the root node) [14]. It is an operation standard procedure to conduct a literature review to identify potential factors that affect human behavior before the application of the CHAID algorithm, and the factors mentioned which are excluded in the dataset could be ignored [15]. Prior to CHAID decision tree analysis, potential factors affecting consumers’ behavior of nutrition labeling usage were obtained from a literature review (see Table 1) and then the Chi-square test was used to assess whether the difference was statistically significant between respondents’ characteristics and label use. All characteristics whose p-value of Chi-square statistic was statistically significant (p-value < 0.05) were included as independent variables in decision tree models.

Table 1.
Variables initially identified through a literature review.
To determine the most favorable split at any node, the most significant variable is firstly selected using a Chi-squared independence test. Next, using chi-squared statistics, the optimal points for dividing the selected variable are calculated until they could not be divided, resulting in the amount of optimal points. A database including the entire input variable is divided into sub-databases along the optimal points. This ends one loop in the algorithm for the decision tree. The same process is carried out in each sub-database. Tree growth is stopped when there are no significantly different chi-squared statistics [16]. The parameters for conducting the algorithm don’t have to be determined due to nonparametric estimation [17]. The following three parameters are set in this study to conduct CHAID algorithm: (1) α for splitting = 0.05, which specifies the significance level for splitting nodes; (2) α for merging = 0.05, which specifies the significance level for merging categories; and (3) the maximum number of iterations = 100, which specifies the maximum number of iterations before stopping. The Chi-square test and the CHAID decision tree were conducted using SPSS version 19.0.
2.2. Data Collection Data
We used the variables from the literature review (see Table 1) to design a self-administered questionnaire that contained 21 questions including socio-demographic information (see Supplementary Materials for details: Table S1). The Wenjuanxing platform (https://www.wjx.cn accessed on 29 July 2020) is one of the leading companies specializing in online questionnaire data collection in China and has a sample pool of 2.6 million potential respondents reasonably distributed by gender, age, occupation, and region. Paid survey data collection services are provided by the Wenjuanxing platform for sending questionnaires to target samples and ensuring the validity of questionnaire information.
With the development of the transportation and food industry, various types and quantities of prepackaged food across the country are in sufficient supply [32]. Generally, most of the Chinese people choose their favorite food by comparison. From 29 July to 21 August 2020, the Wenjuanxing platform was commissioned to collect 1500 valid survey samples nationwide from the sample pool. First of all, the platform employed a stratified sampling approach to select randomly 54 individuals from each of China’s 30 provinces/autonomous regions (except Tibet) to finish online surveys in simplified Chinese suitable for various regions and participants received an incentive with 8 yuan RMB. Then a double check was conducted among the collected 1620 questionnaires to eliminate invalid ones due to lack of information and implausible answers. Finally, 1500 valid samples totally were generated for analysis.
3. Results
3.1. Sample Characteristics
Our sample is representative of the Chinese population in terms of socio-demographic characteristics. Table 1 describes the socio-demographic features of the sampled 1500 individuals. Overall, the most probable profile of a respondent is male (58.07%), aged between 18 and 44 years (66.80%), had a middle-income between 10,000 and 50,000 Yuan after tax (21.27%), and attended a junior high school (42.40%). The nutrition facts table was far from being effectively adopted and only less than 40% reported that they compared the nutritional value of similar foods using the labeling at the point of purchase.
3.2. Chi-Square Test Result
As can be seen from Table 2, the independent variables with p-value < 0.05 were identified as statistically significant determinants, including the respondent’s education, BMI, health self-rating, nutrition knowledge level, comprehension of nutrition facts table, and whether one focuses on an individual healthy diet, limits food consumption to prevent obesity, considers nutrition facts table helpful in healthy food choice, and has friends and relatives using nutrition facts table.
Table 2.
Chi-square test results of subgroups from the comparison of nutritional value.
3.3. CHAID Algorithm Analysis
Based on the Chi-square test result, the CHAID algorithm was performed by using a comparison of the nutritional value as the dependent variable. The characteristics of the initial model were shown in Table 3, the maximum tree depth was 3, and there were 12 nodes and 7 terminal nodes in total. The minimum cases in the parent node and child node were 119 and 8, respectively. As for the outcomes, there were only 4 independent variables (i.e., respondents’ nutrition knowledge level, whether to focus on an individual healthy diet, comprehension of nutrition facts table, and whether friends and relatives use nutrition facts table) selected by the CHAID algorithm.
Table 3.
Characteristics of the initial model and its outcomes.
Table 4 illustrates the Chi-square test results of terminal nodes. All independent variables were selected by the CHAID algorithm. For instance, the comprehension of the nutrition facts table were grouped into 3 categories, and nutrition knowledge level was divided into 2 categories. All terminal nodes with a p-value < 0.05 were statistically significant, suggesting that the CHAID algorithm was reasonable.
Table 4.
Chi-square test results of terminal nodes [n (%)].
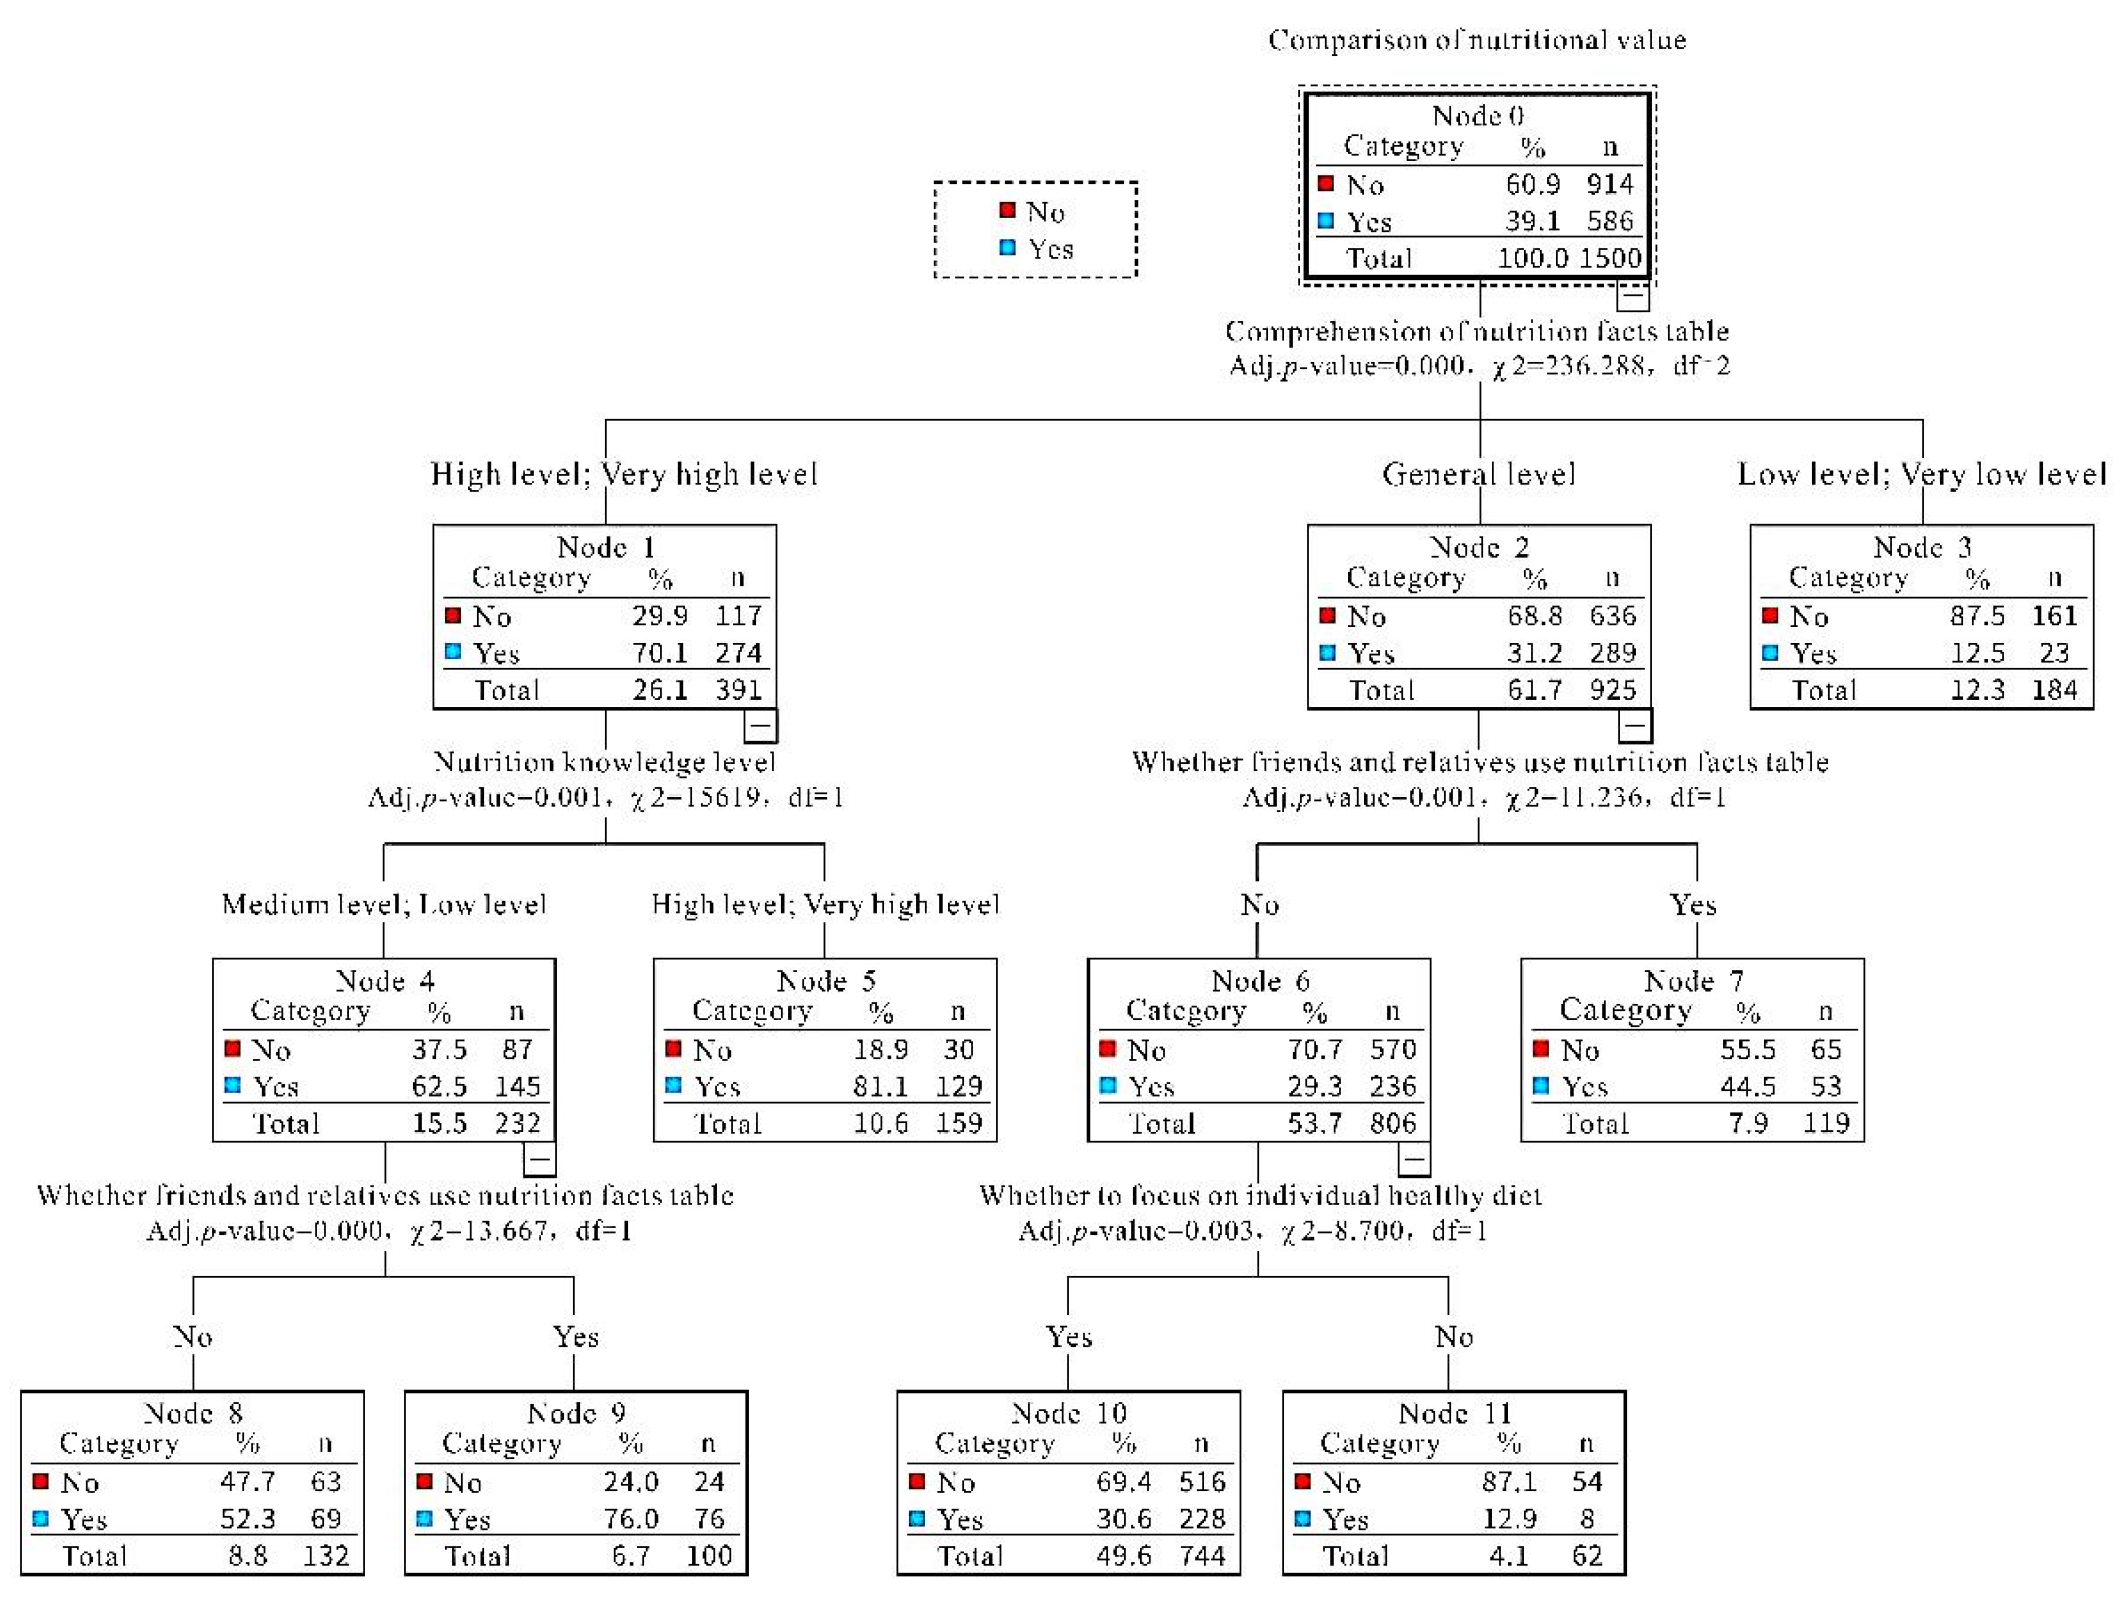
The CHAID decision tree diagram for comparison of nutritional value was indicated in Figure 1. The decision tree was firstly branched based on respondents’ comprehension of the nutrition facts table and then branched according to their nutrition knowledge level, whether to focus on an individual healthy diet, and whether friends and relatives use the nutrition facts table. Low AUC (Area under Curve) of the CHAID algorithm was 0.732 (p < 0.000), which was more than 0.5, and suggested that it was suitable to explore factors influencing the comparison of nutritional values via the CHAID algorithm.
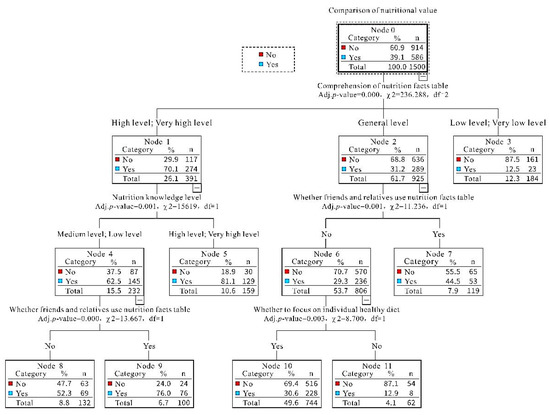
Figure 1.
Results of Decision Tree Analysis based CHAID algorithm. Note: n (number); df (degree of freedom); χ2 (chi-square); Adj. p-value (adjusted p-value).
The direct and strongest associated factor was respondents’ comprehension of the nutrition facts table. People with a very high or high level of comprehension of the nutrition facts table (70.1%) were most likely to compare the nutritional values of similar foods.
It was also found that respondents’ nutrition knowledge level was the main determinant among those with a very high or high level of comprehension of nutrition facts table, and those with a very high or high level of nutrition knowledge (81.1%) showed a greater propensity to adopt this practice. Whether friends and relatives use nutrition facts table was the main determinant amongst a sample of those with a medium level of comprehension of the label and medium or low level of nutrition knowledge, and respondents whose friends and relatives used nutrition facts table were most likely to compare nutritional values of similar foods. Moreover, whether to focus on an individual healthy diet was the main determinant among those without friends and relatives using the nutrition facts table, and respondents who focused on an individual healthy diet (30.6%) were most likely to compare nutritional values of similar foods.
4. Discussion
This study provided new insights from an innovative method for exploring factors affecting nutrition labeling use. CHAID algorithm was proved to be a suitable model to fit the survey data. Also, the graph structure generated by the CHAID tree is highly visual, which makes the interaction between variables intuitively understood.
As noted, the only direct factor was consumers’ comprehension of the nutrition facts table, which largely determined the adoption behavior. It was in line with the findings of Hobin et al. [28]. Specifically, the higher the respondents’ comprehension was, the more likely they were to compare nutritional values. This is because consumers found it hard to compare nutritional values of similar foods by using the information of nutrients’ contents and their NRV% on the nutrition facts table if they knew little about the concepts and functions of carbohydrates, fat, protein, sodium, and NRV%.
Respondents’ nutrition knowledge level, whether friends and relatives use nutrition facts table, and whether to focus on individual healthy diet played an indirect role during their decision process of adoption. First, respondents’ nutrition knowledge level was positively correlated with their behavior of comparing the nutritional value of similar foods. The higher the respondents’ nutrition knowledge level was, the more scientific understanding of health-promoting eating styles they had. It could assist consumers in increasing the use of labeling. Second, whether friends and relatives use the nutrition facts table was found to positively impact the adoption behavior of those with an average level of comprehension or a low and medium level of nutrition knowledge. In reality, people in China often go food shopping with friends/relatives [33]. Respondents might be encouraged to compare nutritional values of similar foods by using the nutrition facts table once their friends and relatives used the labeling when food shopping. Even though the respondents had medium-level comprehension of the nutrition facts table or a low level of nutrition knowledge, they could be encouraged to compare nutritional values of friends and relatives around used nutrition labeling. Third, whether to focus on an individual healthy diet was positively related to food label use of respondents who had an average level of comprehension of the nutrition facts table and had no friends or relatives using the nutrition facts table. If an individual paid attention to a healthy diet in daily life, he or she might know how to maintain and improve health. Even though respondents who generally focused on the healthy diet had an average level of understanding of nutrition facts table information or no friends or relatives used nutrition labeling, he or she would compare the labeling information of similar foods, particularly the nutrient contents and NRV%, at the point of purchase.
Additionally, four variables including individual education level, self-ratings of health, whether to have limited foods to prevent obesity, whether the nutrition facts table is helpful in healthy food choice, were not selected by the CHAID algorithm due to little effects on the nutrition facts table use for nutritional values comparison. There were some possible reasons. Firstly, those with high education levels were found no association with a high knowledge level of food labeling [34], and personal subjective evaluation of health status could hardly reflect the requirement and practice of their own health promotion such as food labels usage [35]. Secondly, people who choose diets for body weight control and health follow advice from professionals in most cases rather than nutrition information in labels [36]. Thirdly, individuals who could trust nutrition labels rarely understood how to use them if they had a low level of relevant knowledge [37].
However, several limitations need to be noted. First, although the CHAID tree demonstrates clearer and more available classification information, it fails to reflect the main effect and superposition effect of variables [38]. Thus, to obtain better results, future studies should select the main effect of statistically significant variables by logistic regression, and subsequently analyze the interaction between variables by a decision tree model. Second, the survey questions design needs to be improved. On one hand, both some questions which contained double-barreled items and the response options only with "yes" and "no" for the item on friends/relatives’ use of the nutrition facts table were less likely to reflect accurate responses, so it is necessary to make items clear in the next step of questionnaire design to avoid double-barreled questions and inadequate options. On the other hand, survey respondents probably had different responses to the practice of nutrition facts table due to food purchase for the unclear target population, resulting in inaccurate data collection. Third, although self-administered questionnaires could collect data efficiently, participants may still make inaccurate answers or fail to complete unclear questions in the online survey environment. This perhaps leads to poor data quality. Complex indirect questioning methods, such as the list experiment, are expected to overcome the difficulties facing high-quality data collection. Finally, we failed to observe any demographic differences or differences in 50 surveyed consumers’ use of the nutrition facts table by region. There may be important differences that have implications for addressing consumer behavior with unique approaches in different regions. These would be dealt with in the future study.
5. Conclusions
The current research aimed to explore the key determinants of Chinese consumers’ nutrition facts table use for nutritional values comparison among similar foods. The findings revealed that the CHAID algorithm could identify factors scientifically and effectively, which proved to be a well-suited identification method. Consumers’ comprehension of the nutrition facts table was the direct motivator that could largely explain label use. Besides, respondents’ nutrition knowledge, whether relatives and friends use the nutrition facts table, and whether to focus on a healthy diet were indirect factors.
6. Recommendations
To encourage consumers to develop a good habit of using the nutrition facts table to compare nutritional values of foods, the following policy recommendations are offered. (1) Nutrition facts table in China showed nutrition information in terms of professional terms, words, and values in a single and abstract manner, which is not easy to understand. To improve consumers’ understanding of the nutrition facts table, a variety of popular forms should be conducted to promote the nutrition facts table, especially the concepts and functions of energy, key nutrients, and NRV%. (2) Nutrition knowledge learning should not only become a key course for primary and middle school students but also be promoted to the community by nutritionists. (3) Some important communities, schools, and companies should be encouraged to pilot the use of nutrition labeling, creating a sound social atmosphere that is conducive to the adoption of nutrition facts table in the wider population. (4) Despite an increasing number of consumers who pay attention to a healthy diet, many Chinese consumers still have a low level of awareness, resulting in unhealthy patterns of food consumption and nutrition intake, which highlights the need to strengthen education programs that aim at guiding public attention towards a balanced diet and nutrition intake.
Supplementary Materials
The following supporting information can be downloaded at: https://www.mdpi.com/article/10.3390/ijerph19020673/s1, Table S1: The questionnaire.
Author Contributions
Conceptualization, original draft preparation, and methodology: Z.H.; Data cleaning and statistical analysis: H.L.; Review and editing: J.H. All authors have read and agreed to the published version of the manuscript.
Funding
This study is supported by the Central Public-interest Scientific Institution Basal Research (1610422021003) and Chinese Academy of Agricultural Sciences fund through the Science and Technology Innovation Engineering Project (CAAS-ASTIP-2021-IFND).
Institutional Review Board Statement
Not applicable.
Informed Consent Statement
Not applicable.
Data Availability Statement
Data is contained within the article.
Acknowledgments
We thank all the enumerators for their help in data collection.
Conflicts of Interest
The authors declare no conflict of interest.
References
- Codex Alimentarius Commission. Codex Guidelines on Nutrition Labeling; CACGL 2-1985; Codex Alimentarius Commission: Roman, Italy, 1985. [Google Scholar]
- World Health Organization. Global Strategy on Diet, Physical Activity and Health; World Health Organization: Geneva, Switzerland, 2004. [Google Scholar]
- Ministry of Health (MoH), PRC. General Rules for Nutrition Labeling of Pre-Packaged Food; GB28050-2011; Ministry of Health (MoH), PRC: Beijing, China, 2011.
- He, Y.; Huang, L.; Yan, S.; Li, Y.; Lu, L.; Wang, H.; Niu, W.; Zhang, P. Awareness, understanding and use of sodium information labelled on pre-packaged food in Beijing: A cross-sectional study. BMC Public Health 2018, 18, 509. [Google Scholar] [CrossRef] [Green Version]
- Chinese Nutrition Society. Scientific Research Report of Dietary Guidelines for Chinese Residents. 2021. Available online: http://dg.cnsoc.org/upload/affix/20210301174345895.pdf (accessed on 21 March 2021).
- Cha, E.; Kim, K.H.; Lerner, H.M.; Dawkins, C.R.; Bello, M.K.; Umpierrez, G.; Dunbar, S.B. Health literacy, self-efficacy, food label use, and diet in young adults. Am. J. Health Behav. 2014, 38, 331–339. [Google Scholar] [CrossRef] [Green Version]
- Song, J.; Huang, J.; Chen, Y.; Zhu, Y.; Li, H.; Wen, Y.; Yuan, H.; Liang, Y. The understanding, attitude and use of nutrition label among consumers (China). Nutrición Hospitalaria 2015, 31, 2703–2710. [Google Scholar]
- Liu, R.; Hoefkens, C.; Verbeke, W. Chinese consumers’ understanding and use of a food nutrition label and their determinants. Food Qual. Prefer. 2015, 41, 103–111. [Google Scholar] [CrossRef]
- Cheong, S.M.; Jasvindar, K.; Lim, K.H.; Ho, B.K.; Mohmad, S. Use and understanding of nutritional labeling among elderly men and women in Malaysia. Malays. J. Nutr. 2013, 19, 353–362. [Google Scholar]
- Nianogo, R.A.; Kuo, T.; Smith, L.V.; Arah, O.A. Associations between self-perception of weight, food choice intentions, and consumer response to calorie information: A retrospective investigation of public health center clients in Los Angeles County before the implementation of menu-labeling regulation. BMC Public Health 2016, 16, 60. [Google Scholar] [CrossRef] [PubMed] [Green Version]
- Kass, G.V. An exploratory technique for investigating large quantities of categorical data. Appl. Stat. 1980, 29, 119–127. [Google Scholar] [CrossRef]
- Murphy, E.L.; Comiskey, C.M. Using chi-squared automatic interaction detection (CHAID) modelling to identify groups of methadone treatment clients experiencing significantly poorer treatment outcomes. J. Subst. Abuse Treat. 2013, 45, 343–349. [Google Scholar] [CrossRef]
- Sasaki, N.; Groenewoud, S.; Kunisawa, S.; Westert, G.; Imanaka, Y. Public needs for information disclosure on healthcare performance: Different determinants between Japan and the Netherlands. Medicine 2019, 98, e17690. [Google Scholar] [CrossRef]
- Michael, J.A.; Gordon, S.L. Data Mining Technique: For Marketing, Sales and Customer Support; Wiley: New York, NY, USA, 1997. [Google Scholar]
- Galguera, L.; Luna, D.; Méndez, M.P. Predictive segmentation in action: Using CHAID to segment loyalty card holders. Int. J. Market Res. 2006, 48, 459–479. [Google Scholar] [CrossRef]
- Ho, S.H.; Jee, S.E.; Lee, J.E.; Park, J.S. Analysis on risk factors for cervical cancer using induction technique. Expert Syst. Appl. 2004, 27, 97–105. [Google Scholar] [CrossRef]
- Ture, M.; Tokatli, F.; Kurt, I. Using Kaplan–Meier analysis together with decision tree methods (C&RT, CHAID, QUEST, C4.5 and ID3) in determining recurrence-free survival of breast cancer patients. Expert Syst. Appl. 2009, 36, 2017–2026. [Google Scholar]
- Webb, D. Dressing up salads in fancy flavors: Label reading required. Env. Nutri. 1999, 22, 5. [Google Scholar]
- Gupta, K.; Dharni, K. Use and influence of nutrition labeling: An emerging market experience. Nutr. Food Sci. 2016, 46, 441–456. [Google Scholar] [CrossRef]
- Govindasamy, R.; Italia, J. The influence of consumer demographic characteristics on nutritional label usage. J. Food Prod. Mark. 2000, 5, 55–68. [Google Scholar] [CrossRef]
- McLean-Meyinsse, P.E. An analysis of nutritional label use in the southern united states. J. Food Distr. Res. 2001, 3, 110–114. [Google Scholar]
- Krešić, G.; Mrduljaš, N. The relationship between knowledge and the use of nutrition information on food package. Acta Aliment. 2016, 45, 36–44. [Google Scholar]
- Department of Disease Control, Ministry of Health, PRC. Guidelines for the Prevention and Control of Overweight and Obesity in Chinese Adults; People’s Medical Publishing House: Beijing, China, 2006.
- Zhang, Y.; Chen, J.T.; Wang, S.; Andrews, J.C.; Levy, A. How do consumers use nutrition labels on food products in the United States? Top. Clin. Nutr. 2017, 32, 161–171. [Google Scholar] [CrossRef] [Green Version]
- Christoph, M.J.; An, R.; Ellison, B. Correlates of nutrition label use among college students and young adults: A review. Public Health Nutri. 2015, 19, 2135–2148. [Google Scholar] [CrossRef] [PubMed] [Green Version]
- Cooke, R.; Papadaki, A. Nutrition label use mediates the positive relationship between nutrition knowledge and attitudes towards healthy eating with dietary quality among university students in the UK. Appetite 2014, 83, 297–303. [Google Scholar] [CrossRef]
- Frieden, T.R.; Dietz, W.; Collins, J. Reducing childhood obesity through policy change: Acting now to prevent obesity. Health Aff. 2010, 29, 357–363. [Google Scholar] [CrossRef] [PubMed]
- Hobin, E.; Shen-Tu, G.; Sacco, J.; White, C.; Bowman, C.; Sheeshka, J.; Hammond, D. Comprehension and use of nutrition facts tables among adolescents and young adults in Canada. Can. J. Diet. Pract. Res. 2016, 77, 59–65. [Google Scholar] [CrossRef]
- Sun, P.; Huang, H.; Chu, F. Factors instead of demographic characteristics related to nutrition label use. Brit. Food J. 2015, 117, 3024–3038. [Google Scholar] [CrossRef]
- Rose, T.M.; Unni, E.J.; Jones, G.J. Factors influencing nutrition label reading behavior in individuals with selected chronic diseases. Am. J. Health Educ. 2018, 49, 296–304. [Google Scholar] [CrossRef]
- Chinese Nutrition Society. Dietary Guidelines for Chinese Residents; People’s Medical Publishing House: Beijing, China, 2016. [Google Scholar]
- Yee, N.S.; Shao, Q.; Uraipong, C.; Shoji, M.; Lee, N.A. Comprehensive survey of allergen labeling on pre-packaged food products imported from Mainland China. Food Control. 2020, 123, 107749. [Google Scholar] [CrossRef]
- Wang, O.; Somogyi, S. Consumer adoption of online food shopping in China. Brit. Food J. 2018, 120, 2868–2884. [Google Scholar] [CrossRef]
- Hess, S.; Yanes, M.; Jourdan, P.; Edelstein, S. Trans fat knowledge is related to education level and nutrition facts label use in health-conscious adults. Top. Clin. Nutr. 2005, 20, 109–117. [Google Scholar] [CrossRef]
- Kaplan, G.; Baron-Epel, O. What lies behind the subjective evaluation of health status? Soc. Sci. Med. 2003, 56, 1669–1676. [Google Scholar] [CrossRef]
- Allison, D.B.; Gadbury, G.; Schwartz, L.G.; Murugesan, R.; Kraker, J.L.; Heshka, S.; Fontaine, K.R.; Heymsfield, S.B. A novel soy-based meal replacement formula for weight loss among obese individuals: A randomized controlled clinical trial. Eur. J. Clin. Nutr. 2003, 57, 514–522. [Google Scholar] [CrossRef] [Green Version]
- Fernandez, M.K.; Titchenal, C.A.; Stewart, M.L.; Dobbs, J. Can you trust nutrition facts from meat-alternative food products? J. Am. Diet Assoc. 2011, 111, 46. [Google Scholar] [CrossRef]
- Lucas, P. Bayesian analysis, pattern analysis, and data mining in health care. Curr. Opin. Crit. Care 2004, 10, 399–403. [Google Scholar] [CrossRef] [PubMed] [Green Version]
Publisher’s Note: MDPI stays neutral with regard to jurisdictional claims in published maps and institutional affiliations. |
© 2022 by the authors. Licensee MDPI, Basel, Switzerland. This article is an open access article distributed under the terms and conditions of the Creative Commons Attribution (CC BY) license (https://creativecommons.org/licenses/by/4.0/).