Article

Spatially Resolved Distribution, Sources, Exposure Levels, and Health Risks of Heavy Metals in <63 μm Size-Fractionated Road Dust from Lucknow City, North India

1
Department of Environmental Sciences, Hemvati Nandan Bahuguna Garhwal University, Srinagar 246174, Uttarakhand, India
2
Department of Geology, University of Lucknow, Lucknow 226007, Uttar Pradesh, India
3
Department of Civil Engineering, Karunya Institute of Technology and Sciences Coimbatore, Coimbatore 641114, Tamil Nadu, India
*
Authors to whom correspondence should be addressed.
Int. J. Environ. Res. Public Health 2022, 19(19), 12898; https://doi.org/10.3390/ijerph191912898
Submission received: 23 July 2022 / Revised: 27 September 2022 / Accepted: 5 October 2022 / Published: 8 October 2022
(This article belongs to the Section Air)

Abstract

:
In the present study, a total of 64 road dust samples were collected from five different functional areas (residential, commercial, parks, high-traffic, and industrial) in urban Lucknow to assess the accumulation, distribution, and health risk of heavy metals (HMs) (i.e., Fe, Mn, Zn, Cu, Pb, Cd, As, Cr and Ni). Acid digestion methods were used to analyze HMs, followed by inductively coupled plasma-mass spectrometry (ICPMS). The ascending frequency of HMs was Cd < As < Ni < Cr < Pb < Cu < Zn < Mn < Fe for all different functional areas. Almost all HMs exceed the limits of Indian natural soil background values (INSB) across all functional areas. The pollution assessment results reveal that the urban road dust of Lucknow is highly enriched with Zn and Pb, causing deterioration of dust quality. The spatial distribution of HMs shows that road dust found in the central and southwestern zones of the Lucknow urban area are more contaminated than in other areas. The ecological risk assessment demonstrates that Cd was the highest risk contributor, followed by Pb, Zn and Cu. The result of the health risk assessment i.e., the cumulative hazard index (HI) and the cumulative lifetime cancer risk (LCR), reveal that children (mean HIchildren = 1.26, LCRchildren = 0.000187) are more vulnerable to HM exposure than adults (HIadults = 0.14, LCRadults = 0.0000804). For carcinogenic and non-carcinogenic risk, ingestion appears to be the major pathway of HM exposure in both age groups. It is alarming that all studied four carcinogenic HMs were found in concentrations higher than 1 × 10⁻⁶ (the permissible limit for humans). This indicates slight chances of developing cancer for both age groups in all functional areas.

1. Introduction

Dust particles are ubiquitous. No one is untouched from dust exposure, indoors or outdoors. Apart from natural sources, dust particles are produced from various anthropogenic sources in urban areas, such as fossil fuel burning, vehicular emissions, industrial operations, waste incineration, construction, demolition, and weathering of road surface material [1,2,3,4]. Road dust particles are mainly generated via road-related activities and are loaded with various inorganic and organic compounds [5]. HMs are one of the most dangerous substances due to their non-biodegradability, accumulation in other environmental components, and ability to create toxicity in humans [6]. Vehicular-fuel-burning and non-fuel-burning activities are primarily responsible for HMs in road dust. HMs in road dust are primarily linked with vehicle exhaust and non-exhaust emissions [7,8]. Vehicular exhaust emissions include petrol and diesel burning and the non-exhaust category includes wear and tear of tires and brake pads, corrosion of batteries and metallic parts, and road surface degradation. Emissions from nearby industries, incineration activities, solid waste disposal, and construction and demolition activities also play an important role in increasing HMs in an urban environment [5,9,10]. Various meteorological factors such as temperature, wind direction and velocity, frequency and intensity of rain, and preceding dry periods influence the deposition, distribution, and concentration of HMs in road-deposited dust. Other factors such as the particle size of the pollutant, vegetation cover, population density, traffic volume, road surface conditions, highway or road design, and the material of road surfaces also affect the concentration and distribution of HMs in the dust deposited on road surfaces [4,11,12].
Road dust particles contain several chemical components including HMs. Human beings are exposed to road dust via ingestion through the mouth, inhalation via the nose, and dermal contact or absorption of dust particles with skin [3,13]. Dust contaminated with HMs can pose serious threats to human health and the environment. Excessive intake of HMs can lead to neurological and reproductive system dysfunction, gastrointestinal issues, kidney failure, and cardiovascular as well as bone diseases [13,14,15]. Even at very low concentrations, HMs can accumulate in human internal organs and can cause health hazards. Pb and Zn are toxic to the central nervous system. Overexposure to Fe and Mn can cause neurological disorders, cardiovascular disease, Parkinson’s disease, and Huntington’s disease [16,17]. Pb is often associated with low IQ and can affect children’s behaviors and create learning issues in children [18,19,20,21]. Pb and As can cause damage to the central nervous system and the immunological system, and can cause renal dysfunction, dermal lesions, skin cancer, and hypertension [14,22,23,24]. Long-term exposure to HM-enriched dust can also cause respiratory problems, especially in asthmatic people [25,26]. Continuous exposure to HMs such as Cd, As, Ni, and Cr can be carcinogenic to respiratory organs and cause human lung cancer [27].
Although numerous studies [2,13,22,28,29,30,31,32,33] on HM contamination of road dust have been carried out around the world, very little information is available for countries such as India, where a huge percentage (17.7%) of the total world population lives (Census of India, 2011). However, most studies [5,6,8,23,34] have focused only on concentration levels and pollution status, and information regarding spatial distribution and health in different functional areas is very limited [3,35,36]. Rapid urbanization has transpired in the Lucknow district over the previous decade, particularly in the Lucknow urban area, resulting in high population and vehicular density in the city, which has also increased pollution levels in the city (Ministry of Road Transport & Highways, Government of India). Therefore, the present study primarily focuses on the following objectives: (1) Determining the concentration and spatial distribution of HMs in road dust collected from different functional areas in the Lucknow urban area; (2) Presenting the source appointment for different HMs in road dust using principal component analysis; (3) Evaluating and assessing HM pollution in different functional areas in road dust over the Lucknow urban areas; (4) Quantifying ecological and human health risk assessment. The present study aims to establish baseline data on HM concentration associated with road dust, ultimately influencing air quality and human health quality in urban areas. Moreover, the main focus of the study is allowing government officials and the general public to gain insight into the toxicity and health risks of metal-bound dust, leading to better understanding of how to control them.

2. Materials and Methods
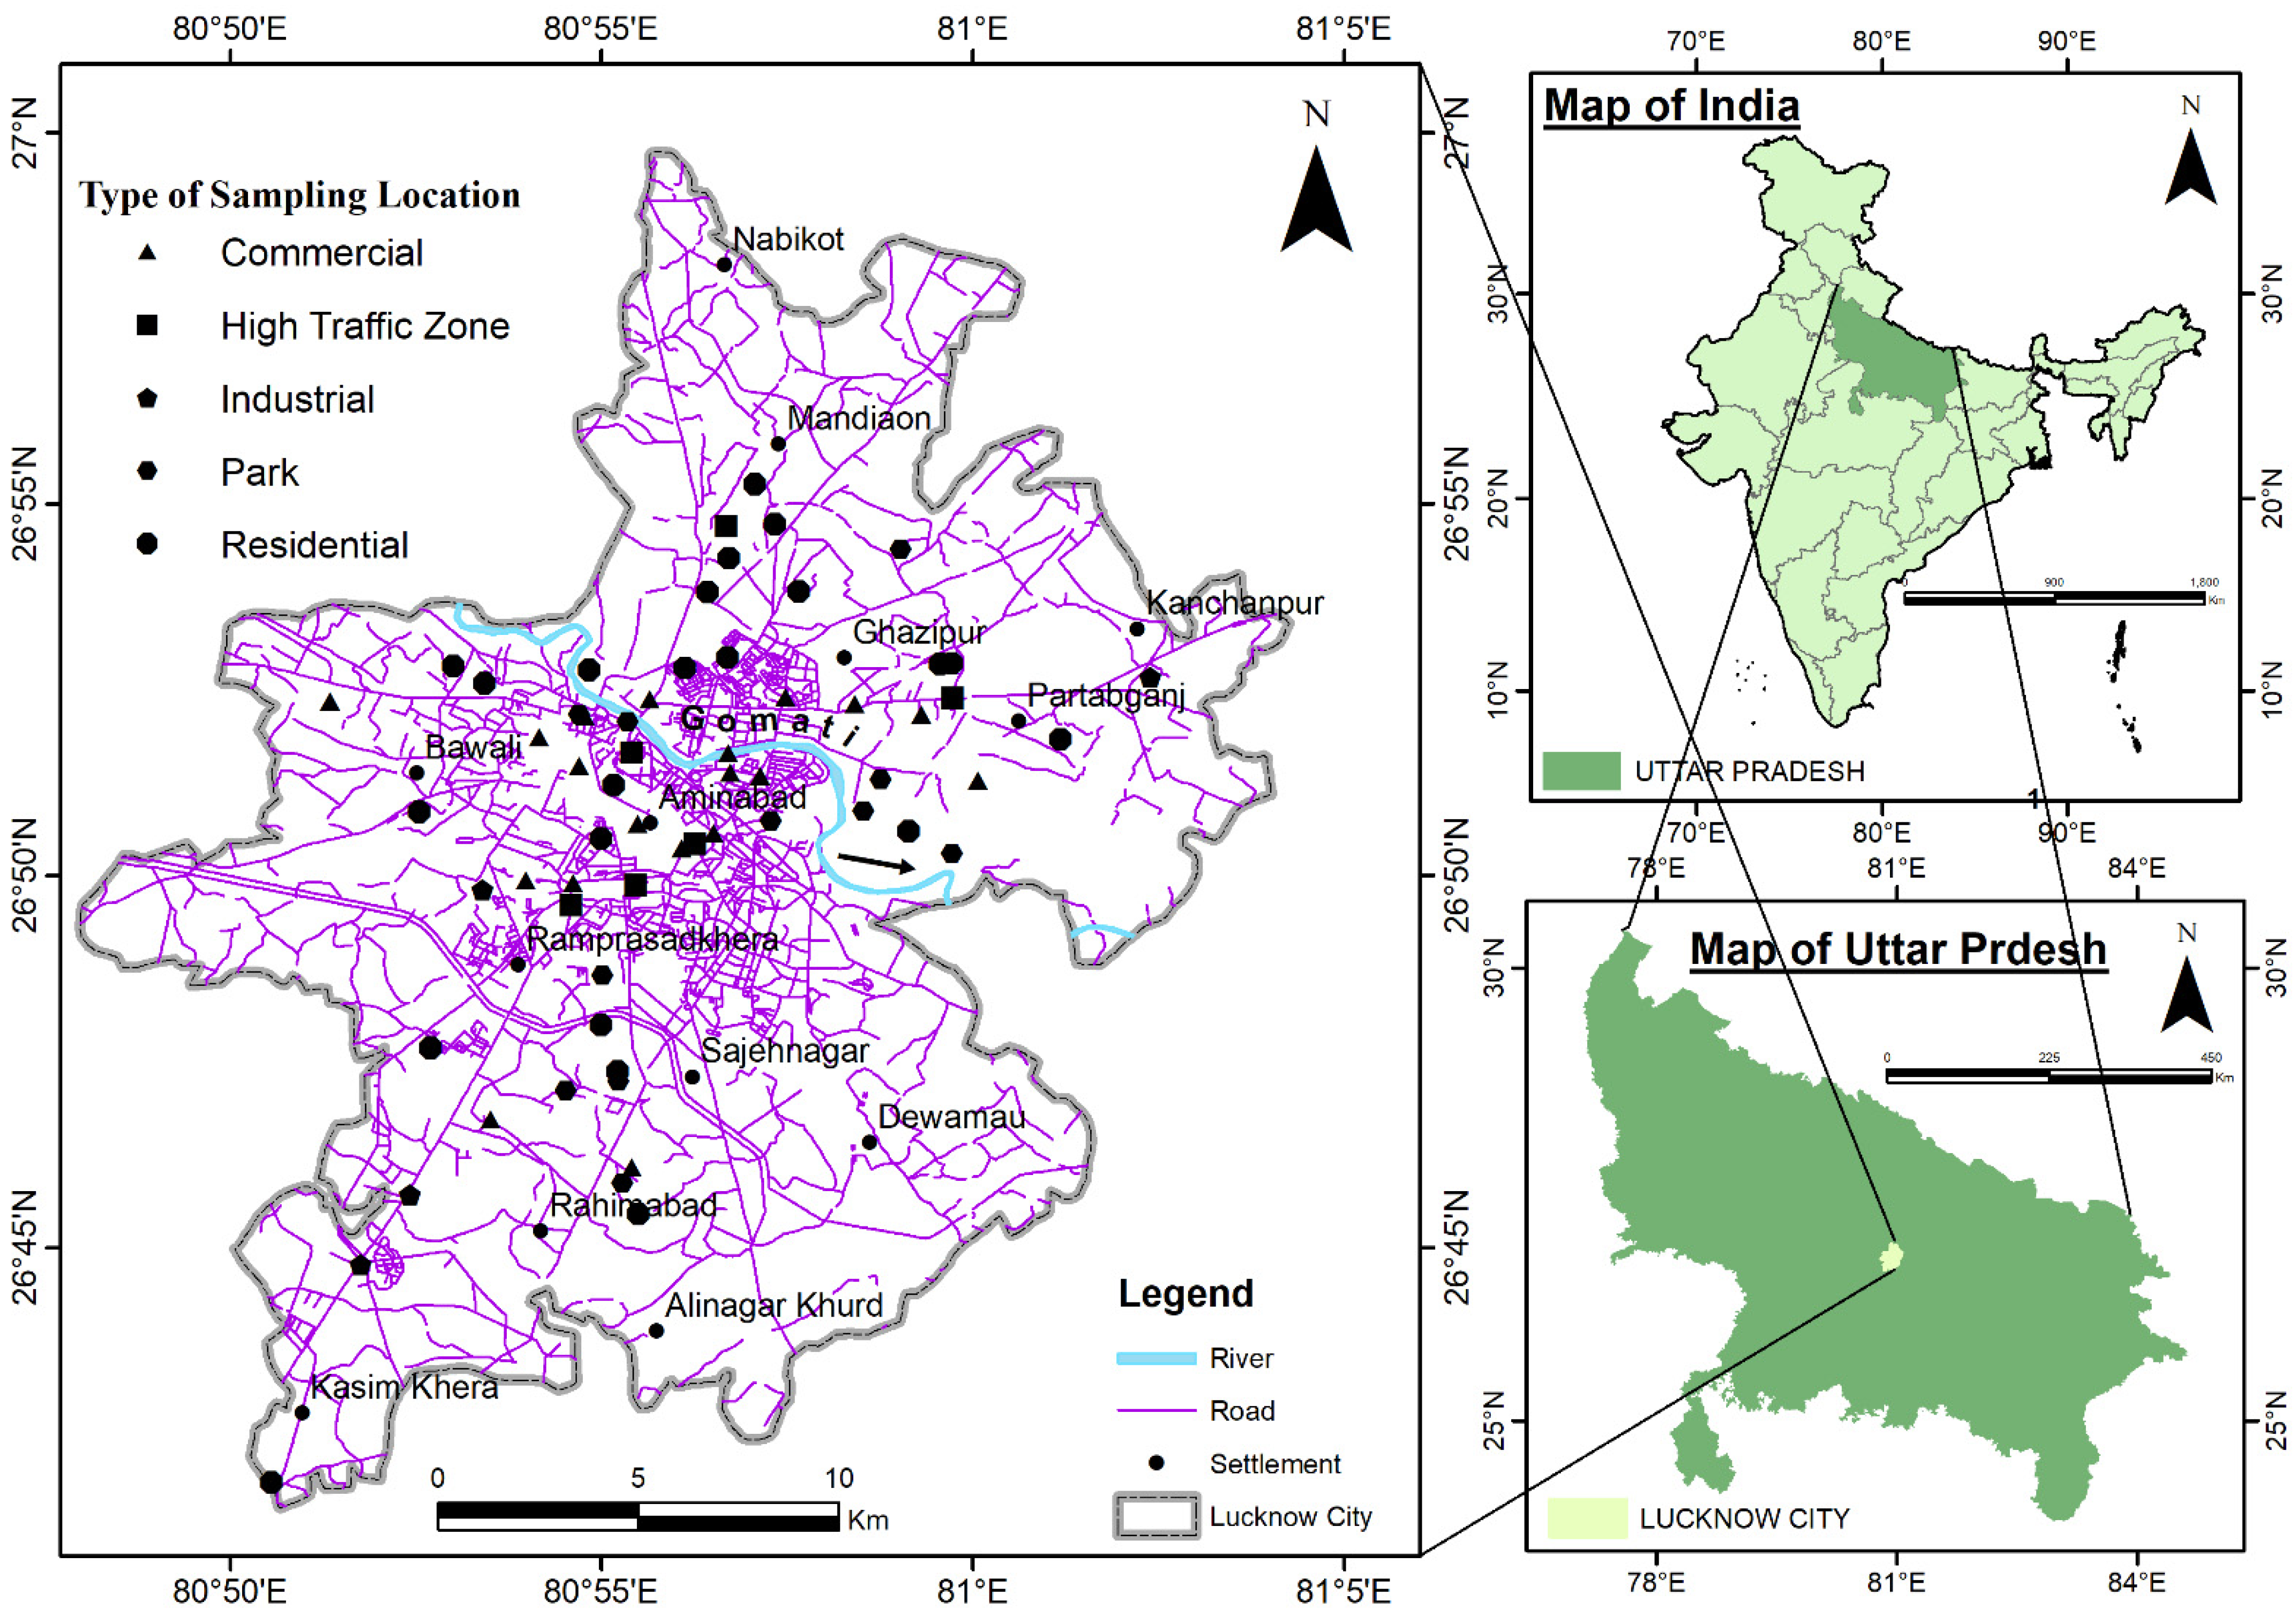
2.1. Study Area

The present study was carried out in Lucknow, an urban area, which is the capital city of Uttar Pradesh (Figure 1). Figure 1 presents a map of Lucknow indicating 64 sampling locations representing five different functional areas i.e., residential (N = 23), commercial (N = 19), high-traffic areas (N = 6), parks (N = 12), and industrial areas (N = 4) throughout the study area. The city lies at 80°56’ E longitude and 26°30’ N latitude and is 128 m above sea level. It has a total area of approximately 310 km2. Good infrastructure, the presence of various other amenities, and well-connected routes of transportation make Lucknow the second-largest urban/metropolitan city of India with a population of 2,902,290, of which 1,509,451 are males and 1,393,469 are females (Census, India 2011). Due to the large population and well-connected road system, Lucknow experiences high vehicular flux throughout the year. The total registered vehicular population in Lucknow was 2,194,261 in 2018–2019 and 2,407,190 in 2019–2020, which is a 9.70% growth over the previous year (Source: Regional Transport Office, Lucknow).

2.2. Sample Collection and Chemical Analysis

A total of 64 road dust samples were collected under stable weather conditions in the cold and dry seasons during the month of January 2020. All sampling locations are mentioned in Table 1. From each sampling location, 2–3 sub-sites were chosen for road dust collection. Approximately 400–500 g of dust was collected from each sampling location with a small clean plastic brush and a dustpan. Dust was collected from the middle and sides of the road in each sampling site. After that, the sample was transferred to the laboratory in labeled self-sealing polythene bags. In the laboratory, road dust samples were air-dried and sieved with a 2 mm mesh to remove large particles. The remaining dust was again sieved using a stainless-steel sieve with a 63 μm mesh size. A smaller size fraction (<63 μm) of road dust was used for HMs analysis because of their affinity to absorb a higher amount of HMs which can cause more health hazards and remain suspended in the air for a prolonged time [3,8].
The HMs concentration in the road dust was determined by the acid digestion method as prescribed by USEPA 3050B [37]. A total of 1 g of dried homogenized road dust was digested with a 3:1 mixture of 9 mL nitric acid (HNO3) and 3 mL hydrochloric acid (HCl) on a hot plate. The solution was heated on the hotplate at 95 °C ± 5 and allowed to evaporate with boiling until 1–2 mL of solution remained. To minimize the effervescence, 2 mL of hydrogen peroxide (H2O2) was added. Following digestion, the sample was cooled down and filtered through a Whatman Filter (No.42) in a pre-marked test tube and the resulting solution was then diluted up to 15 mL using deionized water. The HMs were analyzed in the samples using inductively coupled plasma-mass spectrometry (ICP-MS, Perkin Elmer, Make: Agilent, Model no. NexION 300X) [3,4,37].Prior to analysis, the instrument was calibrated for each metal using a series of known standards. Different series of working standards were prepared for different HMs through serial dilution using a multi-element stock solution of 1000 ppm (Inorganic Venture IV-ICPMS-71A). For each HM, a different series of working standards were prepared. Reagent blanks and duplicate samples were used as quality control for the strong acid digestion procedure. Type-I Milli-Q ultra-pure water was used to prepare solutions, dilutions, and blanks throughout the procedures. All utensils used in the analysis were cleaned with 10% v/v HNO3 followed by ultra-pure deionized water before usage [3].

2.3. Pollution Assessment

Two different methods were used to evaluate the pollution levels for HMs in the dust: (i) pollution index (PI) and integrated pollution index (IPI) and (ii) geo-accumulation index (Igeo).
PI and IPI values indicate the function of HMs and are used to assess HM contamination in road dust [38]. The PI for each HM was determined by dividing each metal’s HM concentration by the respective HM’s background value [28].
PI = C B
where C represents the HM concentration and B represents the HM background values.
The IPI is the mean value of the PIs of HM studied in the road dust.
IPI = PI 1 + PI 2 + .   .   .   .   .   .   .   .   .   .   .   .   .   .   .   .   PI n n
where PI indicates the HM’s pollution index and n indicates the total number of studied HMs.
The PI and IPI of all HMs were classified into three and four categories, respectively, which are shown in Table 2.
The geo-accumulation index (Igeo) index wasp roposed by Muller [39] and has been widely used to assess the pollution level of heavy metals in road dust [33,40,41]:
I geo = Log 2 C i 1.5 × B i
where Ci is the concentration of i HM and Bi is the background value of i HM. The textural matrix modification factor due to lithosphere impacts is constant i.e., 1.5 [28,41]. The Igeo pollution level is categorized into seven categories as follows: Igeo < 0 (unpolluted); 0 ≤ Igeo ≤ 1 (unpolluted to moderately polluted); 1 ≤ Igeo ≤ 2 (moderately polluted); 2 ≤ Igeo ≤ 3 (moderately to strongly polluted); 3 ≤ Igeo ≤ 4 (strongly polluted); 4 ≤ Igeo ≤ 5 (strongly to extremely polluted); and Igeo ≥ 5 (extremely polluted).
The Indian natural soil background values (INSB) [42,43] were adopted as background values to calculate the pollution indices (PI and Igeo),because the background values of HMs in road dust were unavailable.

2.4. Statistical Analysis

The statistical analysis was carried out using Microsoft Excel (Version 7, Microsoft Corporation, Washington, DC, USA). Statistical Package for the Social Sciences (IBM SPSS Inc. Version 22.0, New York, NY, USA) was used to conduct principal component analysis (PCA) to determine the possible sources of HMs in road dust.

2.5. Spatial Distribution

The concentrations of nine HMs (Fe, Mn, Zn, Ni, Cu, Pb, As, Cr, and Cd) were mapped to analyze the distribution of HMs across Lucknow city and to identify the pollution-sensitive areas by an inverse distance weighting (IDW) interpolation method through Arc GIS software (Version 10.4, ESRI, Readlands, CA, USA).

2.6. Risk Assessment

2.6.1. Potential Ecological Risk (PER)

The potential ecological risk index (PER) was developed by Hakanson [44] to assess the risk levels of HMs in road dust particles [5,33,44,45]. PER was calculated using the following formula:
PER = ∑Er = ∑Tr × PI
where Er is the ecological risk factor of HM and Tr is the toxic-response factor of HM (Table 3) As the toxic response factor of Fe is not available, only eight metals are included in the PER study. PI is the pollution index of the HM. Hakanson [44] classified Er and PER into five and four potential risk categories, respectively, which are given in Table 2.

2.6.2. Health Risk Assessment

Health risk assessment (HRA) was performed using the health risk framework model developed by the United States Environmental Protection Agency [46] for both children and adults for HMs in road dust samples collected from different functional areas. The non-carcinogenic risk was calculated for all studied HMs, but the carcinogenic risk was calculated only for class 1 carcinogenic heavy metals i.e., Cd, As, Cr, and Ni, [47]. Human exposure to HMs mainly happens through three exposure routes i.e., ingestion, inhalation, and dermal contact, which were calculated in the form of the average daily intake (ADI) for both children and adults using the following formulas:
ADIingestion   =   C   × IngR × ED × EF BW × AT × 10 6
ADIinhalation =   C   × InhR × ED × EF PEF × BW × AT
ADIdermermal =   C   × SL × ABS × SA × ED × EF   BW × AT × 10 6
Table 3 lists the exposure factors used in ADI evaluation to assess the non-carcinogenic risk for children and adults based on USEPA [46].
The non-carcinogenic risk for both individuals via three different exposure pathways for each studied HM was assessed by calculating their respective HQ values, which are equal to the average daily dose divided by the reference dose of the corresponding HM [5,48]. Table 4 shows the values of the reference doses for studied HMs based on the US Environmental Protection Agency (USEPA) [49]. The cumulative non-carcinogenic risk, also known as hazard index (HI), via three exposure routes was calculated by adding their respective HQs (HI = HQing + HQinh + HQderm). According to USEPA [46], a HI value less than 1 (HI > 1) indicates that there is no significant adverse non-carcinogenic risk, whereas a HI value of more than 1 (HI < 1) indicates the possibility of non-carcinogenic risk in both children and adults [5,50].
The carcinogenic risk assessment for Cd, As, Cr and Ni in the dust samples was carried out by calculating the cancer risk (CR) and the lifetime cancer risk (LCR). CR is the ratio of the HMs average daily dose and cancer slope factor (CSF). The summation of the total cancer risk of a HM via three exposure routes (LCR = Cancer risking + Cancer riskinh + Cancer riskderm) is termed the lifetime cancer risk (LCR). CSF values for Cd, As Cr, and Ni are given in Table 4. For regulatory purposes, the tolerable range of cancer is 10−4 to 10−6 [49,50,51].

3. Results

3.1. Heavy Metal Concentration in Road Dust

Table 5 summarizes the descriptive analysis of HM concentrations in road dust measured in various functional areas in Lucknow city, India. The overall average HM concentrations in the road dust samples were 16,368.15 μg·g−1 for Fe, 374.15 μg g−1 for Mn, 289.85 μg g−1 for Zn, 139.66 μg g−1 for Cu, 97.34 μg g−1 for Pb, 1.29 μg g−1 for Cd, 8.82 μg g−1 for As, 87.29 μg g−1 for Cr, and 54.23 μg g−1 for Ni. Concerning mean concentration, the ascending order of HMs was Cd < As < Ni < Cr < Pb < Cu < Zn < Mn < Fe for all different functional areas. As there are no regulatory standards for HMs in road dust in India and other countries, the results were compared with the Indian natural soil background (INSB) values [42,44] and earth’s upper continental crust (UCC) [52] values (Table 6). The mean concentration of Zn, Pb, Cu, Mn, Ni, and Cd were 13.1-, 7.4-, 2.4-, 1.7-, 1.09-, and 1.40-times higher than the INSB values, respectively, whereas Fe and Cr were lower than the INSB values. The value of As concentration is not given in the INSB. The mean concentration of all studied HMs was greater than the UCC background values, except for Fe. The average concentration of Zn, Pb, Cu, Cr, Mn, Ni, and Cd were 5.5-, 5.7-, 9.7-, 2.4-, 1.7-, 2.9-, and 12.6-times higher than the UCC values, respectively. This shows that anthropogenic sources contribute a significant amount of HMs to the road dust in the urban environment of Lucknow.
The results of the present study are comparable to the observations of various cities in India and other countries (Table 6). It is seen that the levels of HMs (Fe, Mn, Zn, Cu, As, and Ni) in Lucknow are higher than in Dehradun (India), Xi’an (China), and Dezful (Iran). The level of Cr is higher than Dhanbad and Kolkata (India), Dhaka (Bangladesh), and Lahore (Pakistan), and lower than Delhi (India) and Kabul (Afghanistan). The level of Pb is comparable to Xi’an (China) and higher than Dhaka (Bangladesh) and Dezful (Afghanistan), but lower than Delhi, Dhanbad, Kolkata, and Dehradun (India), Lahore (Pakistan), and Kabul (Afghanistan). With respect to the functional areas, all studied nine HMs were found to be highest in the industrial areas, followed by high-traffic areas and commercial areas, and were lowest in residential and park zones. These results show similar trends to other functional area studies e.g.,Suryawanshi et al. [8] in Delhi (India), Kolakkandi et al. [36] in Kolkata (India), Wei et al. [53] in Beijing (China), and Rehman et al. [18] in Dhaka (Bangladesh), where industrial and high-traffic zones show the higher concentration of metals than other functional are as such as residential areas and parks. This is mainly due to high traffic densities and different industrial activities.

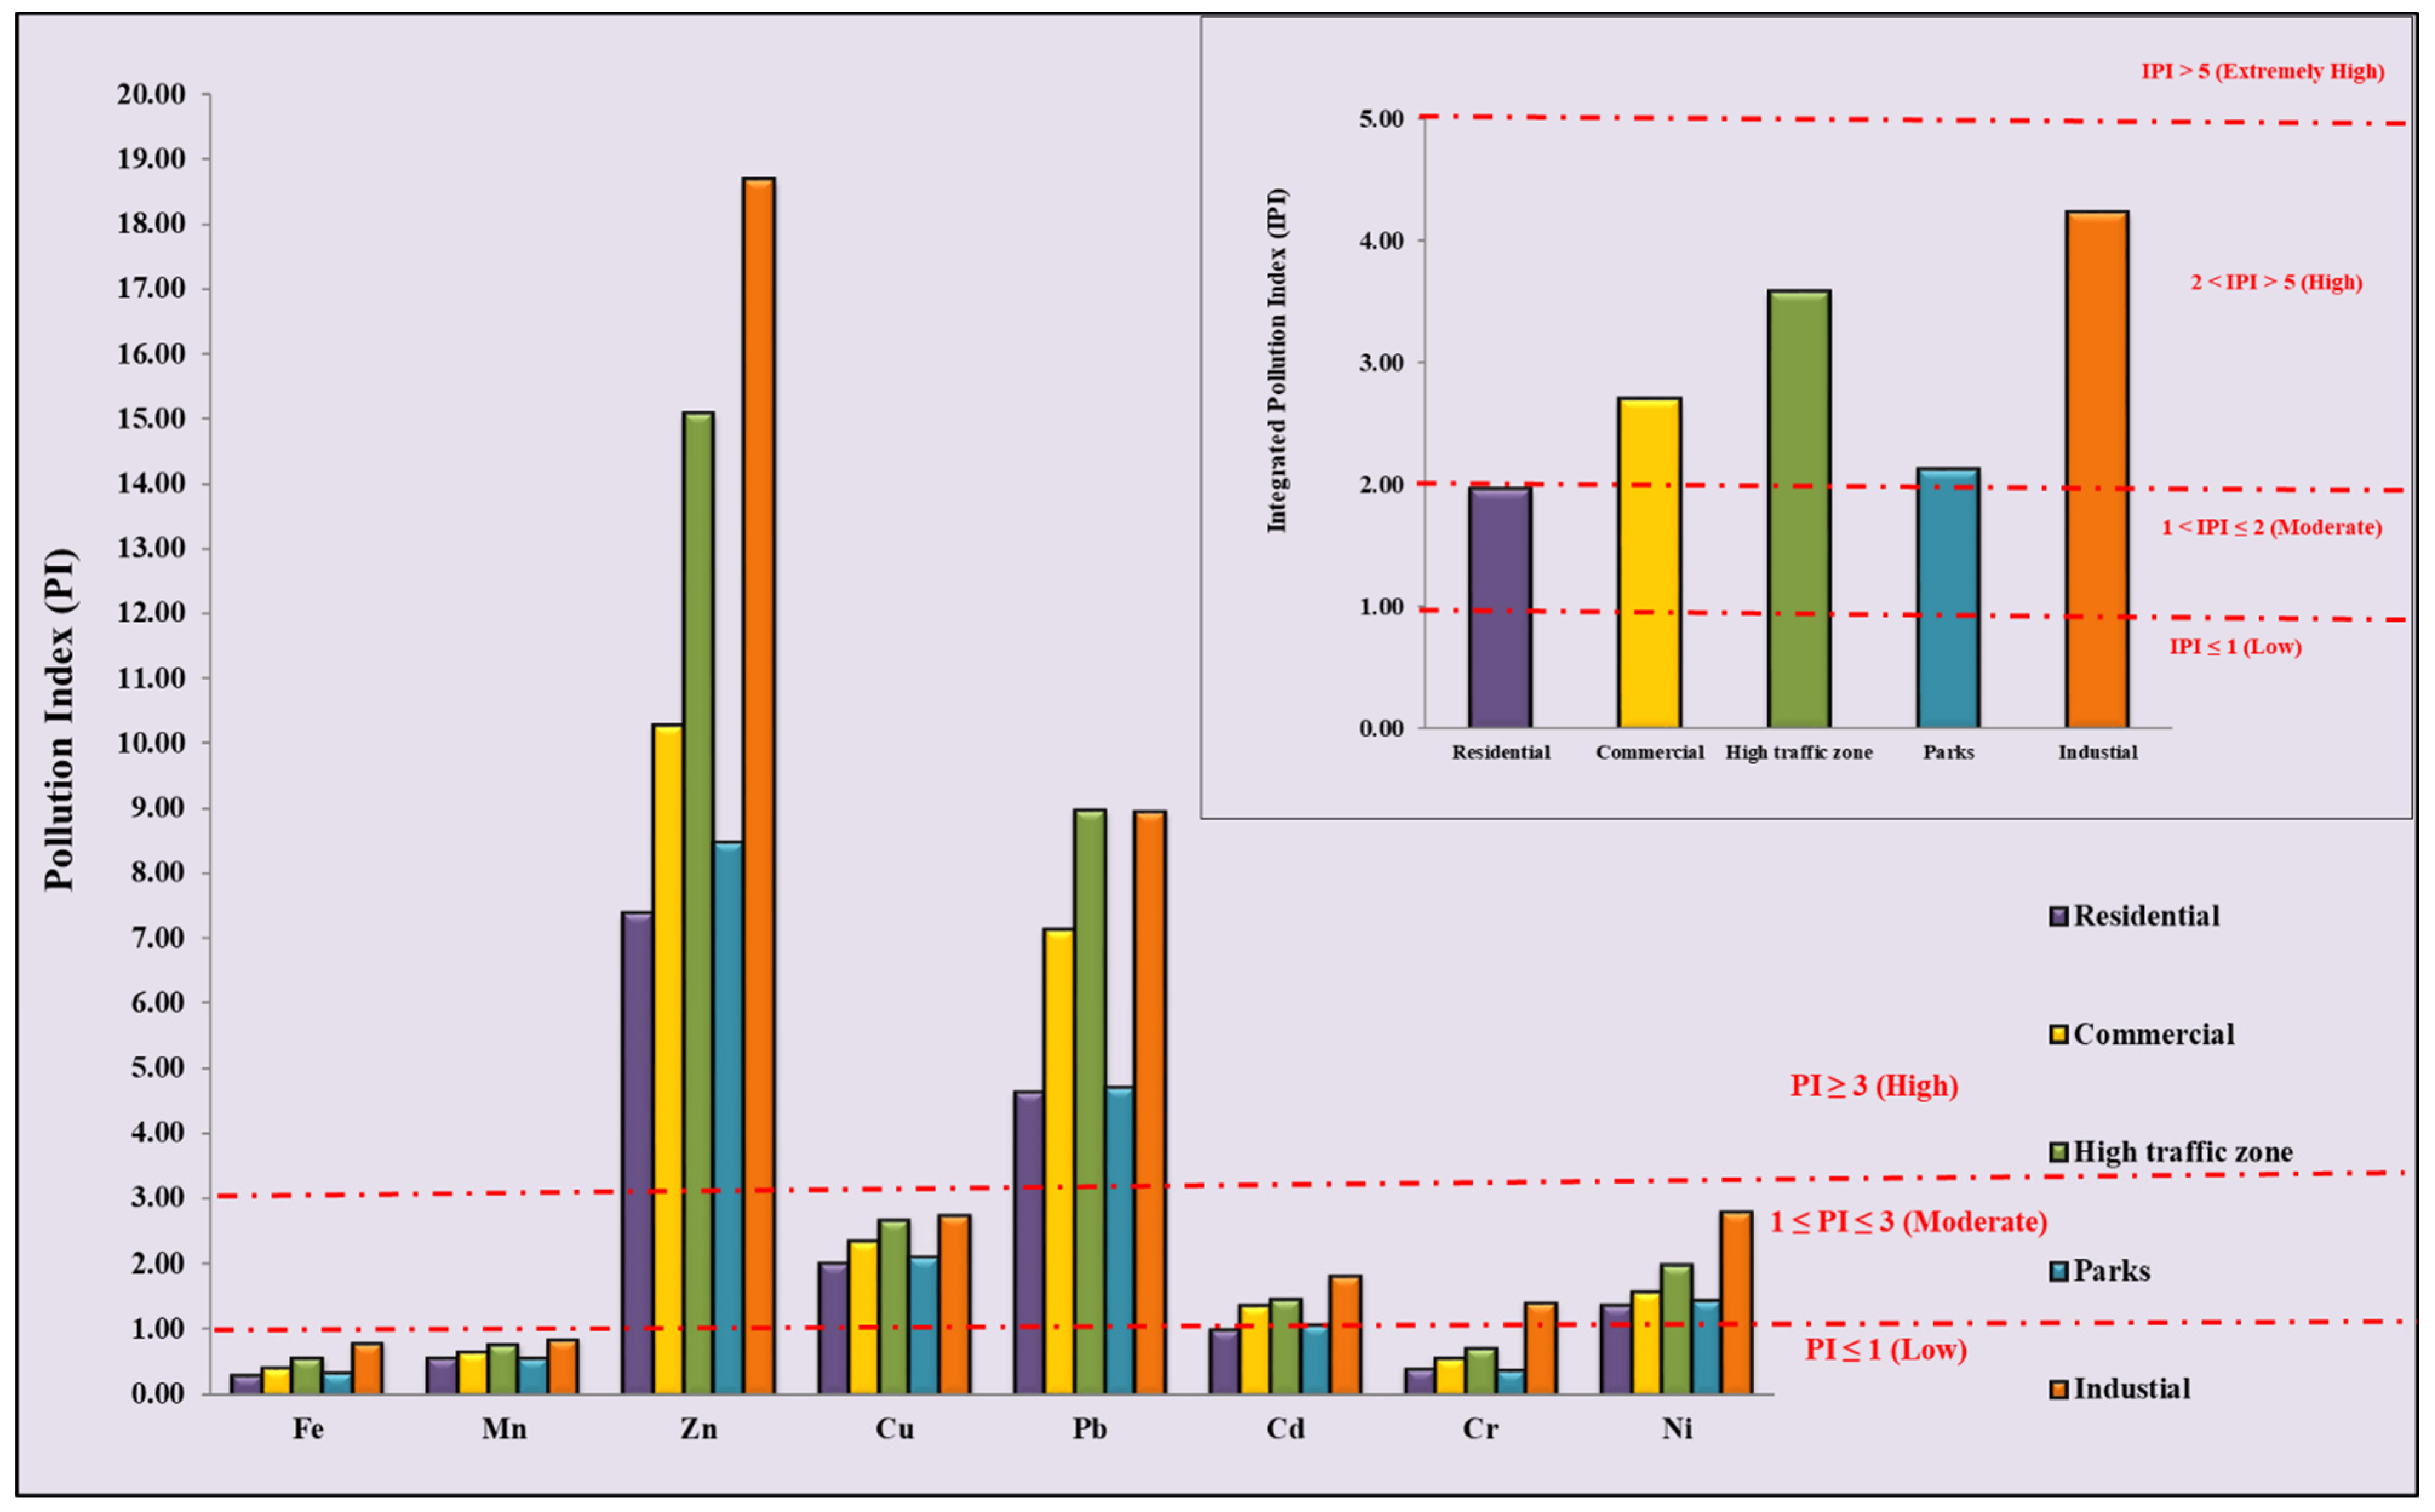
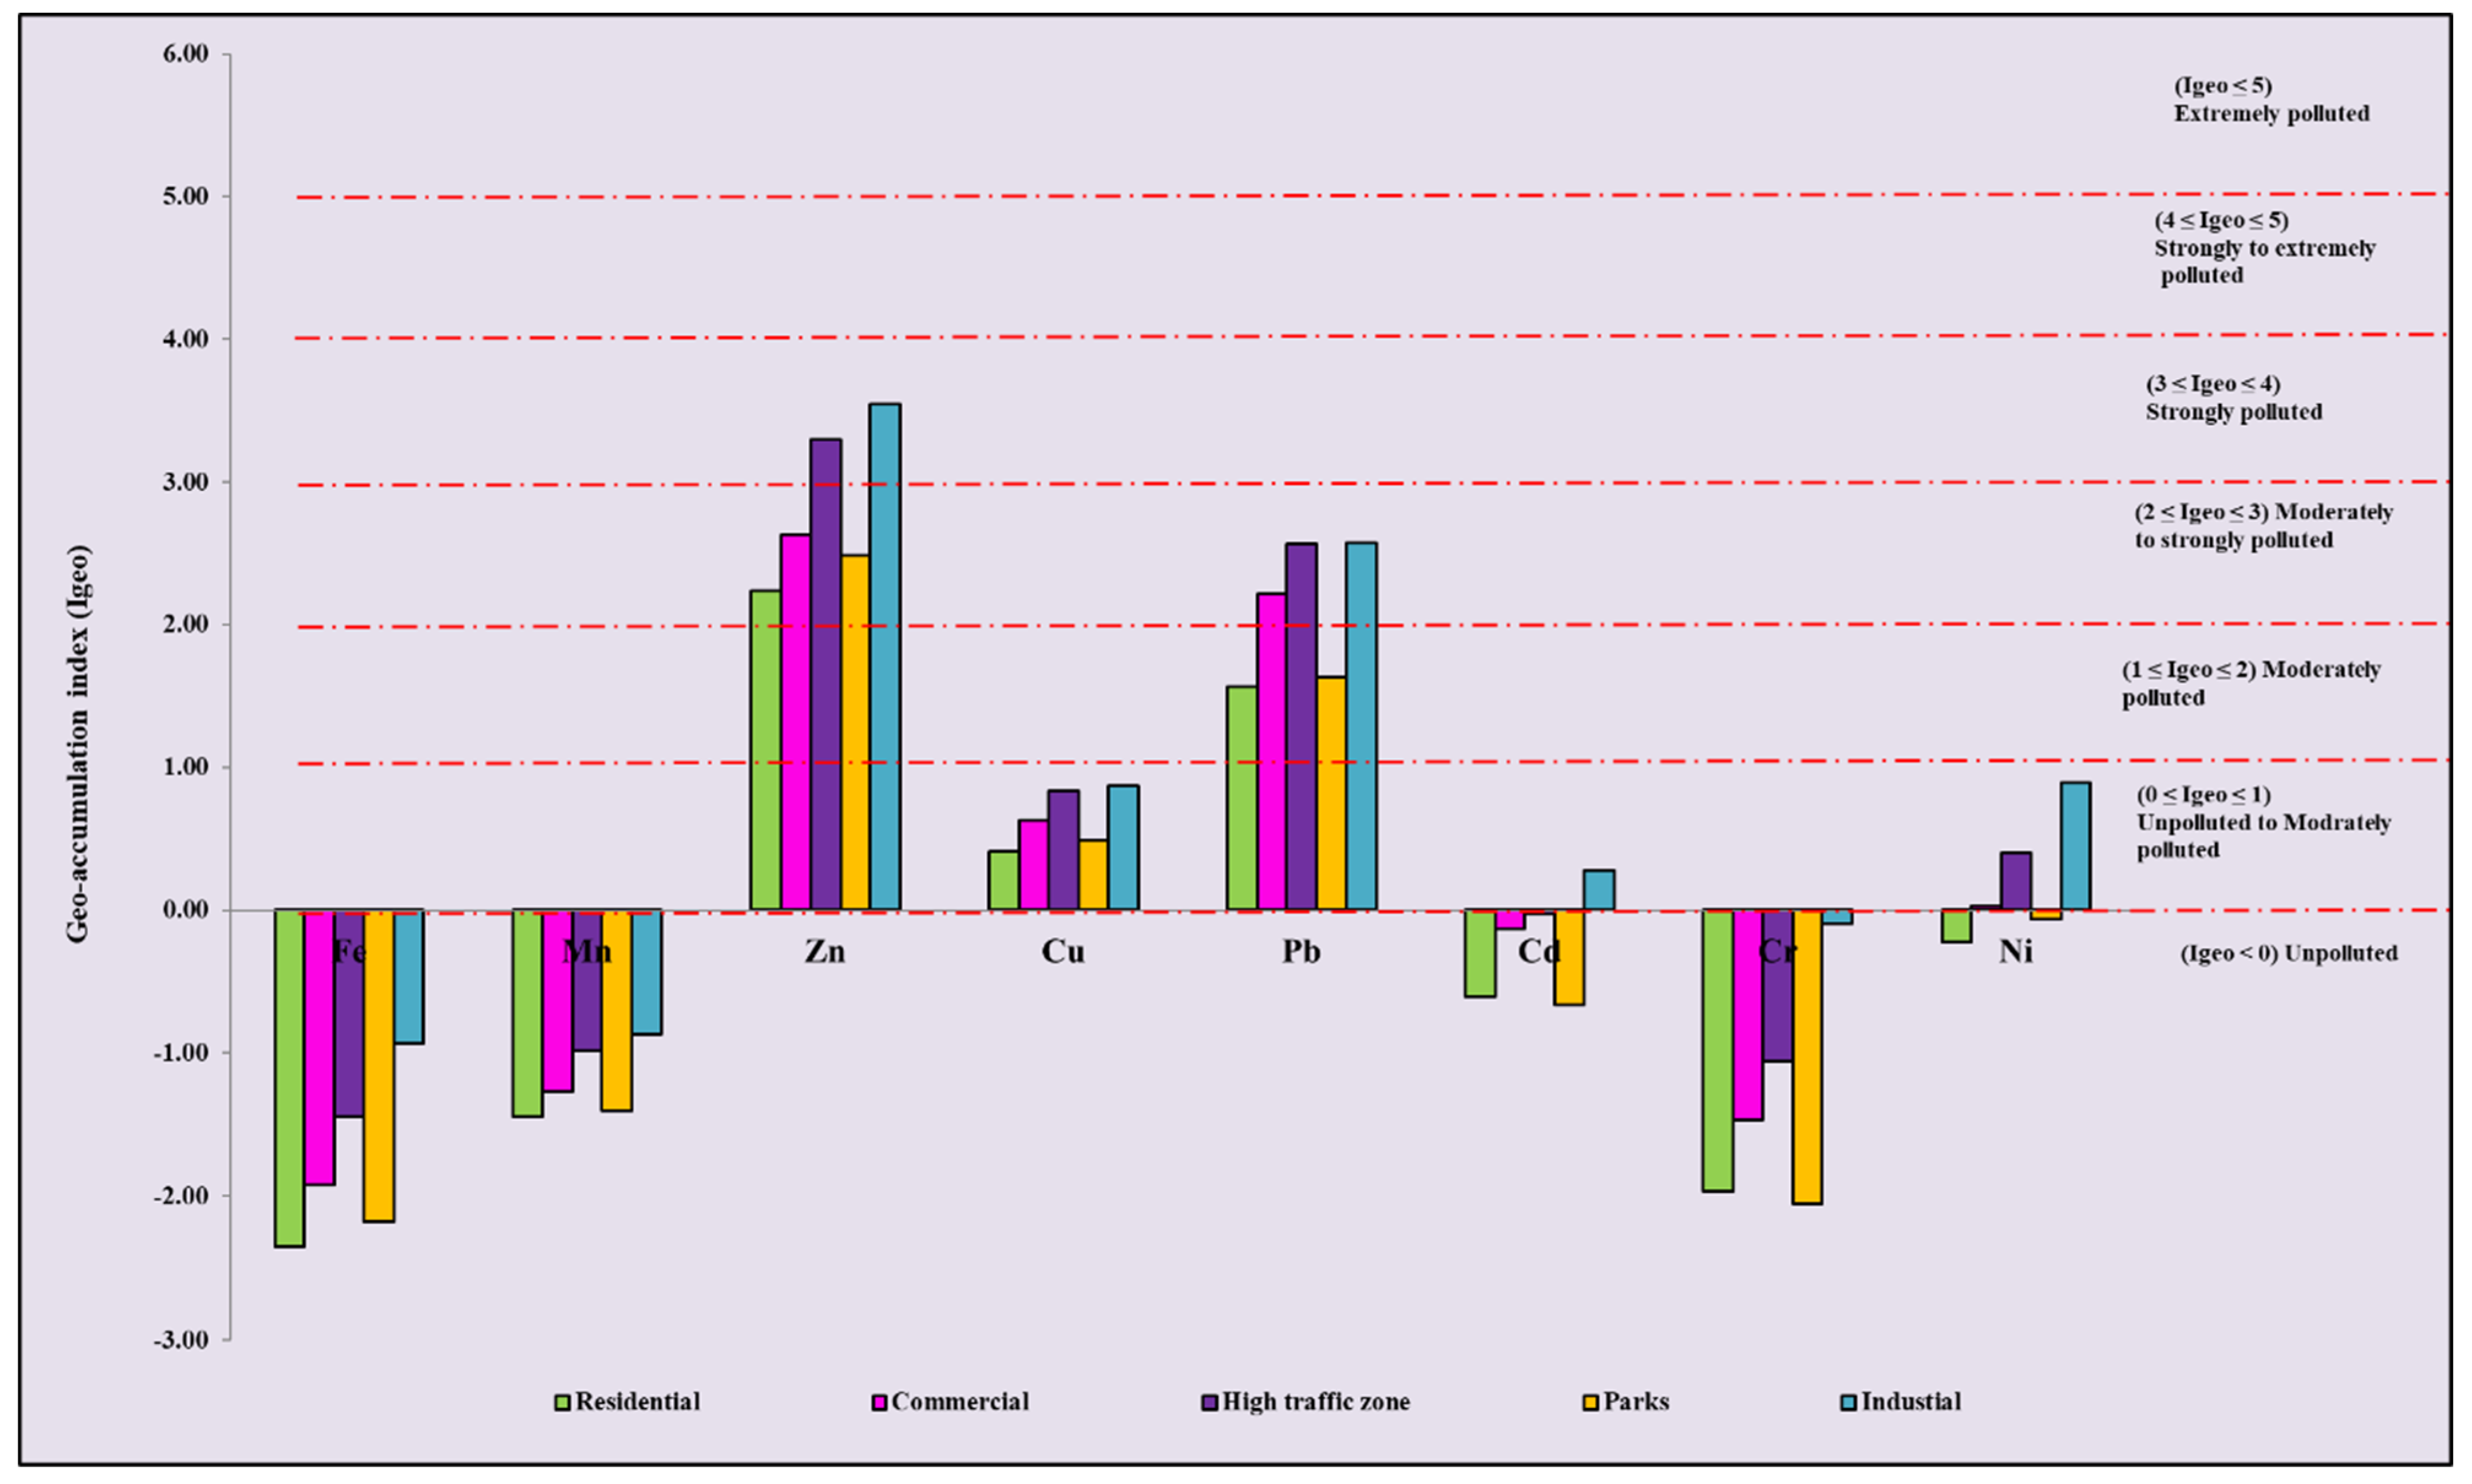
3.2. Pollution Assessment of Heavy Metals in Road Dust

The pollution assessment in different functional areas for the eight studied HMs is presented in Figure 2. Due to the unavailability of a background value of As in the INSB, the pollution assessment of As is not calculated. The PI values show that Zn and Pb fall in the high pollution level category in all functional areas. The average PI values show that Cu, Cd, and Ni come under the moderate pollution level category, while Cr, Fe, and Mn come under the low pollution level category. The descending order of PIs of studied HMs is Zn > Pb > Cu > Ni > Cd > Cr > Mn > Fe. The descending order of HM accumulation in different functional areas isas follows: industrial > high-traffic zone > commercial > parks > residential areas. Average IPI values show a high level of pollution (2 ≤ IPI ≤ 5) in all functional areas. This confirms that the sources of Zn, Pb, Cu, Cd, and Ni were ubiquitous over urban Lucknow and mainly come from traffic emissions and industrial activity. Cr, Fe, and Mn come from mixed sources and their geogenic contribution is significant for these three HMs. The results of the present study show that out of a total of 64 sampling sites, 71.88% of sites fall into the high pollution category (2 ≤ IPI ≤ 5), 26.56% of sites fall into the moderate pollution category (1 ≤ IPI ≤ 2) and 1.56% of locations fall into the extremely high pollution category (IPI > 5), indicating the high pollution level in the Lucknow urban area.
Figure 3 shows the Igeo values of HMs in all five studied functional areas. The descending order for the average Igeo values is as follows: Zn > Pb > Cu > Ni > Cd > Mn > Cr > Fe. The value of Zn shows that the road dust of industrial and high-traffic areas is heavily polluted, whereas commercial, parks, and residential areas are moderately to heavily polluted with Zn. Pb values indicate moderate pollution levels in residential and parks areas, and moderate to heavy pollution levels in commercial, high traffic, and industrial areas. In all different functional areas, Cu showed an unpolluted to moderate pollution level. In industrial, commercial, and high-traffic areas, Ni values indicate unpolluted to moderate pollution levels, but in residential and park areas, Ni values indicate low pollution. Cd only shows unpolluted to moderate pollution in industrial areas and low pollution in other functional areas. Cr, Fe, and Mn are in the unpolluted category in all different functional areas. It is seen that the industrial areas were the most polluted among the five functional areas, followed by high-traffic areas; Zn and Pb are the most common HMs among the studied HMs.

3.3. Source Appointment of Heavy Metals in Road Dust

PCA was used to appoint HM sources in the road dust across the study areas. Table 7 summarizes the PCA results, including PCA component factors, eigenvalues, percentage variance, and the cumulative percentage variance. The PCA data showed three main components with an eigenvalue greater than 1, accounting for 84.41% of the total variance. The first component was dominated by Mn, Zn, Cu, and Pb, which account for 33.66% of the total variance and represent the anthropogenic source of origin, which could be vehicular emissions (exhaust and non-exhaust sources). The second component was dominated by Fe, Cr, and Ni, accounting for 27.55% of the total variance. These metals come into road dust via both sources i.e., anthropogenic and natural. Component 3, which accounts for 23.30% of the total variance, was dominated by Cd and As and represents the industrial source.

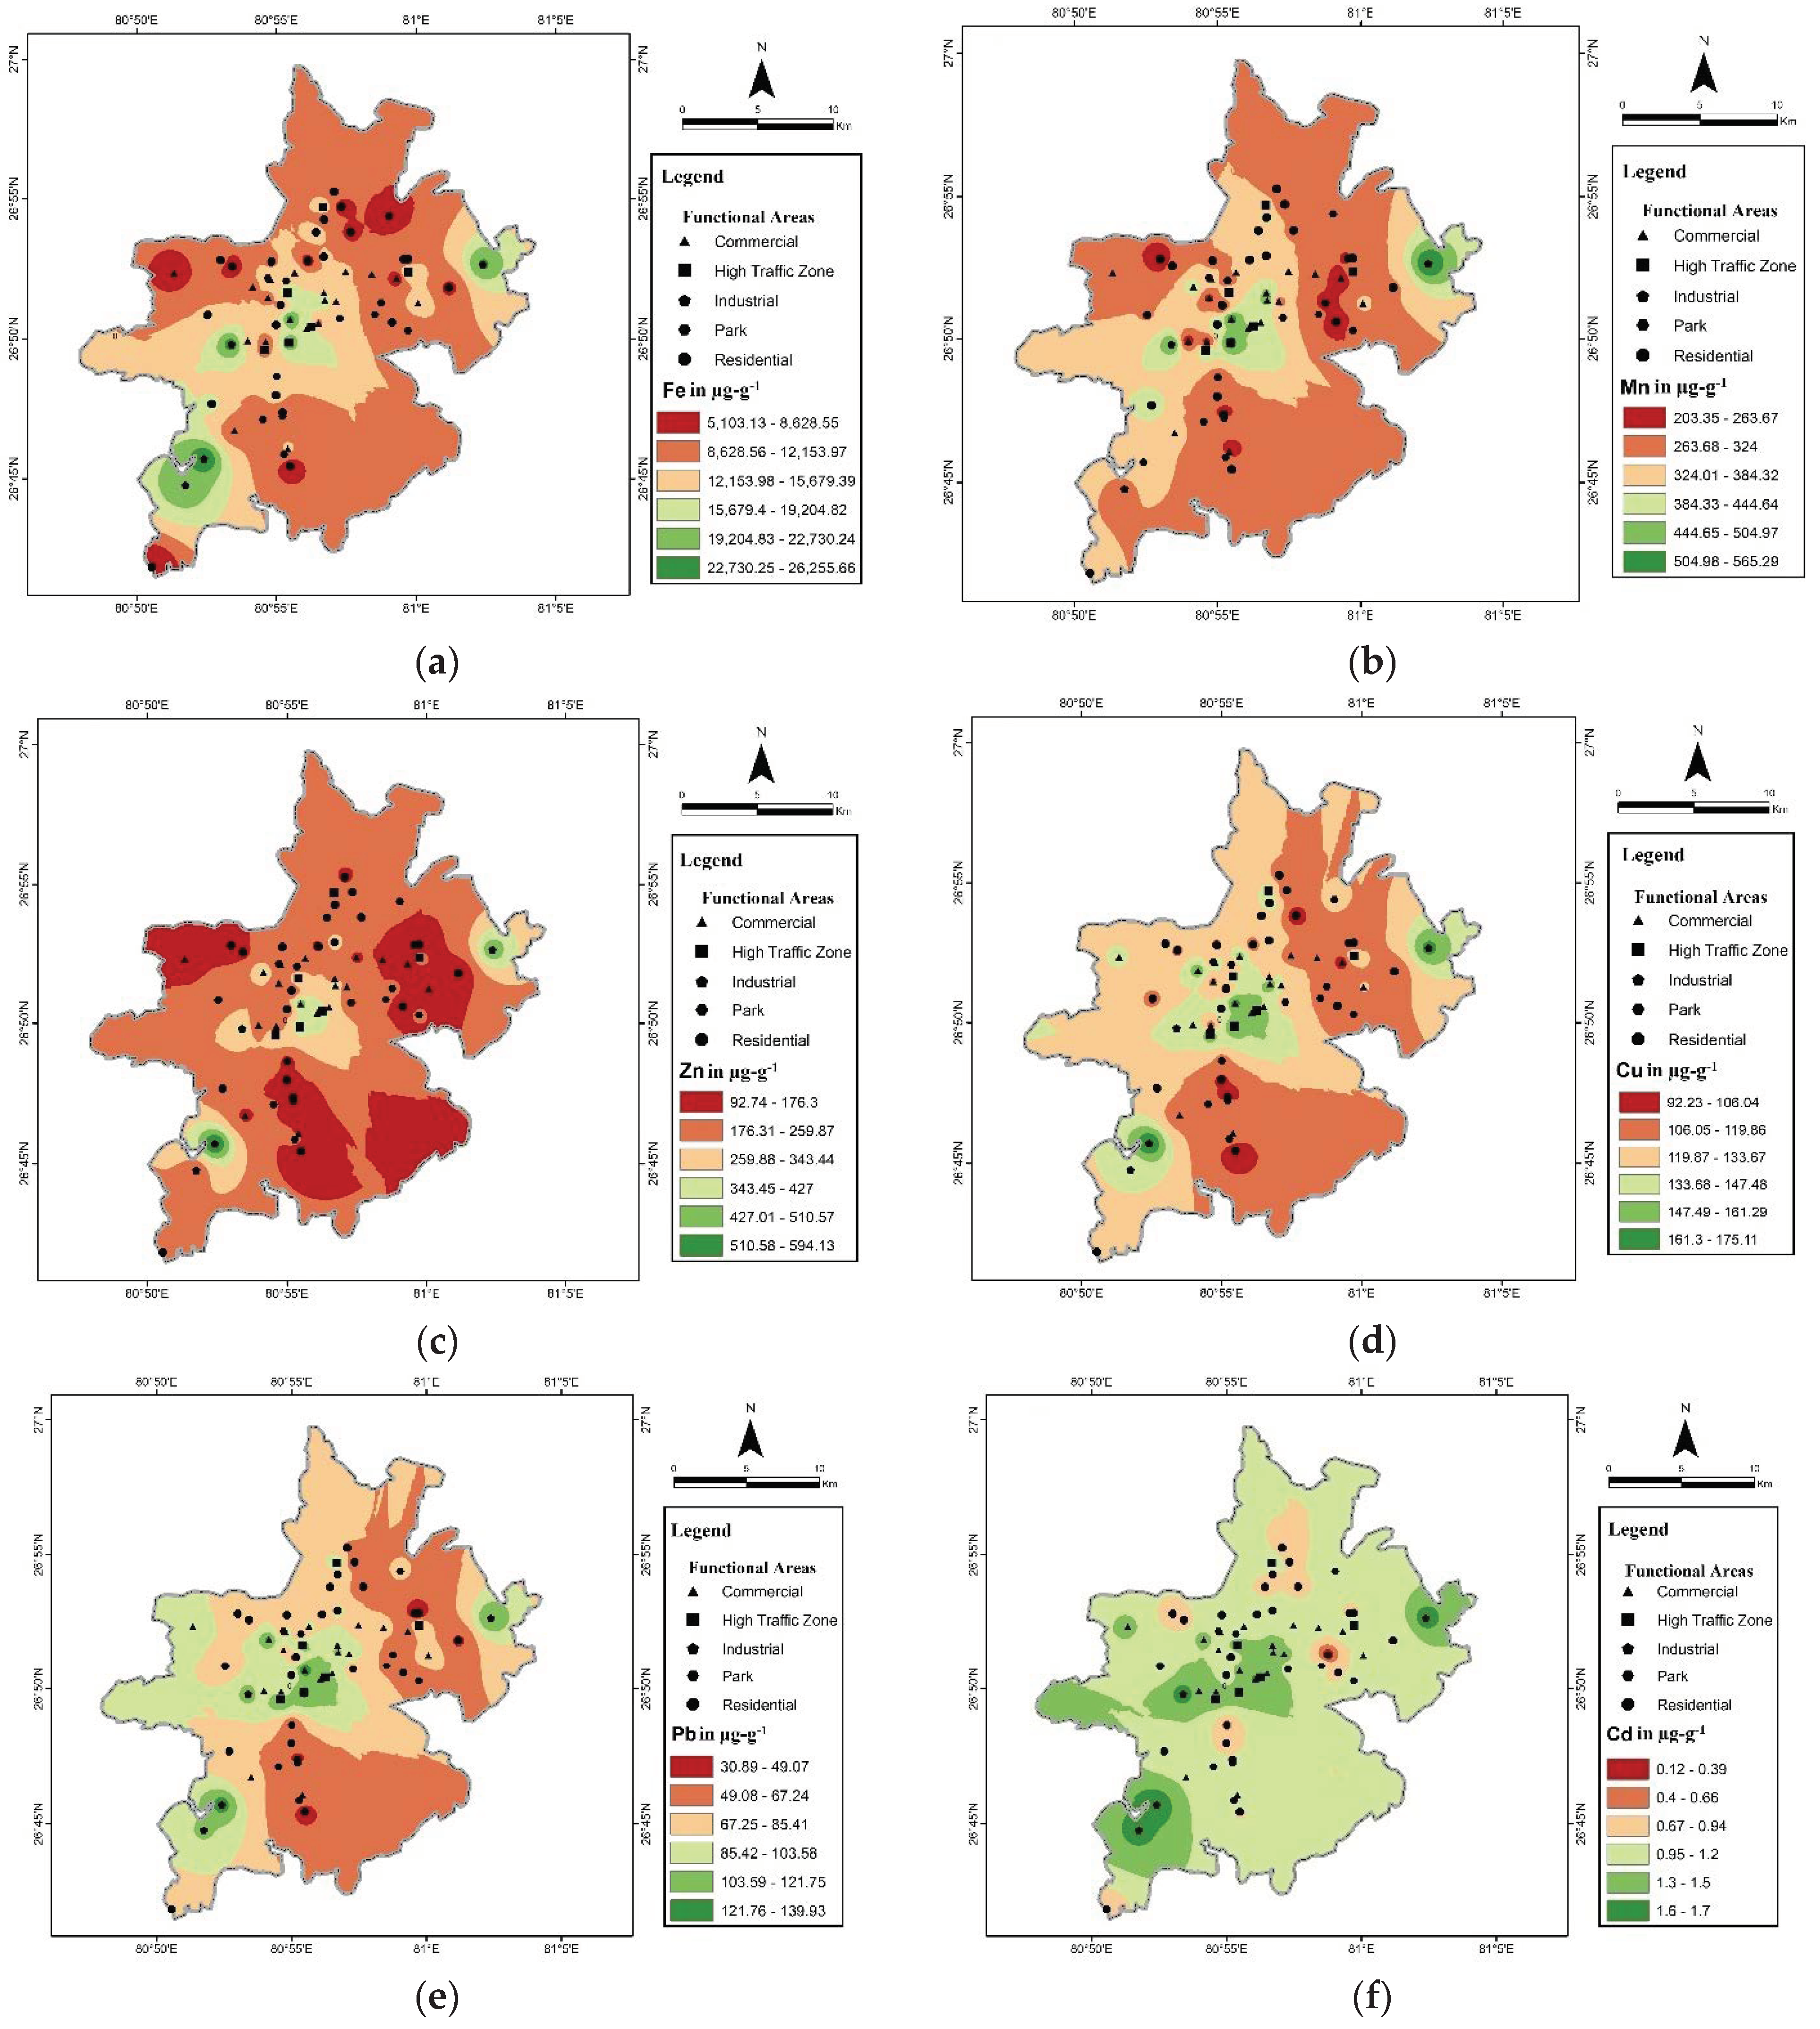
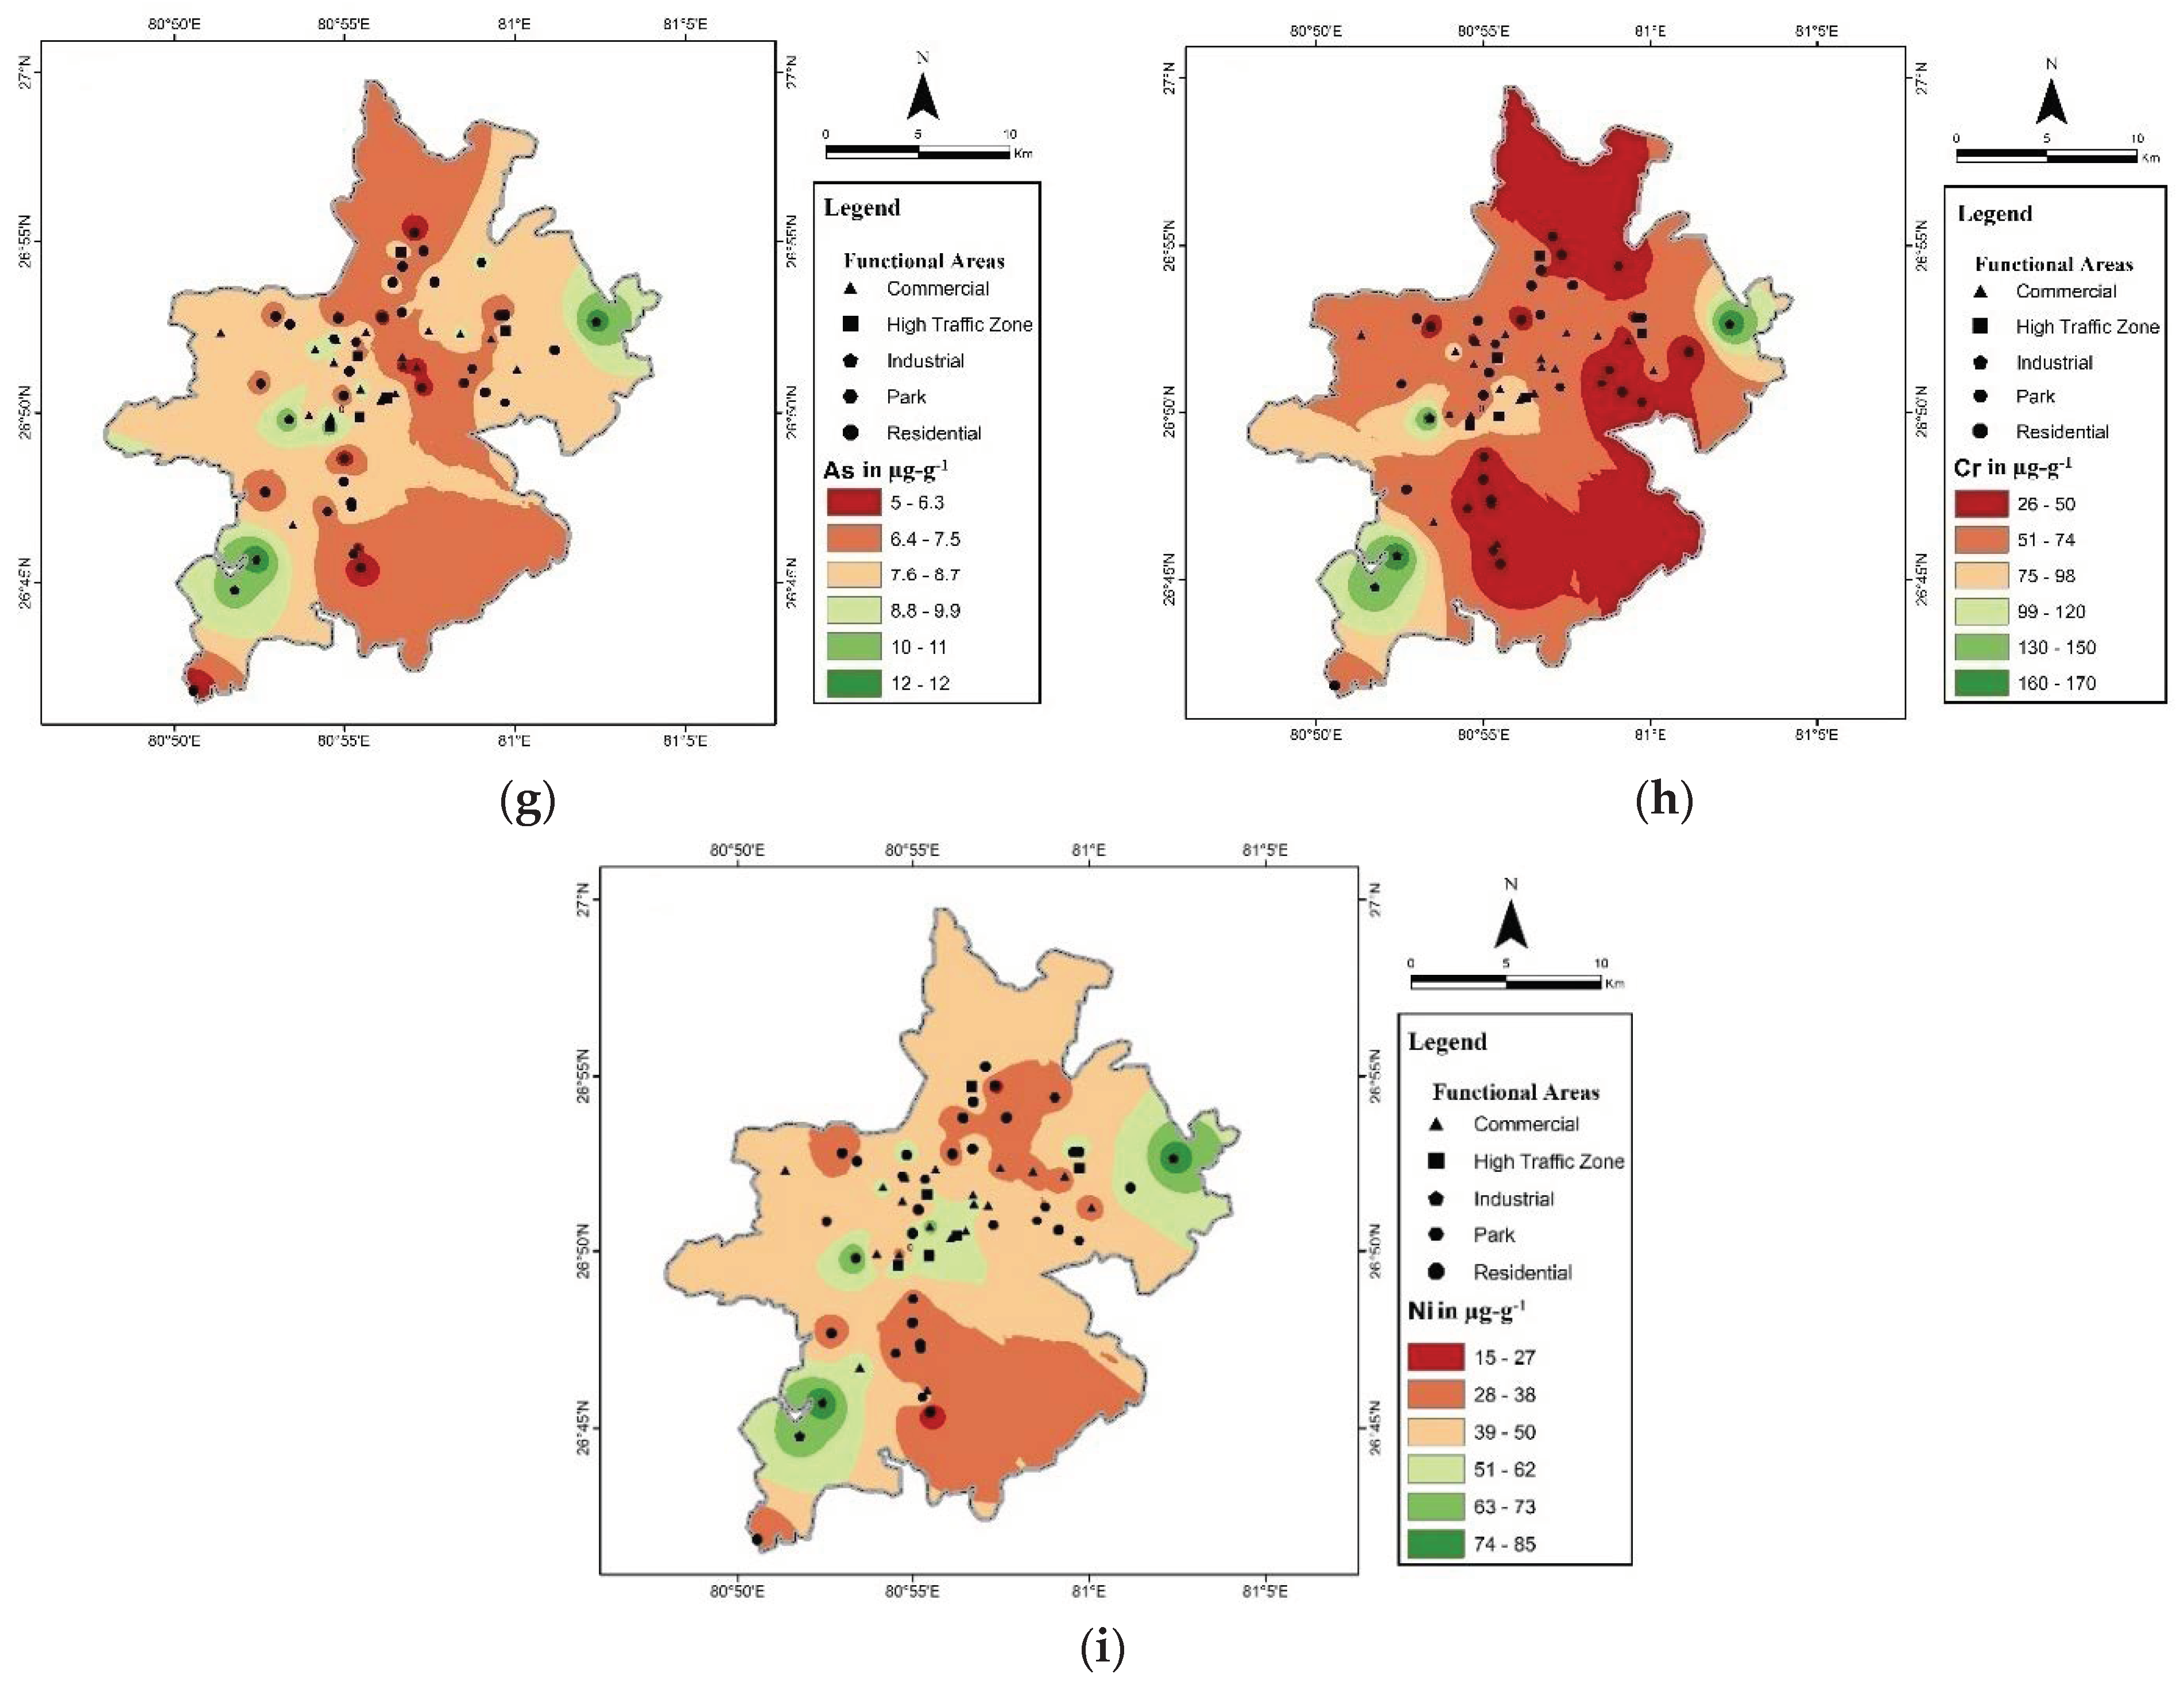
3.4. Spatial Distribution of Heavy Metals (Concentration) over the Lucknow Urban Area

The spatial distribution maps of HM concentration are displayed in Figure 4a–i. The center of the city and the southwestern zone showed a high concentration range for almost all the studied HMs, because major commercial centers, high-traffic zones and industrial locations i.e., Talkatora are, are located in these regions. The far northeastern region showed a high concentration of HMs because of the densely populated Chinhat industrial area. Southeastern and north locations were in the lower concentration range of the metals as compared to other locations. These zones consist of residential areas and parks, and have lower traffic density.
Vehicular-generated HMs such as Zn and Cu show higher range over a large area because traffic density is higher in all the zones except the outer peripheral zone and the southeastern zone, which are dominated by residential areas and the cantonment zone. The industrial zone (found in the southwestern and far eastern zone) also shows the highest concentration range compared to other zones for HMs such as Cr, Ni, Pb, and Cd. Some metals specifically emitted from industrial activities, such as Cd, As, Ni and Cr, were found highest around the center of the city as shown on the map; however, concentration levels appear to be similar in most of the areas, implying that natural processes also influence the concentration of these metals in study areas.

3.5. Risk Assessment

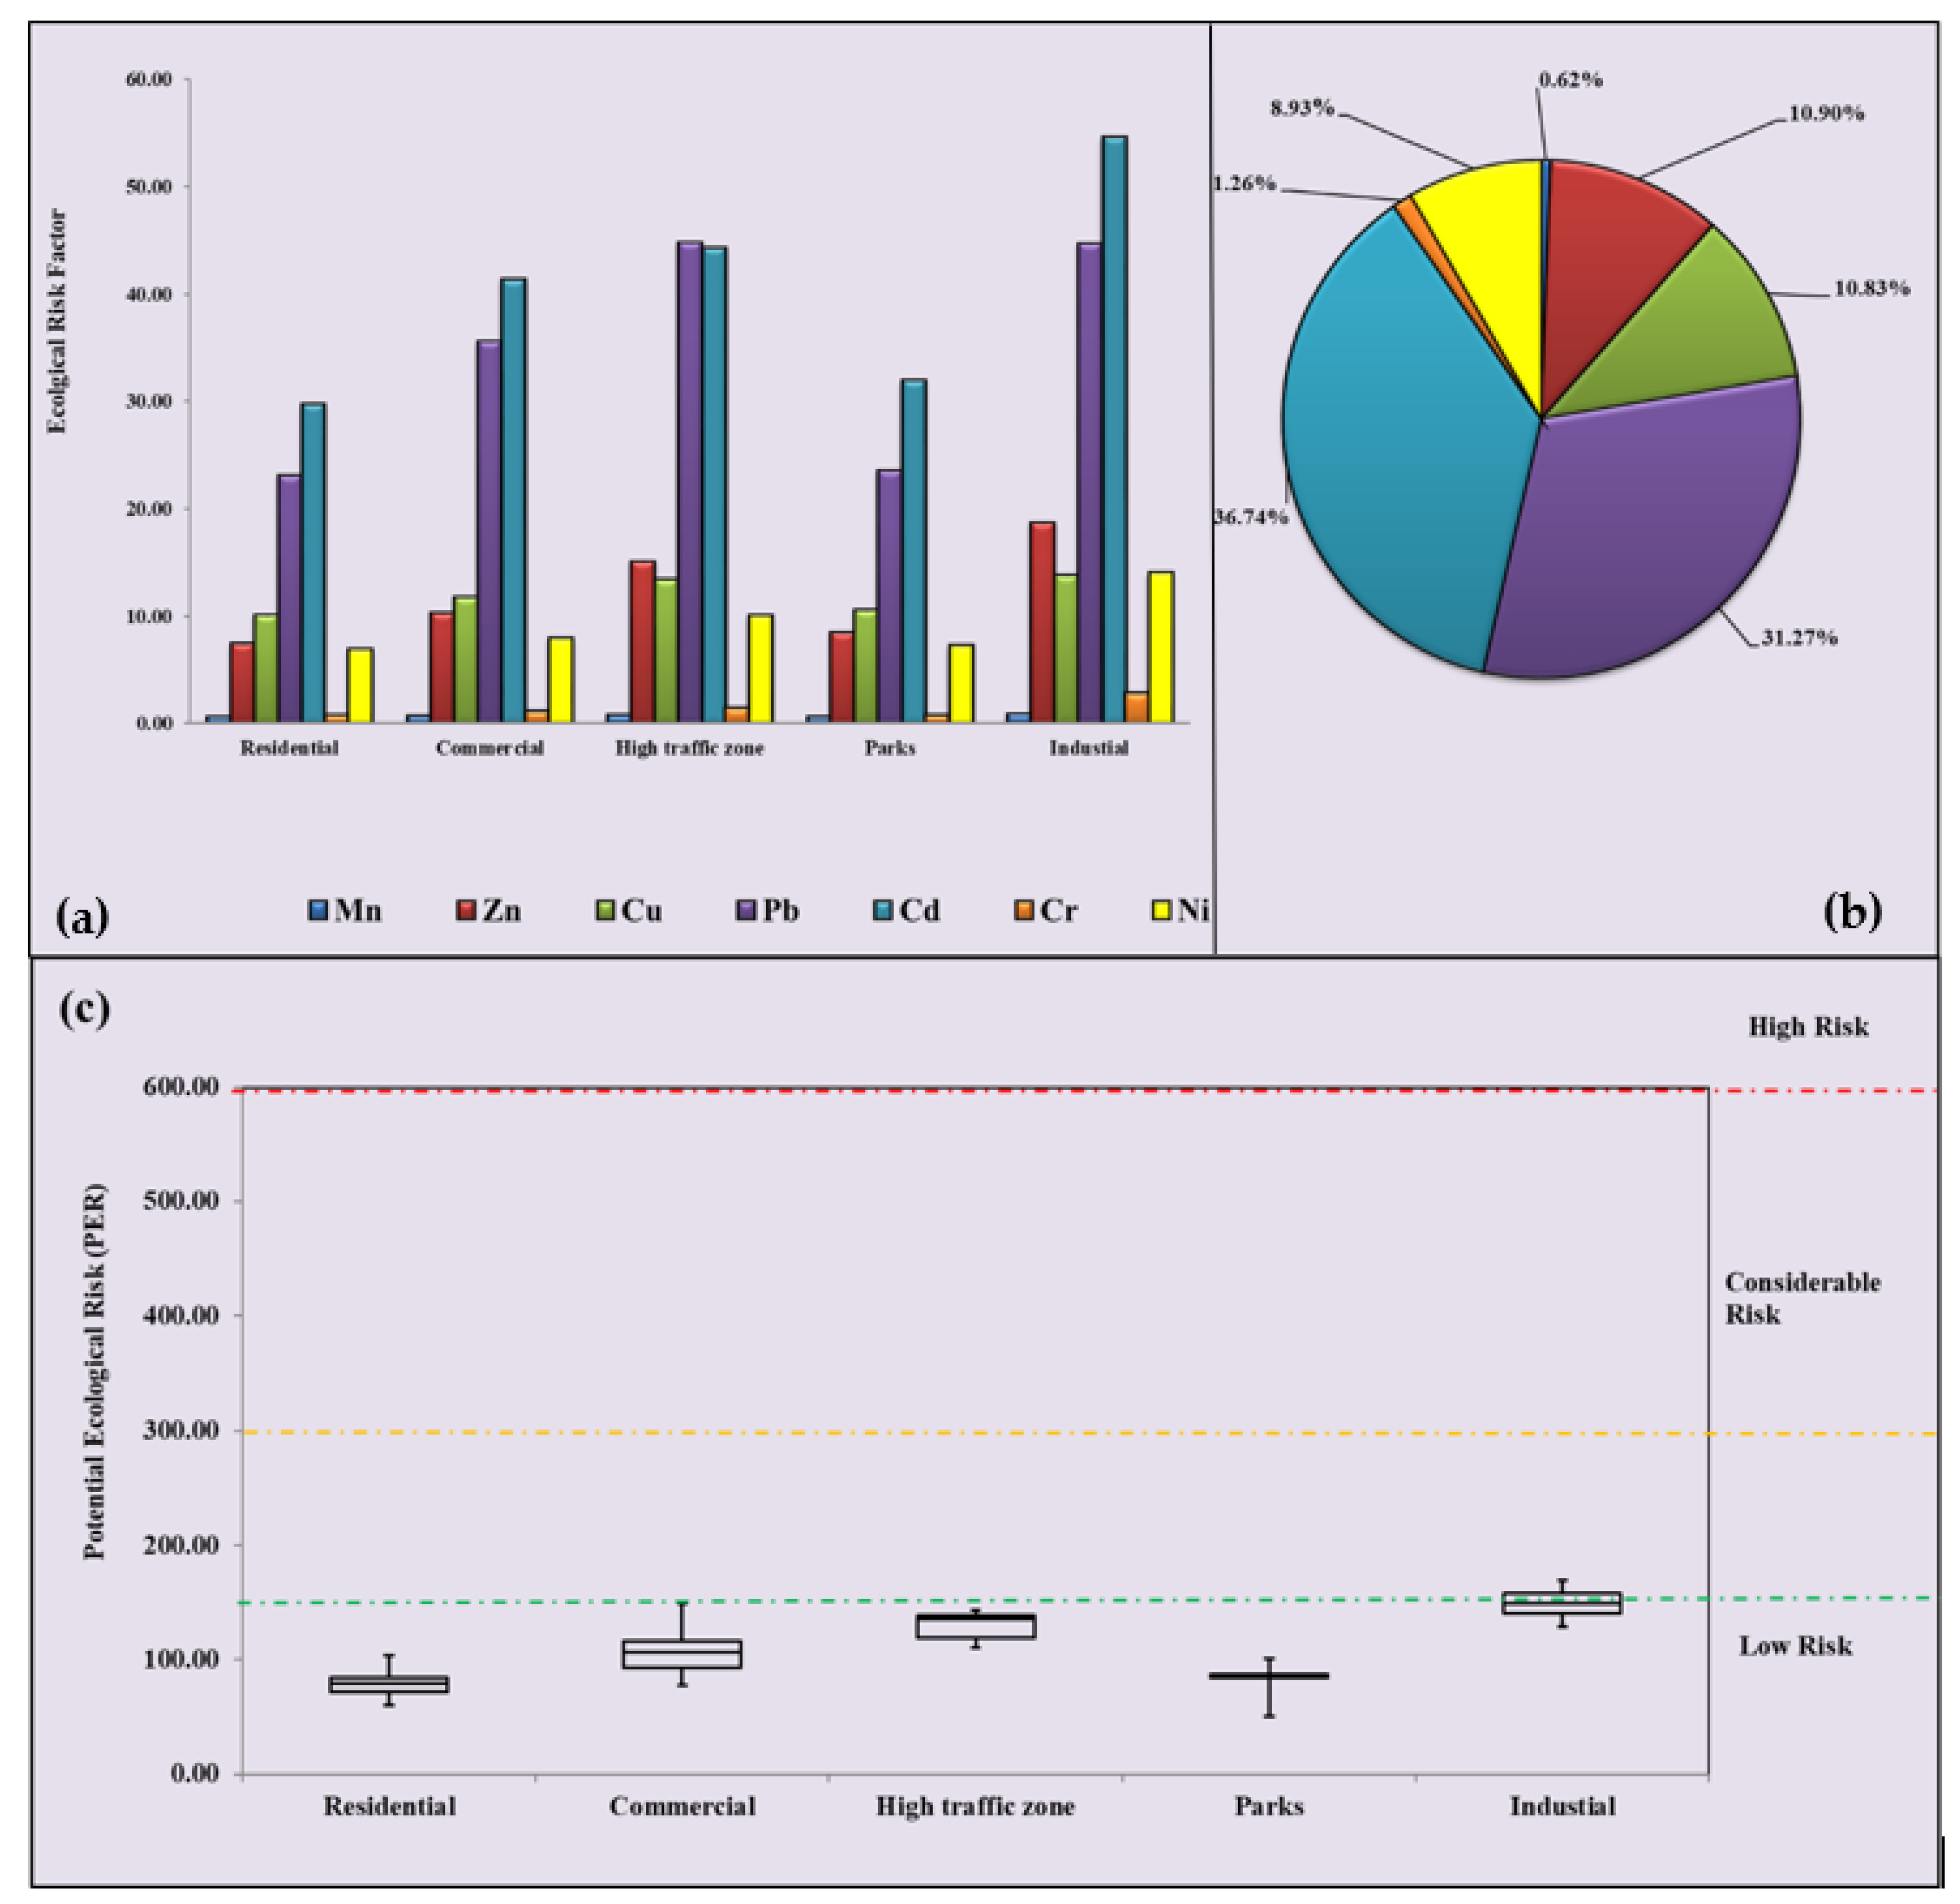
3.5.1. Potential Ecological Risk (PER)

Figure 5a–c shows the ecological risk factors (Er) of Mn, Zn, Cu, Pb, Cd, Cr, and Ni and the potential ecological risk index of road dust particles from different functional areas of Lucknow. The average Er value of Cd represents a moderate ecological risk (40 ≤ Er ≤ 80) in industrial areas (54.58), high-traffic zones (44.28), and commercial areas (41.29), and a low ecological risk in residential and park areas (Er < 40). Pb is in the moderate ecological risk category in high-traffic zones and industrial areas and the low ecological risk category in other functional areas. Mn, Zn, Cu, Cr, and Ni are in the low ecological risk category in all functional areas. The individual ecological risk of HMs in the study area increased in the order of Mn < Cr < Ni < Cu < Zn < Pb < Cd. Figure 5b shows that Cd contributed the highest ecological risk (36.74%) to PER followed by Pb (31.27%),Zn (10.93%), Cu (10.83%), Ni (8.93%), Cr (1.26%), and Mn (9.62%) in all five different functional areas. Therefore, it can be concluded that Cd, Pb, Zn, Cu, and Ni mainly cause the potential ecological risk of HMs in the road dust, and contribute almost 88.67% to the total PER in all different functional areas. Figure 5c shows that the PER values for all functional areas are in the low-risk category (PER < 150).

3.5.2. Human Health Risk Assessment

  • Non-carcinogenic risk assessment
Hazard quotient (HQ) and hazard index (HI) values were calculated as measures of non-carcinogenic (Fe, Mn, Zn, Cu, Pb, Cd, As, Cr, Ni) health risk for children and adults individually in all five functional areas and are shown in Table 8. It is seen from the results of non-carcinogenic risk that ingestion is the major exposure pathway for residents in all five functional areas for all studied HMs. Although the HQ and HI values of HMs were less than 1 (safe limit), HMs such as Pb Cr, Fe, and Mn had values near 1 for various exposure routes, in all functional areas, indicating that these HMs may cause non-carcinogenic risk for residents in the near future if anthropogenic activities continue to exceed their pollution levels. The value of combined HI for all HMs across all exposure pathways (i.e., cumulative HI) [31,36] was higher than the safe limit value of 1 for children in industrial (1.86), high-traffic (1.47), and commercial areas (1.17), suggesting significant potential risk. Overall, the HI values for all studied HMs were found in the decreasing order of Pb > Mn > Fe > Cr > Cu > As > Ni > Cd > Zn for both children and adults.
  • Carcinogenic risk assessment
Table 9 shows the carcinogenic risk in the form of carcinogenic risk values for children and adults via three main pathways in all five studied functional areas of Lucknow for four HMs, i.e., Cd, As, Cr and Ni. The decreasing order of carcinogenic risk for the three studied pathways is as follows: CRingestion > CRdermal > CRinhalation. The carcinogenic risk values for Cd, As, Cr, and Ni through the ingestion route were higher or equal to 1 × 10⁻⁶. The carcinogenic risk values for inhalation and dermal contact exposure routes were below the maximum permissible limit of 1.0 × 10⁻⁶, suggesting that the carcinogenic risk from these two pathways could be neglected. The LCR values were also higher than 1 × 10⁻⁶ for all studied HMs in both children and adults in all functional areas, indicating the possibility of cancer development in children and adults. In industrial areas, the carcinogenic risk values of Cr (1.61 × 10⁻⁴) and Ni (1.28 × 10⁻⁴) in children were higher than 1 × 10⁻⁴, indicating the development of cancer risk via these two metals in children. The results also reveal that the cancer risk appears to be higher for children compared to adults in all different functional areas. Cumulative LCR [31,36] values for children ranged from 0.000126 in residential areas to 0.000322 in industrial areas with an overall average value of 0.000187. For adults, cumulative LCR values were 0.0000541 in residential areas and 0.000138 in the industrial areas with an overall average value of 0.0000804. This suggests that children experience a higher cancer-causing risk compared to adults because of the HM-enriched dust exposure in Lucknow. The results reveal that the cancer risk exceeds the threshold value of 1 × 10⁻⁴–1 × 10⁻⁶, especially in children and industrial areas. Ni is the largest contributor to LCR in residential, commercial, high-traffic, and park areas, while Cr dominates in industrial areas.

4. Discussion

The present study shows that among the nine studied HMs, the mean concentrations of Zn, Pb, Cu, Mn, Ni, and Cd were higher and Fe and Cr were lower than the Indian natural soil background values. This shows that anthropogenic sources contribute a significant amount of these HMs to the road dust of the urban environment of Lucknow. Results from pollution indices(PI, IPI, and Igeo) reveal that the road dust of Lucknow is highly contaminated with Zn, Pb, Cu, Ni, and Cd in almost all the five functional areas. Industrial and high-traffic areas show high contamination levels as compared to other functional areas. This may be mainly due to the industrial activities, vehicular activities, solid waste dumping, and construction and demolition activities in the city. Similar observations were also found in previous studies carried out by Roy et al. [5] in Delhi, Wei et al. [53] in China and Gope et al. [54] in Asansol, India. Zn, Pb, Cu, and Mn are mainly associated with tires, brake pads, brake linings, and vehicular exhausts [4,55]. Zn, in the form of zinc oxide, is used as an activator in the vulcanization process of tires, which converts soft, sticky rubber into a more stable component, whereas Cu is used in metallic and semi-metallic brake pads to improve the braking performance because of its comprehensive temperature ranges. Zn is also produced from galvanized metal parts, paint, and pigments, as well as brake and tire wear [5,7,56]. Lubricant oil, gasoline (tetraethyl) and paints (lead chromate, PbCrO4) are the main sources of Pb in road dust. Soil re-suspension also contributes Pb to road dust due to its previous deposition [3,57]. Construction and demolition activities also contribute Mn and Pb to road dust. Yellow and white paint marking in roads releases Pb, Cd, and Cr in road dust after abrasion. Cr plating is used to protect vehicular components from corrosion and wear and tear, whereas Ni is used in electric vehicle (EV) and engine batteries as well as automotive paints, which release these metals in road dust. Ni primarily arises from the combustion of fossil fuels and oil as well as solid waste burning near pavement areas [1,4]. The cement, leather, galvanizing, metal-based steel fabrication and processing, battery- and paint-related industries, and repairing and servicing workshops, also release these three metals into environments around the study area [8]. On the other hand, anthropogenically, Fe is produced mainly from vehicular non-exhaust sources such as brake and tire wear [55]. Fe and Cr also arise in road dust via lithogenic sources during soil resuspension. Cd and As are mainly produced from fossil fuel burning activities, but paint, agro-based, paper, pulp product electroplating, and pesticide-related industries also release these metals into the study areas.
The center, southwestern, and northeastern zones showed the highest HM distribution. This may be due to the city’s center and southwestern zones being highly enriched with almost all the heavy metals. This is due to the city’s central zone having ahigh population density and various major amenities such as educational centers, major commercial centers, administrative centers, coaching institutes, and government and private offices, which makes this zone busy with high vehicular traffic. The increasing trend of two-wheelers and three-wheelers (Autos/Tampos/Vikrams) produce more HMs in the central zone of the city. Encroachment of nearby roads by local shopkeepers, unplanned and illegal parking on nearby roads, and the poor traffic system worsen the situation. Traffic jams, frequent braking and start–stop patterns, congested roads, and nearby buildings make the situation even worse and HMs produced from vehicles easily accumulate in these areas because of the low dispersal rate. Industries making agricultural tools, chemicals, pharmaceuticals, precision instruments, and bicycle parts, and engineering, electrical, and hardware factories in the industrial areas such as Talkatora emit a large number of HMs such as Pb, Cd, Cr, Ni and As in this zone. Apart from these, the city’s small-scale and cottage industries such as handicrafts and textiles are concentrated in Chowk, Aminabad, Bashiratganj, etc., also found in the central zone of the city. The southwestern zone has facilities such as an airport, railway station, interstate bus stand, and some famous commercial centers. Hundreds of small and large hotels, restaurants, motels, and Dharamshala found in this area also make this region crowded with locals and visitors and different types of vehicles during the day and night. Apart from this, two main industrial areas also fall under this zone, i.e., Amausi and Sarojini Nagar, which are the home of many medium- and small-scale industries such as battery, plastic, ceramic, and paint production, which release substantial amounts of metals such as Mn, Fe, Cr, Ni, Cu, Cd into the urban environment. Southeastern and north locations mainly have residential establishments, a large cantonment area (prohibited for public use), Nawabganj wildlife sanctuary, and parks. The population and vehicular density are lower compared to the other areas, so this zone has a lower concentration range for HMs, especially Cd, Cu, Zn, Pb, and As, which are produced from industrial and vehicular activities.
The ecological risk assessment results show that Cd, Pb, Zn, Cu and Ni contributed the most to ecological risk in all studied functional areas. Similar results were shown in other studies by Gupta et al. [4], Roy et al. [5], and Taiwo et al. [31]. The results reveal that 96.88% of locations out of 64 sampling locations are in the low-risk category, and 3.13% of locations are in the moderate-risk category. Although the PER of HMs studied in the road dust of five different functional areas shows that the risk is at a low level in all studied functional areas, some industrial locations also show a moderate risk. This can be attributed to high-traffic and industrial activities in these locations. Human health risk assessments revealed that ingestion is the primary pathway of HM exposure in both children and adults. Most of the HMs enter into the human body via ingestion as we consume xenobiotic compounds (solids and liquids) and HM-contaminated food, water, and liquids on a daily basis. Previous investigations by Gupta et al. [4], Parveen and Aris [29], and Taiwo et al. [31] revealed similar results for Dehradun city, Uttarakhand, Rawang city, Malaysia, and Osun state, southwestern Nigeria, respectively. Industrial, commercial, and high-traffic areas showed a high non-carcinogenic health risk for children. It is also alarming to note that residential and park areas also had values near 1 for children due to HM contamination in Lucknow, indicating the possibility of non-carcinogenic health risks in these two areas as well. Carcinogenic risk results revealed that due to Cd, As, Cr, and Ni, there is a possibility of cancer risk via the ingestion route in both age groups. Children are more susceptible to both non-carcinogenic and cancer risk. This could be due to their outside activities, for example frequent hand licking, eating behavior, and eating disorders such as pica disorder [31,34]. In cities like Lucknow, many poor young children work outdoors as street vendors selling different items, especially in the high-traffic areas and commercial zones, and other workers on the roadside are exposed more towards this risk. School-going children are also at high risk as they are exposed to this pollution on a daily basis [21].

5. Conclusions

The present study investigated the concentration levels of HMs in road dust, their sources and spatial distribution, and how these metals cause non-carcinogenic and carcinogenic risks in two age groups. The concentration results reveal that almost all HMs exceed the background INSB limits, which means that HMs accumulated in the road dust via various anthropogenic and natural sources. In all functional areas, vehicular sources turn out to be the most significant anthropogenic source of HMs Mn, Zn, Cu, and Pb, while industrial activities mainly contribute to the HMs Ni, Cr, Cd, and As in the road dust. Almost all studied HMs were identified in all studied functional areas because of intermixing and overlapping of different functional areas. The central zone, its adjacent areas, and the southwestern zone of the city, which possess various commercial, residential and industrial areas, experience worse road dust quality. Most of these zones are already overflowing with people and vehicles. Now the city is expanding to accommodate a growing population by creating new residential and commercial zones on the outer periphery of the city and north and southeastern zones where the HMs show lower concentration range in spatial distribution. High vehicular density, roadside encroachment by street vendors and small shopkeepers, and roadside illegal parking stands are common in Lucknow, which create traffic jams in the city and worsen environmental conditions. Continuous construction and demolition as well as the close proximity of buildings toward roads decrease the dispersal rate of dust, allowing HMs to accumulate more in road dust. Large populations using public transport e.g., city buses, and three-wheeler (Auto/Tampos) rickshaws to travel from one place to another in the city are more exposed because dust can directly enter through the nose and mouth as doors and windows are usually open in these vehicles. The increasing trend of using two-wheelers shows that more people are exposed to polluted road dust. The habit of not wearing helmets and masks will worsen the situation more for the rider of two-wheelers. Pedestrians, traffic policemen, street vendors, outdoor workers, and auto drivers are at high risk as they spend long hours outdoors and in areas with high levels of HM-enriched dust. The current findings show that HMs can produce both non-carcinogenic and carcinogenic risks for the people of Lucknow, especially children who are more susceptible to these risks. It is necessary that we must constantly monitor the concentration, bioavailability, distribution, and health effects of HMs in various environmental components in Lucknow city. There is a need to strictly monitor the level of HMs in liquid and solid food items as ingestion was shown to be the major exposure pathway. Masks should be prescribed for people working in high-traffic and industrial areas on a daily basis. As demolition and construction activities play a huge role in creating dust pollution, the government need to take strict preventive measures to reduce this. Management plans and strategies should concentrate on highly polluted and crowded areas of the city.

Author Contributions

Conceptualization, V.G.; methodology, V.G.; formal analysis, V.G.; data curation, V.G., L.B. and S.G.; writing—original draft preparation, V.G.; writing—review and editing, V.G., L.B., A.K.A., A.P.S. and S.G. All authors have read and agreed to the published version of the manuscript.

Funding

This research received no external funding.

Institutional Review Board Statement

Not applicable.

Informed Consent Statement

Not applicable.

Data Availability Statement

The datasets used and/or analyzed during the current study are available from the corresponding author upon reasonable request.

Acknowledgments

One of the authors Lalita Bisht is thankful to the University Grant Commission (UGC), New Delhi for providing their fellowship. The authors are also grateful for the research facilities provided by the USIC, Hemwati Nandan Bahuguna Garhwal University (A Central University), Srinagar Garhwal, Uttarakhand, India.

Conflicts of Interest

The authors declare that they have no known competing financial or non-financial interest to disclose.

List of Abbreviation

ADIAverage Daily Intake
CRCancer Risk
CSFCancer-Slope Factor
ErEcological Risk Factor
HIHazard Index
HMHeavy Metal
HMsHeavy Metals
HQHazard Quotient
HRAHealth Risk Assessment
ICPMSInductively Coupled Plasma-Mass Spectroscopy
IDWInverse Distance Weighting
INSBIndian Natural Soil Background
IPIIntegrated Pollution Index
LCRLifetime Cancer Risk
PCAPrincipal Component Analysis
PERPotential Ecological Risk
PIPollution Index
TrToxic-Response Factor
UCCUpper Continental Crust

References

  1. Rajaram, B.S.; Suryawanshi, P.V.; Bhanarkar, A.D.; Rao, C.V.C. Heavy metal contamination in road dust in Delhi city, India. Environ. Earth Sci. 2014, 72, 3929–3938. [Google Scholar] [CrossRef]
  2. Zhao, N.; Lu, X.; Chao, S.; Xu, X. Multivariate statistical analysis of heavy metals in less than 100 μm particles of street dust from Xining, China. Environ. Earth Sci. 2015, 73, 2319–2327. [Google Scholar] [CrossRef]
  3. Bisht, L.; Gupta, V.; Singh, A.; Gautam, A.S.; Gautam, S. Heavy metal concentration and its distribution analysis in urban road dust: A case study from most populated city of Indian state of Uttarakhand. Spat. Spatiotemporal Epidemiol. 2022, 40, 100470. [Google Scholar] [CrossRef] [PubMed]
  4. Gupta, V.; Bisht, L.; Deep, A.; Gautam, S. Spatial distribution, pollution levels, and risk assessment of potentially toxic metals in road dust from major tourist city, Dehradun, Uttarakhand, India. Stochastic Environ. Res. Risk Assess. 2022, in press. [CrossRef]
  5. Roy, S.; Gupta, S.K.; Prakash, J.; Habib, G.; Baudh, K.; Nasr, M. Ecological and human health risk assessment of heavy metal contamination in road dust in the National Capital Territory (NCT) of Delhi, India. Environ. Sci. Pollut. Res. 2019, 26, 30413–30425. [Google Scholar] [CrossRef]
  6. Masih, J.; Gautam, S.; Nair, A.; Singhal, R.K.; Venkatesh, M.; Basu, H.; Dyavarchetty, S.; Uzgare, A.; Tiwari, R.; Taneja, A. Chemical characterization of sub-micron particles in indoor and outdoor air at two different microenvironments in the western part of India. SN Appl. Sci. 2019, 1, 165. [Google Scholar] [CrossRef] [Green Version]
  7. Gautam, S.; Brema, J. Spatio-temporal variation in the concentration of atmospheric particulate matter: A study in fourth largest urban agglomeration in India. Environ. Technol. Inn. 2020, 17, 100546. [Google Scholar] [CrossRef]
  8. Gautam, S.; Kumar, P.; Patra, A.K. Occupational exposure to particulate matter in three Indian opencast mines. Air Qual. Atmos. Health. 2016, 9, 143–158. [Google Scholar] [CrossRef]
  9. Yang, Y.; Liao, H.; Lou, S. Decadal trend and interannual variation of outflow of aerosols from East Asia: Roles of variations in meteorological parameters and emissions. Atmos. Environ. 2015, 100, 141–153. [Google Scholar] [CrossRef]
  10. Li, H.Y.; Shi, A.B.; Zhang, X.R. Particle size distribution and characteristics of heavy metals in road-deposited sediments from Beijing Olympic Park. J. Environ. Sci. 2015, 32, 228–237. [Google Scholar] [CrossRef]
  11. Terradellas, E.; Nickovic, S.; Zhang, X.Y. Airborne Dust: A Hazard to Human Health, Environment and Society. World Meteorological Organization. 2015, 1–10. Available online: https://public.wmo.int/en/resources/bulletin/airborne-dust-hazard-human-health-environment-and-society (accessed on 20 December 2021).
  12. Kamani, H.; Mirzaei, N.; Ghaderpoori, M.; Bazrafshan, E.; Rezaei, S.; Mahvi, A.H. Concentration and ecological risk of heavy metal in street dusts of Eslamshahr, Iran. Hum. Ecol. Risk Assess.: Int. J. 2018, 24, 961–970. [Google Scholar] [CrossRef]
  13. Rehman, A.; Liu, G.; Yousaf, B.; Zia-ur-Rehman, M.; Ali, M.U.; Rashid, M.S.; Farooq, M.R.; Javed, Z. Characterizing pollution indices and children health risk assessment of potentially toxic metal(oid)s in school dust of Lahore, Pakistan. Ecotoxicol. Environ. Saf. 2020, 190, 110059. [Google Scholar] [CrossRef]
  14. Adimalla, N.; Wang, H. Distribution, contamination, and health risk assessment of heavy metals in surface soils from northern Telangana, India. Arab. J. Geosci. 2018, 11, 684. [Google Scholar] [CrossRef]
  15. Yousaf, B.; Amina Liu, G.; Wang, R.; Imtiaz, M.; Rizwan, M.S.; Zia-ur-Rehman, M.; Qadir, A.; Si, Y. The importance of evaluating metal exposure and predicting human health risks in urban-periurban environments influenced by emerging industry. Chemosphere 2016, 150, 79–89. [Google Scholar] [CrossRef]
  16. Farina, M.; Avila, D.S.; Da Rocha, J.B.T.; Aschner, M. Metals, oxidative stress and neurodegeneration: A focus on iron, manganese and mercury. Neurochem. Int. 2013, 62, 575–594. [Google Scholar] [CrossRef] [Green Version]
  17. Ghosh, G.C.; Khan, M.; Hassan, J.; Chakraborty, T.K.; Zaman, S.; Kabir, A.H.M.; Tanaka, H. Human health risk assessment of elevated and variable iron and manganese intake with arsenic-safe groundwater in Jashore, Bangladesh. Sci. Rep. 2020, 10, 5206. [Google Scholar] [CrossRef] [Green Version]
  18. Rahman, M.S.; Khan, M.D.H.; Jolly, Y.N.; Kabir, J.; Akter, S.; Salam, A. Assessing risk to human health for heavy metal contamination through street dust in the Southeast Asian Megacity: Dhaka, Bangladesh. Sci. Total Environ. 2019, 660, 1610–1622. [Google Scholar] [CrossRef]
  19. Liu, P.; Lei, Y.; Ren, H.; Gao, J.; Xu, H.; Shen, Z.; Qian, Z.; Chunli, Z.; Hongxia, L.; Renxing, Z.; et al. Seasonal variation and health risk assessment of heavy metals in PM2. 5 during winter and summer over Xi’an, China. Atmosphere 2017, 8, 91. [Google Scholar] [CrossRef] [Green Version]
  20. Liu, Z.; Cai, L.; Liu, Y.; Chen, W.; Wang, Q. Association between prenatal cadmium exposure and cognitive development of offspring: A systematic review. Environ. Pollut. 2019, 25i4, 113081. [Google Scholar] [CrossRef]
  21. Das, S.; Nath, M.; Laskar, A.K.; DebRoy, S.; Deb, S.; Barhai, A.; Choudhury, A.P. Lead and cadmium exposure network in children in a peri-urban area in India: Susceptibility and health risk. Environ. Sci. Poll. Res. 2021, 28, 28133–28145. [Google Scholar] [CrossRef]
  22. Diami, S.M.; Kusin, F.M.; Madzin, Z. Potential ecological and human health risks of heavy metals in surface soils associated with iron ore mining in Pahang, Malaysia. Environ. Sci. Pollut. Res. 2016, 23, 21086–21097. [Google Scholar] [CrossRef]
  23. Krishna, A.K.; Mohan, K.R. Distribution, correlation, ecological and health risk assessment of heavy metal contamination in surface soils around an industrial area, Hyderabad, India. Environ. Earth Sci. 2016, 75, 411. [Google Scholar] [CrossRef]
  24. Ciarkowska, K. Assessment of heavy metal pollution risks and enzyme activity of meadow soils in urban area under tourism load: A case study from Zakopane (Poland). Environ. Sci. Pollut. Res. 2018, 25, 13709–13718. [Google Scholar] [CrossRef] [PubMed]
  25. Awasthi, S.; Gupta, S.; Maurya, N.; Tripathi, P.; Dixit, P.; Sharma, N. Environmental risk factors for persistent asthma in Lucknow. Indian, J. Pediatr. 2012, 79, 1311–1317. [Google Scholar] [CrossRef] [PubMed]
  26. Ray, R.R. Adverse hematological effects of hexavalent chromium: An overview. Interdiscip. Toxicol. 2016, 9, 55. [Google Scholar] [CrossRef] [Green Version]
  27. Balali-Mood, M.; Naseri, K.; Tahergorabi, Z.; Khazdair, M.R.; Sadeghi, M. Toxic mechanisms of five heavy metals: Mercury, Lead, Chromium, Cadmium, and Arsenic. Front. Pharmacol. 2021, 12, 643972. [Google Scholar] [CrossRef]
  28. Jiang, Y.; Chao, S.; Liu, J.; Yang, Y.; Chen, Y.; Zhang, A.; Cao, H. Source apportionment and health risk assessment of heavy metals in soil for a township in Jiangsu Province, China. Chemosphere 2017, 168, 1658–1668. [Google Scholar] [CrossRef]
  29. Praveena, S.M.; Aris, A.Z. Status, source identification, and health risks of potentially toxic element concentrations in road dust in a medium-sized city in a developing country. Environ. Geochem. Health 2018, 40, 749–762. [Google Scholar] [CrossRef]
  30. Jadoon, W.A.; Khpalwak, W.; Chidya, R.C.; Abdel-Dayem, S.M.; Takeda, K.; Makhdoom, M.A.; Sakugawa, H. Evaluation of levels, sources and health hazards of road-dust associated toxic metals in Jalalabad and Kabul Cities, Afghanistan. Arch. Environ. Contam. Toxicol. 2018, 74, 32–45. [Google Scholar] [CrossRef]
  31. Taiwo, A.M.; Michael, J.O.; Gbadebo, A.M.; Oladoyinbo, F.O. Pollution and health risk assessment of road dust from Osogbo metropolis, Osun state, Southwestern Nigeria. Hum. Eco. Risk Assess. 2019, 26, 1254–1269. [Google Scholar] [CrossRef]
  32. Sadeghdoust, F.; Ghanavati, N.; Nazarpour, A.; Babaenejad, T.; Watts, M.J. Hazard, ecological, and human health risk assessment of heavy metals in street dust in Dezful, Iran. Arab. J. Geosci. 2020, 13, 881. [Google Scholar] [CrossRef]
  33. Jahandari, A. Pollution status and human health risk assessments of selected heavy metals in urban dust of 16 cities in Iran. Environ. Sci.Pollut. Res. Int. 2020, 27, 23094–23107. [Google Scholar] [CrossRef]
  34. Jena, S.; Singh, G. Human health risk assessment of airborne trace elements in Dhanbad, India. Atmos. Poll. Res. 2017, 8, 490–502. [Google Scholar] [CrossRef]
  35. Masto, R.E.; Singh, M.K.; Rout, T.K.; Kumar, A.; Kumar, S.; George, J.; Selvi, V.A.; Dutta, P.; Tripathi, R.C.; Srivastava, N.K. Health risks from PAHs and potentially toxic elements in street dust of a coal mining area in India. Environ. Geochem. Health 2019, 41, 1923–1937. [Google Scholar] [CrossRef]
  36. Kolakkandi, V.; Sharma, B.; Rana, A.; Dey, S.; Rawat, P.; Sarkar, S. Spatially resolved distribution, sources and health risks of heavy metals in size-fractionated road dust from 57 sites across megacity Kolkata, India. Sci. Total Environ. 2020, 705, 135805. [Google Scholar] [CrossRef]
  37. US Environmental Protection Agency (USEPA). Soil Screening Guidance: Technical Background Document; EPA/540/R-95/128; Office of Solid Waste and Emergency Response: Washington, DC, USA, 1996.
  38. Wan, D.; Han, Z.; Yang, J.; Yang, G.; Liu, X. Heavy metal pollution in settled dust associated with different urban functional areas in a heavily air-polluted city in North China. Int. J. Environ. Res. Public Health 2016, 13, 1119. [Google Scholar] [CrossRef] [Green Version]
  39. Kuhad, M.S.; Malik, R.S.; Singh, A.; Dahiya, I.S. Background levels of heavy metals in agricultural soils of Indogangetic plains of Haryana. J. Indian Soc. Soil Sci. 1989, 37, 700–705. [Google Scholar]
  40. Gowd, S.S.; Reddy, M.R.; Govil, P.K. Assessment of heavy metal contamination in soils at Jajmau (Kanpur) and Unnao industrial areas of the Ganga Plain, Uttar Pradesh, India. J. Hazard Matter. 2010, 174, 113–121. [Google Scholar] [CrossRef]
  41. Muller, G. Index of Geo-accumulation in Sediments of the Rhine River. J. Geol. 1969, 2, 108–118. [Google Scholar]
  42. Haris, H.; Looi, L.J.; Aris, A.Z.; Mokhtar, N.F.; Ayob, N.A.A.; Yusoff, F.M.; Salleh, A.B.; Praveena, S.M. Geo-accumulation index and contamination factors of heavy metals (Zn and Pb) in urban river sediment. Environ. Geochem. Health 2017, 39, 1259–1271. [Google Scholar] [CrossRef]
  43. Duncan, A.E.; de Vries, N.; Nyarko, K.B. Assessment of heavy metal pollution in the sediments of the River Pra and its tributaries. Water Air Soil Pollut. 2018, 229, 272. [Google Scholar] [CrossRef] [Green Version]
  44. Hakanson, L. An ecological risk index for aquatic pollution control. A sedimentological approach. Water Res. 1980, 14, 975–1001. [Google Scholar] [CrossRef]
  45. Li, H.H.; Chen, L.J.; Yu, L.; Guo, Z.B.; Shan, C.Q.; Lin, J.Q.; Gu, Y.G.; Yang, Z.B.; Yang, Y.X.; Shao, J.R.; et al. Pollution characteristics and risk assessment of human exposure to oral bioaccessibility of heavy metals via urban street dusts from different functional areas in Chengdu, China. Sci. Total Environ. 2017, 586, 1076–1084. [Google Scholar] [CrossRef] [PubMed]
  46. United States Environmental Protection, Agency (USEPA). Supplemental Guidance for Developing Soil Screening Levels for Superfund Sites; OSWER 9355.4-24; Office of Solid Waste and Emergency Response: Washington, DC, USA, 2001.
  47. International Agency for Research on Cancer. IARC Monographs on the Evaluation of Carcinogenic Risk of Chemicals to Man; International Agency for Research on Cancer: Lyon, France, 2012. [Google Scholar]
  48. Zeng, F.; Wei, W.; Li, M.; Huang, R.; Yang, F.; Duan, Y. Heavy metal contamination in rice-producing soils of Hunan province, China and potential health risks. Int. J. Environ. Res. Public Health 2015, 12, 15584–15593. [Google Scholar] [CrossRef] [PubMed]
  49. US Environmental Protection Agency (USEPA). Integrated Risk Information System of the US Environmental Protection Agency; US Environmental Protection Agency (USEPA): Washington, DC, USA, 2012.
  50. Lu, X.; Shi, D.; Yin, N.; Pan, H.; Smith, P. Risk assessment of heavy metals in finer than 63-μm dust particles from various functional areas in Xi’an, China. Air Qual. Atmos. Health 2017, 10, 907–915. [Google Scholar] [CrossRef]
  51. Delibašić, Š.; Đokić-Kahvedžić, N.; Karić, M.; Keskin, I.; Velispahić, A.; Huremović, J.; Herceg, K.; Selimović, A.; Silajdžić, S.; Žero, S.; et al. Health risk assessment of heavy metal contamination in street dust of federation of Bosnia and Herzegovina. Hum. Ecol. Risk. Assess. 2020, 27, 1296–1308. [Google Scholar] [CrossRef]
  52. Wedephol, K.H. The composition of the continental crust. Geochim. Cosmochim. Acta 1995, 59, 1217–1232. [Google Scholar] [CrossRef]
  53. Wei, X.; Gao, B.; Wang, P.; Zhou, H.; Lu, J. Pollution characteristics and health risk assessment of heavy metals in street dusts from different functional areas in Beijing, China. Ecotoxico. Environ. Saf. 2015, 112, 186–192. [Google Scholar] [CrossRef]
  54. Gope, M.; Masto, R.E.; George, J.; Hoque, R.R.; Balachandran, S. Bioavailability and health risk of some potentially toxic elements (Cd, Cu, Pb and Zn) in street dust of Asansol, India. Ecotoxicol. Environ. Saf. 2017, 138, 231–241. [Google Scholar] [CrossRef]
  55. Apeagyei, E.; Bank, M.S.; Spengler, J.D. Distribution of heavy metals in road dust along an urban-rural gradient in Massachusetts. Atmos. Environ. 2011, 45, 2310–2323. [Google Scholar] [CrossRef]
  56. Duan, Z.; Wang, J.; Cai, X.; Wu, Y.; Xuan, B. Spatial distribution and human health risk assessment of heavy metals in campus dust: A case study of the university town of Huaxi. Hum. Ecol. Risk Assess. 2020, 26, 986–999. [Google Scholar] [CrossRef]
  57. Trojanowska, M.; Świetlik, R. Investigations of the chemical distribution of heavy metals in street dust and its impact on risk assessment for human health, case study of Radom (Poland). Hum. Eco. Risk Assess. 2019, 26, 1907–1926. [Google Scholar] [CrossRef]
Figure 1. Map of the study area and sampling locations.
Ijerph 19 12898 g001
Figure 2. Pollution indexes (PIs) and integrated pollution indexes (IPI) of HMs in the dust of Lucknow over different functional areas.
Ijerph 19 12898 g002
Figure 3. Geo-accumulation index (Igeo) of HMs in the road dust of Lucknow over different functional areas.
Ijerph 19 12898 g003
Figure 4. (ai) Spatial distribution of HMs in the road dust of Lucknow over different functional areas.
Ijerph 19 12898 g004aIjerph 19 12898 g004b
Figure 5. (a) Ecological risk factors (Er) of individual HMs in different functional areas; (b) relative percentage contributions of heavy metals to the potential ecological risk index (PER) in Lucknow; (c) box plot of potential ecological risk (PER). The box plot is outlined by the 25th and 75th percentile values, whiskers indicate the 10th and 90th percentile values, and dots show the 5th and 95th percentile outliers. The solid black line within the box corresponds to the 50th percentile value (or the median).
Ijerph 19 12898 g005
Table 1. Sampling locations representing five different functional areas (i.e., residential, commercial, high-traffic areas, parks, and industrial areas).
S.No.LocationFunctional AreasLatitudeLongitudeS.No.LocationFunctional AreasLatitudeLongitude
1AishbaghResidential26.8480.9233SmritiUpvanPark26.7980.92
2Krishna NagarResidential26.7980.8834Jonal ParkPark26.7980.91
3BantharaResidential26.6980.8435MalihabaadPark26.9280.71
4AliganjResidential26.9080.9536Transport NagarCommercial26.7880.89
5NiralanagarResidential26.8880.9437MawaiyaCommercial26.8380.91
6KhadraResidential26.8880.9138AminabadCommercial26.8480.92
7PuraniaResidential26.9080.9439ResidencyCommercial26.8680.95
8KapoorthalaResidential26.8880.9440NishatganjCommercial26.8380.90
9JankipuramResidential26.9280.9541Sikandarbagh/NbriCommercial26.8680.95
10Up RSACResidential26.9180.9642HazaratganjCommercial26.8680.95
11BalaganjResidential26.8880.8843VidhansabhaCommercial26.8480.94
12ThakurganjResidential26.8880.8944DaliganjCommercial26.8780.93
13WazirganjResidential26.8580.9245HussainganjCommercial26.8480.93
14GomatinagarResidential26.8681.0246ChowkCommercial26.8680.90
15VipulkhandResidential26.8480.9947Bara ImambaraCommercial26.8780.91
16IndiranagarResidential26.8880.9948YahiyaganjCommercial26.8680.91
17MahanagarResidential26.8881.0049PatrakarpuramCommercial26.8581.00
18Omax CityResidential26.7680.9250Lekhraj MarketCommercial26.8780.97
19Golf CityResidential26.7981.0451HalCommercial26.8780.99
20RajajipuramResidential26.8580.8852BbauCommercial26.7780.92
21AshiyanaResidential26.8080.9253Gole MarketCommercial26.8780.96
22Vikas NagarResidential26.9080.9654DubbaggaCommercial26.8780.86
23UthretiyaResidential26.7980.9255AmausiIndustrial26.7680.87
24KukrailPark26.9180.9856ChinhatIndustrial26.8881.04
25Janeshwar Mishra ParkPark26.8481.0057Sarojini NagarIndustrial26.7580.86
26Nimbu ParkPark26.8780.9158TalkatoraIndustrial26.8380.89
27Hathi ParkPark26.8780.9259Chabagh StationHigh-Traffic Zone26.8380.92
28Ramabai Ambedkar ParkPark26.7680.9260Alambagh ChaurahaHigh-Traffic Zone26.8380.91
29Lohia ParkPark26.8580.9861KaiserbaghHigh-Traffic Zone26.8680.92
30Ambedkar ParkPark26.8580.9862Polytechnique ChaurahaHigh-Traffic Zone26.8781.00
31ZooPark26.8580.9563Barlington ChaurahaHigh-Traffic Zone26.8480.94
32Kanshiram Eco GardenPark26.8180.9264Engineering College ChaurahaHigh-Traffic Zone26.9180.94
Table 2. Pollution index (PI), integrated pollution index (IPI), ecological risk factor (ER), and potential ecological risk (PER) classification.
Pollution Index (PI)ClassificationIntegrated Pollution Index (IPI)ClassificationEcological Risk Factor (Er)ClassificationPERClassification
PI ≤ 1Low pollution levelIPI ≤ 1Low level of pollutionEr < 40Low riskPER < 150Low risk
1 ≤ PI ≤ 3Moderate
pollution level
1 < IPI ≤ 2Moderate level of pollution40 ≤ Er < 80Moderate risk150 ≤ PER < 300Moderate risk
2 < IPI > 5High level of pollution80 ≤ Er < 160Considerable risk300 ≤ PER < 600Considerable risk
PI ≥ 3High pollution levelIPI > 5Extremely high level of pollution160 ≤ Er < 320High riskPER > 600High risk
Er > 320Very high risk
PI and IPI values were adopted from Wan et al. [38]. ER and PER classification is based on Hakanson [44].
Table 3. Exposure factor values used in average daily intake (ADI) estimation for non-carcinogenic risk for children and adults.
ParameterDefinitionUnitValue
ChildrenAdult
CConcentration of metalmg·kg−1--
IngRIngestion ratemg·day−1100200
EFExposure frequencydays·year−1350350
EDExposure durationyears624
BWBody weightkg16.261.8
ATAverage time (non-carcinogenic)daysED × 365ED × 365
InhRInhalation ratem3·day−172 × 36572 × 365
PEFParticle emission factorm3·kg−17.620
SAExposed skin areacm21.36 × 1091.36 × 109
SLSkin adherence factormg·cm−2·day−128005700
ABSDermal absorption factor-0.200.07
Adapted from the US Environmental Protection Agency (USEPA) [46].
Table 4. Toxic response factor, reference doses (RfD), and cancer slope factor (CSF) for heavy metals.
Heavy MetalsToxic Response FactorsReference Dose
(RfD, mg·kg−1·day−1)
Cancer Slope Factor
(CSF, mg·kg−1·day−1)
Fe-0.7-
Mn10.014-
Zn10.3-
Cu50.04-
Pb50.035-
Cd300.00115
As100.0031.5
Cr20.0030.5
Ni50.020.91
RfD and CSF values were adopted from the US Environmental Protection Agency (USEPA) [49].
Table 5. Heavy metal concentrations (μg·g−1) in road dust samples from urban Lucknow across different functional areas.
Functional Areas FeMnZnCuPbCdAsCrNi
Residential
(N = 23)
Average ± SD9620.07 ± 3317297.12 ± 66.23162.92 ± 49.53113.57 ± 14.4660.54 ± 16.170.89 ± 0.066.94 ± 1.1245.22 ± 110.9337.92 ± 13.63
Range5100.00–16235.50202.36–425.2585.52–312.2590.15–145.5034.40–90.560.81–1.005.01–8.7825.52–65.9815.15–60.85
Commercial
(N = 19)
Average ± SD13,042.19 ± 47,67344.05 ± 109.48226.74 ± 114.16132.78 ± 22.3393.28 ± 21.191.24 ± 0.137.98 ± 1.2663.44 ± 14.7843.89 ± 11.88
Range5153.45–25,458.85202.02–550.45115.23–485.4597.20–170.1555.85–140.451.05–1.565.59–9.8936.85–92.4830.24–70.25
High traffic
(N = 06)
Average ± SD17,432.90 ± 4152.02406.97 ± 87.56332.91 ± 74.06151.13 ± 12.19117.32 ± 13.701.33 ± 0.108.91 ± 1.3282.53 ± 9.7355.35 ± 7.61
Range10,657.32–22,625.25330.20–550.50215.55–400.45139.85–165.45100.22–130.451.20–1.457.21–11.2568.62–95.1245.45–65.11
Parks
(N = 12)
Average ± SD10,671.28 ± 3027.68300.94 ± 32.11186.83 ± 19.97119.37 ± 8.8661.60 ± 10.620.96 ± 0.317.02 ± 1.3242.49 ± 10.8440.09 ± 5.79
Range5556.42–15,200.32245.52–350.45155.33–220.45112.45–145.2051.36–90.150.12–1.155.31–9.2125.52–65.4832.50–51.50
Industrial
(N = 04)
Average ± SD24,326.21 ± 1745.78444.62 ± 118.78412.93 ± 161.17155.39 ± 18.01117.15 ± 11.131.64 ± 0.0811.36 ± 0.89160.72 ± 13.4577.58 ± 8.44
Range22,425.82–26,258.40315.55–565.32215.50–594.23135.85–175.12105.66–130.221.56–1.7510.29–12.39140.78–170.1765.55–85.15
Table 6. Heavy metal concentrations (mg·kg−1) in road dust samples from different regions of India and the world.
City (Country) and Recommended BodyFeMnZnCuPbCdAsCrNiReference
Lucknow, India16,368.15374.15289.85139.6697.341.298.8287.2954.23Present study
Delhi, India27047699.2263.7168.7128.7--170.837.2Rajaram et al. [1]
Dhanbad, India67,700150022453.6128-17.545.222Masto et al. [35]
Kolkata, India40,33474328992128--16436Kolakkandi et al. [36]
Dehradun, India12,509.51315.58217.1080.41138.77-4.4046.7535.38Bisht et al. [3]
Xi’an, China-337.6169.246.697.4--177.529.3Lu et al. [50]
Dhaka (Bangladesh)-261.53239.149.818.911.68.1144.337.1Rehman et al. [18]
Dezful (Iran)--22451540.434446Sadeghdoust et al. [32]
Lahore (Pakistan)--10531162305.177.5119453.6Rehman et al. [13]
Kabul (Afghanistan)-252.95122.5143.6328.691.16-38.4066.41Jadoon et al. [30]
Concentration in Indian natural soil30,89052722.156.513.10.90-11427.7Kuhad et al. [39] and Gowd et al. [40]
Continental upper crust32,0152095214.3170.1022.03518.6Wedepohl [52]
Table 7. PCA loadings of variables of significant principal components.
ParametersPC1PC2PC3
Fe0.3840.7150.319
Mn0.7090.5470.019
Zn0.6610.5510.322
Cu0.8410.3600.251
Pb0.8380.2570.411
Cd0.5130.2940.643
As0.1320.2130.901
Cr0.3870.6210.592
Ni0.3210.8080.271
Eigen Value3.0292.4802.089
% of Variance33.66127.55023.208
Cumulative %33.66161.21184.419
Extraction method: principal component analysis; rotation method: varimax with Kaiser normalization.
Table 8. Summary of hazard quotient (HQ) and hazard index (HI) values of HMs in road dust for five different functional areas.
Heavy MetalsType of ExposureDifferent Functional Areas
ResidentialCommercialHigh-Traffic AreasParksIndustrial
ChildrenAdultsChildrenAdultsChildrenAdultsChildrenAdultsChildrenAdults
FeHQIngestion0.1760.01880.2380.02550.3180.03410.1950.02090.4440.0476
HQInhalation0.000004910.000002770.000006660.000003750.000008900.000005020.000005450.000003070.00001240.00000700
HQDermal0.0004920.000007510.0006670.0001020.0008920.0001360.0005460.00008330.001240.000190
HI0.1760.01890.2390.02560.3190.03430.1950.02100.4460.0478
MnHQIngestion0.2710.02910.3140.03370.3720.03980.2750.02940.4060.0435
HQInhalation0.000007580.000004280.000008780.000004950.00001040.000005860.000007680.000004330.00001130.00000640
HQDermal0.0007600.0001160.0008800.0001340.001040.0001590.0007700.0001170.001140.000174
HI0.2720.02920.3150.03380.3730.04000.2760.02960.4070.0437
ZnHQIngestion0.006940.0007440.009660.001040.01420.001527960.000.0008530.01760.00189
HQInhalation0.0000001940.0000001090.0000002700.0000001520.0000003960.0000002240.0000002220.0000001250.0000004920.000000277
HQDermal0.00001940.000002970.00002710.000004130.00003970.000006070.00002230.000003400.00004930.00000752
HI0.006960.0007470.009690.001040.01420.001520.007980.0008570.01760.00189
CuHQIngestion0.03630.003890.04240.004550.04830.005180.03820.004090.04970.00532
HQInhalation0.000001010.0000005720.000001190.0000006690.000001350.0000007610.000001070.0000006010.000001390.000000783
HQDermal0.0001020.00001550.0001190.00001810.0001350.00002070.0001070.00001630.0001390.0000212
HI0.03640.003910.04260.004570.04840.005200.03830.004100.04980.00534
PbHQIngestion0.2210.02370.3410.03650.4290.04590.2250.02410.4280.0459
HQInhalation0.000006180.000003480.000009520.000005370.00001200.000006750.000006290.000003550.00001200.00000674
HQDermal0.0006190.00009450.0009540.0001460.001200.0001830.0006300.00009620.001200.000183
HI0.2220.02380.3420.03670.4300.04610.2260.02420.4290.0460
CdHQIngestion0.01140.001220.01580.001700.01700.001820.01220.001310.02090.00224
HQInhalation0.0000003180.0000001790.0000004420.0000002500.0000004750.0000002680.0000003420.0000001930.0000005850.000000330
HQDermal0.00003190.000004870.00004430.000006770.00004760.000007260.00003430.000005240.00005860.00000895
HI0.01140.001230.01590.001700.01700.001830.01230.001320.02100.00225
AsHQIngestion0.03850.004130.03400.003640.03800.004070.02990.003210.04840.00518
HQInhalation0.000001080.0000006070.0000009500.0000005360.000001060.0000005980.0000008360.0000004720.000001350.000000762
HQDermal0.0001080.00001650.00009520.00001450.0001060.00001620.00008380.00001280.0001350.0000207
HI0.03860.004140.03410.003660.03810.004080.03000.003220.04850.00521
CrHQIngestion0.1200.01280.1620.01740.2110.02260.1090.01160.4110.0440
HQInhalation0.000003350.000001890.000004530.000002560.000005900.000003330.000003040.000001710.00001150.00000648
HQDermal0.0003350.00005120.0004540.00006930.0005910.00009020.0003040.00004640.001150.000176
HI0.1200.01290.1630.01750.2120.02270.1090.01170.4120.0442
NiHQIngestion0.02420.002600.02810.003010.03540.003790.02560.002750.049620.00531
HQInhalation0.0000006770.0000003820.0000007840.0000004420.0000009890.0000005570.0000007160.0000004040.000001390.000000781
HQDermal0.00006790.00001040.00007860.000001200.00009910.00001510.00007180.00001100.0001390.0000212
HI0.02430.002610.02810.003020.03550.003810.02570.002760.04970.00534
Cumulative HI0.8960.09621.170.1261.470.1580.9080.09741.860.199
Table 9. Carcinogenic risk of HMs in road dust for five different functional areas.
Heavy MetalsType of ExposureDifferent Functional Areas
ResidentialCommercialHigh-Traffic AreasParksIndustrial
ChildrenAdultsChildrenAdultsChildrenAdultsChildrenAdultsChildrenAdults
CdCRIngestion0.00001460.000006280.00002040.000008730.00002180.000009360.00001570.000006750.00002690.0000115
CRInhalation0.0000000004090.0000000009230.0000000005690.000000001280.0000000006100.000000001380.0000000004400.0000000009900.0000000007520.00000000170
CRDermal0.0000004100.00000002500.00000005700.00000003480.00000006110.00000003730.00000004410.00000002690.00000007540.0000000460
LCR0.00001470.000006300.00002040.000008760.00002190.000009400.00001580.000006780.00002700.0000116
AsCRIngestion0.000003800.000001630.000004370.000001870.000004880.000002090.000003850.000001650.000006220.00000267
CRInhalation0.0000000001060.0000000002400.0000000001220.0000000002760.0000000001360.0000000003080.0000000001080.0000000002430.0000000001740.000000000382
CRDermal0.00000001060.000000006500.00000001220.000000007480.00000001370.000000008350.00000001080.000000006580.00000001740.0000000106
LCR0.000003810.000001640.000004380.000001880.000004890.000002100.000003860.000001660.000006240.00000268
CrCRIngestion0.00004510.00001930.00006330.00002710.00008230.00003530.00004240.00001820.0001600.0000687
CRInhalation0.000000001260.000000002840.000000001770.000000003990.000000002300.000000005190.000000001180.000000002670.000000004480.0000000101
CRDermal0.0000001260.00000007710.0000001770.0000001080.0000002300.0000001410.0000001190.00000007250.0000004490.000000274
LCR0.00004520.00001940.00006340.00002720.00008250.00003540.00004250.00001820.0001610.0000690
NiCRIngestion0.00006230.00002670.00007210.00003090.00009100.00003900.00006590.00002820.0001280.0000547
CRInhalation0.000000001740.000000003930.000000002020.000000004550.000000002540.000000005730.000000001840.000000004150.000000003560.00000000804
CRDermal0.0000001750.0000001070.0000002020.0000001230.0000002550.0000001560.0000001850.0000001130.0000003570.000000218
LCR0.00006250.00002680.00007230.00003100.00009120.00003920.00006610.00002840.0001280.0000549
Cumulative LCR0.0001260.00005410.0001600.00006880.0002000.00008610.0001280.00005500.0003220.000138
Publisher’s Note: MDPI stays neutral with regard to jurisdictional claims in published maps and institutional affiliations.

