Article

Using One-Step Acid Leaching for the Recovering of Coal Gasification Fine Slag as Functional Adsorbents: Preparation and Performance

1
School of Environmental Science and Engineering, State Key Laboratory of Biobased Material and Green Papermaking, Qilu University of Technology (Shandong Academy of Sciences), Jinan 250353, China
2
Yankuang National Engineering Research Center of Coal Water Slurry Gasification and Coal Chemical Industry Co., Ltd., Jinan 250000, China
*
Authors to whom correspondence should be addressed.
Int. J. Environ. Res. Public Health 2022, 19(19), 12851; https://doi.org/10.3390/ijerph191912851
Submission received: 12 August 2022 / Revised: 16 September 2022 / Accepted: 3 October 2022 / Published: 7 October 2022
(This article belongs to the Special Issue Water Quality and Purification)

Abstract

:
Coal gasification fine slag (FS), a kind of by-product of coal chemical industry, was recovered for the preparation of functional adsorbents by acid leaching process, which was orthogonally optimized by HCl, HNO3, HF, HAc, and H2SO4. Methylene blue (MB) was used to evaluate the performance of functional adsorbents. The results demonstrated that 57.6% of the leaching efficiency (RLE) and 162.94 mg/g of adsorption capacity (CAC) of MB were achieved under the optimal conditions of HNO3 of 2.0 mol/L, acid leaching time of 2.0 h, and acid leaching temperature of 293K. The detections on X-ray Diffraction (XRD), Scanning Electron Microscope (SEM), Fourier Transform Infrared Spectroscopy (FTIR), and BET surface area (SBET) indicated that the synthesized functional adsorbents were characterized by mesoporous materials. The good fitting of adsorption process using pseudo-second-order and Langmuir models demonstrated that the chemisorption contributed to MB removal. The results of thermodynamics further revealed that the adsorption process of MB occurred spontaneously due to the exothermic properties. The work is expected to develop a novel and cost-effective strategy for the safe disposal of FS, and potentially offer an alternative pathway to increase the additional value for the coal chemical industry.

1. Introduction

China’s energy status quo is characterized by lean oil and rich coal. To make better use of abundant coal resources, coal gasification technology is introduced to produce methane, hydrogen, and other combustible gases through the gasification of coal water slurry [1]. Coal gasification slag (CGS) is the by-product of coal gasification technology. The large accumulation of coal gasification slag would lead to the wastage of soil resources, cause pollution of air, water, and soil, and endanger human health [2]. The resource utilization of CGS has been an inevitable topic in the development process of the coal gasification industry.
At present, CGS is mainly reutilized in the fields of industrial production, agricultural industry, building materials, energy recovery, and environmental protection. The industrial application is mainly to add CGS to rubber and plastic, which increases the properties of the polymer [3,4,5,6]. In agriculture, CGS is mainly used as a soil conditioner [7], and a source of silicon fertilizer [8] to improve the composting effect [9,10]. In construction, CGS can be mixed with cement to modify the performance of cement [11], fire bricks [12], and backfill mines [13]. As for energy recovery, CGS can be used to prepare fuel [14,15], used as a battery [16], burned into carbon [17] due to the constituent of residual carbon.
Recently, the application of CGS in pollutant treatment and disposal is mainly used as foundational materials. Liu et al. [18] leached CGS with HCl and removed carbon in a Muffle furnace to obtain a kind of mesoporous material. Zhao et al. [19] found that FS had good adsorption performance on water distribution and adsorption behaviors. due to the pore structure. Additionally, the preparation of zeolite materials from CGS increased great concern due to the pore structure of zeolite materials being more orderly and controllable. There are several types of existing CGS zeolite materials, including single-phase A zeolite [20], NaP zeolite [21], MCM-41 zeolite [22,23], and ZSM-5 zeolite [24]. The common characteristics of the above investigations are involved in the energy input due to the high reaction temperature, which might increase the cost of production.
Actually, CGS could be divided into two kinds of slags, including coarse slag (CS) and fine slag (FS) according to coal gasification process. FS contains a lot of unreacted carbon and a small number of metal substances, which is superior to that of CS, so FS is often recovered as a functional adsorbent to remove pollutants, such as adsorption of dyes [18,25], heavy metals [26], deodorization, and flavor removal [27,28], microwave absorption [29], carbon capture, and transportation [30,31]. Recently, researchers have investigated that MB, as a toxic organic dye, caused water eutrophication, stimulated the human digestive tract, and caused ecological damage [32]. Removal of MB is conducive to maintaining ecological balance and protecting human health. On the other hand, MB has good color rendering; it is very convenient to observe its adsorption process and build the adsorption model. MB is a very common adsorbate in the adsorption process and has a great reference value [33].
Based on the above research, it could be deduced that the reutilization of CGS is an emerging crucial task in the field of the coal chemical industry, and the cost-effective strategy of reducing, recycling, and reusing is of great importance. Therefore, in this work, a one-step leaching process was developed for the preparation of functional adsorbents, and the performance was evaluated by MB removal. Five kinds of acids, including HCl, HNO3, HF, HAc, and H2SO4, were used to optimize the leaching process, which was investigated by the treatment of MB with single-factor and orthogonal experiments. Furthermore, the adsorption mechanisms of functional adsorbents were investigated by adsorption kinetics, adsorption thermodynamics, and adsorption isotherm. It is expected to provide a novel and cost-effective strategy for the reutilization of CGS and improve the additional value of coal chemical industry.

2. Materials and Methods

2.1. Materials

The FS was provided by Yankuang National Engineering Research Center of Coal Water Slurry Gasification and Coal Chemical Industry Co., Ltd. The powder of FS was screened and its particle size was less than 150 μm. HCl and H2SO4 used in the experiment were purchased from Yantai Yuandong Science and Technology Co., Ltd., Yantai, China. HNO3, HF, HAc, potassium hydrogen phthalate, potassium fluoride, potassium chloride, ethanol, sodium hydroxide, ammonia, potassium hydroxide, calcium carbonate, EDTA, sodium acetate, copper sulfate, and ammonium triacetate were all purchased from Shanghai Pharmaceutical Co., Ltd., Shanghai, China, and phenolphthalein, calcein, xanthyl salicylic acid, and MB were purchased from Tianjin Kemiou. DL-mandelic acid and PAN were purchased from McLean. All the reagents used in the experiment were of AR. The above five acids were prepared as a stock solution (10.0 mol/L) and diluted to designed concentration for acid leaching.

2.2. Acid Leaching Process Optimization

All acid treatment reactions except for HF were carried out in 250 mL glass beakers, and HF reaction was conducted in 300 mL plastic beakers in water baths. The samples were filtered and repeatedly washed with deionized water until the solution was neutral, then placed in the electrothermal blowing dry box drying at 333 K for 24 h. The calculation formula for leaching efficiency (RLE) was shown in Formula (1). The content of inorganic components (Si, Fe, Al, Ca) was determined by chemical analysis. The calculation formula of metal element leaching was according to Formula (2). The sample number was named with FS by acid type, acid concentration, leaching time, and temperature, and HCl, HNO3, H2SO4, HAc, and HF were represented by H, N, S, C, and F respectively. For example, FS-N-2M-2 h-293K was denoted as the sample obtained by 2.0 mol/L HNO3 with acid leaching time of 2 h and leaching temperature of 293 K. The ratio of slag to liquid was constant at 1:10 (m/v), and the stirring rate was 120 r/min.
R L E = m e m 0 m L × 100 %
here RLE represents the leaching efficiency of FS, m0 represents the weight of filter paper plus beaker before filtering, me represents the weight of beaker plus filter paper plus sample after drying filter residue, and mL represents the weight of raw materials added in the leaching process of FS.
R L E M = C m V L m L W X R F × 100 %
where RLEM represents the leaching efficiency of metal, Cm is the concentration of metal ions in the solution, which is calculated by DLT 1037-2016. VL is the volume of solution in the acid leaching process, which is calculated by adding the volume of the acid solution. WXRF represents the mass fraction of metal material obtained by XRF analysis (Table 1).
In addition to the normal control experiment, an orthogonal experiment of L16(44) was designed to further optimize the operational conditions (Table S1). Through orthogonal analysis, the relationship between leaching effect and adsorption performance was explored.

2.3. Characterization

For the characterization, the original FS and the samples leached with 2.0 mol/L HCl, HNO3, H2SO4, HAc, and HF at the temperature of 293 K for 2.0 h.
The crystal lattice structure and crystallinity of the material were analyzed by X-ray Diffraction (XRD, D8ADVANCE, Karlsruhe, Germany). Radiation waves were Cu-Kα (λ = 1.5418 A) at 40 kV, 40 mA, deflection angle 2θ = 5–80°. The surface morphology of the sample was observed by scanning electron microscope (SEM, Regulus 8220, Japan), and the elemental composition of the sample was observed by EDS. The composition of surface functional groups was analyzed by Fourier transform infrared spectroscopy (FTIR, Nicolet iS 10, USA). X-ray fluorescence (XRF, PANalytical Axios, Holland, The Netherlands) was used to analyze the composition and content of elements in the original samples. The specific surface area (SSA) was analyzed by Anton Paconta SBET analyzer (Autosorb-IQ, Graz, Austria). Nitrogen was injected into the instrument and tested at 77 K, and the fitting analysis of the specific surface area, pore diameter, and pore volume measurements was carried out by an ASiQwin software. The concentration of MB was conducted on a UV-visible spectrophotometer at 664 nm (UV-Vis DRS, UV-2550, Shimadzu, Kyushu, Japan).

2.4. Adsorption Mechanisms Investigation

2.4.1. Adsorption Process

In the adsorption experiment, the basic conditions were investigated as 200.0 mL of 100.0 mg/L MB, functional adsorbents of 0.1 g, pH of 9.0, stirred in a 120 r/min, reaction time of 24 h. FS-N-2M-2 h-293K was selected to analyze the adsorption mechanism. The adsorption capacity (CAC) of MB, Qe (mg/g), was calculated by the Formula (3):
Q e = ( C 0 C e ) V W
here C0 (mg/L) and Ce (mg/L) represent the concentration of MB solution at the beginning and ending respectively; V(L) represents the volume of MB solution; W(g) represents the mass of functional adsorbent added to the solution.

2.4.2. Adsorption Kinetics

The sample was put into a 250 mL beaker, 200 mL MB of 100 mg/L, stirred in a 120 r/min agitator, and sampled at an interval of 10 min to draw the adsorption kinetics curve. To make validate the adsorption process, three kinetic models, the pseudo-first-order, the pseudo-second-order, and Weber-Morris particle intra diffusion models were used to describe the kinetics of MB adsorption. The relevant equations of Formula (4) (pseudo- first-order model), Formula (5) (pseudo-second-order model), and Formula (6) (Weber-Morris intra diffusion model) were introduced as follows:
Pseudo-first-order kinetic model:
Q t = Q e ( 1 e k 1 t )
Pseudo-second-order kinetic model:
Q t = k 2 Q e 2 t 1 + k 2 Q e t
Weber-Morris particle intra diffusion model:
Q t = k i p t 1 2 + C i
where t (min) represents the reaction time; k1 (min−1) is the pseudo-first-order adsorption rate constant; k2 (g/mg · min) is the pseudo-second-order adsorption rate constant; Qt(mg/g) represents the adsorption capacity of the synthesized functional adsorbents at time t (min); kip (mg/g·min) is the rate constant of the Weber-Morris intra-particle diffusion model; Ci (mg/g) is a constant related to boundary thickness.

2.4.3. Adsorption Isotherm

Add 200 mL methylene blue solution, whose concentration was 10.0 mg/L–300.0 mg/L, into a 250 mL beaker. The solution is stirred on a coagulation stirrer. Samples were taken at an interval of 30 min until the adsorption reaction reached equilibrium. In the work, three typical isotherm adsorption models of Langmuir, Freundlich, and Temkin were applied to fit the isothermal adsorption data. The relevant equations are expressed in Formulas (7)–(10):
Langmuir isothermal model,
Q e = Q max K L C e 1 + K L C e
R L = 1 1 + K L C 0
Freundlich isothermal model,
Q e = K F C e 1 n
Temkin isothermal model,
Q e = R T b l n ( K T C e )
KL (L/mg), KF (mg/g), and KT (L/mg) are Langmuir constant, Freundlich constant, and Temkin constant, respectively. Qmax is the maximum adsorption capacity, RL is the adsorption isothermal coefficient, n is a constant, R = 8.314 J/mol·K is the ideal gas constant, T (K) is the absolute temperature, and b (J/mol) is the coefficient of thermal effect.

2.4.4. Adsorption Thermodynamics

The adsorption isotherm drawing experiments were repeated at 293 K, 303 K, and 313 K to fit the adsorption thermodynamic model. The free energy change (ΔG), enthalpy change (ΔH), and entropy change (ΔS) are shown in Formulas (11)–(14).
Δ G = Δ H T Δ S
Δ G = R · T · ln K c
K c = Q e C e
ln K c = Δ S R Δ H R T
where Kc (L/g) equilibrium adsorption coefficient; ΔG (kJ/mol) is Gibbs free energy, ΔS (kJ/mol · K) is entropy change; ΔH (kJ/mol) is the change in enthalpy.

2.5. Analysis of Data

The control test adopts a multivariate analysis of variance to understand the analysis of time, concentration, and temperature on the structure of RLE and CAC, and involves an orthogonal experiment, which was combined to find the experimental conditions to achieve the best effect [34]. Through the establishment of an unsaturated model and mean comparison analysis, this work found the most suitable model.
Correlation analysis between RLE and CAC, Kendall τ, and Pearson correlation coefficient [35] were calculated.

3. Results and Discussion

3.1. Acid Leaching Process Optimization

3.1.1. Acid Type Effect

FS was treated with HNO3, HCl, H2SO4, HAc, and HF, and the results were demonstrated in Figure 1. It was found that the RLE of FS decreased in the following way: HNO3 > HCl > H2SO4 > Hac > HF. This indicated that the RLE of FS treated by HNO3, HCl, and H2SO4 was better than that of the HAc and HF. The acid leaching process was used to remove metal substances from FS, leaving the porous structure for the preparation of the foundation adsorbent. As shown in Figures S1–S3, Ca, Al, Fe, and Si were detected in the leaching solution, and the results could be attributed that the original glass microspheres in the solution and the glass microspheres leached by the acid leaching reaction will partially penetrate the filter paper and enter the filtrate. In addition, there were silicon and metal compounds, and acid leaching caused the silicon to react with the metal to form H2SiO3 (Formula (15)), which was filtered into the filtrate [36]. The silicon content in the filtrate came from glass microspheres, which generally reflected the modification effect of carbon materials.
H + + X a S i O b H 2 O + H 2 S i O 3 + X 2 b a
where H+ is hydrogen ion, X represents metal element, a is the number of metal atoms in silicate, Si represents the element of silicon, O represents the element of oxygen, and b is the number of oxygen atom in the silicate.
The results further indicated that the RLE of HNO3 and HCl was better than that of H2SO4, and HNO3 has the highest RLE. In the metal leaching efficiency diagrams (Figures S1–S3), there is no obvious difference in the leaching ability of metal oxide between HNO3 and HCl, except for the leaching rate of silicon. Due to the strong oxidizing property of HNO3, it had a stronger ability to modify the carbon surface [37]. RLE of H2SO4 was worse than that of HNO3 and HCl. The result demonstrated that Ca was often added as a catalyst component in coal gasification production [38], and H2SO4 reacts with Ca2+ forming CaSO4, which is insoluble in water. CaSO4 blocks the pore and hinders the progress of the reaction.
The ionization degree of HAc and HF was weaker than that of strong acid, leading to the ability of leaching metal. Moreover, F could react with metal and form CaF2, AlF3, and FeF3, which might deposit on the surface of the sample, and affect the RLE and CAC [39]. Additionally, HAc was weak in acidity, and had poor reactivity with Al, inhibiting its RLE.

3.1.2. Acid Concentration Effect

As shown in Figure 1a, RLE gradually increased with the increase of acid concentration until it reached equilibrium, and the RLE of inorganic substances changed with the concentration (Figure S1).
In the high concentration range, the acids exhibited different RLE. When the concentration reached more than 6.0 mol/L, the RLE of HNO3 decreased. From the analysis of the optimal reaction conditions, the FS can be disposed of by HNO3, and the best RLE can be achieved at 6.0 mol/L. As the acid concentration increased, the reaction between concentrated HNO3 and organic matter was no longer oxidation, but a substitution reaction occurred, and the functional groups on the surface of the FS were replaced with amino group [40]. HCl reached the optimal leaching amount at 4.0 mol/L, and the leaching rate curve of silicon in HCl (Figure S1 Si), was consistent with the RLE curve. The ability of HCl to modify the organic components of the FS was the best. The optimal RLE of H2SO4 was 1.5 mol/L. As the concentration of H2SO4 increased, the concentration of SO42− in the solution increased, promoting the formation of CaSO4 precipitation, and reducing RLE. The HAc leaching of various metal substances was mainly driven by pH, and the increase of HAc concentration promotes the reaction [41]. HF and H2SO4 showed the same performance. As the concentration increased, insoluble matter precipitated, reducing the RLE.

3.1.3. Leaching Time Effect

Figure 1b indicated the leaching time effect on RLE, which could be divided into two stages. In the first stage, as the reaction progresses, RLE continued to increase, and metal oxides were continuously precipitated (Figure S2). In the second stage, the reaction reached equilibrium. RLE obtained in the first stage had the same trend, and was different in the second stage.
HNO3 and HCl, with the progress of the reaction, kept the RLE improving. After the reaction reached equilibrium, Fe2+, Al3+, and H2SiO3 in the solution formed polymeric aluminum silicate flocculants, which hindered the reaction process (Figure S2), and reduced RLE. RLE of H2SO4 was controlled by the CaSO4 content in the system. During the reaction process, after RLE reached the maximum, the RLE of CaSO4 was constantly changing until it was balanced. In Figure S2, the change of Ca controls the RLE, and the CaSO4 in the H2SO4 leaching process did not affect the leaching of other metal elements and silicon. HAc was especially weak in acidity, and the reaction process slowed down as the reaction went on, the metal oxides were continuously leached out, and RLE of FS gradually increased until equilibrium (Figure S2).

3.1.4. Leaching Temperature Effect

As shown in Figure S3, Si appeared in the solution in the form of H2SiO3 with the rising temperature under acidic conditions, which hindered the progress of the reaction, and reduced the RLE of HNO3 (Figure S3). With the increase in temperature and the break of metal chemical bonds (Figure S3), the RLE of HCl increased [28]. During the leaching process, the solubility of CaSO4 increased with the increase in temperature (Figure S3 Ca), and the content of Ca in the leaching solution continued to increase, so the RLE of H2SO4 improved with the increase of temperature. It seemed that the temperature had little effect on the RLE of HAc, however, higher temperature made the reaction between HF and Si more thorough (Figure S3 Si), and improved the RLE of HF [42].

3.2. Optimization of Leaching Conditions

Absorption capacity investigation was conducted in Figure 2, it was found that the CAC of MB was linearly correlated with the RLE (Table S2). Among them, HNO3, HCl, and HAc had a strong correlation due to the higher coefficient, which was much less for HF and H2SO4. The results could be ascribed that the sedimentation such as CaF2 and CaSO4 was settled on the surface of the functional adsorbents leached by HF and H2SO4, which might block the porous structure, decreasing its adsorption effect. Table 2 further indicated that the pore structure improved after the acid leaching because the inorganic components were dissolved out and the rich porous structure was left (Table 2), which played a great role in adsorption capacity.
The results of the multivariate analysis of variance were shown in Table S3. It could be found that most of the correlations R2 were more than 0.9500, except for that of CAC of HF, and the Type III Sum of Squares based on RLE and CAC were in line with leaching time > acid concentration > acid type > temperature. In the orthogonal experimental, RLE and CAC, the Delta conformed acid type > leaching time > acid concentration > temperature. According to the results of the single-factor experiment (Table S3) and orthogonal analysis (Tables S1, S4 and S5, Figure 1d and Figure 2d), the effect of different reaction conditions was in the order of acid type > leaching time > acid concentration > temperature. Based on the above investigation and cost, the optimal condition was selected as 2.0 mol/L HNO3 at 293 K for 2.0 h. Under this condition, the CAC was up to 162.94 mg/g while the RLE was 57.6%.

3.3. Characterization of Functional Adsorbents

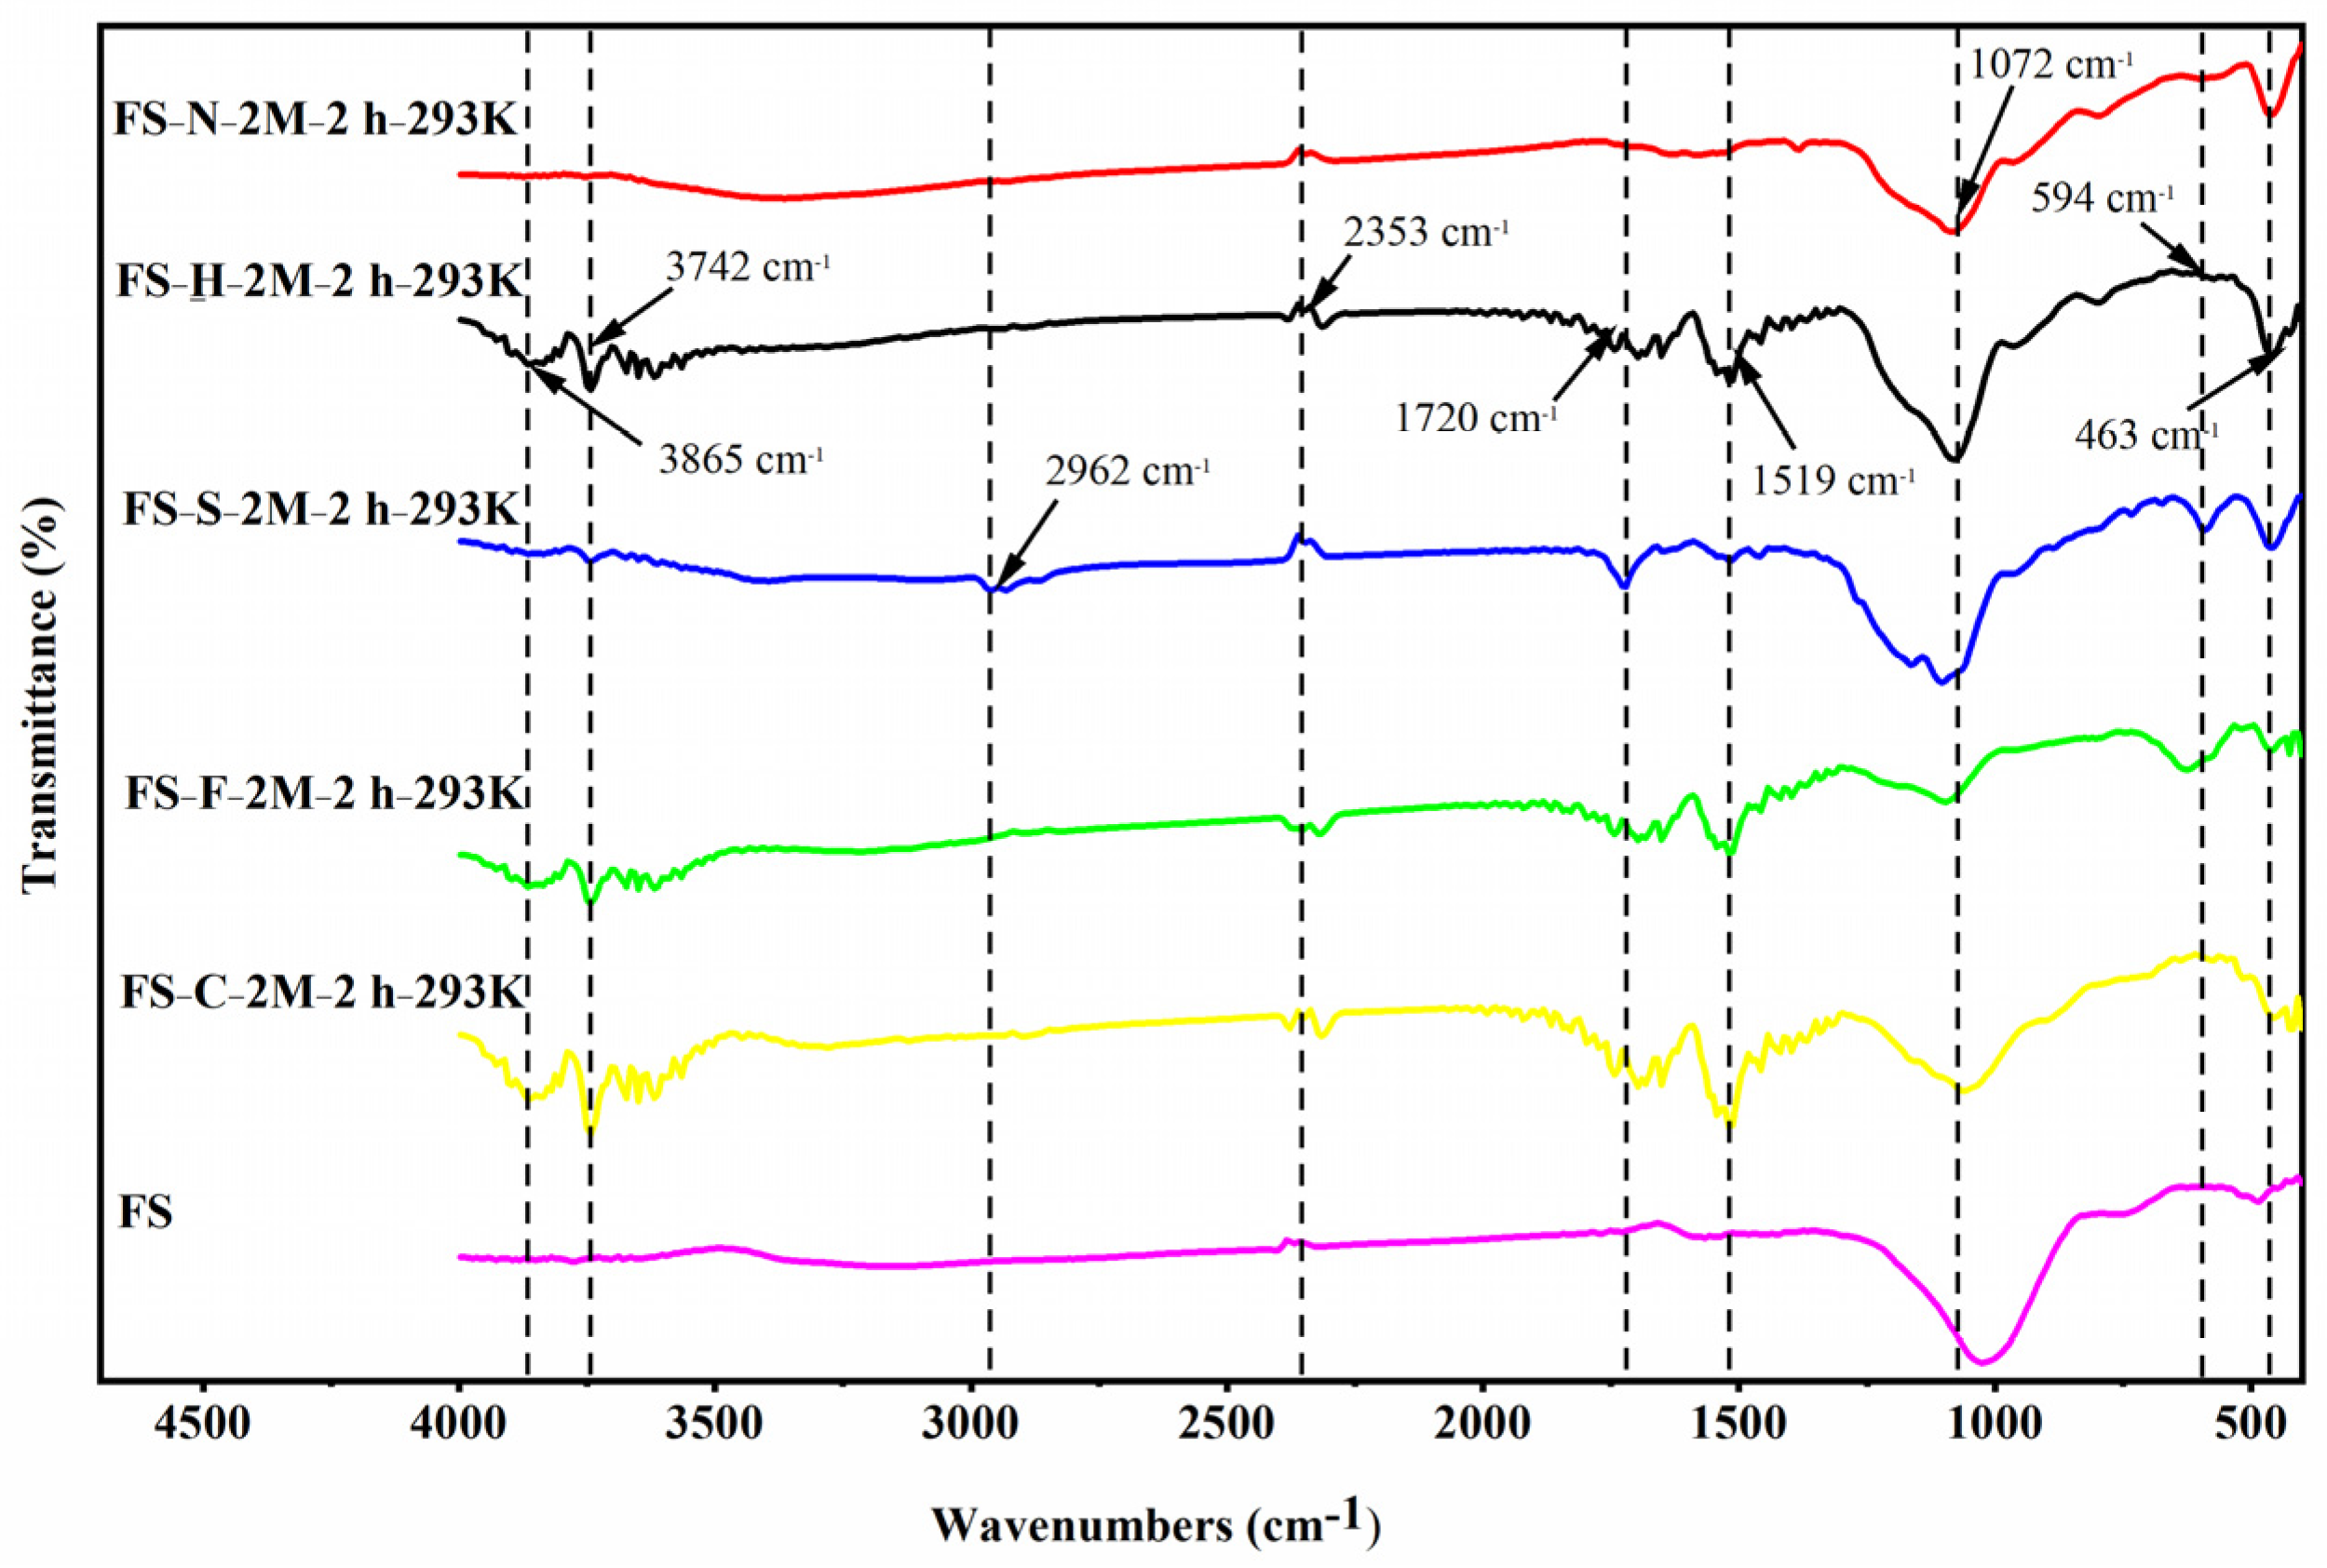
Figure 3 showed the FTIR spectrum of functional adsorbents. O-Si-O bending vibration peak was generated at 463 cm−1 [43]. Si-O-Si or Si-O at 1072 cm−1 [44] acted together with carbohydrates to produce the characteristic peak of stretching vibration. The vibration peak at 1519 cm−1 was responsible for the HO-H distortion vibration of adsorbed water molecules. The stretching vibration of 2353 cm−1 and 1720 cm−1 could assign to C=O, and 2962 cm−1 might attribute to the asymmetric vibration of C-H [45], and the bending vibration of -OH might be located at 3865 cm−1 and 3742 cm−1. Functional adsorbents leached by HCl, HF, HAc, and H2SO4 occurred new functional groups, whereas those treated with HNO3 did not generate new functional groups.
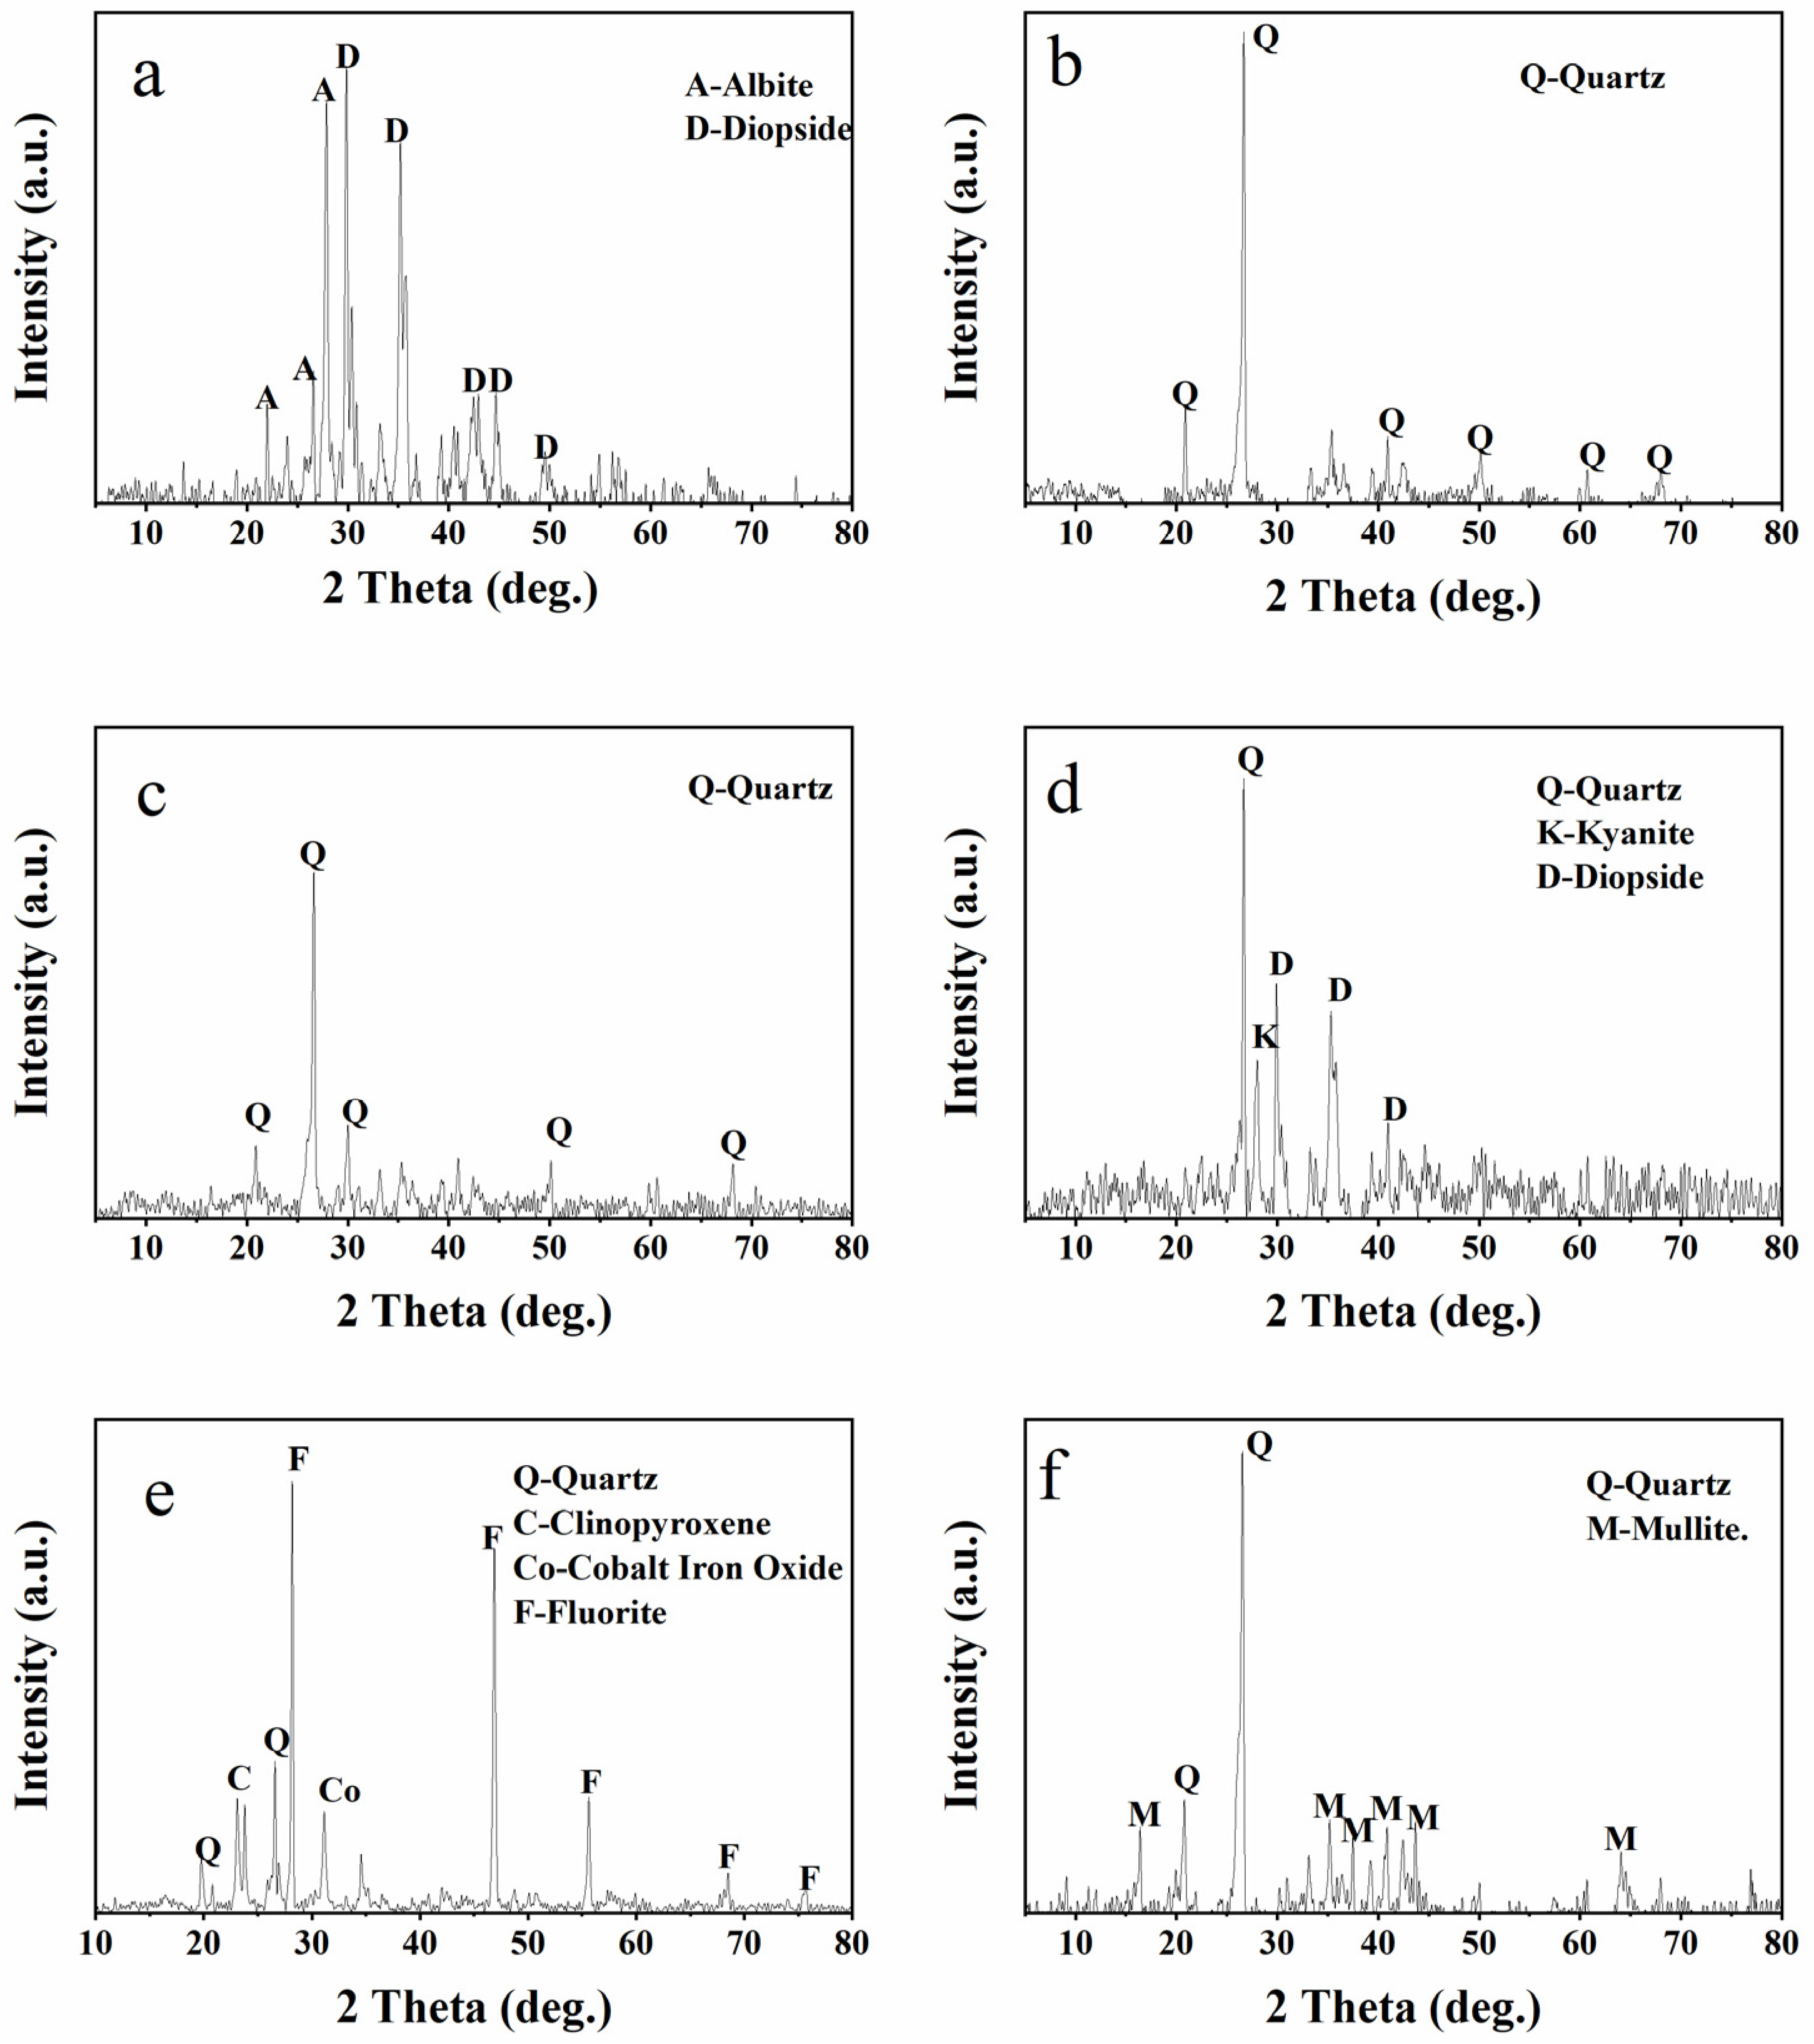
The XRD of the functional adsorbents can be divided into two categories. The functional adsorbents were directly leached by acid (Figure S4), and those obtained after acid leaching were burned in a muffle furnace at 1123 K for 3 h (Figure 4). In Figure S4, FS and functional adsorbents treated with HCl, HNO3, and HAc showed peaks in the quartz phase. The functional adsorbents treated with H2SO4 showed the structure of CaSO4 (Figure S4e), and those treated with HF occurred in SiO2 and fluoride crystal phases (Figure S4f). The results showed that disordered albite and thermo-refractive glycoside crystal phases appeared in FS after combustion (Figure 4a), and only the quartz crystal remained in the burned functional adsorbents treated with HCl and HNO3 (Figure 4b,c). Before and after burning, the peaks produced by the functional adsorbents treated with H2SO4 and HF (Figure 4d,e) had no significant change. The mullite crystal phase was produced in the functional adsorbent treated with HAc (Figure 4f), and aluminum was not completely removed during acid leaching.
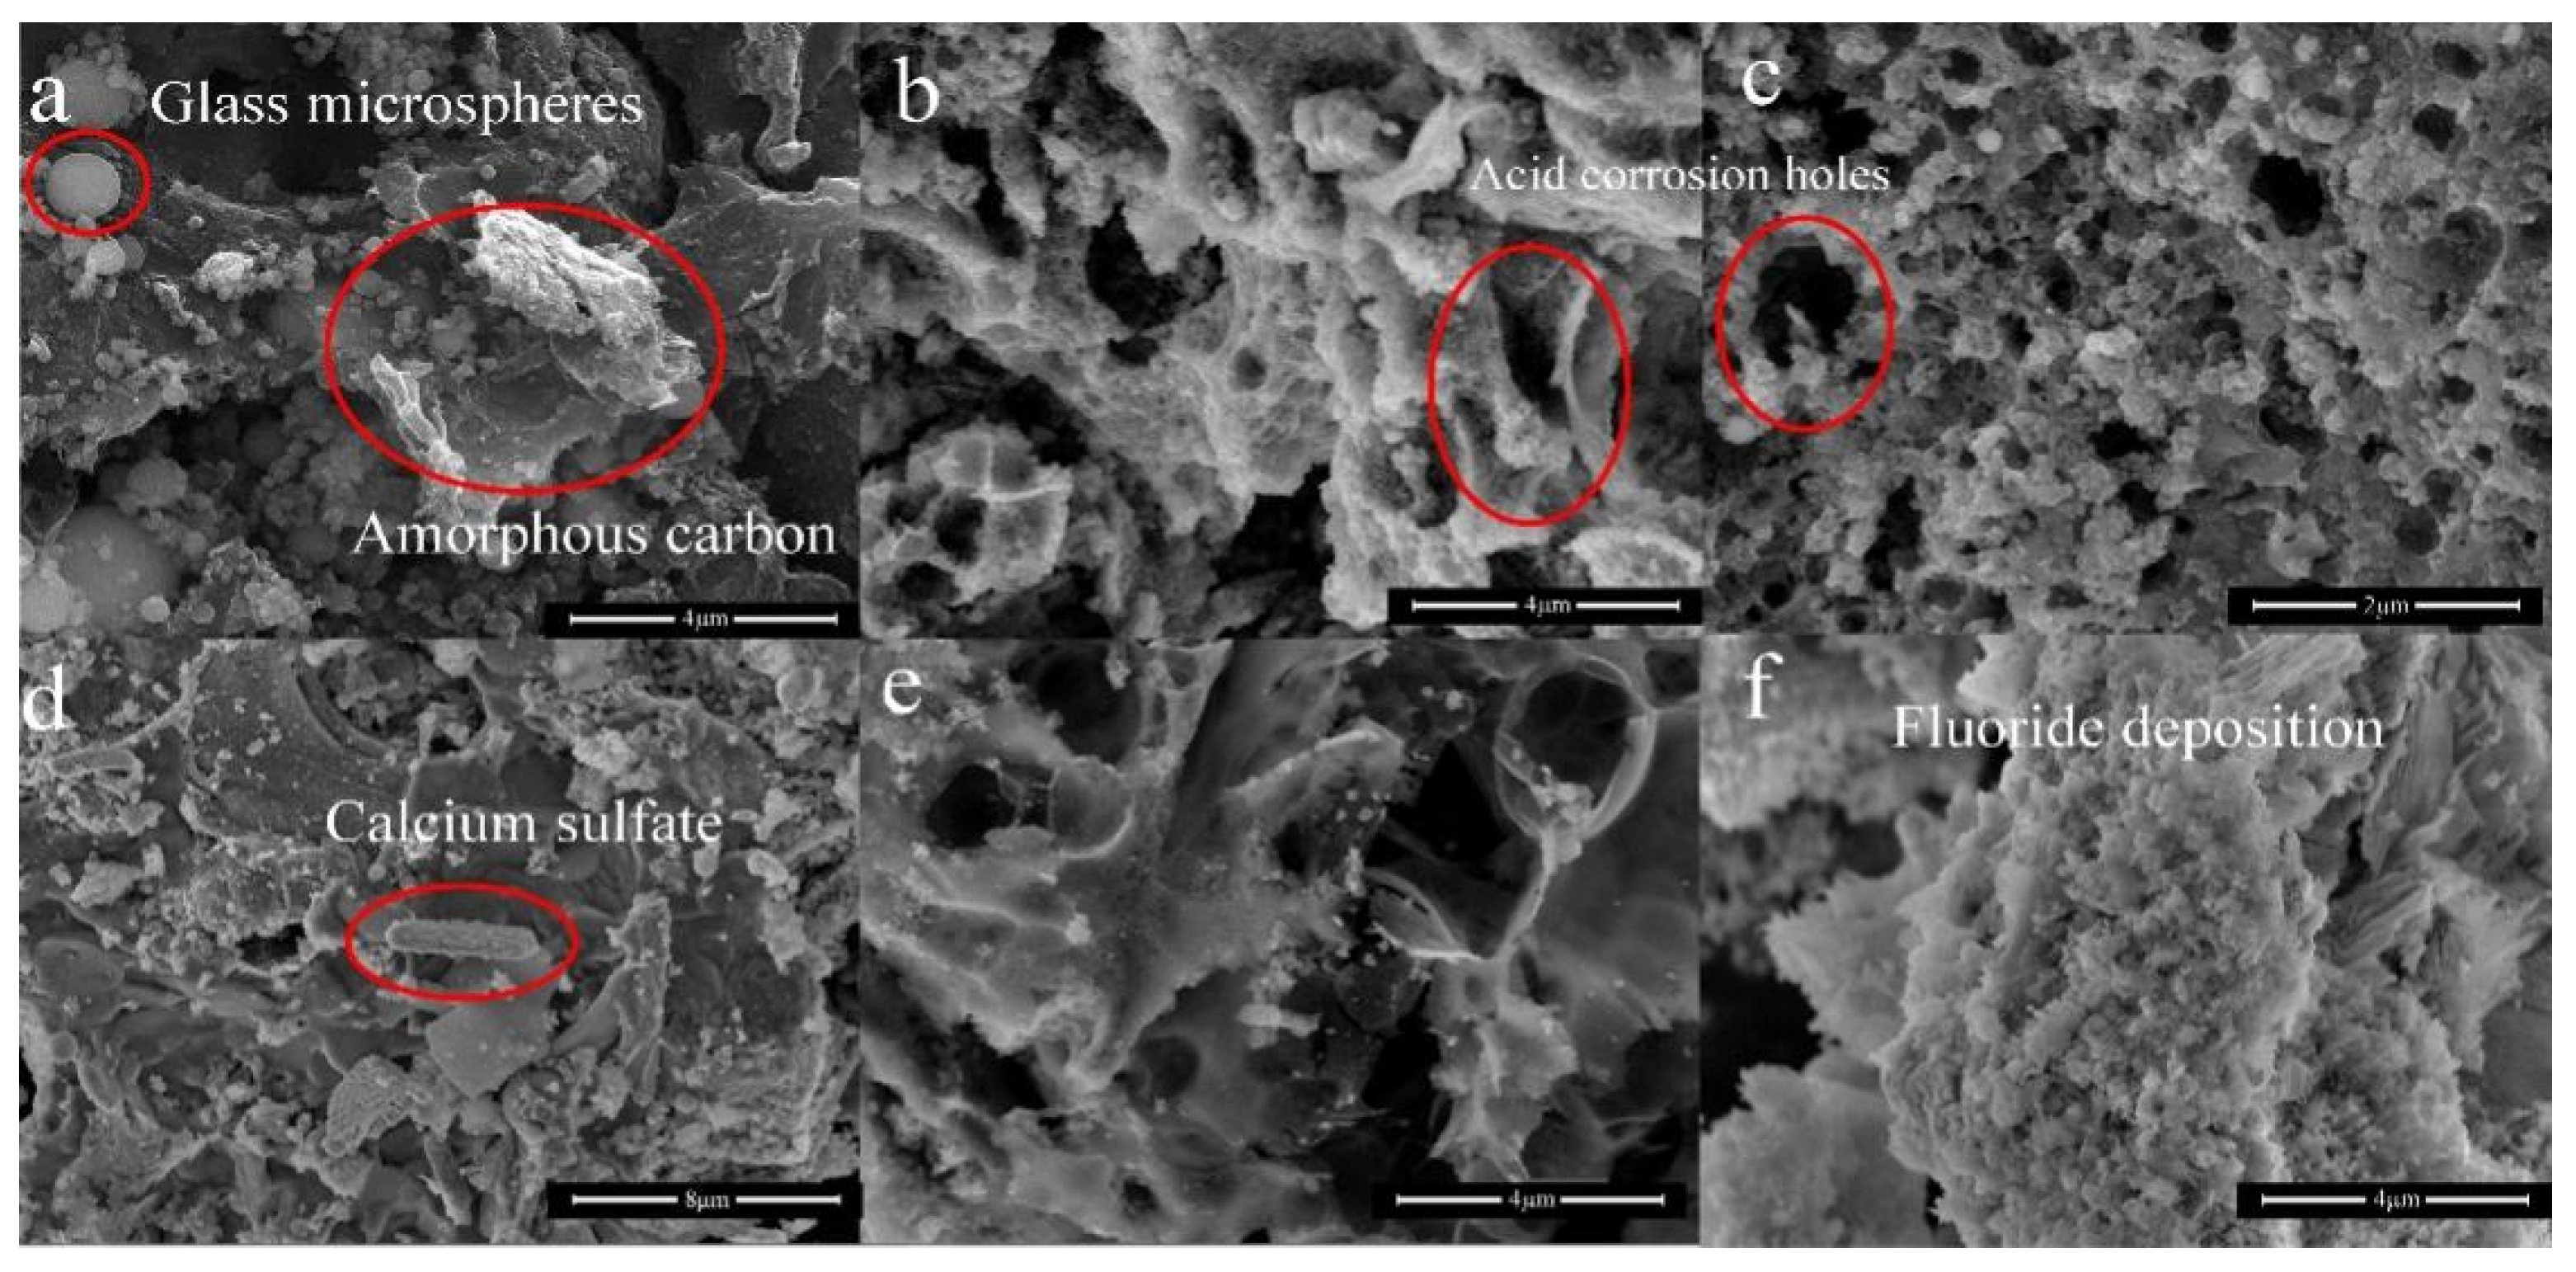
The SEM of FS and the functional adsorbents were shown in Figure 5. It could be seen that FS was composed of molten glass microspheres and amorphous carbon (Figure 5a). The glass microspheres were divided into two parts, one part existed alone, and the other part was wrapped in carbon. Figure 5b,c was the functional adsorbents leached by HNO3 and HCl, which are characterized by bigger pores, the basic skeleton of the surface, and the three-dimensional pore structure that had not changed [11], and the surface of HNO3 treated functional adsorbents was smoother. Furthermore, it was obvious that functional adsorbents synthesized by H2SO4 leaching process, the surface of which was covered with a layer of CaSO4 particles (Figure 5d), and which was slightly corroded with larger porous structure in HAc leaching process (Figure 5e), and the surface of functional adsorbents synthesized by HF was the roughest one due to deposition of fluoride (Figure 5f). The results further demonstrated that the acid type played a crucial role in the leaching process. Additionally, combined with Figure 5e,f, Figures S5 and S6, it could be deduced that the content of metal and silicon in functional adsorbents decreased, leading to the improvement of the porous structure.
In the N2 adsorption and desorption curves in Figure 6a, except for the functional adsorbents leached with HNO3, the isotherms during the adsorption process were all type IV adsorption isotherms, and the functional adsorbents treated with HNO3 showed the characteristics of type II adsorption isotherms, which proved that the pore structure of the functional adsorbents after HNO3 treatment played a great role in the improvement of adsorption capacity. H3-type hysteresis loops appeared in all functional adsorbents with complex pore structures. In the pore size distribution curve (Figure 6b), the pores were mainly distributed in the mesoporous region, and FS-H-2M-2 h-293K had a certain pore size distribution in the macropore range, the results were in agreement with that of SEM. Table 2 showed that the pore size changed from 19.09 nm to 3.82–3.83 nm after acid leaching. The specific surface area increased from 151.67 m2/g to 340.40 m2/g, and the pore volume increased from 0.21 cc/g to 0.48 cc/g. The results firmly proved that the functional adsorbents were characterized by mesoporous materials.

3.4. Adsorption Mechanisms Investigation

The adsorption kinetic model was investigated by pseudo-first-order kinetics, pseudo-second-order kinetics, and the Weber-Morris model [46,47], and the adsorption isotherm was depicted by Langmuir adsorption isotherm, Freundlich adsorption isotherm, and Temkin adsorption isotherm model [48,49]. Furthermore, the adsorption thermodynamic model [50] was demonstrated by Gibbs free energy (ΔG), entropy change (ΔS), and enthalpy change (ΔH).

3.4.1. Adsorption Kinetics

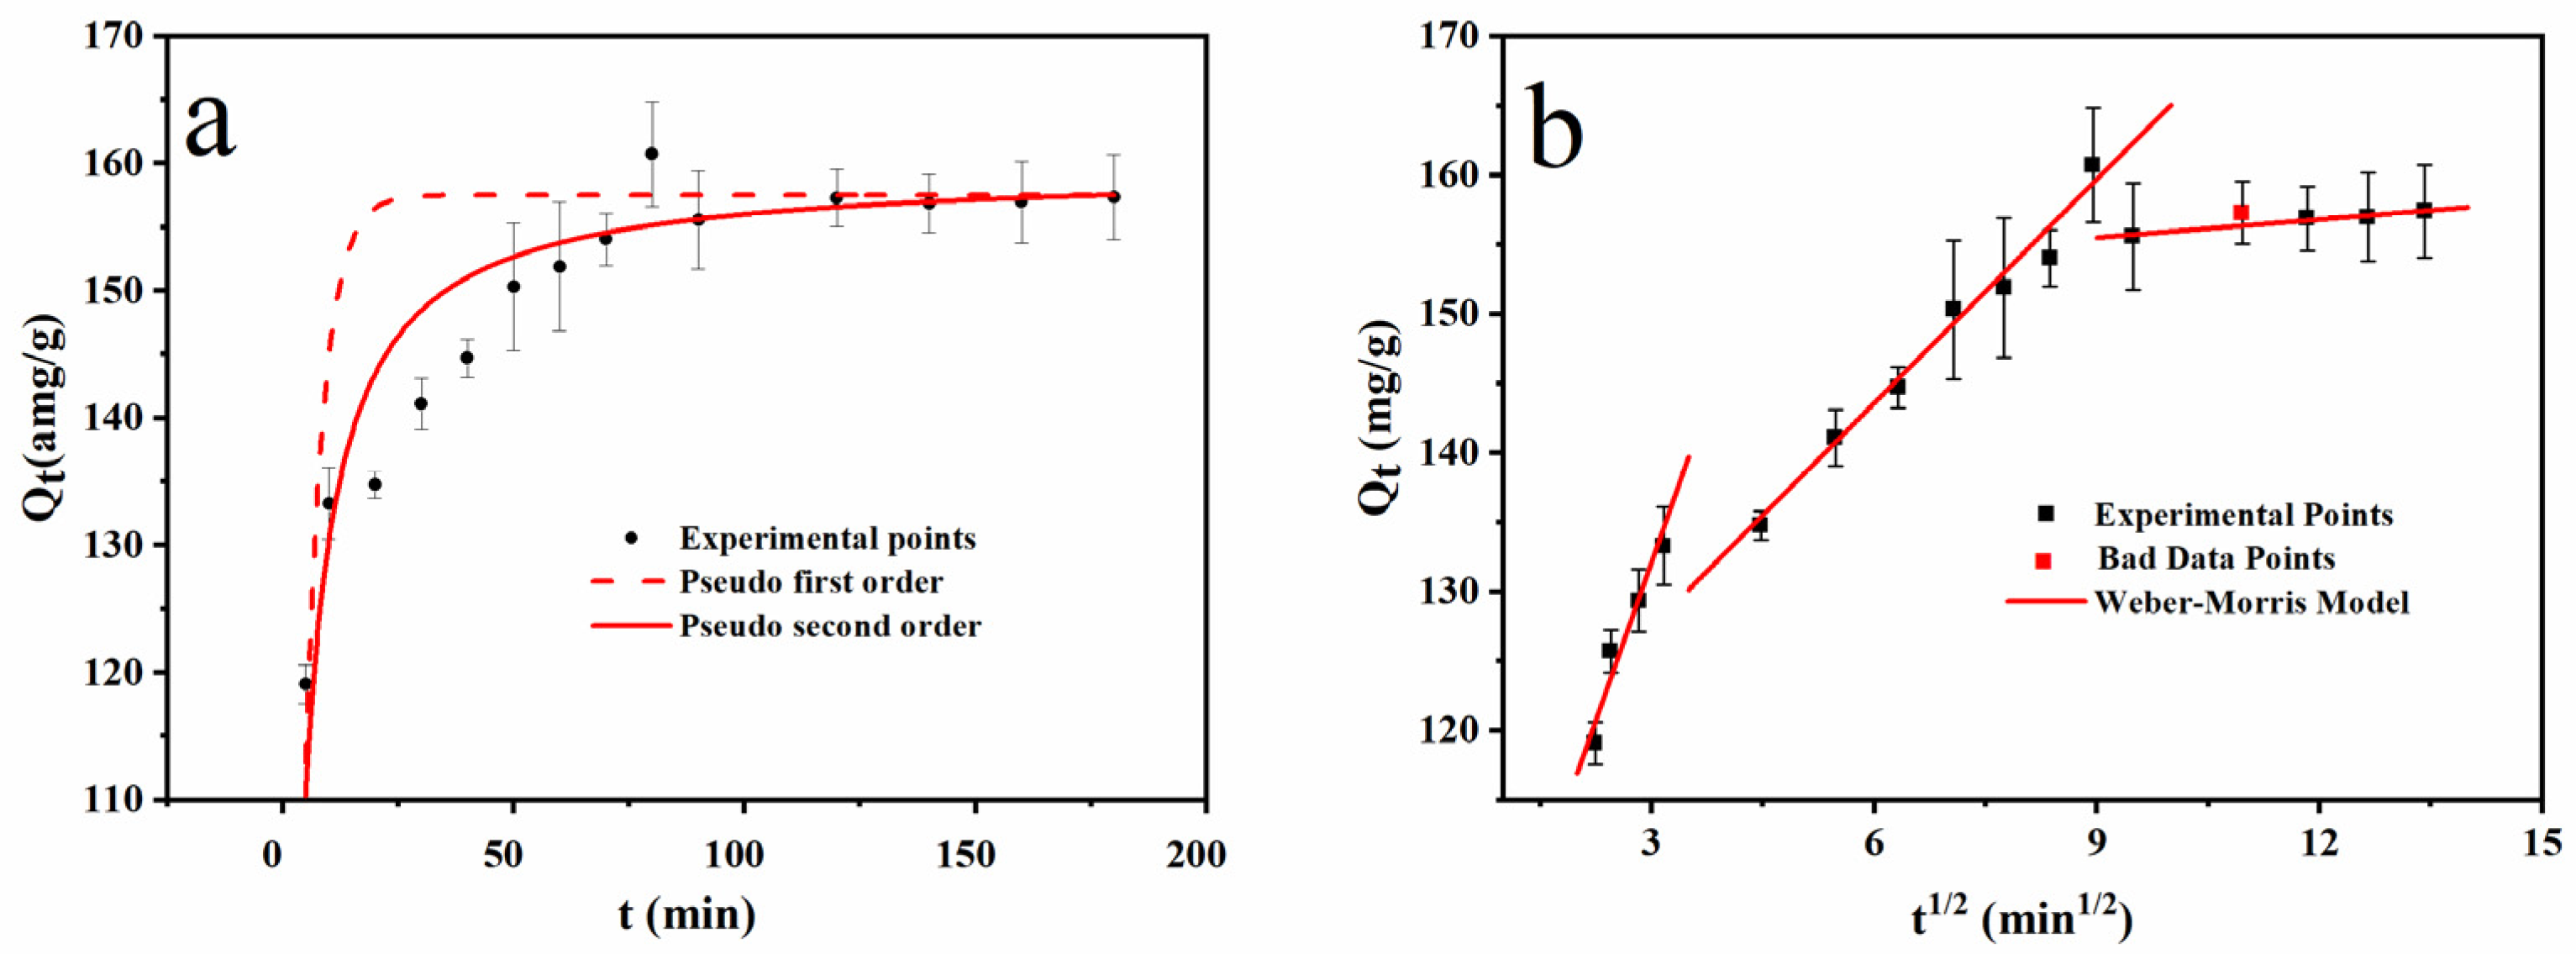
As shown in Figure 7a and Table 3, the adsorption process was in line with that of pseudo-second-order kinetic model due to the correlation coefficient R2 of 0.875 and χ2 of 12.193. The theoretical saturated adsorption capacity was 156.10 mg/g, which showed the relative error within 5% compared with 153.94 mg/g at 200.0 min, and the results were in line with expectations. Moreover, the fitting of the Weber-Morris model (Figure 7b) showed that the adsorption process was divided into three stages. The curves of the three stages were all beyond the origin, indicating that the adsorption process was not only limited by the internal diffusion of the adsorbate particles, but also limited by other factors. The first section of the curve was the mass transfer process of MB outside FS-N-2M-2 h-294K. The second section was the mass transfer process of MB molecules in the inner pores of the functional adsorbent. The third section indicated the adsorption equilibrium. The diffusion rate constant Ki1 > Ki2 > Ki3 (Table 3) demonstrated that the external mass transfer rate of the adsorbate molecules was very fast during the adsorption process. After crossing the liquid film on the surface of FS-N-2M-2 h-294K, it entered the u-empty-island in the functional adsorbent lowly into the internal pores of the particle.

3.4.2. Adsorption Isotherm

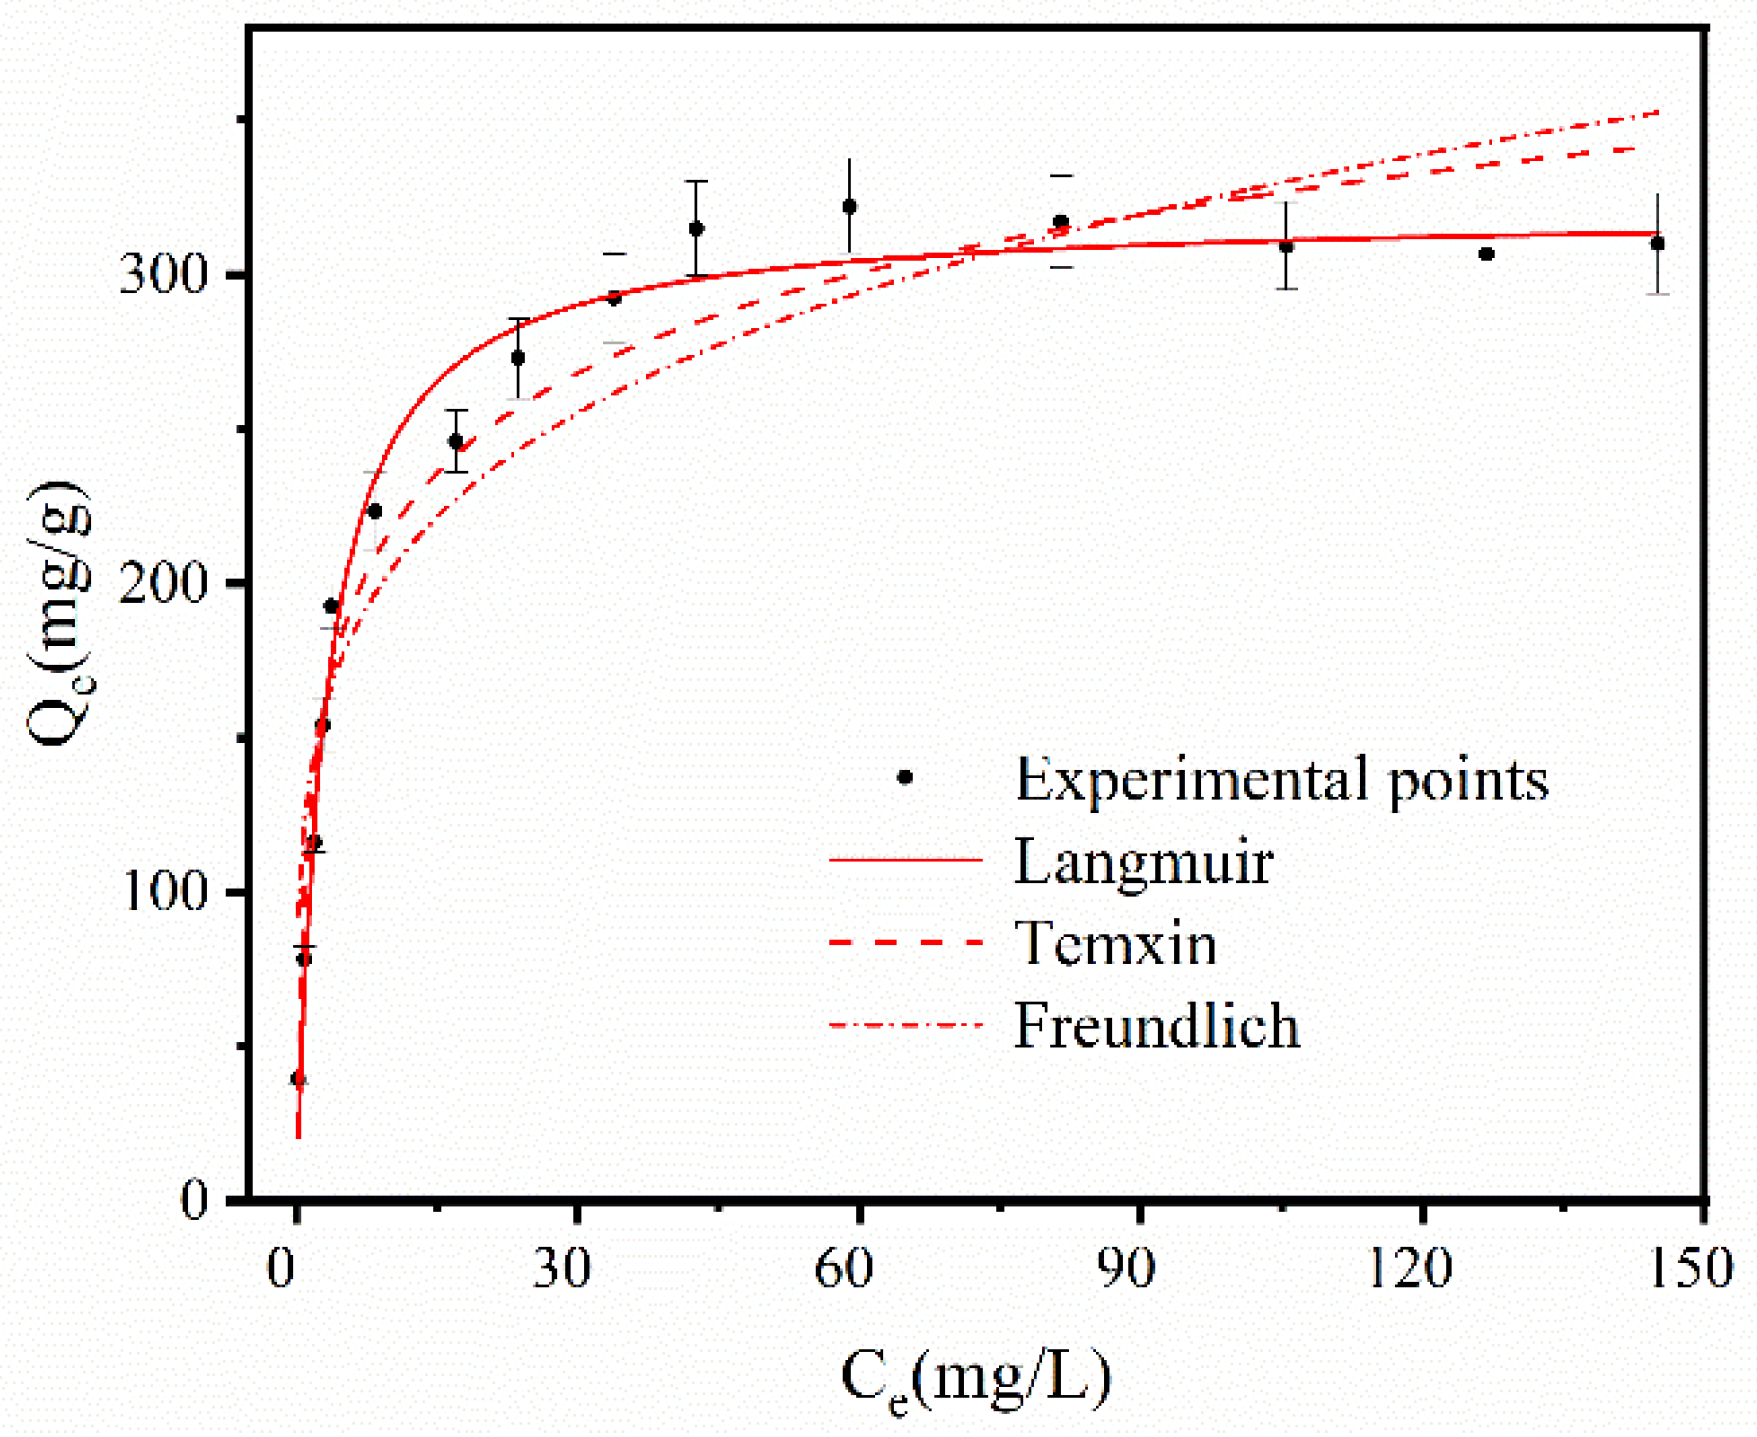
The adsorption isotherm of MB in Figure 8 was measured by changing the concentration of MB in the solution, and Table 4 was the coefficient of adsorption isotherm at different temperatures. It can be seen that the correlation coefficient Langmuir > Temkin > Freundlich, Langmuir was greater than 0.9 at different concentrations, and the fitness was the highest among the three adsorption isotherms, indicating that the monolayer adsorption occurred on the surface of the FS-N-2M-2 h-294K for MB. 0 < RL < 1, and 1 < n in Freundlich, it can be judged that preferential adsorption occurred in the reaction. It was proved by the Temkin model that there was a strong molecular force in the adsorption process. The good fitting of adsorption process of pseudo-second-order and Langmuir models demonstrated that MB adsorption was involved in the chemisorption rate controlling mechanism.

3.4.3. Adsorption Thermodynamics

In Table 5, ΔG was negative at different temperature, indicating that the reaction could proceed spontaneously, the absolute value of ΔG decreased with the increase in temperature, and the adsorption driving force of MB was stronger at a lower temperature. During the adsorption process, ΔS was less than zero, indicating that the whole system was more orderly after the MB were adsorbed on the surface of the FS-N-2M-2 h-294K during the adsorption process. ΔH less than zero proved that the adsorption process of MB was exothermic.
Furthermore, a performance comparison of adsorption effect on MB adsorption between the resulted functional adsorbent FS-N-2M-2 h-293K and previously reported adsorbents has been depicted in Table 6 [51,52,53,54,55]. The results of the analyses revealed that the novel functional adsorbent gains advantage over many other adsorbents, indicating that FS-N-2M-2 h-293K is a potential promising strategy for the treatment of MB wastewater. Simultaneously, it could be further proved that the acid leaching process was an effective way for the reutilization of FS.

4. Conclusions

The work successfully initiated one-step process of acid leaching for the preparation of functional adsorbent based on FS without extra chemical reagents and energy input. Moreover, the effluent from acid leaching could be further recycled for the neutralization of industrial alkaline wastewater, and the filtration from acid leaching could be further applied to prepare multi-ionic flocculants. Therefore, one-step acid leaching was characterized by cost-effectiveness, high efficiency, easy operation, and less occupied area. The work provided a safe way for economically viable production of adsorbents, and simultaneously offered a novel strategy for increasing the additional value of coal chemical industry.

Supplementary Materials

The following supporting information can be downloaded at: https://www.mdpi.com/article/10.3390/ijerph191912851/s1, Figure S1. Acid concentration on the leaching rate of metal: Ca-leaching changes of calcium; Al-leaching changes of aluminum; Fe-iron leaching change; Si-silicon leaching changes. Figure S2. Leaching time on the leaching efficiency of metal: Ca-leaching changes of calcium; Al-leaching changes of aluminum; Fe-leaching change of iron; Si-leaching changes of silicon. Figure S3. Temperature on the leaching efficiency of metal: Ca-leaching changes of calcium; Al-leaching changes of aluminum; Fe-leaching change of iron; Si-leaching changes of silicon. Figure S4. XRD analysis of initial FS and functional adsorbents leached by acid: (a) initial FS, (b) HNO3, (c) HCl, (d) H2SO4, (e) HAc, (f) HF. Figure S5. The SEM-EDS analysis of initial FS and functional adsorbents: (a) initial FS, (b) FS-N-2M-2 h-293K, (c) FS-H-2M-2 h-293K. Figure S6. The SEM-EDS analysis of functional adsorbents: (a) FS-S-2M-2 h-293, (b) FS-F-2M-2 h-293K, (c) FS-C-2M-2 h-293K. Table S1. Design and results of orthogonal experiment. Table S2. Correlation analysis of leaching rate and adsorption capacity. Table S3. Multifactor parameter analysis of leaching efficiency (RLE) and adsorption capacity (CAC). Table S4. Design and results of orthogonal experiment. Table S5. Orthogonal experimental analysis of adsorption capacity.

Author Contributions

T.L.: Writing—Original Draft, Methodology, Formal analysis; S.H.: Methodology, T.S., J.S. and W.L.: Writing-Review & Editing, Conceptualization, Funding acquisition, Resources; C.S., H.P., R.L. and E.Z.: Formal analysis; D.Y.: Materials, Instruments; X.L., Y.F. and G.G.: Methodology. All authors have read and agreed to the published version of the manuscript.

Funding

The work was supported by the Foundation (No. ZZ20210124) of State Key Laboratory of Biobased Material and Green Papermaking, Qilu University of Technology, Shandong Academy of Sciences, National College Students’ Innovation and Entrepreneurship Training Program (No. 202110431079), and Qilu University of Technology (Shandong Academy of Sciences) Basic Research Project of Science, Education, and Industry Integration Pilot Project (No. 2022PY047).

Institutional Review Board Statement

Not applicable.

Informed Consent Statement

Not applicable.

Data Availability Statement

The data presented in this study are available on request from the corresponding author.

Acknowledgments

Coal gasification slag was provided by Yankuang National Engineering Research Center of Coal Water Slurry Gasification and Coal Chemical Industry Co., Ltd., (Jinan, China).

Conflicts of Interest

All authors stated that they had no competing financial interest or personal relationships that could have appeared to influence the work reported in this paper.

Abbreviations

CGSCoal gasification slag
FSCoal gasification fine slag
CSCoal gasification coarse slag
MBMethylene blue
RLELeaching efficiency
CACAdsorption capacity
FS-N-2M-2 h-293KThe sample was obtained by 2.0 mol/L HNO3 at 293 K for 2 h.
FS-H-2M-2 h-293KThe sample was obtained by 2.0 mol/L HCl at 293 K for 2 h.
FS-S-2M-2 h-293KThe sample was obtained by 2.0 mol/L H2SO4 at 293 K for 2 h.
FS-F-2M-2 h-293KThe sample was obtained by 2.0 mol/L HF at 293 K for 2 h.
FS-C-2M-2 h-293KThe sample was obtained by 2.0 mol/L HAc at 293 K for 2 h.

References

  1. Ding, L.; Dai, Z.H.; Wei, J.T.; Zhou, Z.J.; Yu, G.S. Catalytic effects of alkali carbonates on coal char gasification. J. Energy Inst. 2017, 90, 588–601. [Google Scholar] [CrossRef]
  2. Dai, G.F.; Zheng, S.J.; Wang, X.B.; Bai, Y.H.; Dong, Y.S.; Du, J.; Sun, X.W.; Tan, H.Z. Combustibility analysis of high-carbon fine slags from an entrained flow gasifier. J. Environ. Manag. 2020, 271, 9. [Google Scholar] [CrossRef] [PubMed]
  3. Ai, W.D. High-value application of glass beads/porous carbon obtained from coal gasification fine slag as alternative for carbon black in natural rubber composite. J. Vinyl Addit. Technol. 2022, 28, 542–552. [Google Scholar] [CrossRef]
  4. Ai, W.D.; Liu, S.; Zhang, J.P.; Miao, S.D.; Wei, C.D. Mechanical and nonisothermal crystallization properties of coal gasification fine slag glass bead-filled polypropylene composites. J. Appl. Polym. Sci. 2019, 136, 47803. [Google Scholar] [CrossRef]
  5. Ai, W.D.; Xue, B.; Wei, C.D.; Dou, K.Z.; Miao, S.D. Mechanical and thermal properties of coal gasification fine slag reinforced low density polyethylene composites. J. Appl. Polym. Sci. 2018, 135, 46203. [Google Scholar] [CrossRef]
  6. Ai, W.D.; Zhang, J.P.; Zhang, J.Y.; Miao, S.D.; Wei, C.D. Mechanical properties and morphology of coal gasification fine slag glass bead-filled acrylonitrile-butadiene-styrene (ABS) composites. J. Appl. Polym. Sci. 2020, 137, 48601. [Google Scholar] [CrossRef]
  7. Zhu, D.D.; Miao, S.D.; Xue, B.; Jiang, Y.S.; Wei, C.D. Effect of Coal Gasification Fine Slag on the Physicochemical Properties of Soil. Water Air Soil Pollut. 2019, 230, 11. [Google Scholar] [CrossRef]
  8. Zhu, D.D.; Xue, B.; Jiang, Y.S.; Wei, C.D. Using chemical experiments and plant uptake to prove the feasibility and stability of coal gasification fine slag as silicon fertilizer. Environ. Sci. Pollut. Res. 2019, 26, 5925–5933. [Google Scholar] [CrossRef]
  9. Liu, T.; Awasthi, M.K.; Awasthi, S.K.; Ren, X.N.; Liu, X.Y.; Zhang, Z.Q. Influence of fine coal gasification slag on greenhouse gases emission and volatile fatty acids during pig manure composting. Bioresour. Technol. 2020, 316, 9. [Google Scholar] [CrossRef]
  10. Liu, T.; Awasthi, M.K.; Jiao, M.N.; Awasthi, S.K.; Qin, S.Y.; Zhou, Y.W.; Liu, H.M.; Li, J.; Zhang, Z.Q. Changes of fungal diversity in fine coal gasification slag amendment pig manure composting. Bioresour. Technol. 2021, 325, 9. [Google Scholar] [CrossRef]
  11. Li, Z.H.; Zhang, Y.Y.; Zhao, H.Y.; Chen, H.X.; He, R. Structure characteristics and composition of hydration products of coal gasification slag mixed cement and lime. Constr. Build. Mater. 2019, 213, 265–274. [Google Scholar] [CrossRef]
  12. Wang, J.T.; Wang, Q.H.; Chen, S.L.; Yuan, L.; Li, Y.W. Comparison of corrosion resistance of high chromia brick, high zirconia brick, fused AZS brick and Si3N4 bonded SiC brick against coal slag. Ceram. Int. 2020, 46, 10851–10860. [Google Scholar] [CrossRef]
  13. Xin, J.; Liu, L.; Jiang, Q.; Yang, P.; Qu, H.S.; Xie, G. Early-age hydration characteristics of modified coal gasification slag-cement-aeolian sand paste backfill. Constr. Build. Mater. 2022, 322, 125936. [Google Scholar] [CrossRef]
  14. Guo, F.H.; Guo, Y.; Guo, Z.K.; Miao, Z.K.; Zhao, X.; Zhang, Y.X.; Li, J.; Wu, J.J. Recycling Residual Carbon from Gasification Fine Slag and Its Application for Preparing Slurry Fuels. ACS Sustain. Chem. Eng. 2020, 8, 8830–8839. [Google Scholar] [CrossRef]
  15. Guo, F.H.; Zhao, X.; Guo, Y.; Zhang, Y.X.; Wu, J.J. Fractal analysis and pore structure of gasification fine slag and its flotation residual carbon. Colloid Surf. A-Physicochem. Eng. Asp. 2020, 585, 124148. [Google Scholar] [CrossRef]
  16. Guo, Q.H.; Huang, Y.C.; Gong, Y.; Zhuang, X.D.; Richter, A.; Yu, G.S. Recovered Carbon from Coal Gasification Fine Slag as Electrocatalyst for Oxygen Reduction Reaction and Zinc-Air Battery. Energy Technol. 2021, 9, 8. [Google Scholar] [CrossRef]
  17. Guo, Y.; Guo, F.H.; Zhou, L.; Guo, Z.K.; Miao, Z.K.; Liu, H.; Zhang, X.X.; Wu, J.J.; Zhang, Y.X. Investigation on co-combustion of coal gasification fine slag residual carbon and sawdust char blends: Physiochemical properties, combustion characteristic and kinetic behavior. Fuel 2021, 292, 10. [Google Scholar] [CrossRef]
  18. Liu, S.; Chen, X.T.; Ai, W.D.; Wei, C.D. A new method to prepare mesoporous silica from coal gasification fine slag and its application in methylene blue adsorption. J. Clean. Prod. 2019, 212, 1062–1071. [Google Scholar] [CrossRef]
  19. Zhao, X.; Guo, F.H.; Zhang, Y.X.; Wu, J.J. Water distribution and adsorption behaviors of two typical coal gasification fine slags from Ningxia Region. Colloid Surf. A-Physicochem. Eng. Asp. 2021, 625, 7. [Google Scholar] [CrossRef]
  20. Ji, W.X.; Feng, N.; Zhao, P.D.; Zhang, S.Y.; Zhang, S.S.; Lan, L.P.; Huang, H.L.; Li, K.N.; Sun, Y.G.; Li, Y.Y.; et al. Synthesis of Single-Phase Zeolite A by Coal Gasification Fine Slag from Ningdong and Its Application as a High-Efficiency Adsorbent for Cu2+ and Pb2+ in Simulated Waste Water. Chem. Eng. 2020, 4, 65. [Google Scholar] [CrossRef]
  21. Ji, W.X.; Zhang, S.Y.; Zhao, P.D.; Zhang, S.S.; Feng, N.; Lan, L.P.; Zhang, X.G.; Sun, Y.G.; Li, Y.Y.; Ma, Y.L. Green Synthesis Method and Application of NaP Zeolite Prepared by Coal Gasification Coarse Slag from Ningdong, China. Appl. Sci. 2020, 10, 2694. [Google Scholar] [CrossRef]
  22. Li, C.C.; Qiao, X.C.; Yu, J.G. Large surface area MCM-41 prepared from acid leaching residue of coal gasification slag. Mater. Lett. 2016, 167, 246–249. [Google Scholar] [CrossRef]
  23. Wu, Y.H.; Ma, Y.L.; Sun, Y.G.; Xue, K.; Ma, Q.L.; Ma, T.; Ji, W.X. Graded synthesis of highly ordered MCM-41 and carbon/zeolite composite from coal gasification fine residue for crystal violet removal. J. Clean. Prod. 2020, 277, 16. [Google Scholar] [CrossRef]
  24. Liu, L.J.; Ji, W.X.; Li, K.N.; Yu, W.H.; Lan, L.P.; Ye, J.J.; Gao, X.; Li, Y.Y.; Ma, Y.L.; Sun, Y.G. Solid Phase ZSM-5 Synthesis from Coal Gasification Coarse Slag. Silicon 2022. [Google Scholar] [CrossRef]
  25. Zhang, Y.X.; Wang, R.M.; Qiu, G.F.; Jia, W.K.; Guo, Y.; Guo, F.H.; Wu, J.J. Synthesis of Porous Material from Coal Gasification Fine Slag Residual Carbon and Its Application in Removal of Methylene Blue. Molecules 2021, 26, 6116. [Google Scholar] [CrossRef]
  26. Duan, L.Y.; Hu, X.D.; Sun, D.S.; Liu, Y.Z.; Guo, Q.J.; Zhang, T.K.; Zhang, B.T. Rapid removal of low concentrations of mercury from wastewater using coal gasification slag. Korean J. Chem. Eng. 2020, 37, 1166–1173. [Google Scholar] [CrossRef]
  27. Zhang, J.P.; Liu, Y.; Zhang, J.Y.; Zuo, J.; Zhang, J.Y.; Qiu, F.G.; Wei, C.D.; Miao, S.D. Preparation of mesoporous coal gasification slag and applications in polypropylene resin reinforcement and deodorization. Powder Technol. 2021, 386, 437–448. [Google Scholar] [CrossRef]
  28. Zhang, J.Y.; Zuo, J.; Jiang, Y.S.; Zhu, D.D.; Zhang, J.P.; Wei, C.D. Kinetic analysis on the mesoporous formation of coal gasification slag by acid leaching and its thermal stability. Solid State Sci. 2020, 100, 11. [Google Scholar] [CrossRef]
  29. Gao, S.T.; Zhang, Y.C.; Li, H.X.; He, J.; Xu, H.; Wu, C.L. The microwave absorption properties of residual carbon from coal gasification fine slag. Fuel 2021, 290, 8. [Google Scholar] [CrossRef]
  30. Zhang, J.P.; Zuo, J.; Ai, W.D.; Zhang, J.Y.; Zhu, D.D.; Miao, S.D.; Wei, C.D. Preparation of mesoporous coal-gasification fine slag adsorbent via amine modification and applications in CO2 capture. Appl. Surf. Sci. 2021, 537, 11. [Google Scholar] [CrossRef]
  31. Miao, Z.K.; Guo, Z.K.; Qiu, G.F.; Jia, W.K.; Jiao, K.R.; Zhang, Y.X.; Wu, J.J. Insight into the role of slag particles in coal gasification fine slag on hierarchical porous composites preparation and CO2 capture. Fuel 2022, 310, 9. [Google Scholar] [CrossRef]
  32. Abbas, N.; Rubab, N.; Sadiq, N.; Manzoor, S.; Khan, M.I.; Garcia, J.F.; Aragao, I.B.; Tariq, M.; Akhtar, Z.; Yasmin, G. Aluminum-Doped Cobalt Ferrite as an Efficient Photocatalyst for the Abatement of Methylene Blue. Water 2020, 12, 2285. [Google Scholar] [CrossRef]
  33. Alayli, A.; Nadaroglu, H.; Turgut, E. Nanobiocatalyst beds with Fenton process for removal of methylene blue. Appl. Water Sci. 2021, 11, 8. [Google Scholar] [CrossRef]
  34. Tenenhaus, A.; Tenenhaus, M. Regularized Generalized Canonical Correlation Analysis. Psychometrika 2011, 76, 257–284. [Google Scholar] [CrossRef] [Green Version]
  35. Holgado-Tello, F.P.; Chacon-Moscoso, S.; Barbero-Garcia, I.; Vila-Abad, E. Polychoric versus Pearson correlations in exploratory and confirmatory factor analysis of ordinal variables. Qual. Quant. 2010, 44, 153–166. [Google Scholar] [CrossRef]
  36. Dosmukhamedov, N.K.; Zholdasbay, E.E.; Daruesh, G.S.; Argyn, A.A.; Kurmanseitov, M.B. Study of the mechanism of pre-burned ash leaching by hydrochloric acid. Kompleks Ispol. Miner. Syra 2021, 4, 72–80. [Google Scholar] [CrossRef]
  37. Schuster, J.; Ebin, B. Investigation of indium and other valuable metals leaching from unground waste LCD screens by organic and inorganic acid leaching. Sep. Purif. Technol. 2021, 279, 11. [Google Scholar] [CrossRef]
  38. Porada, S.; Rozwadowski, A.; Zubek, K. Studies of catalytic coal gasification with steam. Pol. J. Chem. Technol. 2016, 18, 97–102. [Google Scholar] [CrossRef] [Green Version]
  39. Bilgin, O.; Hacifazlioglu, H.; Sert, D. Leaching of coal by trioxoboric acid for coal cleaning. Physicochem. Probl. Mineral Pro. 2021, 57, 129–136. [Google Scholar] [CrossRef]
  40. Chalmpes, N.; Bourlinos, A.B.; Sedajova, V.; Kupka, V.; Moschovas, D.; Avgeropoulos, A.; Karakassides, M.A.; Gournis, D. Hypergolic Materials Synthesis through Reaction of Fuming Nitric Acid with Certain Cyclopentadienyl Compounds. C-J. Carbon Res. 2020, 6, 61. [Google Scholar] [CrossRef]
  41. Ettler, V.; Vrtiskova, R.; Mihaljevic, M.; Sebek, O.; Grygar, T.; Drahota, P. Cadmium, lead and zinc leaching from smelter fly ash in simple organic acids-Simulators of rhizospheric soil solutions. J. Hazard. Mater. 2009, 170, 1264–1268. [Google Scholar] [CrossRef] [PubMed]
  42. Zhou, Y.; Liu, J.X.; Cheng, G.J.; Xue, X.X.; Yang, H. Kinetics and mechanism of hydrochloric acid leaching of rare earths from Bayan Obo slag and recovery of rare earth oxalate and high purity oxides. Hydrometallurgy 2022, 208, 16. [Google Scholar] [CrossRef]
  43. Du, M.J.; Huang, J.J.; Liu, Z.Y.; Zhou, X.; Guo, S.; Wang, Z.Q.; Fang, Y.T. Reaction characteristics and evolution of constituents and structure of a gasification slag during acid treatment. Fuel 2018, 224, 178–185. [Google Scholar] [CrossRef]
  44. Mouni, L.; Belkhiri, L.; Bollinger, J.C.; Bouzaza, A.; Assadi, A.; Tirri, A.; Dahmoune, F.; Madani, K.; Remini, H. Removal of Methylene Blue from aqueous solutions by adsorption on Kaolin: Kinetic and equilibrium studies. Appl. Clay Sci. 2018, 153, 38–45. [Google Scholar] [CrossRef]
  45. Minisy, I.M.; Salahuddin, N.A.; Ayad, M.M. Adsorption of methylene blue onto chitosan? montmorillonite/polyaniline nanocomposite. Appl. Clay Sci. 2021, 203, 10. [Google Scholar] [CrossRef]
  46. Benjelloun, M.; Miyah, Y.; Evrendilek, G.A.; Zerrouq, F.; Lairini, S. Recent Advances in Adsorption Kinetic Models: Their Application to Dye Types. Arab. J. Chem. 2021, 14, 24. [Google Scholar] [CrossRef]
  47. Lombardo, S.; Thielemans, W. Thermodynamics of adsorption on nanocellulose surfaces. Cellulose 2019, 26, 249–279. [Google Scholar] [CrossRef]
  48. Al-Ghouti, M.A.; Da’ana, D.A. Guidelines for the use and interpretation of adsorption isotherm models: A review. J. Hazard. Mater. 2020, 393, 22. [Google Scholar] [CrossRef]
  49. Tong, D.S.; Wu, C.W.; Adebajo, M.O.; Jin, G.C.; Yu, W.H.; Ji, S.F.; Zhou, C.H. Adsorption of methylene blue from aqueous solution onto porous cellulose-derived carbon/montmorillonite nanocomposites. Appl. Clay Sci. 2018, 161, 256–264. [Google Scholar] [CrossRef]
  50. Kuang, Y.; Zhang, X.P.; Zhou, S.Q. Adsorption of Methylene Blue in Water onto Activated Carbon by Surfactant Modification. Water 2020, 12, 587. [Google Scholar] [CrossRef]
  51. Zhao, D.L.; Ding, Y.; Chen, S.H.; Bai, T.T.; Ma, Y.L. Adsorption of Methylene Blue on Carbon Nanotubes from Aqueous Solutions. Asian J. Chem. 2013, 25, 5756–5758. [Google Scholar] [CrossRef]
  52. Otcovska, T.P.; Muzikova, B.; Padevet, P. Influence of earth composition on adsorption capacity of methylene blue dye. In Proceedings of the 11th Conference on Nano and Macro Mechanics (NMM), Prague, Czech Republic, 17 September 2020; pp. 63–68. [Google Scholar]
  53. De Lima, A.F.; Fagnani, H.M.C.; Santos, W.L.F.; de Barros, M. Methylene blue adsorption in hydrocarbons textile waste. Materia 2020, 25, 16. [Google Scholar] [CrossRef]
  54. Truong, T.T.C.; Vo, N.T.T.; Nguyen, K.D.; Bui, H.M. Preparation of cellulose-based hydrogel derived from tea residue for the adsorption of methylene blue. Cell Chem. Technol. 2019, 53, 573–582. [Google Scholar] [CrossRef]
  55. Song, X.S.; Zhou, J.; Fan, J.S.; Zhang, Q.Q.; Wang, S.F. Preparation and adsorption properties of magnetic graphene oxide composites for the removal of methylene blue from water. Mater. Res. Express 2022, 9, 15. [Google Scholar] [CrossRef]
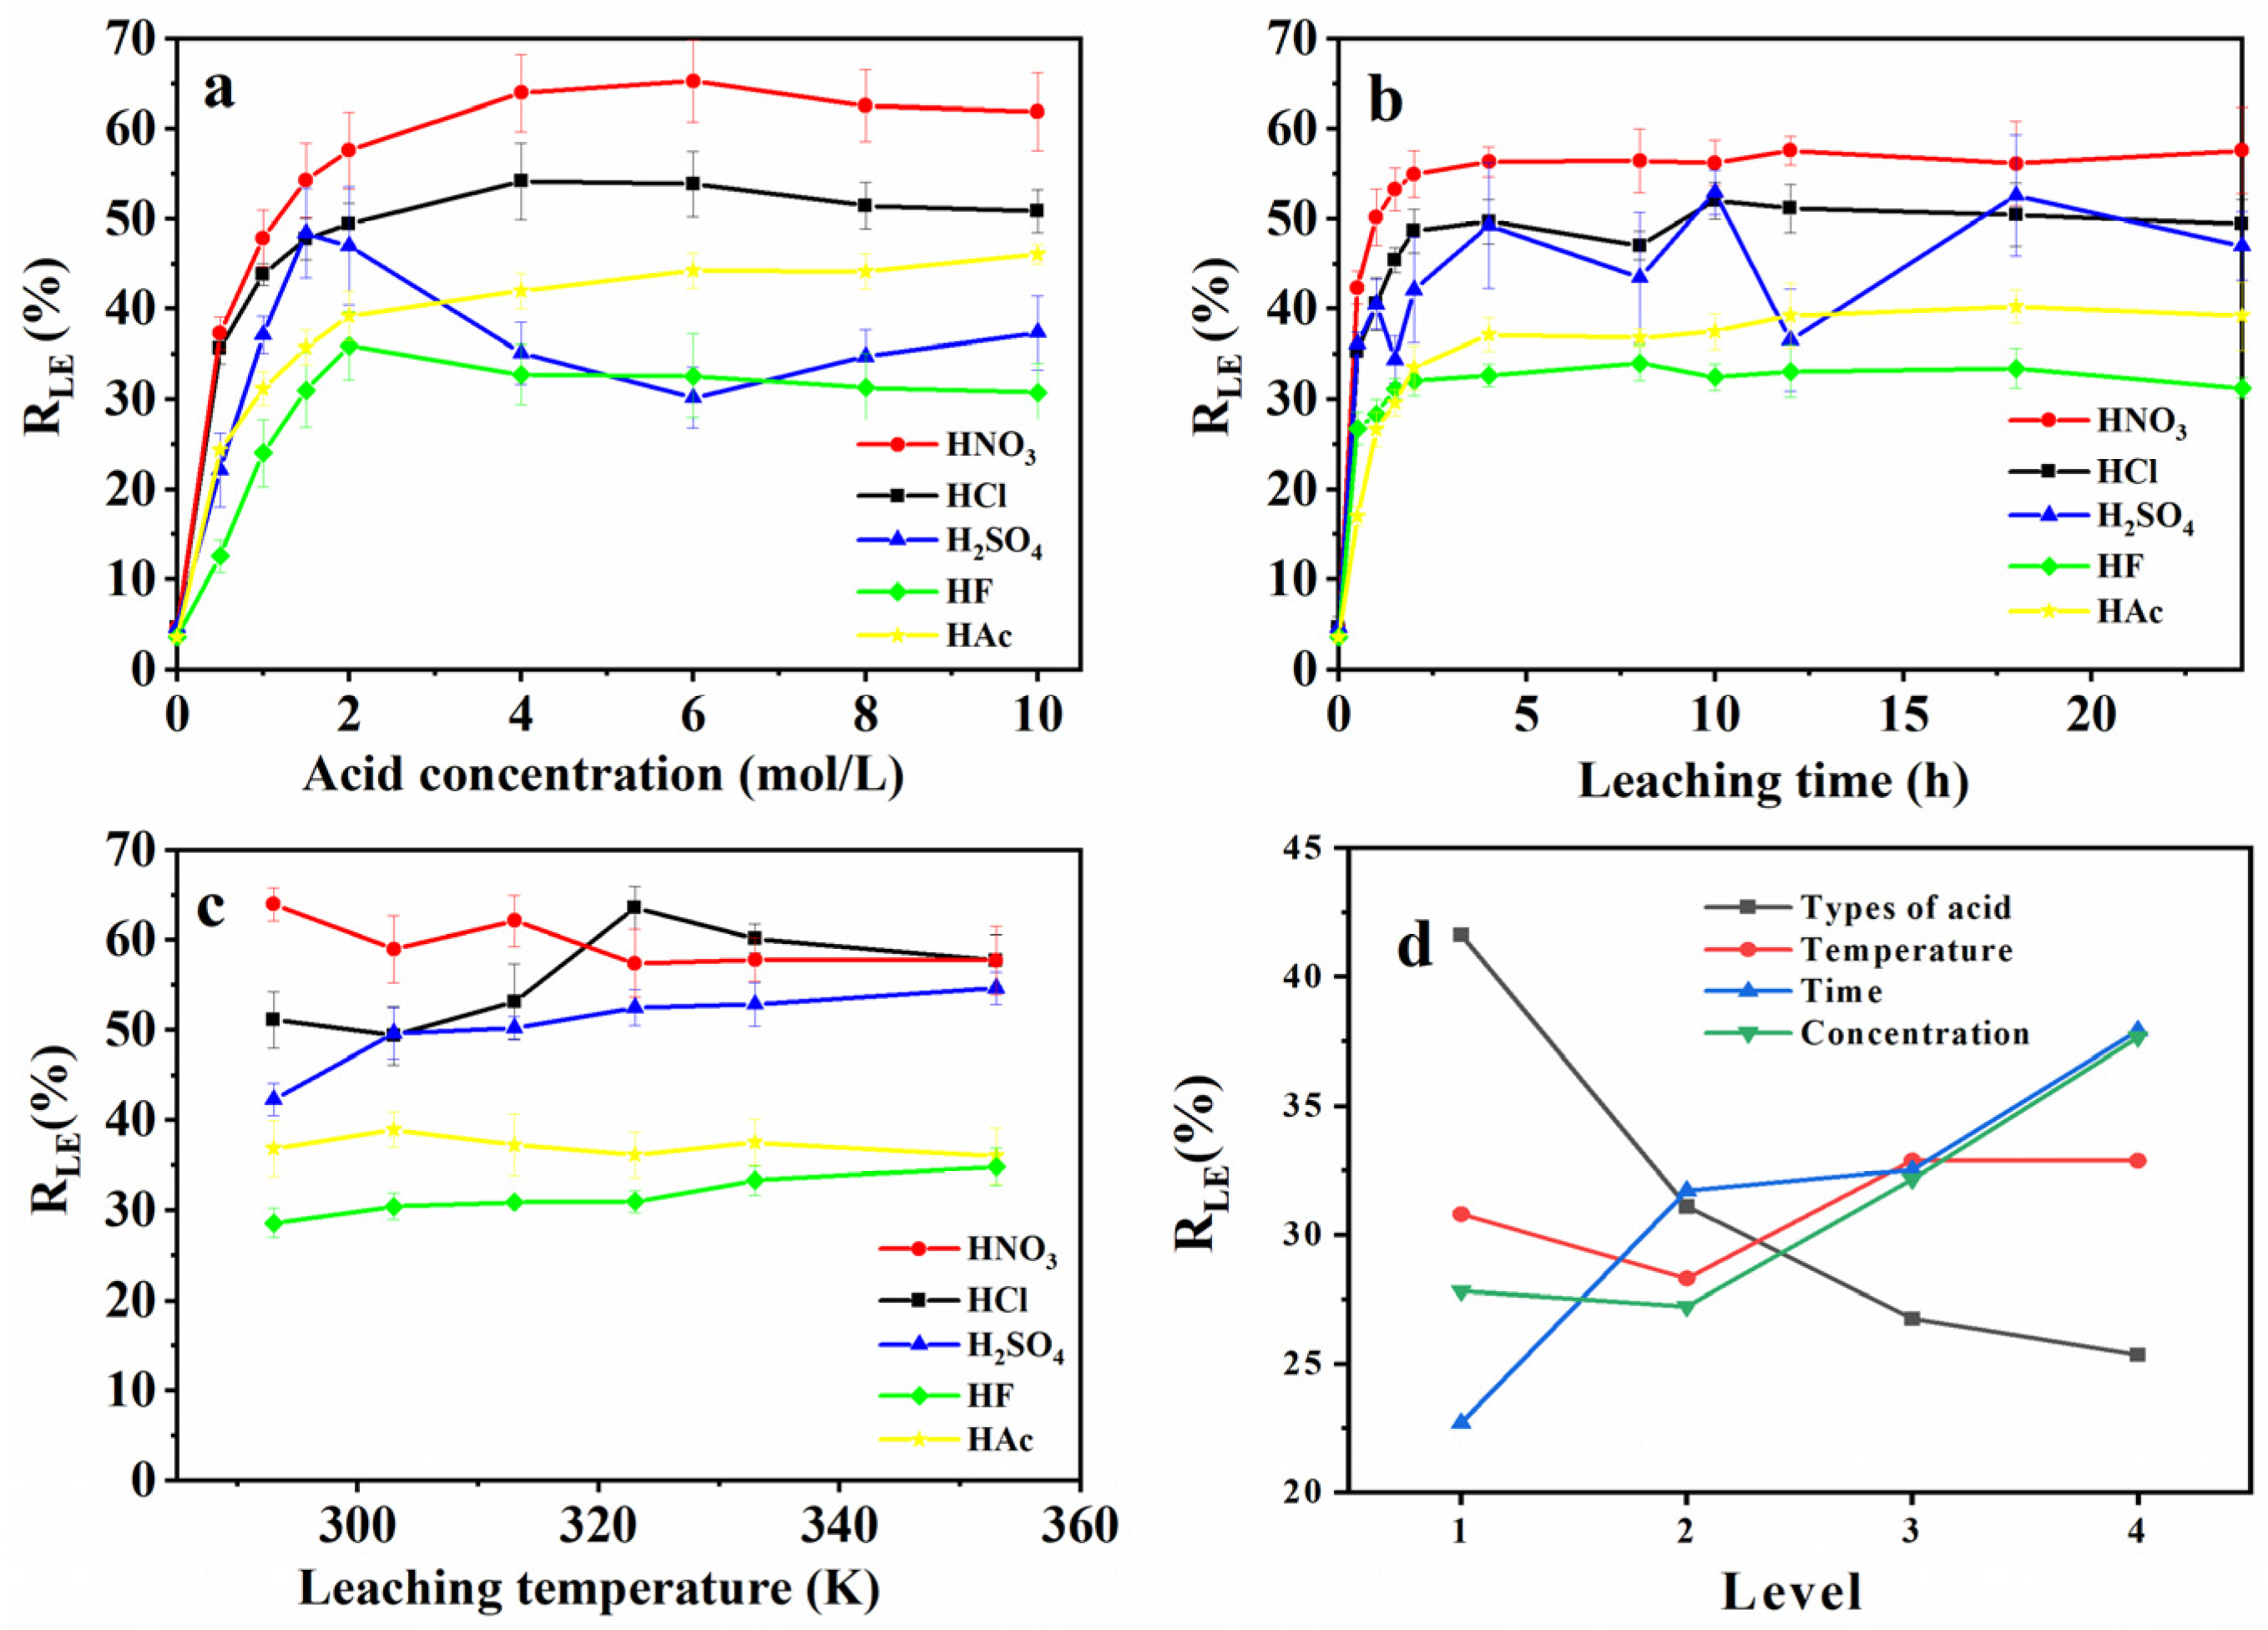
Figure 1. Optimization of acid leaching process. (a) acid concentrations, (b) leaching time, (c) leaching temperature, (d) orthogonal level analysis.
Ijerph 19 12851 g001
Figure 2. Absorption capacity investigation. (a) acid concentration, (b) leaching time, (c) leaching temperature, (d) orthogonal level analysis.
Ijerph 19 12851 g002
Figure 3. FTIR spectra of initial FS and functional adsorbents.
Ijerph 19 12851 g003
Figure 4. XRD analysis of initial FS and functional adsorbents after combustion. (a) initial FS, (b) FS-N-2M-2 h-293K, (c) FS-H-2M-2 h-293K, (d) FS-S-2M-2 h-293K, (e) FS-F-2M-2 h-293K, (f) FS-C-2M-2 h-293K.
Ijerph 19 12851 g004
Figure 5. SEM of initial FS and functional adsorbents. (a) initial FS, (b) FS-N-2M-2 h-293K, (c) FS-H-2M-2 h-293K, (d) FS-S-2M-2 h-293K, (e) FS-C-2M-2 h-293K, (f) FS-F-2M-2 h-293K.
Ijerph 19 12851 g005
Figure 6. (a) N-adsorption/desorption isotherms of initial FS and functional adsorbents, (b) Pore size distribution of initial FS and functional adsorbents.
Ijerph 19 12851 g006
Figure 7. Kinetics investigation on FS-N-2M-2 h-293K. (a) pseudo-first-order and pseudo-second-order; (b) Weber-Morris Model.
Ijerph 19 12851 g007
Figure 8. Adsorption isotherm investigation on FS-N-2M-2 h-293K at room temperature.
Ijerph 19 12851 g008
Table 1. XRF analysis of FS (wt.%).
SiAlFeCaNaMgKSTiOthersLOI
FS21.2011.1513.9013.441.391.221.060.820.701.4733.68
LOI: Loss On Ignition.
Table 2. The pore properties of functional adsorbents.
Pore Diameter (nm)Total Pore Volume (cc/g)Surface Area (m2/g)
FS19.090.21151.67
FS-N-2M-2 h-293K3.820.26340.40
FS-H-2M-2 h-293K3.830.48247.21
FS-S-2M-2 h-293K3.820.15162.09
FS-C-2M-2 h-293K3.830.26159.01
FS-F-2M-2 h-293K3.830.1298.83
Table 3. Kinetics analysis of FS-N-2M-2 h-293K.
Kinetics ModelParameters
Pseudo-first-orderQeK1R2χ2
156.100.267840.52346.665
Pseudo-second-orderQeK2R2χ2
159.470.002820.87512.193
Weber-Morris modelPart ICiKi1R2χ2
86.5702215.180550.903652.65117
Part IIcKi2R2χ2
111.0095.3810.9799.32794
Part IIIcKi3R2χ2
151.3280.4530.9750.0452
Table 4. Adsorption isotherm analysis of FS-N-2M-2 h-293K.
Temperature
(K)
Langmuir Isotherm Model
KLQmaxR2ALLEquation
2930.321320.1340.9820.135Qe = 102.808Ce/(1 + 0.321Ce)
3030.244308.6160.9160.170Qe = 75.173Ce/(1 + 0.244Ce)
3130.167287.8800.9550.230Qe = 48.145Ce/(1 + 0.167Ce)
3230.146273.0990.9390.256Qe = 39.782Ce/(1 + 0.146Ce)
Temperature
(K)
Freundlich Isotherm Model
KFnR2Equation
293127.0854.8810.879Qe = 127.085Ce0.205
303107.4504.3320.838Qe = 107.45Ce0.231
313100.2534.6540.757Qe = 100.253Ce0.215
32392.1364.5910.748Qe = 92.136Ce0.218
Temperature
(K)
Temkin Isotherm Model
KTbR2Equation
29352.08710.2680.952Qe = 237.24ln (52.087Ce)
30347.2914.1790.901Qe = 781.843ln (47.291Ce)
31350.4943.0250.854Qe = 860.313ln (50.494Ce)
32352.5952.5670.839Qe = 1046.271ln (52.595Ce)
Table 5. Thermodynamic analysis of FS-N-2M-2 h-293K.
ΔG(kJ/mol)ΔSΔHR2
293 K303 K313 K323 K(J/(mol·K))(kJ/mol)
−4.21−3.936−3.905−3.825−82.398−37.5260.9366
Table 6. Performance comparison of adsorption effect.
AdsorbentQm (mg/g)Equilibrum Time (min)pHT (K)References
Carbon nanotubes65.361209.4293[51]
Clay88--Room temperature[52]
hydrocarbon textile waste729010Room temperature[53]
tea cellulose hydrogel41.6730010298[54]
magnetic graphene oxide205.3412010318[55]
FS-N-2M-2 h-293K162.941209293This paper
Publisher’s Note: MDPI stays neutral with regard to jurisdictional claims in published maps and institutional affiliations.