
Study on the Impact of Government Health Expenditure Equity on Residents’ Health Level in the Chengdu–Chongqing Economic Circle of China


Abstract
1. Introduction
2. Materials and Methods
2.1. Research Object
2.2. Measurement of Government Health Expenditure Equity—Thiel Index
2.3. Measurement of Residents’ Health Level—Principal Component Analysis
2.4. Research Hypothesis
2.5. Model Setting and Variable Description
3. Results
3.1. Measurement of the Equity of Government Health Expenditure
3.2. Measurement of Health Level of Residents
3.3. Empirical Research Results and Hypothesis Verification
3.3.1. Analysis of regression results of dynamic panel data
3.3.2. Stability Test: Regression Analysis of Static Panel Data Model
4. Discussion
5. Conclusions
Author Contributions
Funding
Institutional Review Board Statement
Informed Consent Statement
Data Availability Statement
Conflicts of Interest
References
- Tan, X.; Wu, Q.; Shao, H. Global commitments and China’s endeavors to promote health and achieve sustainable development goals. J. Health Popul. Nutr. 2018, 37, 1–4. [Google Scholar] [CrossRef] [PubMed]
- Jakovljevic, M.; Sugahara, T.; Timofeyev, Y.; Rancic, N. Predictors of (in) efficiencies of healthcare expenditure among the leading asian economies–comparison of OECD and non-OECD nations. Risk Manag. Healthc. Policy 2020, 13, 2261. [Google Scholar] [CrossRef] [PubMed]
- Adams, A.M.; Ahmed, T.; El Arifeen, S.; Evans, T.G.; Huda, T.; Reichenbach, L. Innovation for universal health coverage in Bangladesh: A call to action. Lancet 2013, 382, 2104–2111. [Google Scholar] [CrossRef]
- Gong, P.; Liang, S.; Carlton, E.J.; Jiang, Q.; Wu, J.; Wang, L.; Remais, J.V. Urbanisation and health in China. Lancet 2012, 379, 843–852. [Google Scholar] [CrossRef]
- Anselmi, L.; Fernandes, Q.F.; Hanson, K.; Lagarde, M. Accounting for geographical inequalities in the assessment of equity in health care: A benefit incidence analysis. Lancet 2013, 381, S9. [Google Scholar] [CrossRef]
- Qiangyi, L.; Shuiying, Z. Spatial Difference and Distribution Dynamics of Financial Health Expenditure—An Empirical Study Based on Dagum Gini Coefficient Decomposition and Kernel Density Estimation. Collect. Essays Financ. Econ. 2016, 10, 19–28. [Google Scholar]
- Jin, H.; Qian, X. How the Chinese government has done with public health from the perspective of the evaluation and comparison about public-health expenditure. Int. J. Environ. Res. Public Health 2020, 17, 9272. [Google Scholar] [CrossRef]
- Liu, Y.; Hsiao, W.C.; Eggleston, K. Equity in health and health care: The Chinese experience. Soc. Sci. Med. 1999, 49, 1349–1356. [Google Scholar] [CrossRef]
- Chuang, D.; Hengpeng, Z. The evolutionary logic of urban health care systems in China. Soc. Sci. China 2016, 8, 66–89+205–206. [Google Scholar]
- Junhao, W.; Wanwen, J. Resources Allocation and Utilization Efficiency in China’s Healthcare Sector. Financ. Trade Econ. 2021, 42, 20–35. [Google Scholar]
- Lozano, R.; Fullman, N.; Mumford, J.E.; Knight, M.; Barthelemy, C.M.; Abbafati, C.; Abbastabar, H.; Abd-Allah, F.; Abdollahi, M.; Abedi, A. Measuring universal health coverage based on an index of effective coverage of health services in 204 countries and territories, 1990–2019: A systematic analysis for the Global Burden of Disease Study 2019. Lancet 2020, 396, 1250–1284. [Google Scholar] [CrossRef]
- Ma, J.; Xu, J.; Zhang, Z.; Wang, J. New cooperative medical scheme decreased financial burden but expanded the gap of income-related inequity: Evidence from three provinces in rural China. Int. J. Equity Health 2016, 15, 1–11. [Google Scholar] [CrossRef] [PubMed]
- Wen, L.; Yang, L.; Sun, L. Study on regional equity of government health expenditure in China. Chin. J. Health Policy 2016, 74–78. [Google Scholar]
- Li, J.; Yuan, B. Understanding the effectiveness of government health expenditure in improving health equity: Preliminary evidence from global health expenditure and child mortality rate. Int. J. Health Plan. Manag. 2019, 34, e1968–e1979. [Google Scholar] [CrossRef] [PubMed]
- Adams, A.M.; Rabbani, A.; Ahmed, S.; Mahmood, S.S.; Al-Sabir, A.; Rashid, S.F.; Evans, T.G. Explaining equity gains in child survival in Bangladesh: Scale, speed, and selectivity in health and development. Lancet 2013, 382, 2027–2037. [Google Scholar] [CrossRef]
- Zhao, S.-w.; Zhang, X.-y.; Dai, W.; Ding, Y.-x.; Chen, J.-y.; Fang, P.-q. Effect of the catastrophic medical insurance on household catastrophic health expenditure: Evidence from China. Gac. Sanit. 2021, 34, 370–376. [Google Scholar] [CrossRef]
- Yip, W.; Fu, H.; Chen, A.T.; Zhai, T.; Jian, W.; Xu, R.; Pan, J.; Hu, M.; Zhou, Z.; Chen, Q. 10 years of health-care reform in China: Progress and gaps in universal health coverage. Lancet 2019, 394, 1192–1204. [Google Scholar] [CrossRef]
- Meng, Q.; Xu, L.; Zhang, Y.; Qian, J.; Cai, M.; Xin, Y.; Gao, J.; Xu, K.; Boerma, J.T.; Barber, S.L. Trends in access to health services and financial protection in China between 2003 and 2011: A cross-sectional study. Lancet 2012, 379, 805–814. [Google Scholar] [CrossRef]
- Health, T.L.P. Education: A neglected social determinant of health. Lancet Public Health 2020, 5, e361. [Google Scholar] [CrossRef]
- Zajacova, A.; Lawrence, E.M. The relationship between education and health: Reducing disparities through a contextual approach. Annu. Rev. Public Health 2018, 39, 273–289. [Google Scholar] [CrossRef]
- Grossman, M. On the Concept of Health Capital and the Demand for Health. In Determinants of Health; Columbia University Press: New York, NY, USA, 2017; pp. 6–41. [Google Scholar]
- Gao, J.; Zhou, Z.; Yan, J.; Yang, X. Empirical study on Chinese health care access in basic health insurance system. Chin. Health Econ. 2010, 29, 5–8. [Google Scholar]
- Zhou, Z.; Gao, J.; Yang, X. Study on equity in Health service delivery of Western rural residents. Chin. Health Econ. 2010, 29, 88–90. [Google Scholar]
- Case, A.; Lubotsky, D.; Paxson, C. Economic status and health in childhood: The origins of the gradient. Am. Econ. Rev. 2002, 92, 1308–1334. [Google Scholar] [CrossRef] [PubMed]
- Deaton, A. Policy implications of the gradient of health and wealth. Health Aff. 2002, 21, 13–30. [Google Scholar] [CrossRef]
- Zhou, Z.; Gao, J.; Fox, A.; Rao, K.; Xu, K.; Xu, L.; Zhang, Y. Measuring the equity of inpatient utilization in Chinese rural areas. BMC Health Serv. Res. 2011, 11, 201. [Google Scholar] [CrossRef]
- Vanzella-Yang, A.; Veenstra, G. Family income and health in Canada: A longitudinal study of stability and change. BMC Public Health 2021, 21, 333. [Google Scholar] [CrossRef]
- Cui, X.; Chang, C.-T. How income influences health: Decomposition based on absolute income and relative income effects. Int. J. Environ. Res. Public Health 2021, 18, 10738. [Google Scholar] [CrossRef]
- Guo, H.; Yang, Y.; Pan, C.; Xu, S.; Yan, N.; Lei, Q. Study on the Impact of Income Gap on Health Level of Rural Residents in China. Int. J. Environ. Res. Public Health 2022, 19, 7590. [Google Scholar] [CrossRef]
- Akita, T. Decomposing regional income inequality in China and Indonesia using two-stage nested Theil decomposition method. Ann. Reg. Sci. 2003, 37, 55–77. [Google Scholar] [CrossRef]
- Jolliffe, I.T.; Cadima, J. Principal component analysis: A review and recent developments. Philos. Trans. R. Soc. A Math. Phys. Eng. Sci. 2016, 374, 20150202. [Google Scholar] [CrossRef]
- Abdi, H.; Williams, L.J. Principal component analysis. Wiley Interdiscip. Rev. Comput. Stat. 2010, 2, 433–459. [Google Scholar] [CrossRef]
- Rao, C.R. The use and interpretation of principal component analysis in applied research. Sankhyā Indian J. Stat. Ser. A 1964, 26, 329–358. [Google Scholar]
- Tobollik, M.; Keuken, M.; Sabel, C.; Cowie, H.; Tuomisto, J.; Sarigiannis, D.; Künzli, N.; Perez, L.; Mudu, P. Health impact assessment of transport policies in Rotterdam: Decrease of total traffic and increase of electric car use. Environ. Res. 2016, 146, 350–358. [Google Scholar] [CrossRef] [PubMed]
- Hsu, F.-C.; Kritchevsky, S.B.; Liu, Y.; Kanaya, A.; Newman, A.B.; Perry, S.E.; Visser, M.; Pahor, M.; Harris, T.B.; Nicklas, B.J. Association between inflammatory components and physical function in the health, aging, and body composition study: A principal component analysis approach. J. Gerontol. Ser. A Biomed. Sci. Med. Sci. 2009, 64, 581–589. [Google Scholar] [CrossRef]
- Woldemichael, A.; Takian, A.; Sari, A.A.; Olyaeemanesh, A. Inequalities in healthcare resources and outcomes threatening sustainable health development in Ethiopia: Panel data analysis. BMJ Open 2019, 9, e022923. [Google Scholar] [CrossRef]
- Marmot, M. The influence of income on health: Views of an epidemiologist. Health Aff. 2002, 21, 31–46. [Google Scholar] [CrossRef]
- Yuru, F.; Changxiang, C. Economic factors of self health management level of rural elderly. Chin. J. Gerontol. 2021, 41, 200–202. [Google Scholar]
- Boyle, M.H.; Racine, Y.; Georgiades, K.; Snelling, D.; Hong, S.; Omariba, W.; Hurley, P.; Rao-Melacini, P. The influence of economic development level, household wealth and maternal education on child health in the developing world. Soc. Sci. Med. 2006, 63, 2242–2254. [Google Scholar] [CrossRef]
- Giancotti, M.; Lopreite, M.; Mauro, M.; Puliga, M. The role of European health system characteristics in affecting Covid 19 lethality during the early days of the pandemic. Sci. Rep. 2021, 11, 1–8. [Google Scholar] [CrossRef]
- Flatø, H.; Zhang, H. Inequity in level of healthcare utilization before and after universal health coverage reforms in China: Evidence from household surveys in Sichuan Province. Int. J. Equity Health 2016, 15, 1–12. [Google Scholar] [CrossRef]
- Cutler, D.M.; Lleras-Muney, A. Education and Health: Evaluating Theories and Evidence; National Bureau of Economic Research: Cambridge, MA, USA, 2006. [Google Scholar]
- Ross, C.E.; Wu, C.-l. The links between education and health. Am. Sociol. Rev. 1995, 719–745. [Google Scholar] [CrossRef]
- Mazumder, B. Does education improve health? A reexamination of the evidence from compulsory schooling laws. Econ. Perspect. 2008, 32, 2–16. [Google Scholar] [CrossRef]
- Shengye, O. A Study on the Impact of Health Status on Chinese Household Savings. Consum. Econ. 2017, 33, 91–95. [Google Scholar]


| Variable | Definition | Reference | Data Sources |
|---|---|---|---|
| health | The health level of residents | Hsu et al. (2009) [35] | Author’s calculation |
| theil | Equity of government health expenditure | Woldemichael et al. (2019) [36] | |
| edu | Nominal education expenditure | The Lancet Public (2020) [19] | Chongqing statistical yearbook/ Sichuan statistical yearbook |
| pdi | Personal disposable income | Marmot (2002) [37] | |
| dep | Deposits of residents | Feng, Chen (2021) [38] | |
| gdp | Nominal per capita GDP | Boyle et al. (2006) [39] |
| Variable | Obs | Mean | Std. Dev. | Min | Max |
|---|---|---|---|---|---|
| health | 264 | 1.14 × 10⁻⁵ | 1.766 | −1.486 | 10.642 |
| theil | 264 | −0.0319 | 0.377 | −0.758 | 2.879 |
| edu | 264 | 32.0646 | 41.506 | 4.293 | 327.727 |
| pdi | 264 | 3.49334 | 1.190 | 1.384 | 7.502 |
| dep | 264 | 10.9319 | 19.500 | 1.137 | 171.214 |
| gdp | 264 | 6.0122 | 2.919 | 2.093 | 22.959 |
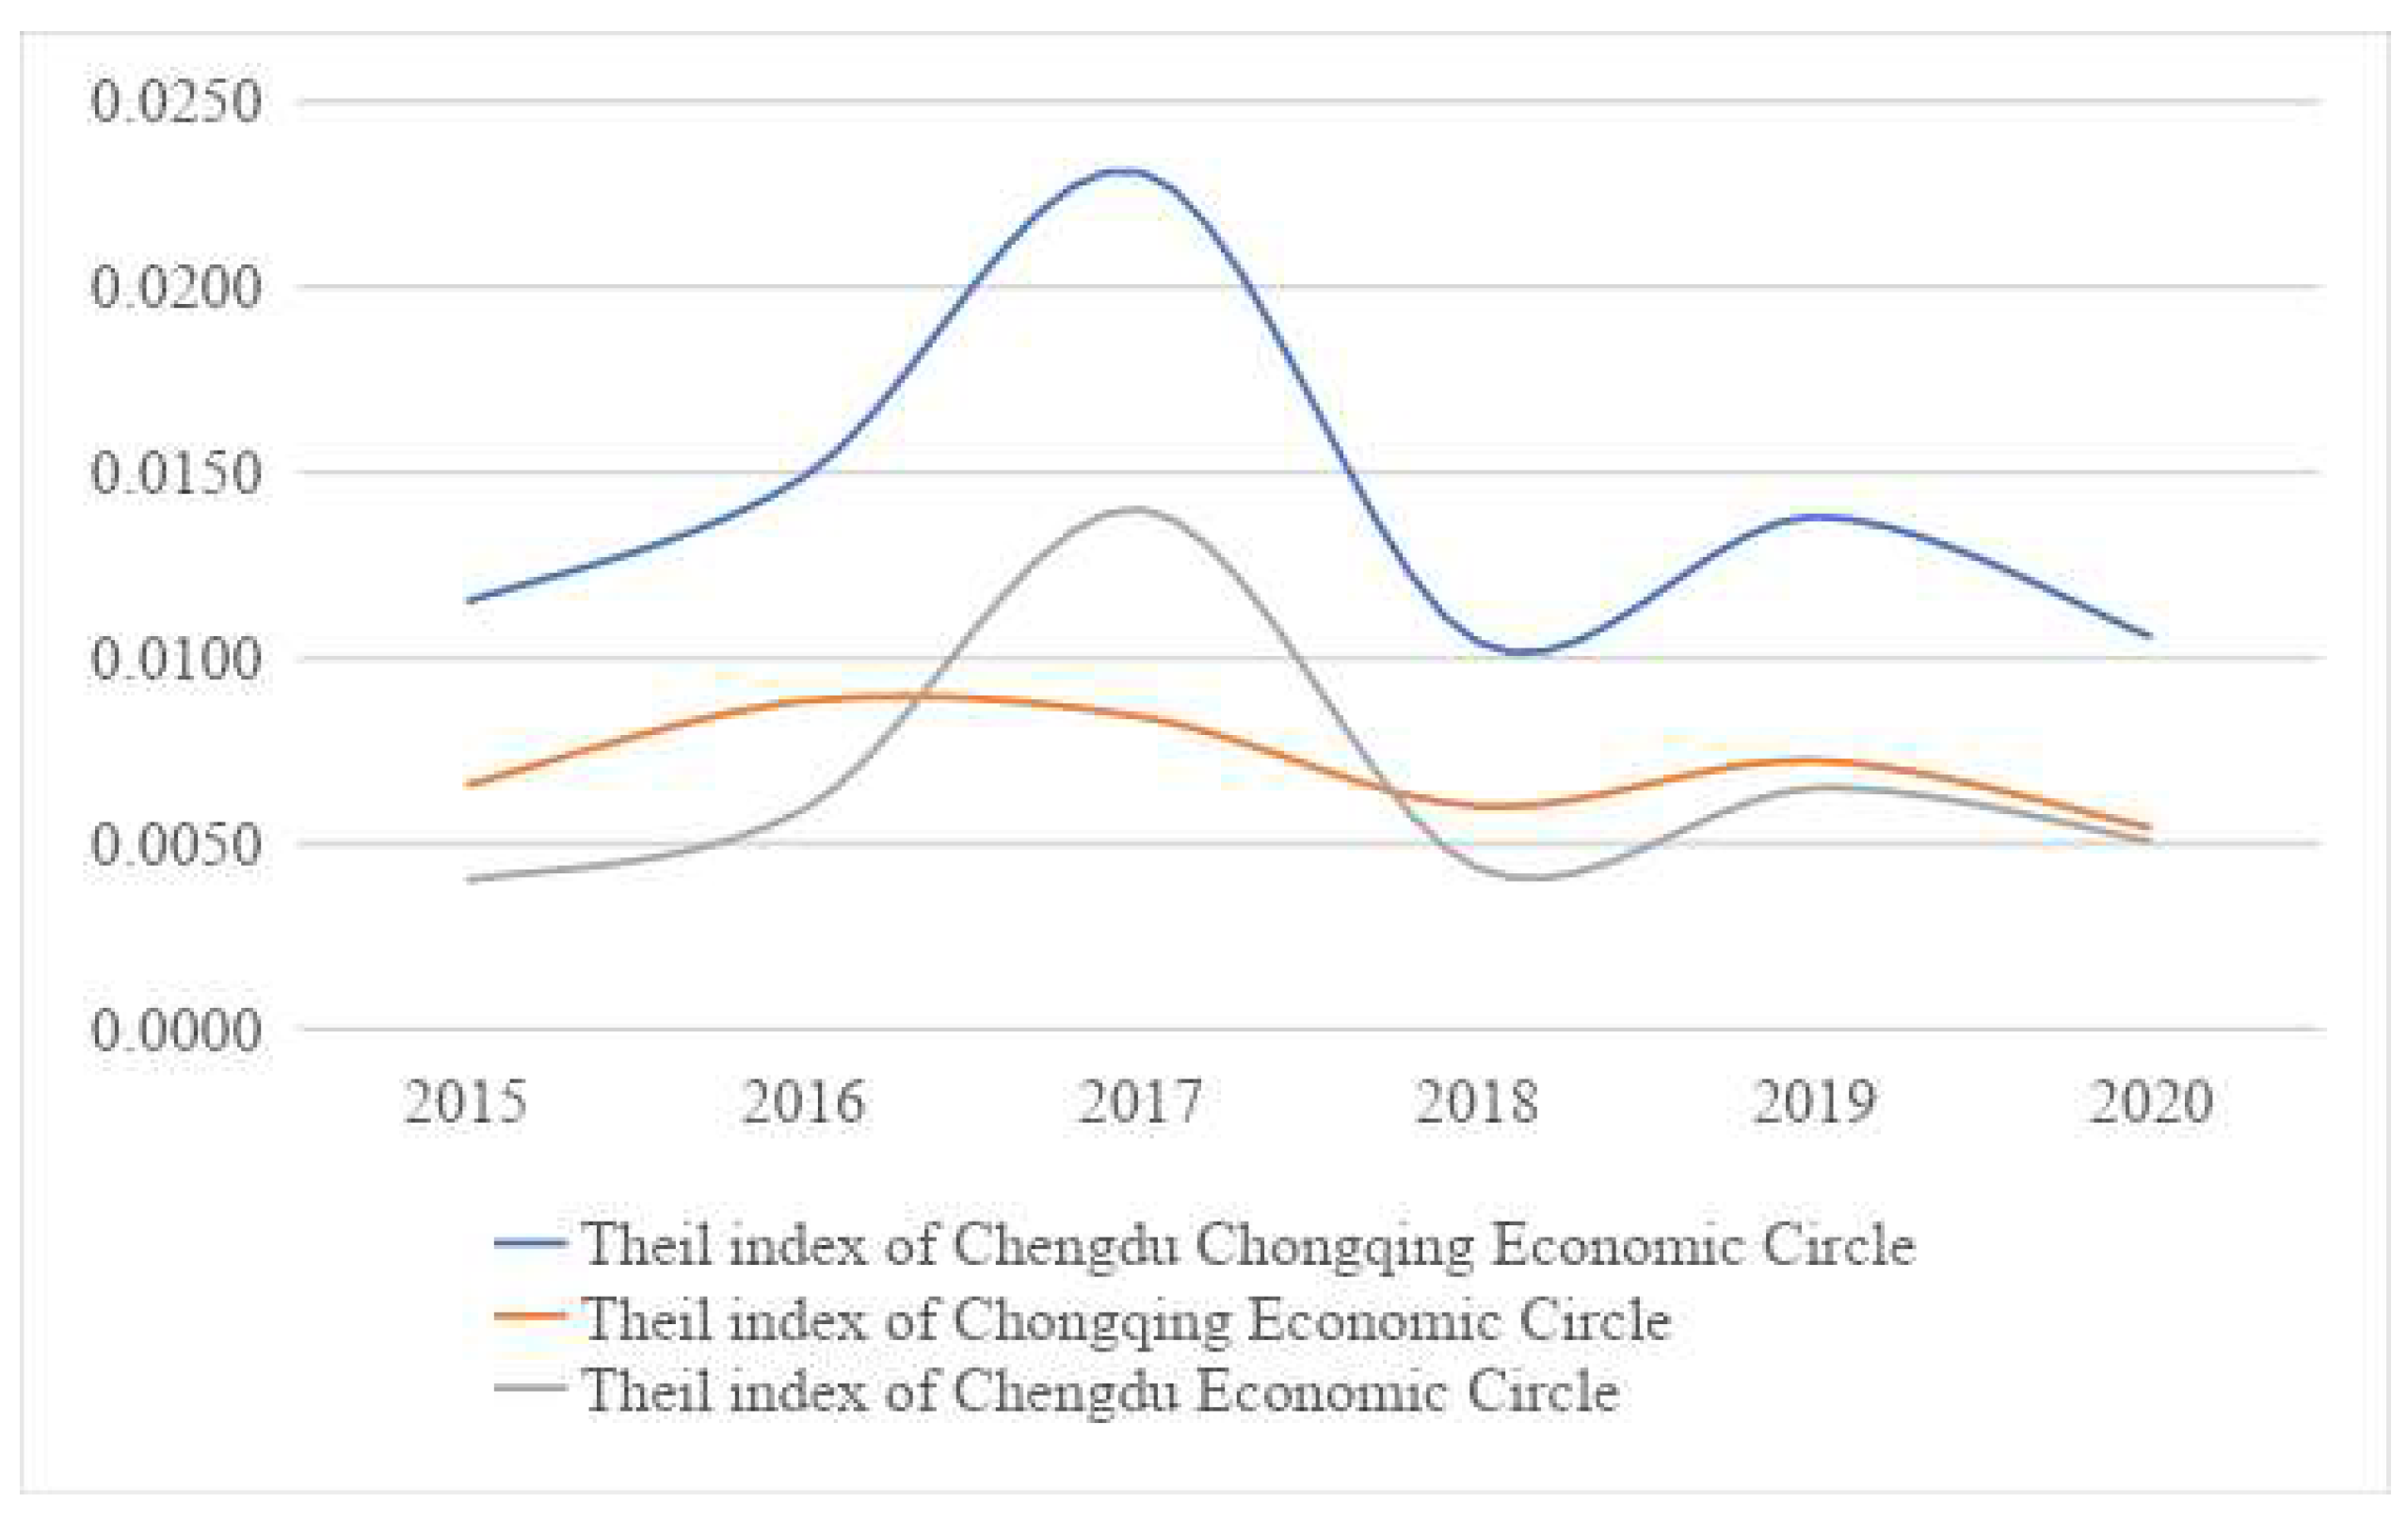
| Year | Theil Index of Chengdu–Chongqing Economic Circle | Theil Index of Chongqing Economic Circle | Theil Index of Chengdu Economic Circle |
|---|---|---|---|
| 2015 | 0.0115 | 0.0066 | 0.0040 |
| 2016 | 0.0149 | 0.0088 | 0.0059 |
| 2017 | 0.0231 | 0.0084 | 0.0140 |
| 2018 | 0.0104 | 0.0060 | 0.0043 |
| 2019 | 0.0138 | 0.0072 | 0.0065 |
| 2020 | 0.0106 | 0.0054 | 0.0051 |
| Year | Theil Index | Within-Regional Theil Index | Between-Regional Theil Index | Within-Regional Contribution Rate | Between-Regional Contribution Rate |
|---|---|---|---|---|---|
| 2015 | 0.0115 | 0.0106 | 0.0009 | 91.97% | 8.03% |
| 2016 | 0.0149 | 0.0148 | 0.0001 | 99.20% | 0.80% |
| 2017 | 0.0231 | 0.0224 | 0.0007 | 97.11% | 2.89% |
| 2018 | 0.0104 | 0.0103 | 0.0001 | 99.20% | 0.80% |
| 2019 | 0.0138 | 0.0137 | 0.0001 | 99.48% | 0.52% |
| 2020 | 0.0106 | 0.0105 | 0.0001 | 99.28% | 0.72% |
| Variable | One-Step System GMM | Two-Step System GMM | ||||||||
|---|---|---|---|---|---|---|---|---|---|---|
| (1) | (2) | (3) | (4) | (5) | (1) | (2) | (3) | (4) | (5) | |
| Health | Health | Health | Health | Health | Health | Health | Health | Health | Health | |
| L.health | 0.320 *** | 0.347 *** | 0.327 ** | 0.254 ** | 0.301 ** | 0.419 *** | 0.515 *** | 0.500 *** | 0.325 *** | 0.374 *** |
| (3.03) | (2.68) | (2.40) | (2.40) | (2.25) | (3.08) | (3.04) | (2.89) | (3.29) | (3.07) | |
| theil | 1.091 *** | 1.061 *** | 0.973 *** | 0.924 *** | 0.900 *** | 1.017 *** | 1.051 *** | 0.987 *** | 0.921 *** | 0.903 *** |
| (8.00) | (8.90) | (7.69) | (6.55) | (5.68) | (8.53) | (8.34) | (7.32) | (8.62) | (7.08) | |
| edu | 0.002 | 0.001 | 0.014 * | 0.015 ** | 0.004 | 0.002 | 0.020 *** | 0.021 *** | ||
| (0.40) | (0.15) | (1.78) | (1.99) | (0.75) | (0.48) | (2.80) | (2.73) | |||
| pdi | 0.010 | 0.022 | 0.091 | 0.011 | 0.026 | 0.060 | ||||
| (0.21) | (0.55) | (1.12) | (0.21) | (0.42) | (0.78) | |||||
| dep | −0.025 * | −0.028 ** | −0.032 *** | −0.034 *** | ||||||
| (−1.65) | (−2.01) | (−2.76) | (−2.73) | |||||||
| gdp | −0.036 | −0.022 | ||||||||
| (−1.03) | (−0.65) | |||||||||
| N | 176 | 176 | 176 | 176 | 176 | 176 | 176 | 176 | 176 | 176 |
| AR(1)-p | 0.005 | 0.008 | 0.009 | 0.015 | 0.014 | 0.022 | 0.020 | 0.022 | 0.024 | 0.023 |
| AR(2)-p | 0.617 | 0.603 | 0.727 | 0.824 | 0.697 | 0.644 | 0.533 | 0.600 | 0.696 | 0.615 |
| Sargan-p | 0.217 | 0.173 | 0.128 | 0.077 | 0.146 | 0.217 | 0.173 | 0.128 | 0.077 | 0.146 |
| Hansen-p | 0.222 | 0.332 | 0.296 | 0.188 | 0.223 | 0.222 | 0.332 | 0.296 | 0.188 | 0.223 |
| Variable | Fixed Effect Model | Random Effect Model | ||||||||
|---|---|---|---|---|---|---|---|---|---|---|
| (1) | (2) | (3) | (4) | (5) | (1) | (2) | (3) | (4) | (5) | |
| Health | Health | Health | Health | Health | Health | Health | Health | Health | Health | |
| theil | 0.355 *** | 0.353 *** | 0.345 *** | 0.404 *** | 0.413 *** | 0.487 *** | 0.699 *** | 0.763 *** | 0.916 *** | 1.102 *** |
| (3.62) | (3.56) | (3.46) | (3.95) | (4.04) | (4.68) | (6.01) | (6.38) | (7.73) | (8.53) | |
| edu | −0.000 | −0.001 | 0.008 * | 0.009 * | 0.011 *** | 0.015 *** | 0.037 *** | 0.042 *** | ||
| (−0.21) | (−0.69) | (1.70) | (1.90) | (6.26) | (7.25) | (8.08) | (9.36) | |||
| pdi | 0.021 | 0.022 | 0.065 * | −0.057 * | −0.041 | −0.052 | ||||
| (0.84) | (0.88) | (1.75) | (−1.88) | (−1.39) | (−1.17) | |||||
| dep | −0.016 ** | −0.019 ** | −0.041 *** | −0.042 *** | ||||||
| (−2.19) | (−2.48) | (−5.09) | (−5.09) | |||||||
| gdp | −0.023 | 0.003 | ||||||||
| (−1.55) | (0.20) | |||||||||
| cons | 0.011 | 0.022 | −0.017 | −0.153 | −0.173* | 0.016 | −0.316** | −0.254* | −0.564 *** | −0.688 *** |
| (1.05) | (0.43) | (−0.24) | (−1.64) | (−1.84) | (0.08) | (−2.29) | (−1.75) | (−3.83) | (−4.98) | |
| N | 264 | 264 | 264 | 264 | 264 | 264 | 264 | 264 | 264 | 264 |
| Within R2 | 0.0565 | 0.0567 | 0.0598 | 0.0802 | 0.0904 | 0.0565 | 0.0241 | 0.0175 | 0.0415 | 0.0359 |
| Adj R2 | 0.9910 | 0.9909 | 0.9909 | 0.9911 | 0.9911 | 0.9910 | 0.9909 | 0.9909 | 0.9911 | 0.9911 |
| Variable | Two-Way Fixed Effect Model | ||||
|---|---|---|---|---|---|
| (1) | (2) | (3) | (4) | (5) | |
| Health | Health | Health | Health | Health | |
| theil | 0.359 *** | 0.355 *** | 0.357 *** | 0.462 *** | 0.462 *** |
| (3.60) | (3.52) | (3.61) | (4.59) | (4.58) | |
| edu | −0.000 | −0.004 * | 0.012 ** | 0.012 ** | |
| (−0.20) | (−1.84) | (2.39) | (2.37) | ||
| pdi | 0.303 *** | 0.421 *** | 0.424 *** | ||
| (3.18) | (4.28) | (4.25) | |||
| dep | −0.028 *** | −0.028 *** | |||
| (−3.58) | (−3.55) | ||||
| gdp | 0.003 | ||||
| (0.20) | |||||
| Individual fixed Effect | yes | yes | yes | yes | yes |
| Time fixed Effect | yes | yes | yes | yes | yes |
| cons | 0.009 | 0.020 | −0.716 *** | −1.247 *** | −1.270 *** |
| (0.37) | (0.34) | (−3.00) | (−4.52) | (−4.26) | |
| N | 264 | 264 | 264 | 264 | 264 |
| Within R2 | 0.0570 | 0.0572 | 0.1000 | 0.1515 | 0.1517 |
| Adj R2 | 0.9908 | 0.9907 | 0.9911 | 0.9916 | 0.9915 |
| Variable | One-Step System GMM Model | Two-Step System GMM Model | Fixed Effect Model | Two-Way Fixed Effect Model |
|---|---|---|---|---|
| (1) | (2) | (3) | (4) | |
| Health | Health | Health | Health | |
| L.health | 0.301 ** | 0.374 *** | ||
| (2.25) | (3.07) | |||
| theil | 0.900 *** | 0.903 *** | 0.413 *** | 0.462 *** |
| (5.68) | (7.08) | (4.04) | (4.58) | |
| edu | 0.015 ** | 0.021 *** | 0.009 * | 0.012 ** |
| (1.99) | (2.73) | (1.90) | (2.37) | |
| pdi | 0.091 | 0.060 | 0.065 * | 0.424 *** |
| (1.12) | (0.78) | (1.75) | (4.25) | |
| dep | −0.028 ** | −0.034 *** | −0.019 ** | −0.028 *** |
| (−2.01) | (−2.73) | (−2.48) | (−3.55) | |
| gdp | −0.036 | −0.022 | −0.023 | 0.003 |
| (−1.03) | (−0.65) | (−1.55) | (0.20) | |
| Individual fixed Effect | yes | yes | ||
| Time fixed Effect | no | yes | ||
| N | 176 | 176 | 264 | 264 |
| Within R2 | 0.0904 | 0.1517 | ||
| Adj R2 | 0.9911 | 0.9915 | ||
| AR(1)-p | 0.014 | 0.023 | ||
| AR(2)-p | 0.697 | 0.615 | ||
| Sargan-p | 0.146 | 0.146 | ||
| Hansen-p | 0.223 | 0.223 |
Publisher’s Note: MDPI stays neutral with regard to jurisdictional claims in published maps and institutional affiliations. |
© 2022 by the authors. Licensee MDPI, Basel, Switzerland. This article is an open access article distributed under the terms and conditions of the Creative Commons Attribution (CC BY) license (https://creativecommons.org/licenses/by/4.0/).
Share and Cite
Yu, H.; Peng, Y.; Pu, L. Study on the Impact of Government Health Expenditure Equity on Residents’ Health Level in the Chengdu–Chongqing Economic Circle of China. Int. J. Environ. Res. Public Health 2022, 19, 12758. https://doi.org/10.3390/ijerph191912758
Yu H, Peng Y, Pu L. Study on the Impact of Government Health Expenditure Equity on Residents’ Health Level in the Chengdu–Chongqing Economic Circle of China. International Journal of Environmental Research and Public Health. 2022; 19(19):12758. https://doi.org/10.3390/ijerph191912758
Chicago/Turabian StyleYu, Haidong, Yujie Peng, and Lanfang Pu. 2022. "Study on the Impact of Government Health Expenditure Equity on Residents’ Health Level in the Chengdu–Chongqing Economic Circle of China" International Journal of Environmental Research and Public Health 19, no. 19: 12758. https://doi.org/10.3390/ijerph191912758
APA StyleYu, H., Peng, Y., & Pu, L. (2022). Study on the Impact of Government Health Expenditure Equity on Residents’ Health Level in the Chengdu–Chongqing Economic Circle of China. International Journal of Environmental Research and Public Health, 19(19), 12758. https://doi.org/10.3390/ijerph191912758