

Alkylated Polycyclic Aromatic Hydrocarbons Are the Largest Contributor to Polycyclic Aromatic Compound Concentrations in the Topsoil of Huaibei Coalfield, China


Abstract
1. Introduction
2. Materials and Methods
2.1. Sample Collection
2.2. Chemicals and Sample Pretreatment
2.3. Instrumental Analysis
2.4. Quality Control
2.5. Qualitative and Quantitative Analyses
2.6. Data Analysis
3. Results and Discussion
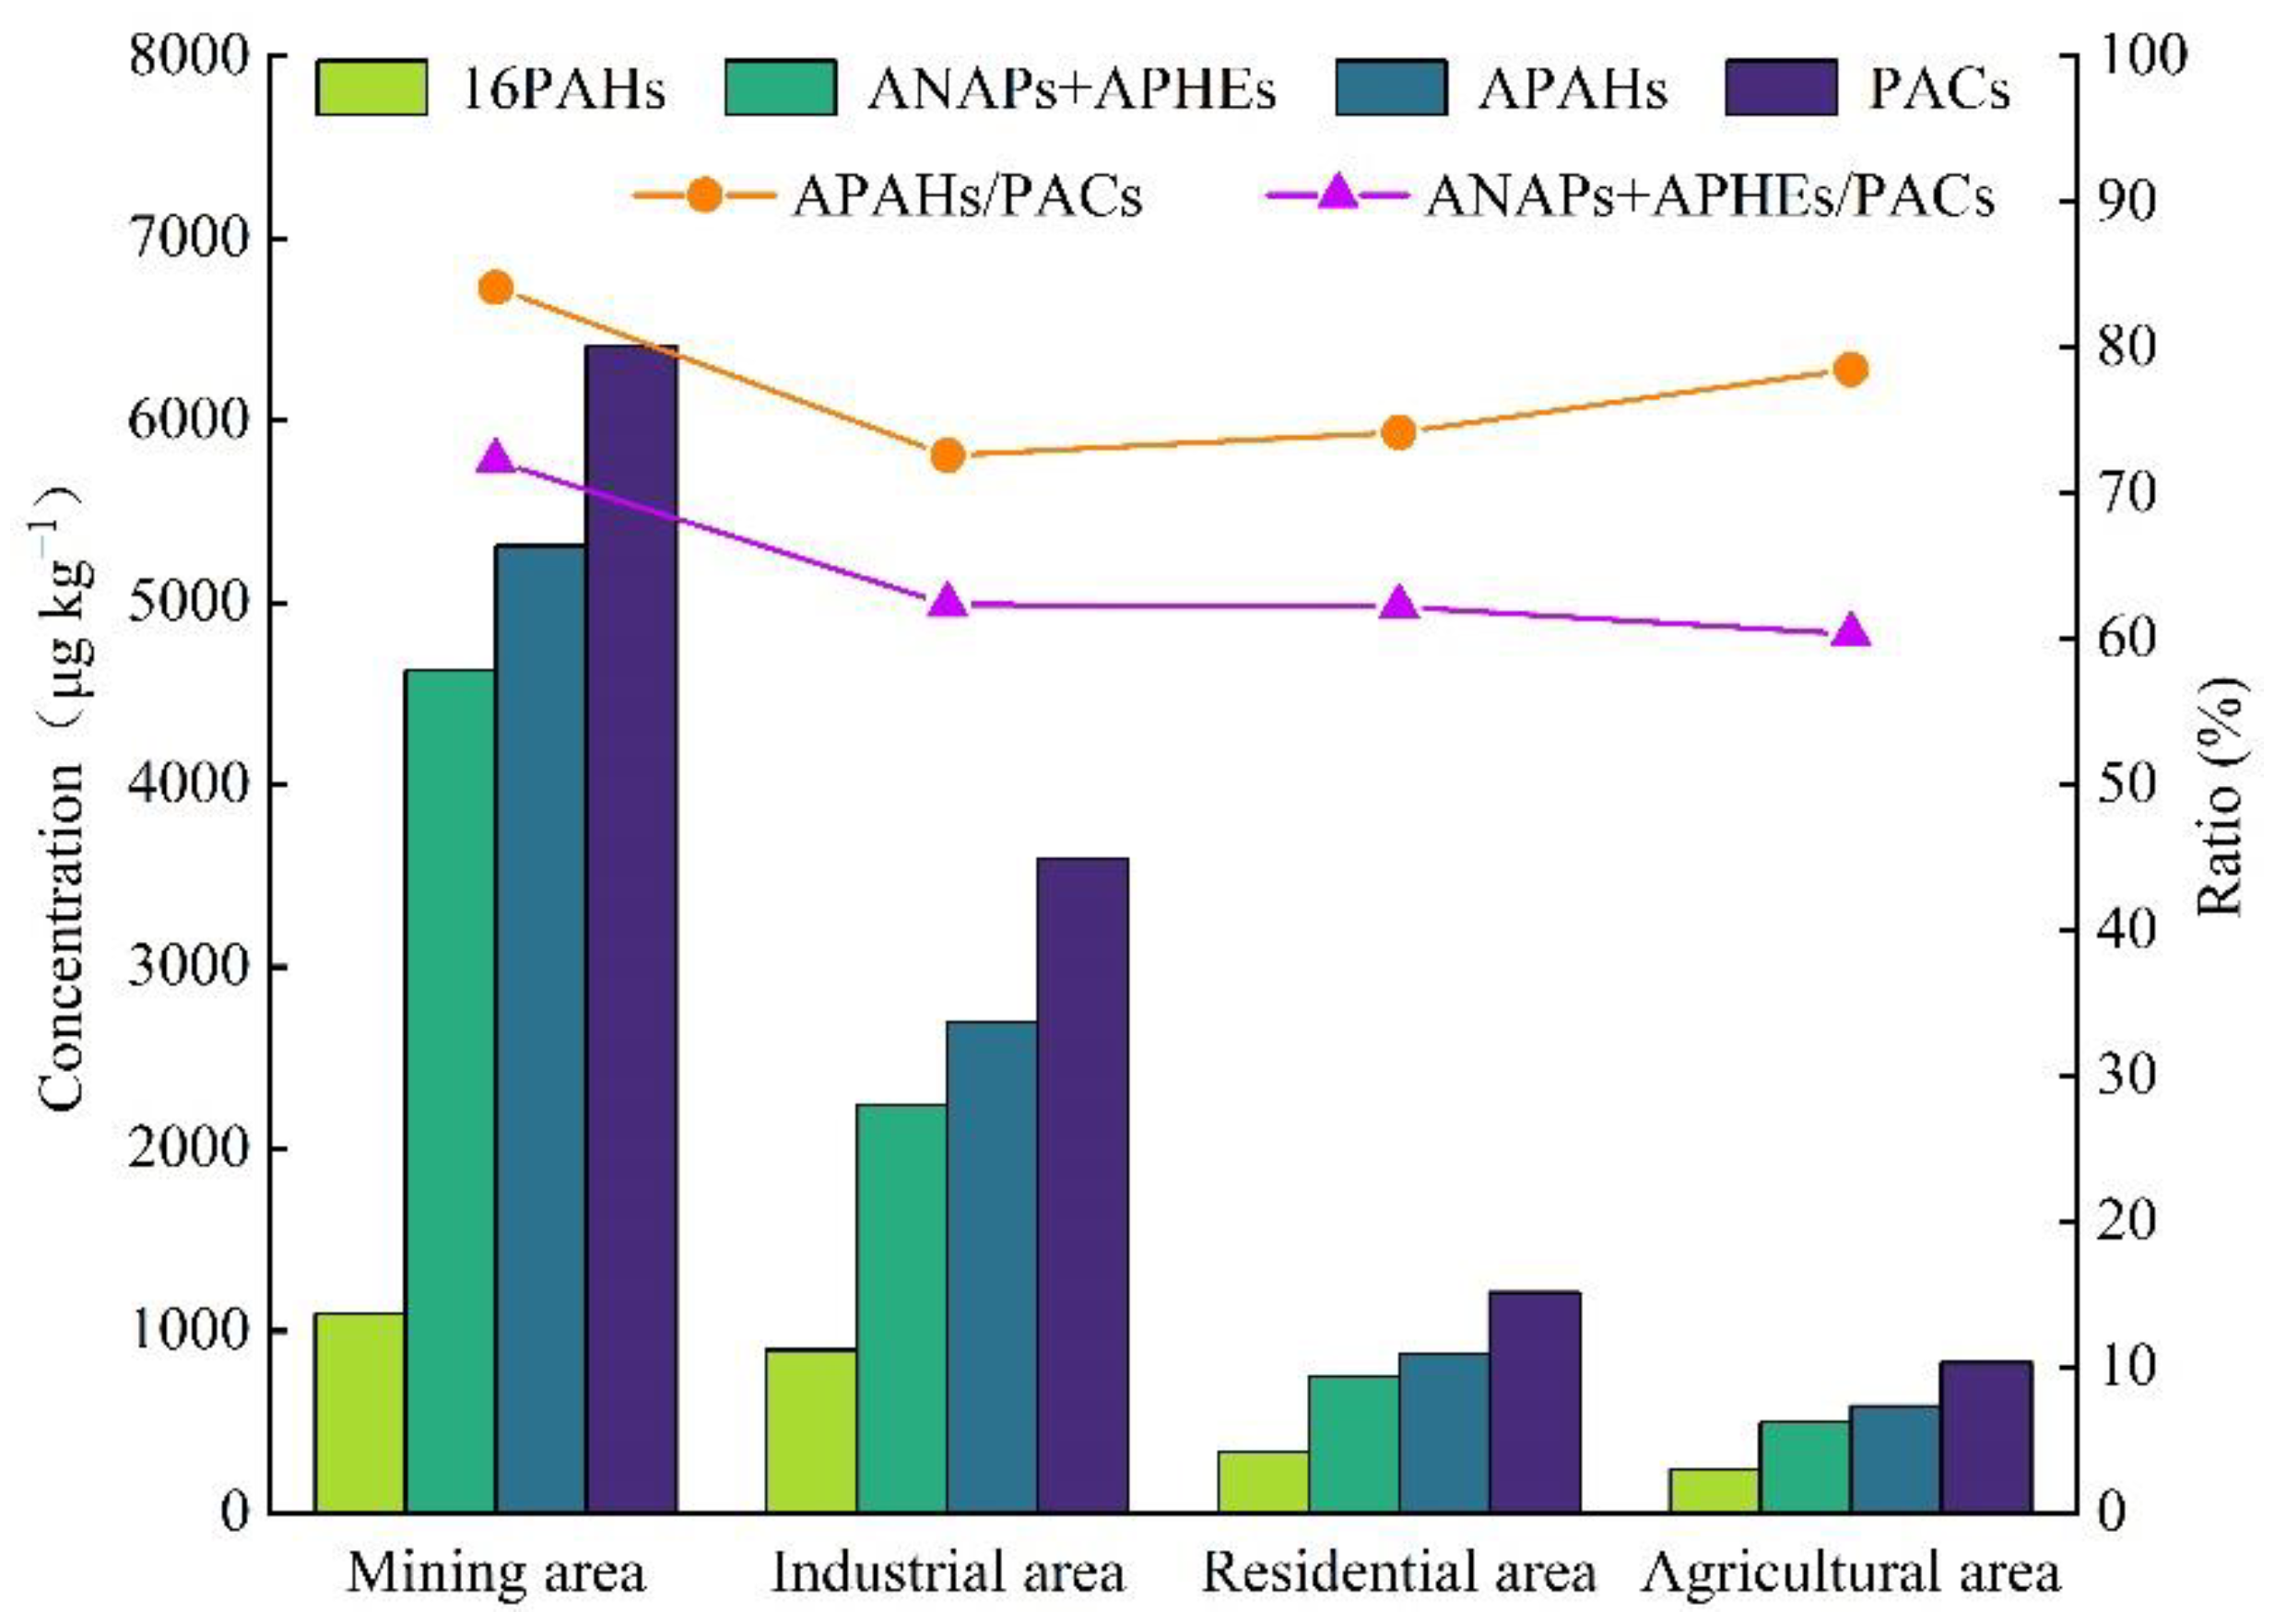
3.1. PAC Concentrations
3.2. PAC Composition Profiles in Topsoil
3.3. PAC Spatial Distributions in Topsoil
3.4. Identification of the Source of PACs
3.4.1. Principal Component Analysis (PCA)
3.4.2. Fingerprinting Information Comparison
3.5. Health Risk Assessment
4. Conclusions
Supplementary Materials
Author Contributions
Funding
Institutional Review Board Statement
Informed Consent Statement
Data Availability Statement
Conflicts of Interest
References
- Moradi, M.; Hung, H.; Li, J.; Park, R.; Shin, C.; Alexandrou, N.; Iqbal, M.A.; Takhar, M.; Chan, A.; Brook, J.R. Assessment of Alkylated and Unsubstituted Polycyclic Aromatic Hydrocarbons in Air in Urban and Semi-Urban Areas in Toronto, Canada. Environ. Sci. Technol. 2022, 56, 2959–2967. [Google Scholar] [CrossRef] [PubMed]
- Li, J.; Yang, L.; Gao, Y.; Jiang, P.; Li, Y.; Zhao, T.; Zhang, J.; Wang, W. Seasonal variations of NPAHs and OPAHs in PM2.5 at heavily polluted urban and suburban sites in North China: Concentrations, molecular compositions, cancer risk assessments and sources. Ecotoxicol. Environ. Saf. 2019, 178, 58–65. [Google Scholar] [CrossRef]
- Golzadeh, N.; Barst, B.D.; Baker, J.M.; Auger, J.C.; McKinney, M.A. Alkylated polycyclic aromatic hydrocarbons are the largest contributor to polycyclic aromatic compound concentrations in traditional foods of the Bigstone Cree Nation in Alberta, Canada. Environ. Pollut. 2021, 275, 116625. [Google Scholar] [CrossRef] [PubMed]
- Huang, Q.; Zhu, Y.; Wu, F.; Zhang, Y. Parent and alkylated polycyclic aromatic hydrocarbons in surface sediments of mangrove wetlands across Taiwan Strait, China: Characteristics, sources and ecological risk assessment. Chemosphere 2021, 265, 129168. [Google Scholar] [CrossRef] [PubMed]
- Fallahtafti, S.; Rantanen, T.; Brown, R.S.; Snieckus, V.; Hodson, P.V. Toxicity of hydroxylated alkyl-phenanthrenes to the early life stages of Japanese medaka (Oryzias latipes). Aquat. Toxicol. 2012, 106–107, 56–64. [Google Scholar] [CrossRef] [PubMed]
- Kang, H.J.; Lee, S.Y.; Kwon, J.H. Physico-chemical properties and toxicity of alkylated polycyclic aromatic hydrocarbons. J. Hazard. Mater. 2016, 312, 200–207. [Google Scholar] [CrossRef]
- Chen, W.; Wu, X.; Zhang, H.; Sun, J.; Liu, W.; Zhu, L.; Li, X.; Tsang, D.C.W.; Tao, S.; Wang, X. Contamination characteristics and source apportionment of methylated PAHs in agricultural soils from Yangtze River Delta, China. Environ. Pollut. 2017, 230, 927–935. [Google Scholar] [CrossRef] [PubMed]
- Lian, J.; Ren, Y.; Chen, J.; Wang, T.; Cheng, T. Distribution and source of alkyl polycyclic aromatic hydrocarbons in dustfall in Shanghai, China: The effect on the coastal area. J. Environ. Monit. 2009, 11, 187–192. [Google Scholar] [CrossRef] [PubMed]
- Wnorowski, A.; Harnish, D.; Jiang, Y.; Celo, V.; Dabek-Zlotorzynska, E.; Charland, J.-P. Assessment and Characterization of Alkylated PAHs in Selected Sites across Canada. Atmosphere 2022, 13, 1320. [Google Scholar] [CrossRef]
- Wang, C.; Wu, S.; Zhou, S.; Shi, Y.; Song, J. Characteristics and Source Identification of Polycyclic Aromatic Hydrocarbons (PAHs) in Urban Soils: A Review. Pedosphere 2017, 27, 17–26. [Google Scholar] [CrossRef]
- Liang, M.; Liang, H.; Rao, Z.; Xu, D. Occurrence of polycyclic aromatic hydrocarbons in groundwater from rural areas in eastern China: Spatial distribution, source apportionment and health cancer risk assessment. Chemosphere 2020, 259, 127534. [Google Scholar] [CrossRef]
- Liang, M.; Liang, Y.; Liang, H.; Rao, Z.; Cheng, H. Polycyclic aromatic hydrocarbons in soil of the backfilled region in the Wuda coal fire area, Inner Mongolia, China. Ecotoxicol. Environ. Saf. 2018, 165, 434–439. [Google Scholar] [CrossRef]
- Zhang, J.; Liub, F.; Huang, H.; Wang, R.; Xu, B. Occurrence, risk and influencing factors of polycyclic aromatic hydrocarbons in surface soils from a large-scale coal mine, Huainan, China. Ecotoxicol. Environ. Saf. 2020, 192, 110269. [Google Scholar] [CrossRef]
- Tong, R.; Yang, X.; Su, H.; Pan, Y.; Zhang, Q.; Wang, J.; Long, M. Levels, sources and probabilistic health risks of polycyclic aromatic hydrocarbons in the agricultural soils from sites neighboring suburban industries in Shanghai. Sci. Total Environ. 2018, 616–617, 1365–1373. [Google Scholar] [CrossRef]
- Ouyang, Z.; Gao, L.; Yang, C. Distribution, sources and influence factors of polycyclic aromatic hydrocarbon at different depths of the soil and sediments of two typical coal mining subsidence areas in Huainan, China. Ecotoxicol. Environ. Saf. 2018, 163, 255–265. [Google Scholar] [CrossRef]
- Cao, Q.; Yang, L.; Qian, Y.; Chen, S. Dissolution of harmful trace elements from coal and the environmental risk to mine water utilization. Environ. Sci. Pollut. Res. Int. 2022, 1–15. [Google Scholar] [CrossRef] [PubMed]
- Cao, Q.; Yang, L.; Ren, W.; Yan, R.; Wang, Y.; Liang, C. Environmental geochemical maps of harmful trace elements in Chinese coalfields. Sci. Total Environ. 2021, 799, 149475. [Google Scholar] [CrossRef] [PubMed]
- Huang, H.F.; Xing, X.L.; Zhang, Z.Z.; Qi, S.H.; Yang, D.; Yuen, D.A.; Sandy, E.H.; Zhou, A.G.; Li, X.Q. Polycyclic aromatic hydrocarbons (PAHs) in multimedia environment of Heshan coal district, Guangxi: Distribution, source diagnosis and health risk assessment. Environ. Geochem. Health 2016, 38, 1169–1181. [Google Scholar] [CrossRef] [PubMed]
- Qian, Y.; Yuan, K.; Hong, X.; Xu, Z.; Liang, H. Contamination characteristics of alkyl polycyclic aromatic hydrocarbons in dust and topsoil collected from Huaibei Coalfield, China. Environ. Geochem. Health 2022, 1–14. [Google Scholar] [CrossRef]
- Wen, X.; Zhao, J.; Zeng, F. Distribution of Polycyclic Aromatic Hydrocarbons in Coal Gangue and Emitted Gas with Low-Temperature Spontaneous Combustion in Situ. Energy Fuels 2018, 33, 176–184. [Google Scholar] [CrossRef]
- Muhammad, F.K.; Upal, G.; Kreitinger, J.P. Role of Weathered Coal Tar Pitch in the Partitioning of Polycyclic aromatic hydrocarbons in Manufactured Gas Plant Site Sediments. Environ. Pollut. 2006, 40, 5681–5687. [Google Scholar]
- Wang, R.; Liu, G.; Chou, C.L.; Liu, J.; Zhang, J. Environmental Assessment of PAHs in Soils around the Anhui Coal District, China. Arch. Environ. Contam. Toxicol. 2010, 59, 62–70. [Google Scholar] [CrossRef] [PubMed]
- Soukarieh, B.; El Hawari, K.; El Husseini, M.; Budzinski, H.; Jaber, F. Impact of Lebanese practices in industry, agriculture and urbanization on soil toxicity. Evaluation of the Polycyclic Aromatic Hydrocarbons (PAHs) levels in soil. Chemosphere 2018, 210, 85–92. [Google Scholar] [CrossRef]
- Peng, C.; Chen, W.; Liao, X.; Wang, M.; Ouyang, Z.; Jiao, W.; Bai, Y. Polycyclic aromatic hydrocarbons in urban soils of Beijing: Status, sources, distribution and potential risk. Environ. Pollut. 2011, 159, 802–808. [Google Scholar] [CrossRef]
- Qian, Y.; Wang, T.; Hong, X.; Luo, Z.; Handong, L. Study on Quantitative Method of Alkyl Polycyclic Aromatic Hydrocarbons in Surface Soils of Coal Mines. J. Chin. Mass Spectrom. Soc. 2021, 43, 168–177. [Google Scholar]
- Wei, C.; Bandowe, B.A.; Han, Y.; Cao, J.; Zhan, C.; Wilcke, W. Polycyclic aromatic hydrocarbons (PAHs) and their derivatives (alkyl-PAHs, oxygenated-PAHs, nitrated-PAHs and azaarenes) in urban road dusts from Xi’an, Central China. Chemosphere 2015, 134, 512–520. [Google Scholar] [CrossRef] [PubMed]
- Misz-Kennan, M.; Fabiańska, M. Thermal transformation of organic matter in coal waste from Rymer Cones (Upper Silesian Coal Basin, Poland). Int. J. Coal Geol. 2010, 81, 343–358. [Google Scholar] [CrossRef]
- Stout, S.A.; Emsbo-Mattingly, S.D. Concentration and character of PAHs and other hydrocarbons in coals of varying rank—Implications for environmental studies of soils and sediments containing particulate coal. Org. Geochem. 2008, 39, 801–819. [Google Scholar] [CrossRef]
- Laumann, S.; Micic, V.; Kruge, M.A.; Achten, C.; Sachsenhofer, R.F.; Schwarzbauer, J.; Hofmann, T. Variations in concentrations and compositions of polycyclic aromatic hydrocarbons (PAHs) in coals related to the coal rank and origin. Environ. Pollut. 2011, 159, 2690–2697. [Google Scholar] [CrossRef]
- Wang, Y.; Qi, A.; Wang, P.; Tuo, X.; Huang, Q.; Zhang, Y.; Xu, P.; Zhang, T.; Zhang, X.; Zhao, T.; et al. Temporal profiles, source analysis, and health risk assessments of parent polycyclic aromatic hydrocarbons (PPAHs) and their derivatives (NPAHs, OPAHs, ClPAHs, and BrPAHs) in PM2.5 and PM1.0 from the eastern coastal region of China: Urban coastal area versus coastal background area. Chemosphere 2022, 292, 133341. [Google Scholar]
- Fang, G.C.; Chang, C.N.; Wu, Y.S.; Fu, P.P.; Yang, I.L.; Chen, M.H. Characterization, identification of ambient air and road dust polycyclic aromatic hydrocarbons in central Taiwan, Taichung. Sci. Total Environ. 2004, 327, 135–146. [Google Scholar] [CrossRef]
- Wang, X.J.; Liu, R.M.; Wang, K.Y.; Hu, J.D.; Ye, Y.B.; Zhang, S.C.; Xu, F.L.; Tao, S. Application of multivariate spatial analysis in scale-based distribution and source study of PAHs in the topsoil: An example from Tianjin, China. Environ. Geol. 2006, 49, 1208–1216. [Google Scholar] [CrossRef]
- Wang, X.; Cheng, H.; Xu, X.; Zhuang, G.; Zhao, C. A wintertime study of polycyclic aromatic hydrocarbons in PM(2.5) and PM(2.5–10) in Beijing: Assessment of energy structure conversion. J. Hazard. Mater. 2008, 157, 47–56. [Google Scholar] [CrossRef] [PubMed]
- Zhang, Y.; Zheng, H.; Zhang, L.; Zhang, Z.; Xing, X.; Qi, S. Fine particle-bound polycyclic aromatic hydrocarbons (PAHs) at an urban site of Wuhan, central China: Characteristics, potential sources and cancer risks apportionment. Environ. Pollut. 2019, 246, 319–327. [Google Scholar] [CrossRef] [PubMed]
- Yunker, M.B.; Macdonald, R.W.; Vingarzan, R.; Mitchell, R.H.; Goyette, D.; Sylvestre, S. PAHs in the Fraser River basin: A critical appraisal of PAH ratios as indicators of PAH source and composition. Org. Geochem. 2002, 33, 489–515. [Google Scholar] [CrossRef]
- Wang, X.-T.; Miao, Y.; Zhang, Y.; Li, Y.C.; Wu, M.-H.; Yu, G. Polycyclic aromatic hydrocarbons (PAHs) in urban soils of the megacity Shanghai: Occurrence, source apportionment and potential human health risk. Sci. Total Environ. 2013, 447, 80–89. [Google Scholar] [CrossRef]
- Chen, P.; Li, C.; Kang, S.; Yan, F.; Zhang, Q.; Ji, Z.; Tripathee, L.; Rupakheti, D.; Rupakheti, M.; Qu, B.; et al. Source apportionment of particle-bound polycyclic aromatic hydrocarbons in Lumbini, Nepal by using the positive matrix factorization receptor model. Atmos. Res. 2016, 182, 46–53. [Google Scholar] [CrossRef]
- Yusuf, R.O.; Odediran, E.T.; Adeniran, J.A.; Adesina, O.A. Polycyclic aromatic hydrocarbons in road dusts of a densely populated African city: Spatial and seasonal distribution, source, and risk assessment. Environ. Sci. Pollut. Res. 2022, 29, 44970–44985. [Google Scholar] [CrossRef] [PubMed]
- Larsen, R.K.; Baker, J.E. Source Apportionment of Polycyclic Aromatic Hydrocarbons in the Urban Atmosphere: A Comparison of Three Methods. Environ. Sci. Technol. 2003, 37, 1873–1881. [Google Scholar] [CrossRef]
- Callen, M.S.; Iturmendi, A.; Lopez, J.M. Source apportionment of atmospheric PM2.5-bound polycyclic aromatic hydrocarbons by a PMF receptor model. Assessment of potential risk for human health. Environ. Pollut. 2014, 195, 167–177. [Google Scholar] [CrossRef] [PubMed]
- Chao, S.; Liu, J.; Chen, Y.; Cao, H.; Zhang, A. Implications of seasonal control of PM2.5-bound PAHs: An integrated approach for source apportionment, source region identification and health risk assessment. Environ. Pollut. 2019, 247, 685–695. [Google Scholar] [CrossRef] [PubMed]
- Wang, C.; Wu, S.; Zhou, S.L.; Wang, H.; Li, B.; Chen, H.; Yu, Y.; Shi, Y. Polycyclic aromatic hydrocarbons in soils from urban to rural areas in Nanjing: Concentration, source, spatial distribution, and potential human health risk. Sci. Total Environ. 2015, 527–528, 375–383. [Google Scholar] [CrossRef] [PubMed]
- Taghvaee, S.; Sowlat, M.H.; Hassanvand, M.S.; Yunesian, M.; Naddafi, K.; Sioutas, C. Source-specific lung cancer risk assessment of ambient PM2.5-bound polycyclic aromatic hydrocarbons (PAHs) in central Tehran. Environ. Int. 2018, 120, 321–332. [Google Scholar] [CrossRef]
- Agudelo-Castañeda, D.M.; Teixeira, E.C. Seasonal changes, identification and source apportionment of PAH in PM 1.0. Atmos. Environ. 2014, 96, 186–200. [Google Scholar] [CrossRef]
- Tian, Y.Z.; Li, W.H.; Shi, G.L.; Feng, Y.C.; Wang, Y.Q. Relationships between PAHs and PCBs, and quantitative source apportionment of PAHs toxicity in sediments from Fenhe reservoir and watershed. J. Hazard. Mater. 2013, 248, 89–96. [Google Scholar] [CrossRef] [PubMed]
- Hindersmann, B.; Achten, C. Urban soils impacted by tailings from coal mining: PAH source identification by 59 PAHs, BPCA and alkylated PAHs. Environ. Pollut. 2018, 242 Pt B, 1217–1225. [Google Scholar] [CrossRef]
- Stout, S.A. Characterization and Source of Unknown “Tar-Like Material” and “Slag” in a Former Oil Field in Compton, California. Environ. Forensics 2007, 8, 265–282. [Google Scholar] [CrossRef]
- Abdel-Shafy, H.I.; Mansour, M.S.M. A review on polycyclic aromatic hydrocarbons: Source, environmental impact, effect on human health and remediation. Egypt. J. Pet. 2016, 25, 107–123. [Google Scholar] [CrossRef]
- Qin, L.; Han, J.; He, X.; Lu, Q. The Emission Characteristic of PAHs during Coal Combustion in a Fluidized Bed Combustor. Energy Sources Part A Recovery Util. Environ. Eff. 2013, 36, 212–221. [Google Scholar] [CrossRef]
- Qingyi, W. Energy data in China and world. Coal Econ. Res. 2004, 273, 74–79. [Google Scholar]
- Meyer, W.; Seiler, T.B.; Reininghaus, M.; Schwarzbauer, J.; Puttmann, W.; Hollert, H.; Achten, C. Limited waterborne acute toxicity of native polycyclic aromatic compounds from coals of different types compared to their total hazard potential. Environ. Sci. Technol. 2013, 47, 11766–11775. [Google Scholar] [CrossRef]
- Jingsen, F.; Yuzhuang, S.; Xinyu, L.; Cunliang, Z.; Duanxin, T.; Longyi, S.; Jinxi, W. Pollution of organic compounds and heavy metals in a coal gangue dump of the Gequan Coal Mine, China. Chin. J. Geochem. 2013, 32, 241–247. [Google Scholar]
- Lu, C.M.; Dat, N.D.; Lien, C.K.; Chi, K.H.; Chang, M.B. Characteristics of Fine Particulate Matter and Polycyclic Aromatic Hydrocarbons Emitted from Coal Combustion Processes. Energy Fuels 2019, 33, 10247–10254. [Google Scholar] [CrossRef]
- Wang, H.; Cheng, C.; Chen, C. Characteristics of polycyclic aromatic hydrocarbon release during spontaneous combustion of coal and gangue in the same coal seam. J. Loss Prev. Process Ind. 2018, 55, 392–399. [Google Scholar] [CrossRef]
- Sun, Y.Z.; Fan, J.S.; Qin, P.; Niu, H.Y. Pollution extents of organic substances from a coal gangue dump of Jiulong Coal Mine, China. Environ. Geochem. Health 2009, 31, 81–89. [Google Scholar] [CrossRef] [PubMed]
- Wang, X.W.; Zhong, N.N.; Hu, D.M.; Liu, Z.Z.; Zhang, Z.H. Polycyclic aromatic hydrocarbon (PAHs) pollutants in groundwater from coal gangue stack area: Characteristics and origin. Water Sci. Technol. 2009, 59, 1043–1051. [Google Scholar] [CrossRef]
- Li, C.; Zhang, X.; Gao, X.; Qi, S.; Wang, Y. The Potential Environmental Impact of PAHs on Soil and Water Resources in Air Deposited Coal Refuse Sites in Niangziguan Karst Catchment, Northern China. Int. J. Environ. Res. Public Health 2019, 16, 1368. [Google Scholar] [CrossRef] [PubMed]
- Hoseini, M.; Yunesian, M.; Nabizadeh, R.; Yaghmaeian, K.; Ahmadkhaniha, R.; Rastkari, N.; Parmy, S.; Faridi, S.; Rafiee, A.; Naddafi, K. Characterization and risk assessment of polycyclic aromatic hydrocarbons (PAHs) in urban atmospheric Particulate of Tehran, Iran. Environ. Sci. Pollut. Res. Int. 2016, 23, 1820–1832. [Google Scholar] [CrossRef] [PubMed]
- Mon, E.E.; Phay, N.; Agusa, T.; Bach, L.T.; Yeh, H.M.; Huang, C.H.; Nakata, H. Polycyclic Aromatic Hydrocarbons (PAHs) in Road Dust Collected from Myanmar, Japan, Taiwan, and Vietnam. Arch. Environ. Contam. Toxicol. 2020, 78, 34–45. [Google Scholar] [CrossRef] [PubMed]
- Liu, J.; Liu, G.; Zhang, J.; Yina, H.; Wang, R. Occurrence and risk assessment of polycyclic aromatic hydrocarbons in soil from the Tiefa coal mine district, Liaoning, China. J. Environ. Monit. 2012, 14, 2634–2642. [Google Scholar] [CrossRef] [PubMed]
- Nam, J.J.; Song, B.H.; Eom, K.C.; Lee, S.H.; Smith, A. Distribution of polycyclic aromatic hydrocarbons in agricultural soils in South Korea. Chemosphere 2003, 50, 1281–1289. [Google Scholar] [CrossRef]
- Yin, C.Q.; Jiang, X.; Yang, X.L.; Bian, Y.R.; Wang, F. Polycyclic aromatic hydrocarbons in soils in the vicinity of Nanjing, China. Chemosphere 2008, 73, 389–394. [Google Scholar] [CrossRef] [PubMed]
- Agarwal, T.; Khillare, P.S.; Shridhar, V.; Ray, S. Pattern, sources and toxic potential of PAHs in the agricultural soils of Delhi, India. J. Hazard. Mater. 2009, 163, 1033–1042. [Google Scholar] [CrossRef]
- Hao, R.; Wan, H.-F.; Song, Y.-T.; Jiang, H.; Peng, S.-L. Polycyclic Aromatic Hydrocarbons in Agricultural Soils of the Southern Subtropics, China. Pedosphere. 2007, 17, 673–680. [Google Scholar] [CrossRef]
- Maliszewska-Kordybach, B.; Smreczak, B.; Klimkowicz-Pawlas, A. Effects of anthropopressure and soil properties on the accumulation of polycyclic aromatic hydrocarbons in the upper layer of soils in selected regions of Poland. Appl. Geochem. 2009, 24, 1918–1926. [Google Scholar] [CrossRef]
- Yang, J.; Sun, P.; Zhang, X.; Wei, X.Y.; Huang, Y.P.; Du, W.N.; Qadeer, A.; Liu, M.; Huang, Y. Source apportionment of PAHs in roadside agricultural soils of a megacity using positive matrix factorization receptor model and compound-specific carbon isotope analysis. J. Hazard. Mater. 2021, 403, 123592. [Google Scholar] [CrossRef]
- Liao, X.; Wu, Z.; Li, Y.; Cao, H.; Su, C. Effect of various chemical oxidation reagents on soil indigenous microbial diversity in remediation of soil contaminated by PAHs. Chemosphere 2019, 226, 483–491. [Google Scholar] [CrossRef]
- Jiao, W.; Lu, Y.; Li, J.; Han, J.; Wang, T.; Luo, W.; Shi, Y.; Wang, G. Identification of sources of elevated concentrations of polycyclic aromatic hydrocarbons in an industrial area in Tianjin, China. Environ. Monit. Assess. 2009, 158, 581–592. [Google Scholar] [CrossRef]
- Idowu, O.; Semple, K.T.; Ramadass, K.; O’Connor, W.; Hansbro, P.; Thavamani, P. Analysis of polycyclic aromatic hydrocarbons (PAHs) and their polar derivatives in soils of an industrial heritage city of Australia. Sci. Total Environ. 2020, 699, 1–12. [Google Scholar] [CrossRef]
- Jia, T.; Guo, W.; Xing, Y.; Lei, R.; Wu, X.; Sun, S.; He, Y.; Liu, W. Spatial distributions and sources of PAHs in soil in chemical industry parks in the Yangtze River Delta, China. Environ. Pollut. 2021, 283, 117121. [Google Scholar] [CrossRef] [PubMed]
- Jiang, Y.; Yves, U.J.; Sun, H.; Hu, X.; Zhan, H.; Wu, Y. Distribution, compositional pattern and sources of polycyclic aromatic hydrocarbons in urban soils of an industrial city, Lanzhou, China. Ecotoxicol. Environ. Saf. 2016, 126, 154–162. [Google Scholar] [CrossRef]
- Li, Y.; Long, L.; Ge, J.; Yang, L.X.; Cheng, J.J.; Sun, L.X.; Lu, C.; Yu, X.Y. Presence, distribution and risk assessment of polycyclic aromatic hydrocarbons in rice-wheat continuous cropping soils close to five industrial parks of Suzhou, China. Chemosphere 2017, 184, 753–761. [Google Scholar] [CrossRef]
- Sushkova, S.; Minkina, T.; Deryabkina, I.; Rajput, V.; Antonenko, E.; Nazarenko, O.; Yadav, B.K.; Hakki, E.; Mohan, D. Environmental pollution of soil with PAHs in energy producing plants zone. Sci. Total Environ. 2019, 655, 232–241. [Google Scholar] [CrossRef] [PubMed]
- Liu, Y.; Gao, P.; Su, J.; da Silva, E.B.; de Oliveira, L.M.; Townsend, T.; Xiang, P.; Ma, L.Q. PAHs in urban soils of two Florida cities: Background concentrations, distribution, and sources. Chemosphere 2019, 214, 220–227. [Google Scholar] [CrossRef] [PubMed]
- Thiombane, M.; Albanese, S.; Di Bonito, M.; Lima, A.; Zuzolo, D.; Rolandi, R.; Qi, S.; De Vivo, B. Source patterns and contamination level of polycyclic aromatic hydrocarbons (PAHs) in urban and rural areas of Southern Italian soils. Environ. Geochem. Health. 2019, 41, 507–528. [Google Scholar] [CrossRef] [PubMed]
- Qu, C.; Albanese, S.; Lima, A.; Hope, D.; Pond, P.; Fortelli, A.; Romano, N.; Cerino, P.; Pizzolante, A.; De Vivo, B. The occurrence of OCPs, PCBs, and PAHs in the soil, air, and bulk deposition of the Naples metropolitan area, southern Italy: Implications for sources and environmental processes. Environ. Int. 2019, 124, 89–97. [Google Scholar] [CrossRef] [PubMed]
- Gao, P.; Xu, M.; Liu, Y.; da Silva, E.B.; Xiang, P.; Ma, L.Q. Emerging and legacy PAHs in urban soils of four small cities: Concentrations, distribution, and sources. Sci. Total Environ. 2019, 685, 463–470. [Google Scholar] [CrossRef] [PubMed]
- Tang, L.; Tang, X.Y.; Zhu, Y.G.; Zheng, M.H.; Miao, Q.L. Contamination of polycyclic aromatic hydrocarbons (PAHs) in urban soils in Beijing, China. Environ. Int. 2005, 31, 822–828. [Google Scholar] [CrossRef]
- Jiang, Y.; Wang, X.; Wang, F.; Jia, Y.; Wu, M.; Sheng, G.; Fu, J. Levels, composition profiles and sources of polycyclic aromatic hydrocarbons in urban soil of Shanghai, China. Chemosphere 2009, 75, 1112–1118. [Google Scholar] [CrossRef]
- Bortey-Sam, N.; Ikenaka, Y.; Nakayama, S.M.M.; Akoto, O.; Yohannes, Y.B.; Baidoo, E.; Mizukawa, H.; Ishizuka, M. Occurrence, distribution, sources and toxic potential of polycyclic aromatic hydrocarbons (PAHs) in surface soils from the Kumasi Metropolis, Ghana. Sci. Total Environ. 2014, 496, 471–478. [Google Scholar] [CrossRef]
- Parra, Y.J.; Oloyede, O.O.; Pereira, G.M.; de Almeida Lima, P.H.A.; da Silva Caumo, S.E.; Morenikeji, O.A.; de Castro Vasconcellos, P. Polycyclic aromatic hydrocarbons in soils and sediments in Southwest Nigeria. Environ. Pollut. 2020, 259, 113732. [Google Scholar] [CrossRef] [PubMed]
- Zuo, Q.; Duan, Y.; Yang, Y.; Wang, X.J.; Tao, S. Source apportionment of polycyclic aromatic hydrocarbons in surface soil in Tianjin, China. Environ. Pollut. 2007, 147, 303–310. [Google Scholar] [CrossRef] [PubMed]
- Wang, Z.; Chen, J.; Qiao, X.; Yang, P.; Tian, F.; Huang, L. Distribution and sources of polycyclic aromatic hydrocarbons from urban to rural soils: A case study in Dalian, China. Chemosphere 2007, 68, 965–971. [Google Scholar] [CrossRef] [PubMed]
- Liang, M.; Liang, H.; Rao, Z.; Hong, X. Characterization of polycyclic aromatic hydrocarbons in urban-rural integration area soil, North China: Spatial distribution, sources and potential human health risk assessment. Chemosphere 2019, 234, 875–884. [Google Scholar] [CrossRef] [PubMed]


| Compounds | Mining Area Topsoil (n = 15) | Industrial Area Topsoil (n = 61) | Residential Area Topsoil (n = 6) | Agricultural Area Topsoil (n = 45) | Mining Area Coal (n = 1) | Mining Area Coal Gangue (n = 2) | |||||||||
|---|---|---|---|---|---|---|---|---|---|---|---|---|---|---|---|
| Min | Max | Mean | Min | Max | Mean | Min | Max | Mean | Min | Max | Mean | TTC | TTF-1 | TTW-1 | |
| NAP | 54 | 392 | 173 | 20 | 421 | 81 | nd | 143 | 51 | nd | 152 | 28 | 1927 | 969 | 255 |
| ACY | nd | 39 | 12 | nd | 77 | 13 | nd | nd | 10 | nd | nd | 10 | 123 | 10 | 10 |
| ACE | nd | 57 | 18 | nd | 131 | 20 | nd | nd | 13 | nd | 25 | 13 | 123 | 13 | 13 |
| FLU | 29 | 266 | 93 | nd | 419 | 43 | nd | 49 | 20 | nd | 88 | 16 | 1004 | 564 | 167 |
| PHE | 92 | 797 | 296 | nd | 1785 | 170 | nd | 140 | 60 | nd | 288 | 36 | 2810 | 1263 | 520 |
| ANT | nd | 83 | 15 | nd | 209 | 14 | nd | nd | 6 | nd | 13 | 6 | 23 | 27 | 31 |
| FLA | nd | 357 | 65 | nd | 1068 | 108 | nd | 70 | 30 | nd | 113 | 16 | 184 | 177 | 160 |
| PYR | nd | 372 | 75 | nd | 840 | 89 | nd | 71 | 26 | nd | 81 | 15 | 358 | 292 | 242 |
| BaA | nd | 176 | 37 | nd | 349 | 33 | nd | 19 | 11 | nd | 37 | 11 | 224 | 10 | 35 |
| CHR | 14 | 347 | 104 | nd | 1044 | 97 | nd | 92 | 31 | nd | 107 | 15 | 563 | 655 | 148 |
| BbF | nd | 179 | 55 | nd | 995 | 73 | nd | 22 | 10 | nd | 79 | 10 | 163 | 8 | 8 |
| BkF | nd | 61 | 18 | nd | 215 | 30 | nd | 31 | 18 | nd | 33 | 15 | 165 | 71 | 58 |
| BaP | nd | 249 | 42 | nd | 505 | 47 | nd | 23 | 13 | nd | 25 | 11 | 345 | 137 | 139 |
| InP | nd | 62 | 16 | nd | 125 | 19 | nd | 13 | 13 | nd | 13 | 13 | 74 | 33 | 38 |
| DBA | nd | 45 | 16 | nd | 47 | 13 | nd | 12 | 12 | nd | 12 | 12 | 82 | 43 | 43 |
| BgP | nd | 240 | 60 | nd | 528 | 46 | nd | 25 | 15 | nd | 13 | 13 | 625 | 322 | 188 |
| ANAPs | 659 | 7240 | 2561 | 26 | 9838 | 1011 | 26 | 1016 | 324 | 26 | 2011 | 203 | 43,711 | 10,583 | 4093 |
| APHEs | 490 | 6213 | 2065 | 52 | 12,669 | 1229 | 62 | 1415 | 429 | 60 | 2190 | 297 | 14,864 | 8138 | 6411 |
| 2-M-ANT | nd | 75 | 33 | nd | 527 | 36 | nd | 26 | 12 | nd | 44 | 11 | 409 | 8 | 44 |
| C1-FLU | nd | 333 | 93 | nd | 581 | 48 | nd | 53 | 17 | nd | 74 | 10 | 1257 | 642 | 168 |
| C1-FLA | 25 | 448 | 147 | nd | 902 | 104 | nd | 74 | 24 | nd | 130 | 14 | 771 | 421 | 356 |
| C1-FLA | 25 | 448 | 147 | nd | 902 | 104 | nd | 74 | 24 | nd | 130 | 14 | 771 | 421 | 356 |
| C1-PYR | nd | 789 | 207 | nd | 1531 | 158 | nd | 156 | 43 | nd | 228 | 27 | 63 | 692 | 696 |
| 7-M-BaP | nd | 516 | 68 | nd | 456 | 47 | nd | 22 | 10 | nd | 88 | 16 | 551 | 136 | 155 |
| ∑16PAHs | 307 | 3721 | 1095 | 152 | 8758 | 896 | 152 | 735 | 338 | 151 | 1088 | 239 | 8793 | 4594 | 2055 |
| ∑APAHs | 1233 | 16,270 | 5313 | 114 | 27,380 | 2696 | 129 | 2794 | 872 | 127 | 4886 | 588 | 62,575 | 21,221 | 12,329 |
| ∑PACs | 1541 | 19,991 | 6408 | 266 | 36,138 | 3735 | 281 | 3529 | 1252 | 278 | 5974 | 847 | 71,368 | 25,815 | 14,388 |
| Location | CRs | Child | Adult | ||||
|---|---|---|---|---|---|---|---|
| Mean | Max | Min | Mean | Max | Min | ||
| Mining | CRing a | 8.14 × 10⁻⁷ | 4.06 × 10⁻⁶ | 3.21 × 10⁻⁷ | 6.96 × 10⁻⁸ | 2.64 × 10⁻⁷ | 3.71 × 10⁻⁸ |
| CRderm b | 2.73 × 10⁻⁶ | 1.36 × 10⁻⁵ | 1.08 × 10⁻⁶ | 4.76 × 10⁻⁷ | 1.80 × 10⁻⁶ | 2.54 × 10⁻⁷ | |
| CRinh c | 1.20 × 10⁻¹¹ | 5.98 × 10⁻¹¹ | 4.72 × 10⁻¹² | 2.70 × 10⁻¹¹ | 1.02 × 10⁻¹⁰ | 1.44 × 10⁻¹¹ | |
| CRtotal | 3.55 × 10⁻⁶ | 1.77 × 10⁻⁵ | 1.40 × 10⁻⁶ | 5.45 × 10⁻⁷ | 2.07 × 10⁻⁶ | 2.91 × 10⁻⁷ | |
| Industrial | CRing | 6.91 × 10⁻⁷ | 4.78 × 10⁻⁶ | 3.08 × 10⁻⁷ | 9.05 × 10⁻⁸ | 6.26 × 10⁻⁷ | 4.04 × 10⁻⁸ |
| CRderm | 2.32 × 10⁻⁶ | 1.60 × 10⁻⁵ | 1.03 × 10⁻⁶ | 6.19 × 10⁻⁷ | 4.28 × 10⁻⁶ | 2.76 × 10⁻⁷ | |
| CRinh | 1.02 × 10⁻¹¹ | 7.04 × 10⁻¹¹ | 4.54 × 10⁻¹² | 3.51 × 10⁻¹¹ | 2.43 × 10⁻¹⁰ | 1.56 × 10⁻¹¹ | |
| CRtotal | 3.01 × 10⁻⁶ | 2.08 × 10⁻⁵ | 1.34 × 10⁻⁶ | 7.09 × 10⁻⁷ | 4.90 × 10⁻⁶ | 3.16 × 10⁻⁷ | |
| Residential | CRing | 3.32 × 10⁻⁷ | 4.31 × 10⁻⁷ | 3.08 × 10⁻⁷ | 4.36 × 10⁻⁸ | 5.65 × 10⁻⁸ | 4.04 × 10⁻⁸ |
| CRderm | 1.12 × 10⁻⁶ | 1.45 × 10⁻⁶ | 1.03 × 10⁻⁶ | 2.98 × 10⁻⁷ | 3.86 × 10⁻⁷ | 2.76 × 10⁻⁷ | |
| CRinh | 4.90 × 10⁻¹² | 6.35 × 10⁻¹² | 4.50 × 10⁻¹² | 1.69 × 10⁻¹¹ | 2.19 × 10⁻¹¹ | 1.57 × 10⁻¹¹ | |
| CRtotal | 1.45 × 10⁻⁶ | 1.88 × 10⁻⁶ | 1.34 × 10⁻⁶ | 3.41 × 10⁻⁷ | 4.43 × 10⁻⁷ | 3.16 × 10⁻⁷ | |
| Agricultural | CRing | 3.46 × 10⁻⁷ | 7.33 × 10⁻⁷ | 3.08 × 10⁻⁷ | 4.54 × 10⁻⁸ | 9.61 × 10⁻⁸ | 4.03 × 10⁻⁸ |
| CRderm | 1.16 × 10⁻⁶ | 2.46 × 10⁻⁶ | 1.03 × 10⁻⁶ | 3.10 × 10⁻⁷ | 6.57 × 10⁻⁷ | 2.76 × 10⁻⁷ | |
| CRinh | 5.10 × 10⁻¹² | 1.08 × 10⁻¹¹ | 4.54 × 10⁻¹² | 1.76 × 10⁻¹¹ | 3.73 × 10⁻¹¹ | 1.56 × 10⁻¹¹ | |
| CRtotal | 1.51 × 10⁻⁶ | 3.19 × 10⁻⁶ | 1.34 × 10⁻⁶ | 3.55 × 10⁻⁷ | 7.53 × 10⁻⁷ | 3.16 × 10⁻⁷ | |
Publisher’s Note: MDPI stays neutral with regard to jurisdictional claims in published maps and institutional affiliations. |
© 2022 by the authors. Licensee MDPI, Basel, Switzerland. This article is an open access article distributed under the terms and conditions of the Creative Commons Attribution (CC BY) license (https://creativecommons.org/licenses/by/4.0/).
Share and Cite
Qian, Y.; Xu, Z.; Hong, X.; Luo, Z.; Gao, X.; Tie, C.; Liang, H. Alkylated Polycyclic Aromatic Hydrocarbons Are the Largest Contributor to Polycyclic Aromatic Compound Concentrations in the Topsoil of Huaibei Coalfield, China. Int. J. Environ. Res. Public Health 2022, 19, 12733. https://doi.org/10.3390/ijerph191912733
Qian Y, Xu Z, Hong X, Luo Z, Gao X, Tie C, Liang H. Alkylated Polycyclic Aromatic Hydrocarbons Are the Largest Contributor to Polycyclic Aromatic Compound Concentrations in the Topsoil of Huaibei Coalfield, China. International Journal of Environmental Research and Public Health. 2022; 19(19):12733. https://doi.org/10.3390/ijerph191912733
Chicago/Turabian StyleQian, Yahui, Zhenpeng Xu, Xiuping Hong, Zhonggeng Luo, Xiulong Gao, Cai Tie, and Handong Liang. 2022. "Alkylated Polycyclic Aromatic Hydrocarbons Are the Largest Contributor to Polycyclic Aromatic Compound Concentrations in the Topsoil of Huaibei Coalfield, China" International Journal of Environmental Research and Public Health 19, no. 19: 12733. https://doi.org/10.3390/ijerph191912733
APA StyleQian, Y., Xu, Z., Hong, X., Luo, Z., Gao, X., Tie, C., & Liang, H. (2022). Alkylated Polycyclic Aromatic Hydrocarbons Are the Largest Contributor to Polycyclic Aromatic Compound Concentrations in the Topsoil of Huaibei Coalfield, China. International Journal of Environmental Research and Public Health, 19(19), 12733. https://doi.org/10.3390/ijerph191912733