
Spatio-Temporal Dynamics and Sensitive Distance Identification of Light Pollution in Protected Areas Based on Muti-Source Data: A Case Study of Guangdong Province, China


Abstract
:1. Introduction
2. Materials and Methods
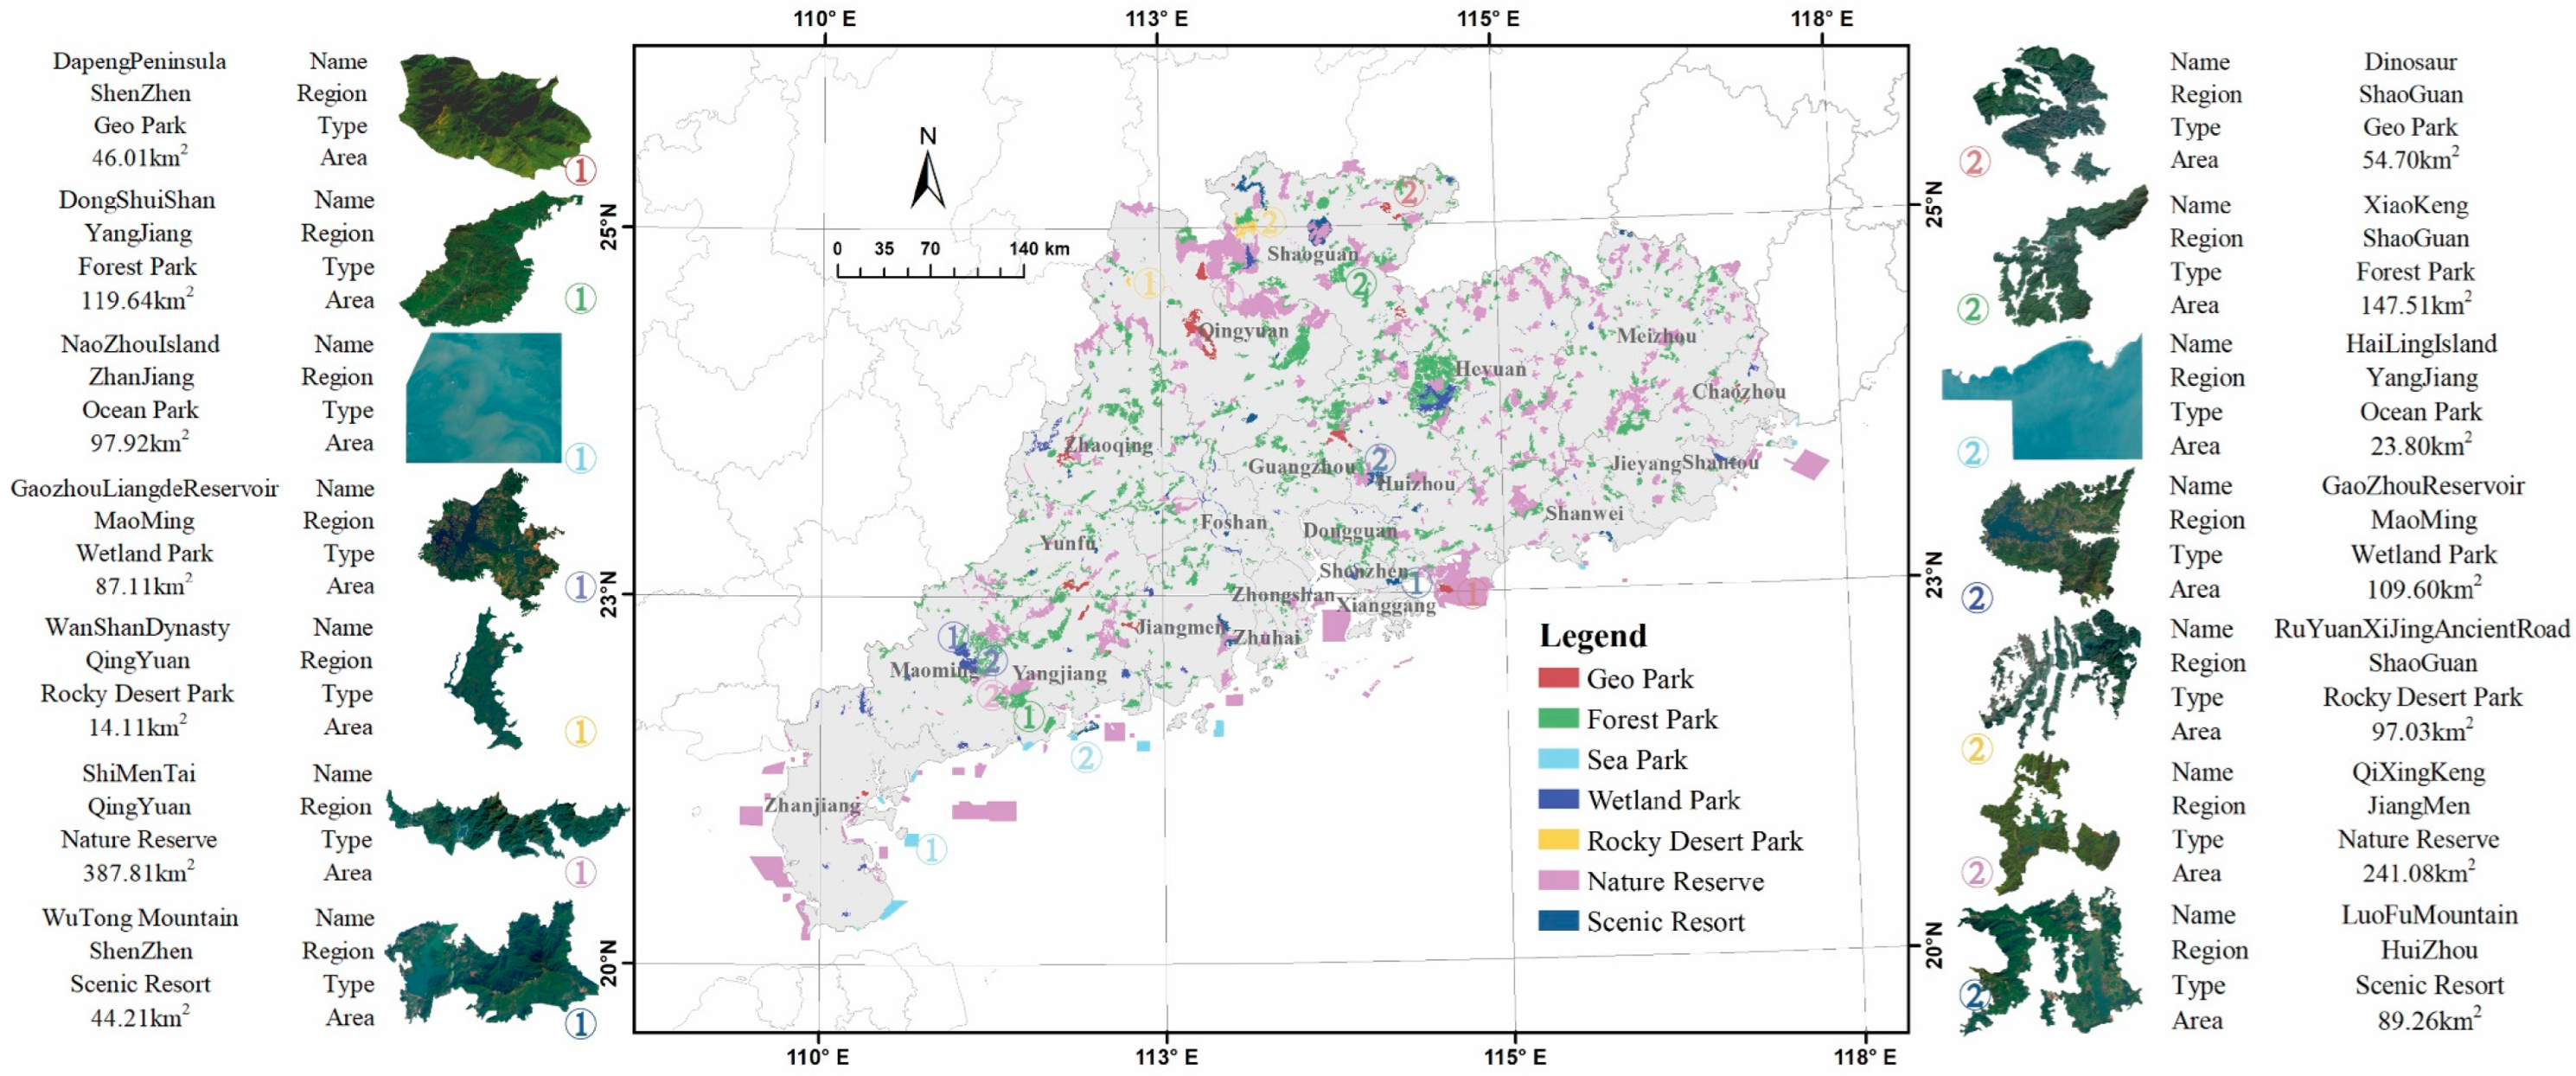
2.1. Study Area
2.2. Data Sources
2.2.1. Nighttime Light Data
2.2.2. Human Activity Intensity Data
2.3. Methods
2.3.1. Spatio-Temporal Changes of NTL
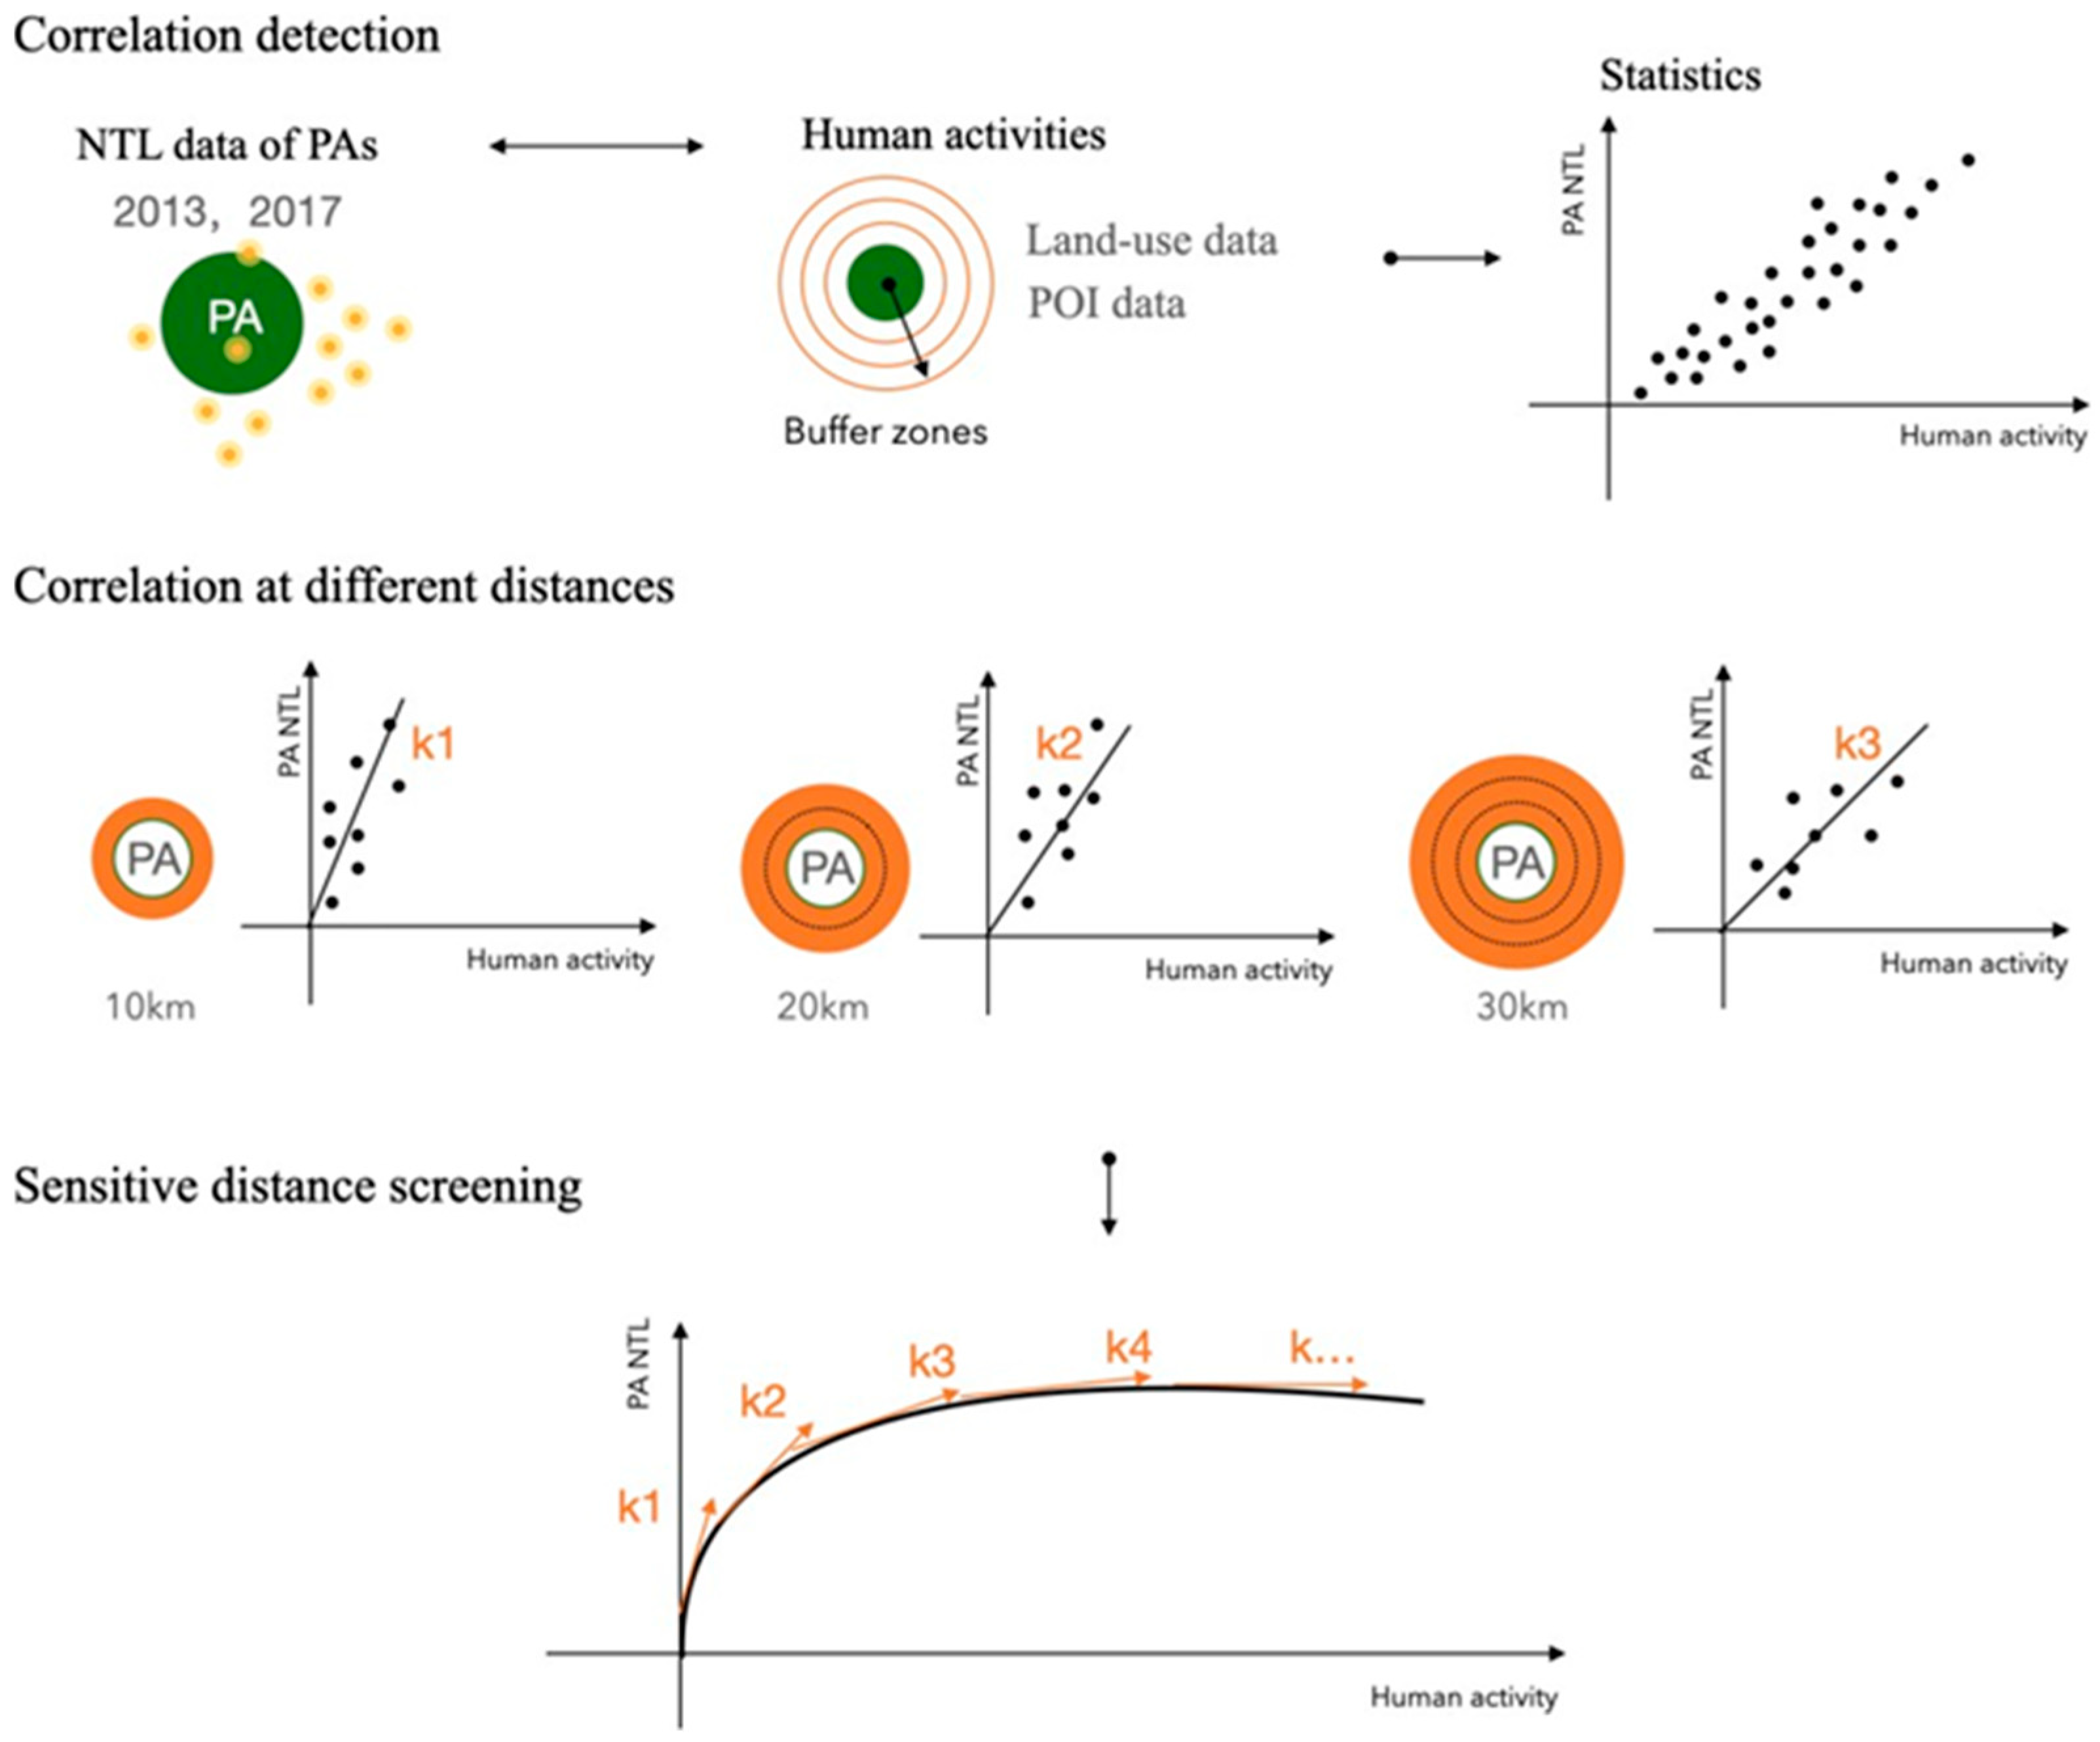
2.3.2. Correlation Detection
2.3.3. Sensitive Distance Analysis
3. Results
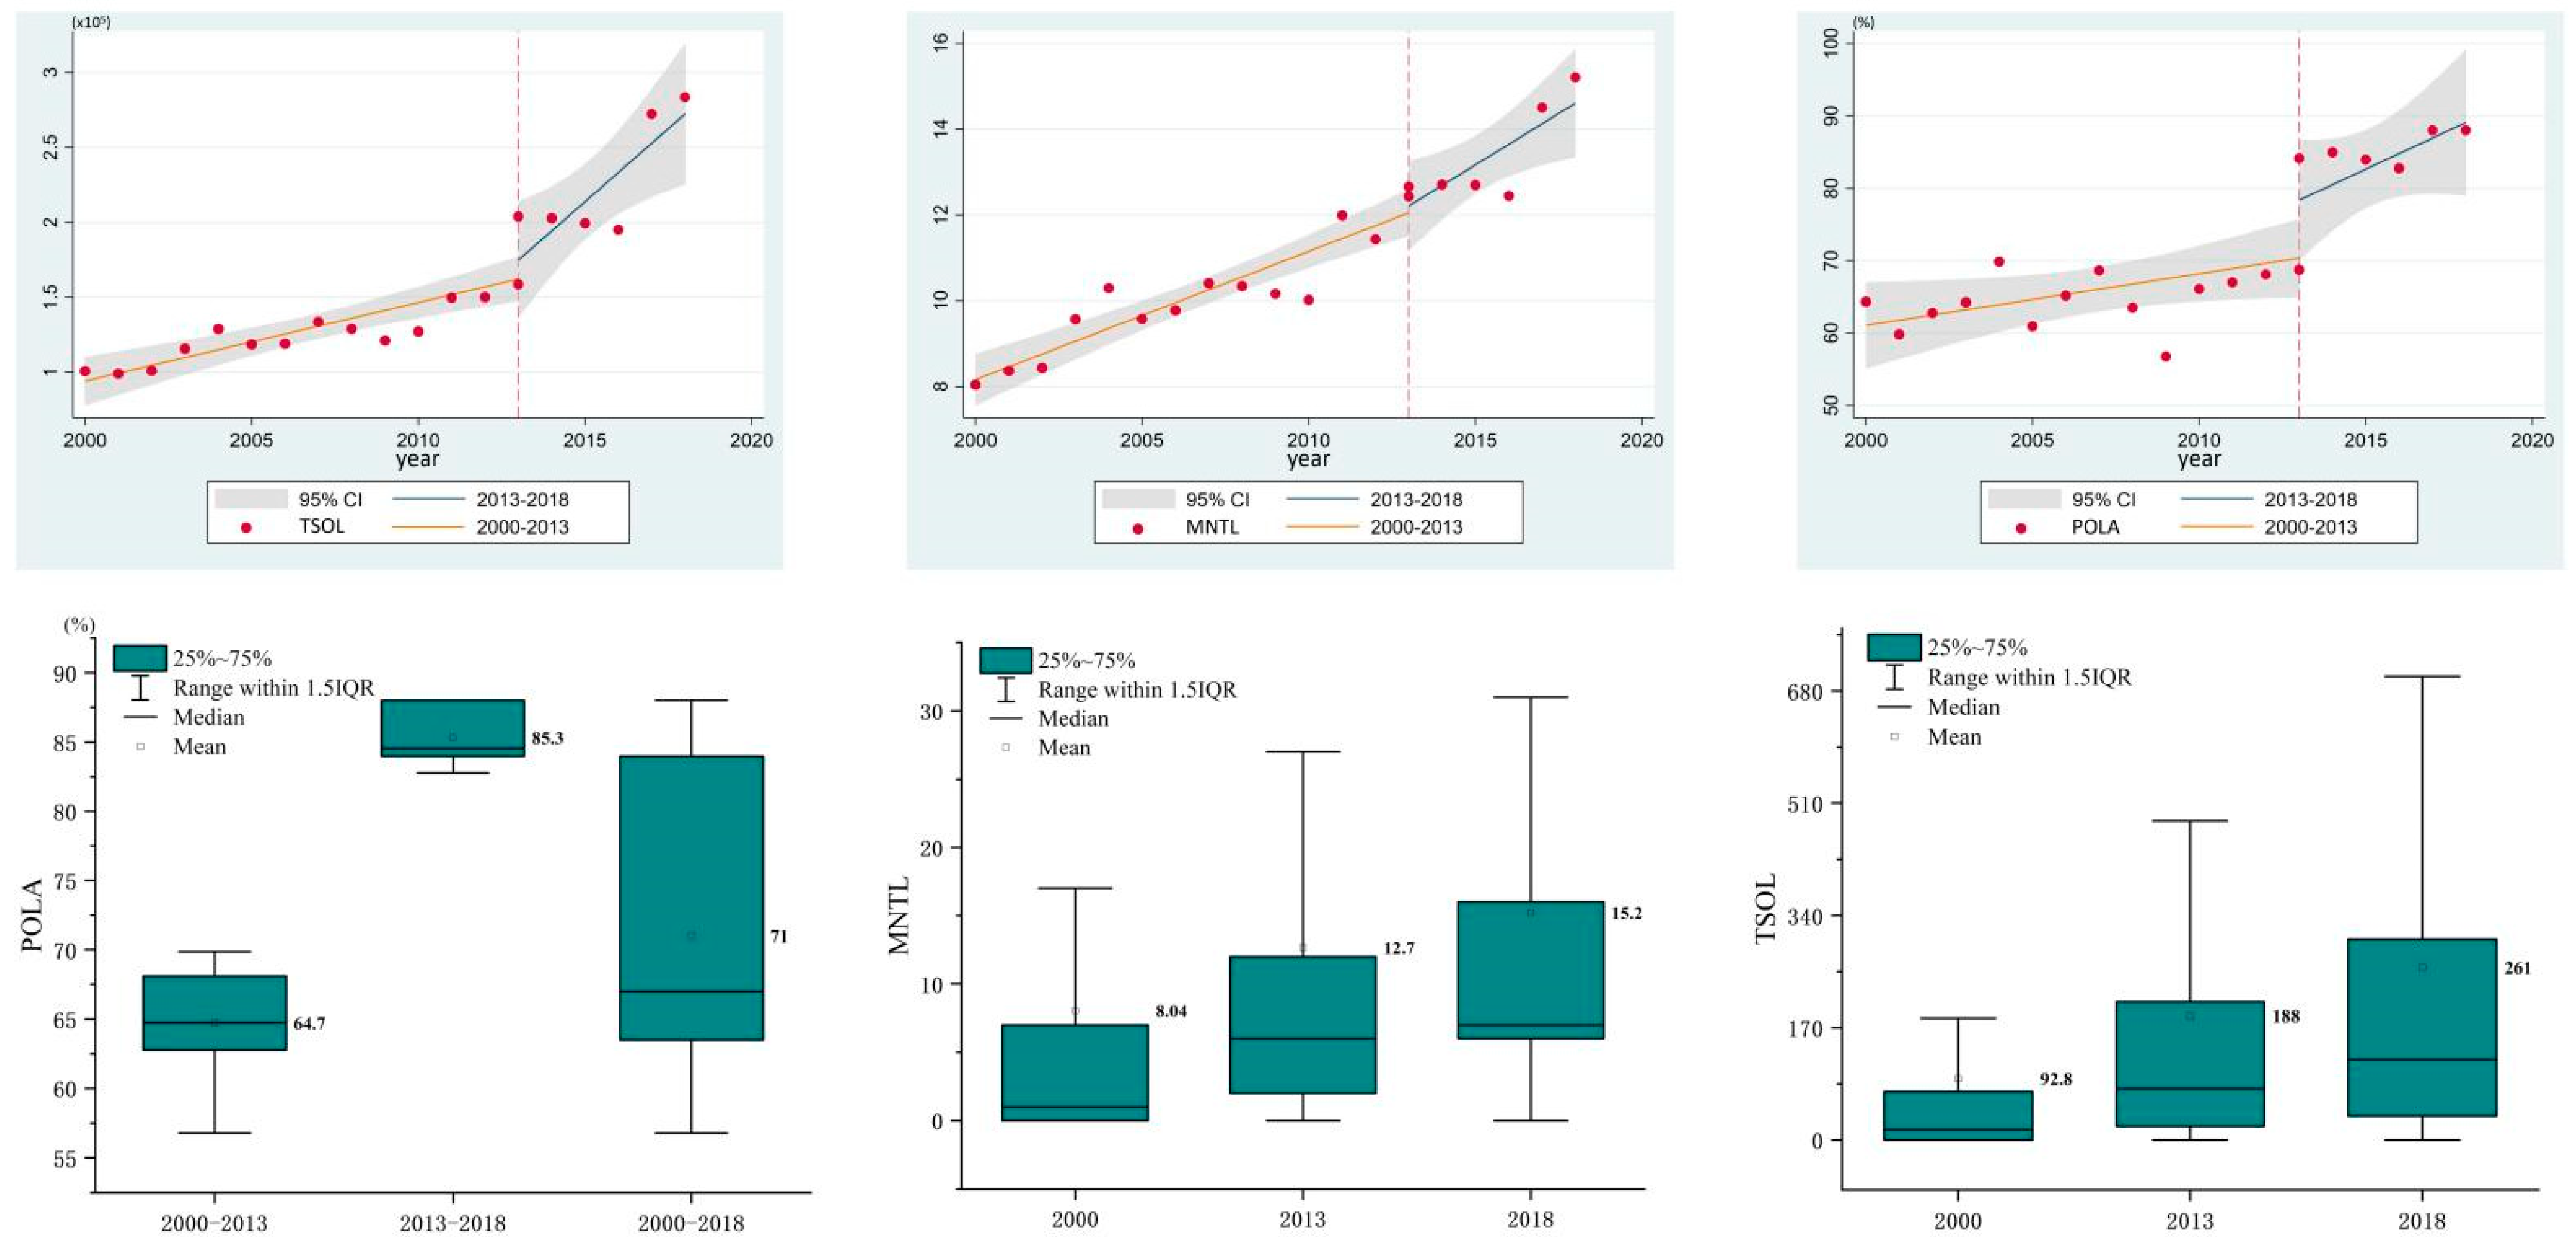
3.1. Temporal Trend of NTL within PAs
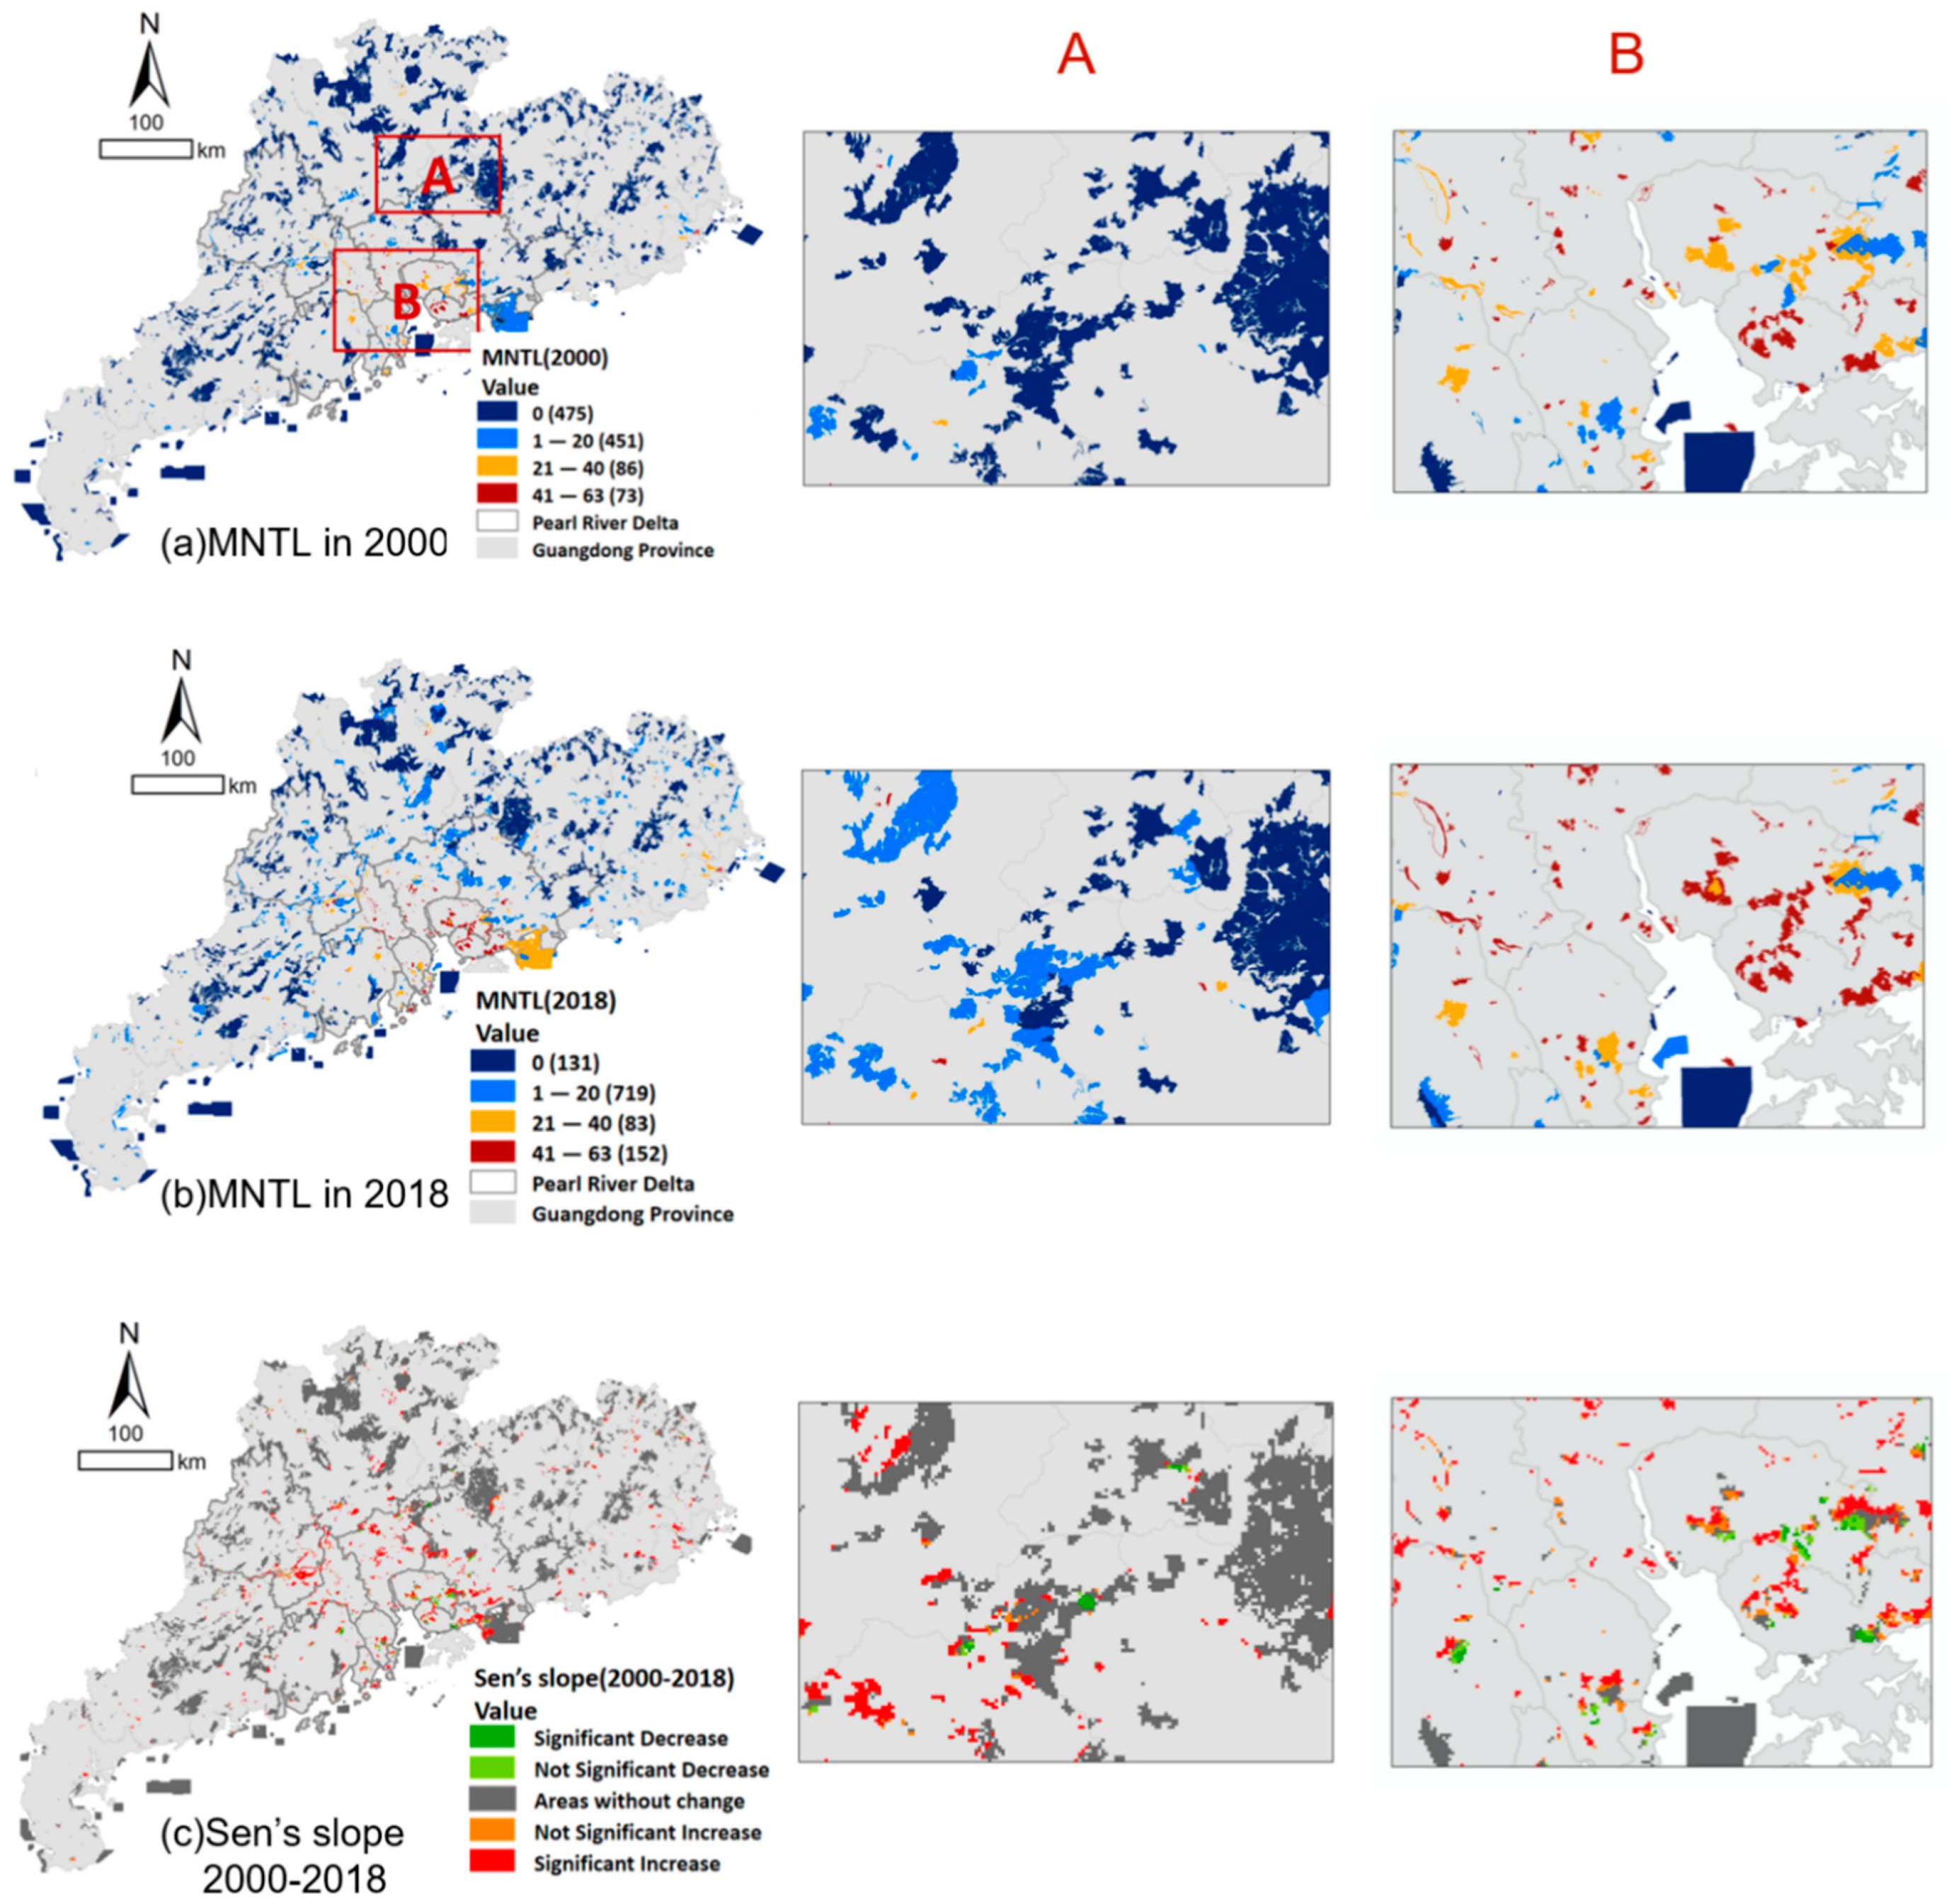
3.2. Spatial Dynamics of NTL within PAs
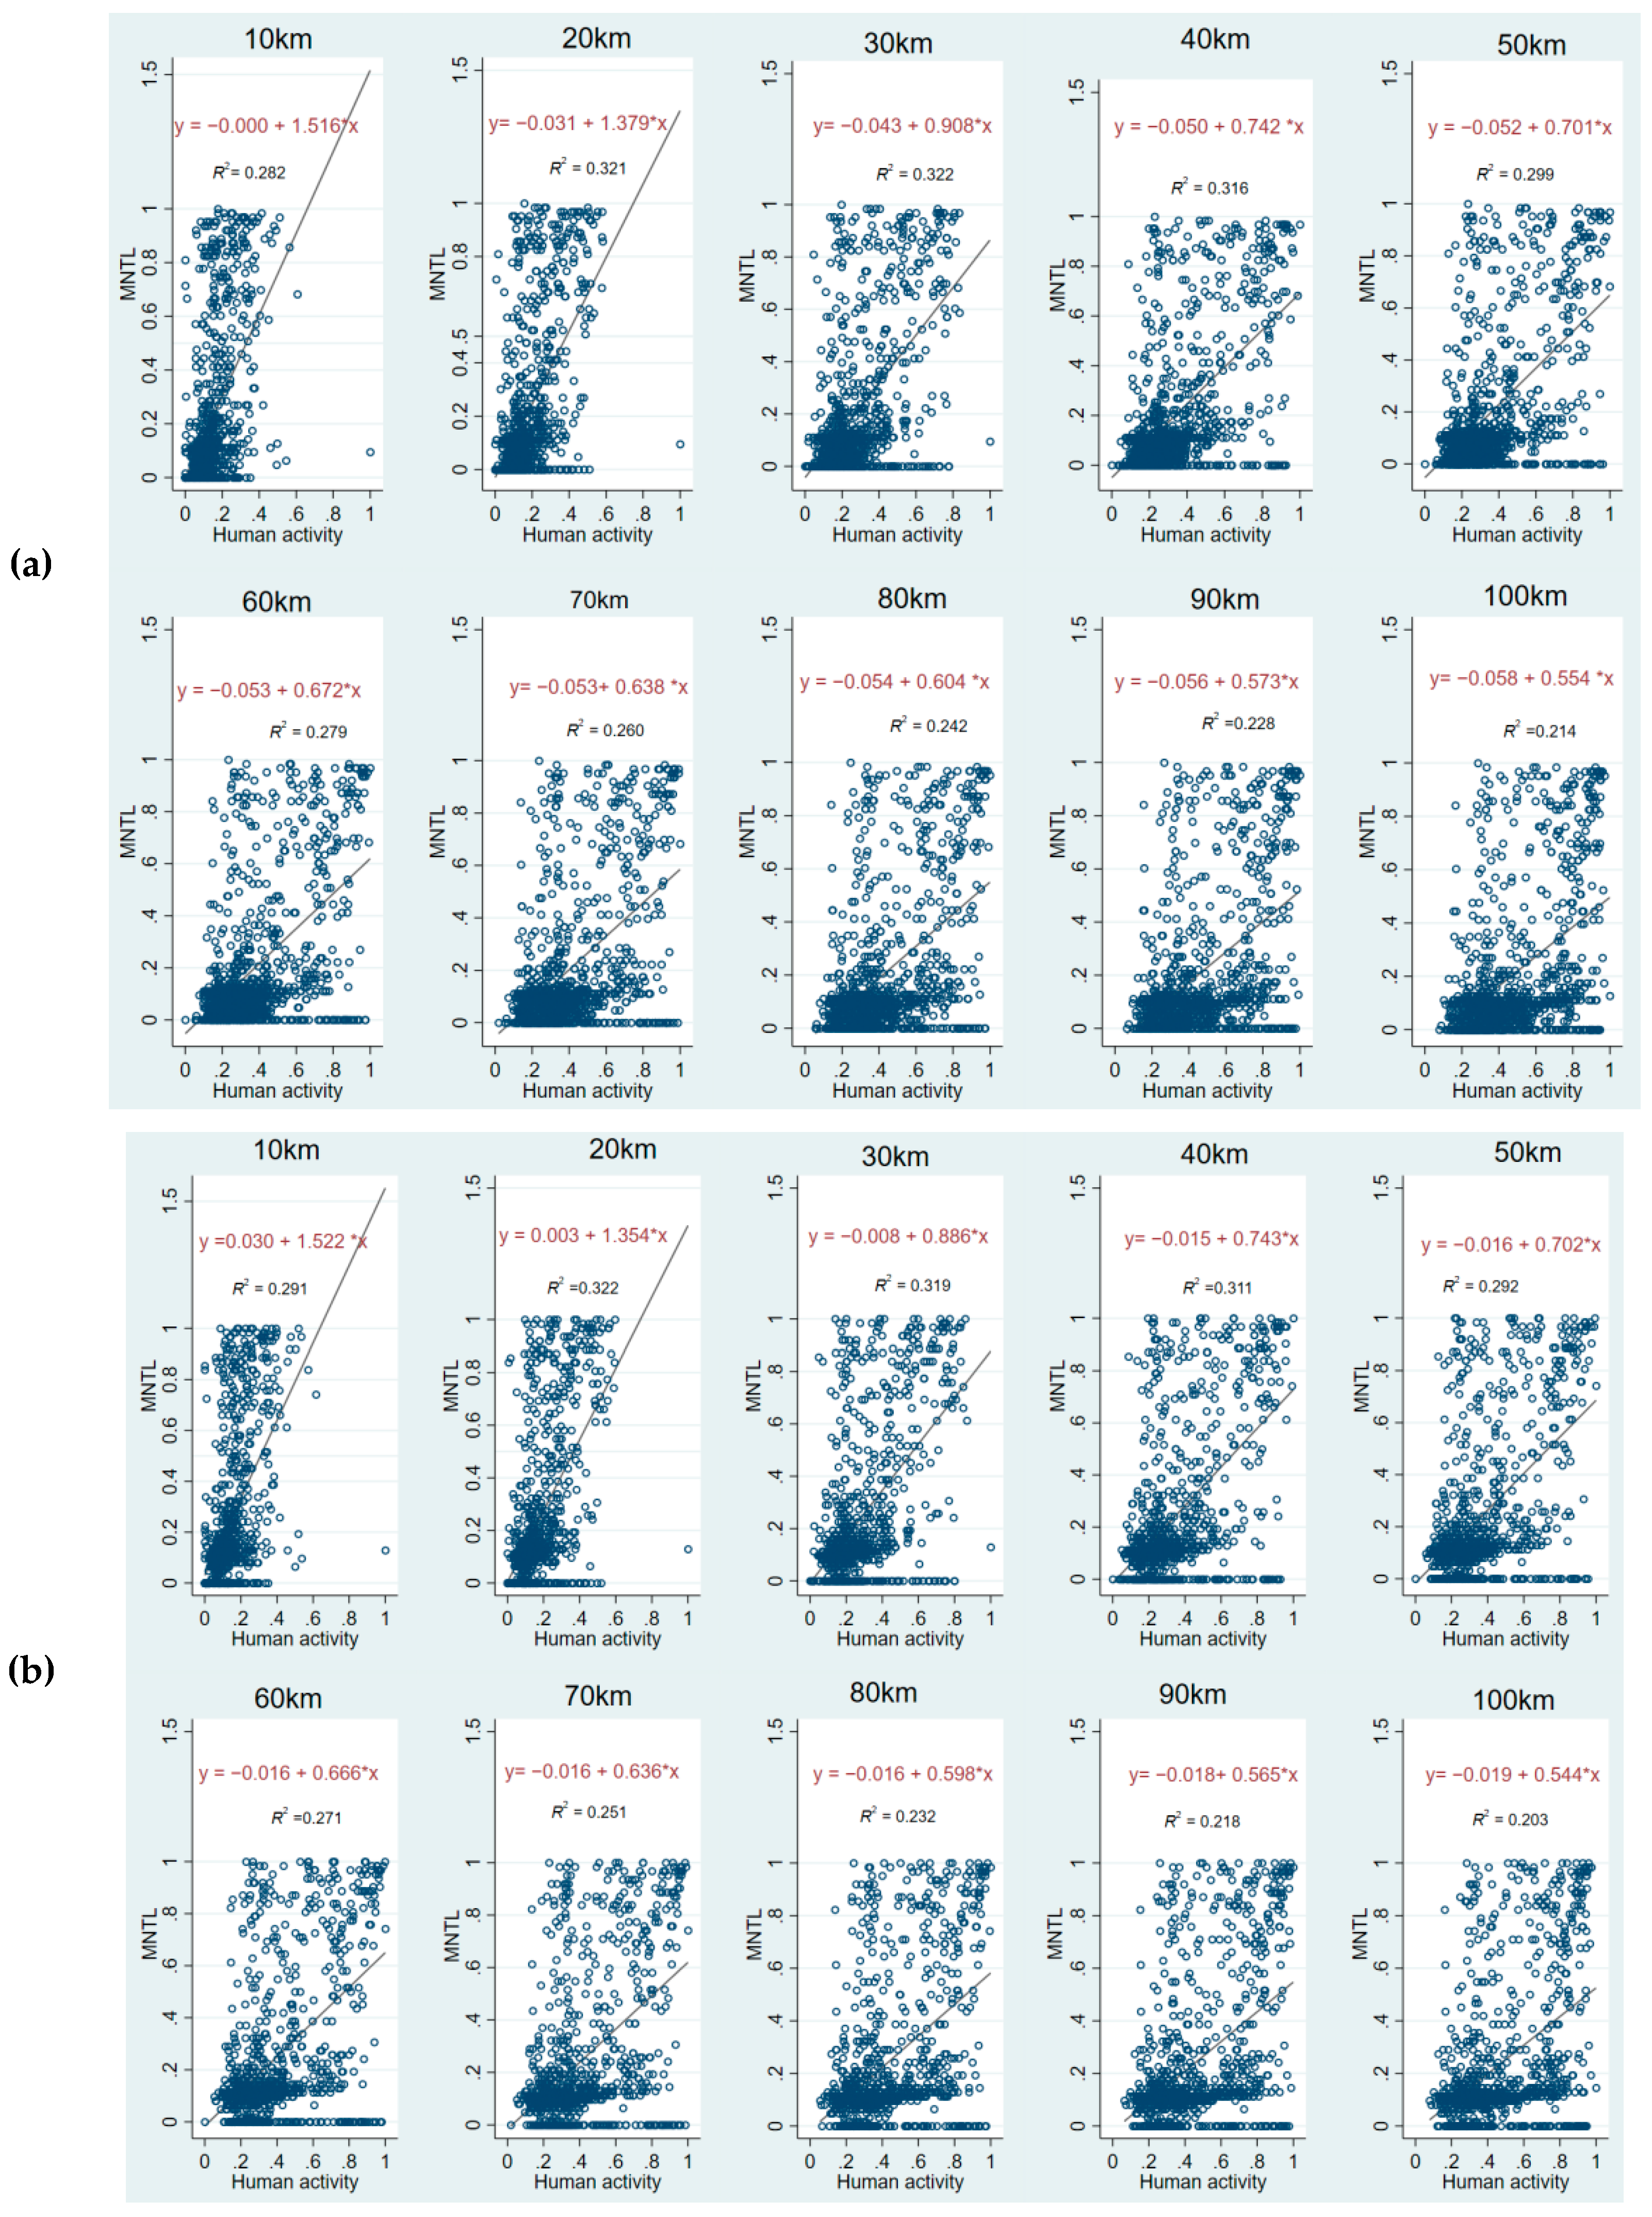
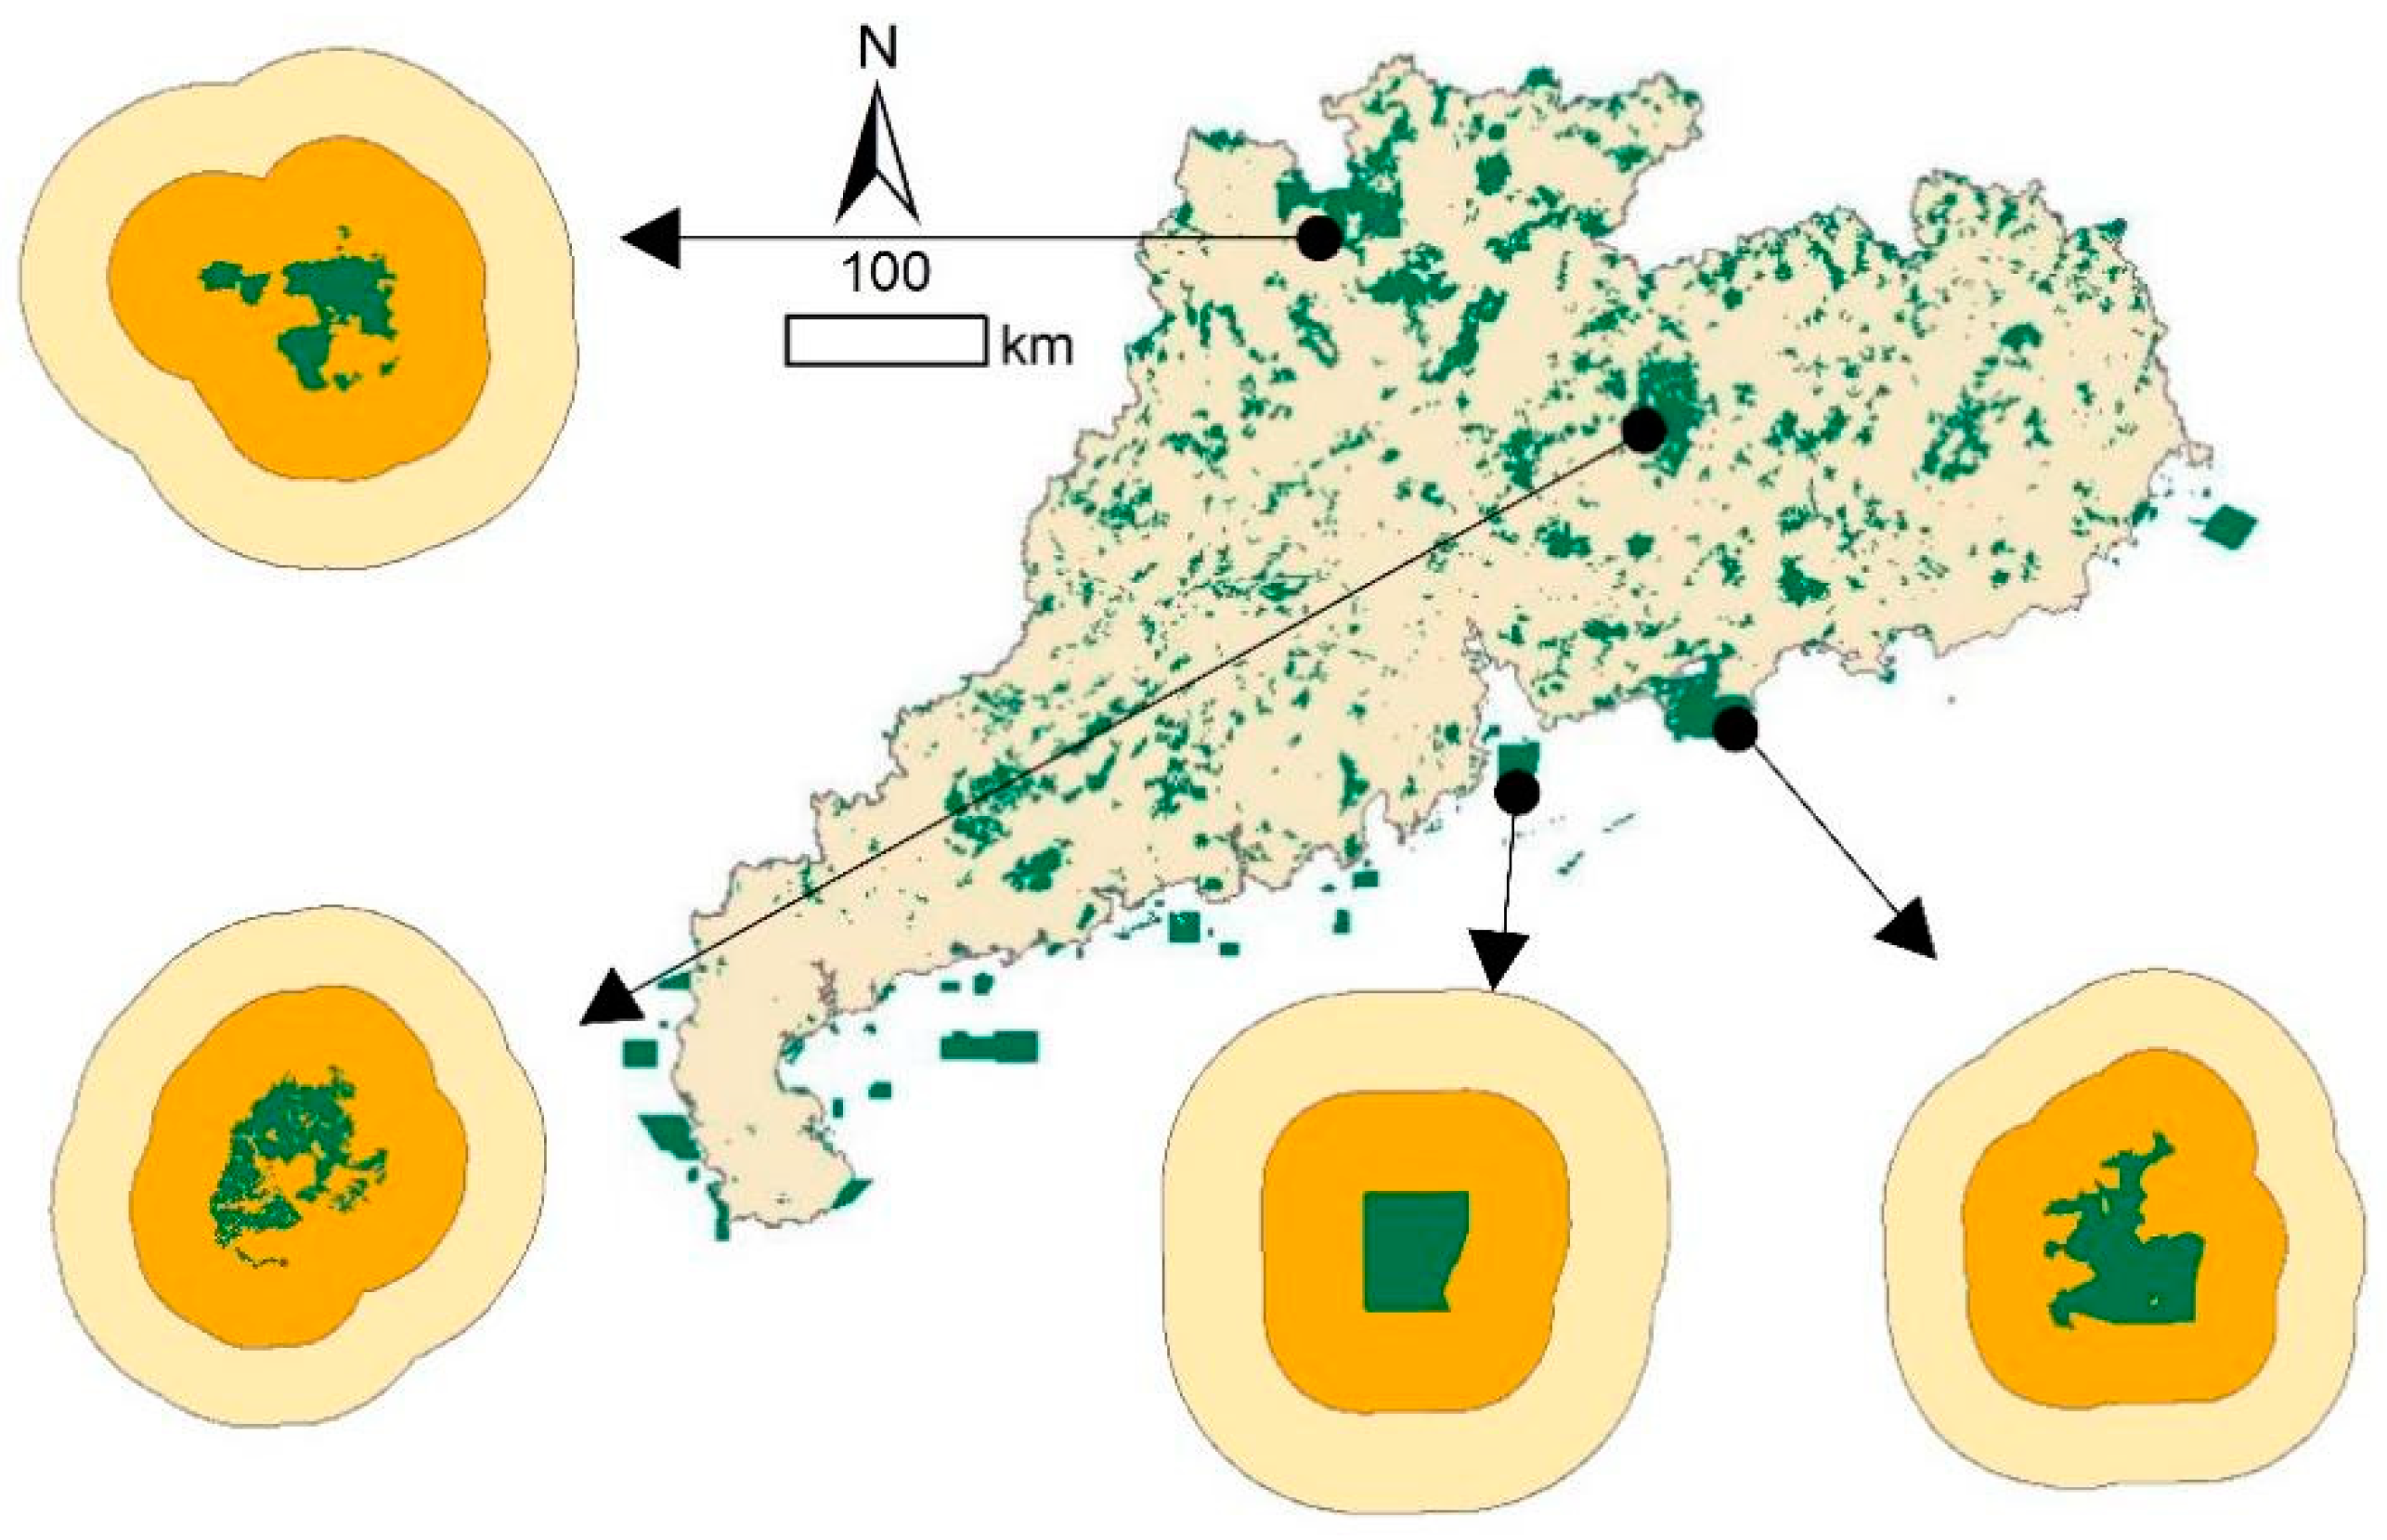
3.3. Correlation and Sensitive Distance Analysis
4. Discussion
4.1. Set up External NTL Governance Zones
4.2. Adopt Differentiated Protection Measures
4.3. Limitation and Further Study
5. Conclusions
Author Contributions
Funding
Institutional Review Board Statement
Informed Consent Statement
Data Availability Statement
Acknowledgments
Conflicts of Interest
References
- Hölker, F.; Moss, T.; Griefahn, B.; Kloas, W.; Voigt, C.C.; Henckel, D.; Hänel, A.; Kappeler, P.M.; Völker, S.; Schwope, A. The dark side of light: A transdisciplinary research agenda for light pollution policy. Ecol. Soc. 2010, 15, 65–72. [Google Scholar] [CrossRef]
- Longcore, T.; Rich, C. Ecological light pollution. Front. Ecol. Environ. 2004, 2, 191–198. [Google Scholar] [CrossRef]
- Gaston, K.J.; Bennie, J.; Davies, T.W.; Hopkins, J. The ecological impacts of nighttime light pollution: A mechanistic appraisal. Biol. Rev. 2013, 88, 912–927. [Google Scholar] [CrossRef] [PubMed]
- Gaston, K.J.; Bennie, J. Demographic effects of artificial nighttime lighting on animal populations. Environ. Rev. 2014, 22, 323–330. [Google Scholar] [CrossRef]
- Bennie, J.; Duffy, J.P.; Davies, T.W.; Correa-Cano, M.E.; Gaston, K.J. Global trends in exposure to light pollution in natural terrestrial ecosystems. Remote Sens. 2015, 7, 2715–2730. [Google Scholar] [CrossRef] [Green Version]
- Knop, E.; Zoller, L.; Ryser, R.; Gerpe, C.; Hörler, M.; Fontaine, C. Artificial light at night as a new threat to pollination. Nature 2017, 548, 206–209. [Google Scholar] [CrossRef]
- Small, C.; Elvidge, C.D. Night on Earth: Mapping decadal changes of anthropogenic night light in Asia. Int. J. Appl. Earth Obs. Geoinf. 2013, 22, 40–52. [Google Scholar] [CrossRef] [Green Version]
- Andrade-Núñez, M.J.; Aide, T.M. Using nighttime lights to assess infrastructure expansion within and around protected areas in South America. Environ. Res. Commun. 2020, 2, 021002. [Google Scholar] [CrossRef]
- Zheng, Z.; Wu, Z.; Chen, Y.; Guo, G.; Cao, Z.; Yang, Z.; Marinello, F. Africa’s protected areas are brightening at night: A long-term light pollution monitor based on nighttime light imagery. Glob. Environ. Change 2021, 69, 102318. [Google Scholar] [CrossRef]
- Davies, T.W.; Duffy, J.P.; Bennie, J.; Gaston, K.J. The nature, extent, and ecological implications of marine light pollution. Front. Ecol. Environ. 2014, 12, 347–355. [Google Scholar] [CrossRef]
- Davies, T.W.; Duffy, J.P.; Bennie, J.; Gaston, K.J. Stemming the tide of light pollution encroaching into marine protected areas. Conserv. Lett. 2016, 9, 164–171. [Google Scholar] [CrossRef] [Green Version]
- Sung, C.Y. Light pollution as an ecological edge effect: Landscape ecological analysis of light pollution in protected areas in Korea. J. Nat. Conserv. 2022, 66, 126148. [Google Scholar] [CrossRef]
- Falchi, F.; Cinzano, P.; Duriscoe, D.; Kyba, C.C.; Elvidge, C.D.; Baugh, K.; Portnov, B.A.; Rybnikova, N.A.; Furgoni, R. The new world atlas of artificial night sky brightness. Sci. Adv. 2016, 2, e1600377. [Google Scholar] [CrossRef] [Green Version]
- Gaston, K.J.; Duffy, J.P.; Bennie, J. Quantifying the erosion of natural darkness in the global protected area system. Conserv. Biol. 2015, 29, 1132–1141. [Google Scholar] [CrossRef]
- Xiang, W.; Tan, M. Changes in light pollution and the causing factors in china’s protected areas, 1992–2012. Remote Sens. 2017, 9, 1026. [Google Scholar] [CrossRef] [Green Version]
- Akodewou, A.; Oszwald, J.; Saidi, S.; Gazull, L.; Akpavi, S.; Akpagana, K.; Gond, V. Land Use and Land Cover Dynamics Analysis of the Togodo Protected Area and Its Surroundings in Southeastern Togo, West Africa. Sustainability 2020, 12, 5439. [Google Scholar] [CrossRef]
- Dimobe, K.; Goetze, D.; Ouédraogo, A.; Forkuor, G.; Wala, K.; Porembski, S.; Thiombiano, A. Spatio-Temporal Dynamics in Land Use and Habitat Fragmentation within a Protected Area Dedicated to Tourism in a Sudanian Savanna of West Africa. J. Landsc. Ecol. 2017, 10, 7–95. [Google Scholar] [CrossRef] [Green Version]
- Riggio, J.; Jacobson, A.P.; Hijmans, R.J.; Caro, T. How effective are the protected areas of East Africa? Glob. Ecol. Conserv. 2019, 17, e00573. [Google Scholar] [CrossRef]
- Green, D.S.; Zipkin, E.F.; Incorvaia, D.C.; Holekamp, K.E. Long-term ecological changes influence herbivore diversity and abundance inside a protected area in the Mara-Serengeti ecosystem. Glob. Ecol. Conserv. 2019, 20, e00697. [Google Scholar] [CrossRef]
- Shi, K.F.; Huang, C.; Chen, Y.; Li, L.Y. Remotely sensed nighttime lights reveal increasing human activities in protected areas of China mainland. Remote Sens. Lett. 2018, 9, 468–477. [Google Scholar] [CrossRef]
- Wei, Y.; Chen, Z.Q.; Xiu, C.L.; Yu, B.L.; Liu, H.X. Siting of Dark Sky Reserves in China Based on Multi-source Spatial Data and Multiple Criteria Evaluation Method. Chin. Geogr. Sci. 2019, 29, 949–961. [Google Scholar] [CrossRef] [Green Version]
- Xu, P.; Wang, Q.; Jin, J.; Jin, P. An increase in nighttime light detected for protected areas in mainland China based on VIIRS DNB data. Ecol. Indic. 2019, 107, 105615. [Google Scholar] [CrossRef]
- Chen, Y.; Zheng, Z.; Zhifeng, W.U.; Qian, Q. Review and prospect of application of nighttime light Remote Sensing data. Prog. Geogr. 2019, 38, 205–223. [Google Scholar]
- Liu, Z.; Ma, W.; Lin, C.; Liu, Y.; Liu, C.; Jiang, Y.; Yang, Y.; Su, Y. Spatial Distribution Planning and System Construction of the Natural Protected Areas in Guangdong Province. Nat. Prot. Areas 2021, 1, 55–64. [Google Scholar] [CrossRef]
- He, K. Study on the Spatial Distribution Characteristics and Construction of Protected Areas in Guangdong Province; Guangzhou University: Guangzhou, China, 2022. [Google Scholar]
- Cao, W.; Huang, L.; Xiao, T.; Wu, D. Effects of human activities on the ecosystems of China’s National Nature Reserves. Acta Ecol. Sin. 2019, 39, 1338–1350. [Google Scholar]
- Yang, H.-T.; Xu, H.-Q. Assessing fractional vegetation cover changes and ecological quality of the Wuyi Mountain National Nature Reserve based on Remote Sens.spatial information. Ying yong sheng tai xue bao = J. Appl. Ecol. 2020, 31, 533–542. [Google Scholar] [CrossRef]
- Baugh, K.; Elvidge, C.D.; Ghosh, T.; Ziskin, D. Development of a 2009 Stable Lights Product using DMSP-OLS data. Proc. Asia-Pac. Adv. Netw. 2010, 30, 114. [Google Scholar] [CrossRef]
- Elvidge, C.D.; Baugh, K.E.; Zhizhin, M.; Hsu, F.C. Why VIIRS data are superior to DMSP for mapping nighttime lights. Proc. Asia Pac. Adv. Netw. 2013, 35, 62. [Google Scholar] [CrossRef] [Green Version]
- Liang, C.K.; Mills, S.; Hauss, B.I.; Miller, S.D. Improved VIIRS Day/Night Band Imagery with Near-Constant Contrast. IEEE Trans. Geosci. Remote Sens. 2014, 52, 6964–6971. [Google Scholar] [CrossRef]
- Liao, L.B.; Weiss, S.; Mills, S.; Hauss, B. Suomi NPP VIIRS day-night band on-orbit performance. J. Geophys. Res.-Atmos. 2013, 118, 12705–12718. [Google Scholar] [CrossRef]
- Miller, S.D.; Straka, W.; Mills, S.P.; Elvidge, C.D.; Lee, T.F.; Solbrig, J.; Walther, A.; Heidinger, A.K.; Weiss, S.C. Illuminating the Capabilities of the Suomi National Polar-Orbiting Partnership (NPP) Visible Infrared Imaging Radiometer Suite (VIIRS) Day/Night Band. Remote Sens. 2013, 5, 6717–6766. [Google Scholar] [CrossRef] [Green Version]
- Zheng, Q.; Weng, Q.; Wang, K. Developing a new cross-sensor calibration model for DMSP-OLS and Suomi-NPP VIIRS night-light imageries. ISPRS J. Photogramm. Remote Sens. 2019, 153, 36–47. [Google Scholar] [CrossRef]
- Hu, Y.; Chen, J.; Cao, X.; Chen, X.; Cui, X.; Gan, L. Correcting the saturation effect in dmsp/ols stable nighttime light products based on radiance-calibrated data. IEEE Trans. Geosci. Remote Sens. 2021, 60, 1–11. [Google Scholar] [CrossRef]
- Zheng, Z.; Yang, Z.; Chen, Y.; Wu, Z.; Marinello, F. The Interannual Calibration and Global Nighttime Light Fluctuation Assessment Based on Pixel-Level Linear Regression Analysis. Remote Sens. 2019, 11, 2185. [Google Scholar] [CrossRef] [Green Version]
- Li, X.; Zhou, Y.; Zhao, M.; Zhao, X. A harmonized global nighttime light dataset 1992–2018. Sci. Data 2020, 7, 1–9. [Google Scholar] [CrossRef]
- Chen, Z.; Yu, B.; Yang, C.; Zhou, Y.; Yao, S.; Qian, X.; Wang, C.; Wu, B.; Wu, J. An extended time series (2000–2018) of global NPP-VIIRS-like nighttime light data from a cross-sensor calibration. Earth Syst. Sci. Data 2021, 13, 889–906. [Google Scholar] [CrossRef]
- Yang, J.; Huang, X. The 30 m annual land cover dataset and its dynamics in China from 1990 to 2019. Earth Syst. Sci. Data 2021, 13, 3907–3925. [Google Scholar] [CrossRef]
- Tucker, C.; Newcomb, W.; Los, S.; Prince, S. Mean and inter-year variation of growing-season normalized difference vegetation index for the Sahel 1981–1989. Int. J. Remote Sens. 1991, 12, 1133–1135. [Google Scholar] [CrossRef]
- Liu, Z.; Wang, Y.; Yao, Z.; Kang, H. Trend and periodicity of precipitation, air temperature and runoff in the Taihu Lake Basin. J. Nat. Resour. 2011, 26, 1575–1584. [Google Scholar]
- Kyba, C.C.; Kuester, T.; Sánchez de Miguel, A.; Baugh, K.; Jechow, A.; Hölker, F.; Bennie, J.; Elvidge, C.D.; Gaston, K.J.; Guanter, L. Artificially lit surface of Earth at night increasing in radiance and extent. Sci. Adv. 2017, 3, e1701528. [Google Scholar] [CrossRef] [Green Version]
- Guangdong Province Governmant. Territorial Planning of Guangdong Province 2020–2035; Guangdong Province Government, Ed.; Guangdong Province Government: Guangzhou, China, 2019.
- Jenkins, C.N.; Joppa, L. Expansion of the global terrestrial protected area system. Biol. Conserv. 2009, 142, 2166–2174. [Google Scholar] [CrossRef]
- Pimm, S.L.; Jenkins, C.N.; Abell, R.; Brooks, T.M.; Gittleman, J.L.; Joppa, L.N.; Raven, P.H.; Roberts, C.M.; Sexton, J.O. The biodiversity of species and their rates of extinction, distribution, and protection. Science 2014, 344, 1246752. [Google Scholar] [CrossRef] [PubMed]
- WDPA. Protected Areas (WDPA). Available online: https://www.protectedplanet.net/en/thematic-areas/wdpa?tab=WDPA (accessed on 8 August 2022).
- Geneletti, D.; van Duren, I. Protected area zoning for conservation and use: A combination of spatial multicriteria and multiobjective evaluation. Landsc. Urban Plan. 2008, 85, 97–110. [Google Scholar] [CrossRef]
- Hull, V.; Xu, W.; Liu, W.; Zhou, S.; Viña, A.; Zhang, J.; Tuanmu, M.-N.; Huang, J.; Linderman, M.; Chen, X. Evaluating the efficacy of zoning designations for protected area management. Biol. Conserv. 2011, 144, 3028–3037. [Google Scholar] [CrossRef]
- Xu, W.; Li, X.; Pimm, S.L.; Hull, V.; Zhang, J.; Zhang, L.; Xiao, Y.; Zheng, H.; Ouyang, Z. The effectiveness of the zoning of China’s protected areas. Biol. Conserv. 2016, 204, 231–236. [Google Scholar] [CrossRef]
- Rajkhowa, R. Light pollution and impact of light pollution. Int. J. Sci. Res. (IJSR) 2014, 3, 861–867. [Google Scholar]


| PA Types | Number | Proportion (%) | Area (km2) | Area Proportion (%) |
|---|---|---|---|---|
| Geo Park | 14 | 1.3 | 835 | 2.8 |
| Scenic Resort | 22 | 2.0 | 710 | 2.3 |
| Sea Park | 12 | 1.1 | 530 | 1.7 |
| Forest Park | 611 | 56.3 | 11,155 | 36.8 |
| Wetland Park | 172 | 15.9 | 1408 | 4.6 |
| Rocky Desert Park | 3 | 0.3 | 128 | 0.4 |
| Nature Reserve | 251 | 23.1 | 15,586 | 51.4 |
| Total | 1085 | 100.0 | 30,351 | 100.0 |
| Dataset | Spatial Resolution | Temporal Resolution | Data Available | Access Link |
|---|---|---|---|---|
| NTL data | 30 arc-seconds (around 1000 m) | Annual | 2000–2018 | https://figshare.com/articles/dataset/Harmonization_of_DMSP_and_VIIRS_nighttime_light_data_from_1992-2018_at_the_global_scale/9828827/2 (accessed on 8 August 2022) [36] |
| Land-use data | 30 m | Annual | 2013, 2017 | https://zenodo.org/record/5210928#.YtgZf8g17qE (accessed on 8 August 2022) [38] |
| POI data | Vector data | Annual | 2012, 2017 | Amap |
| Dynamics | Count | Proportion (%) | |||
|---|---|---|---|---|---|
| NTL decrease | 29 | 2.67 | |||
| NTL with no change | 156 | 14.38 | |||
| NTL increase | Primary pollution | 319 | 900 | 29.4 | 82.95 |
| Secondary pollution | 581 | 53.55 | |||
| (a) Regression Results of 2013 | ||||||||||
|---|---|---|---|---|---|---|---|---|---|---|
| 10 km | 20 km | 30 km | 40 km | 50 km | 60 km | 70 km | 80 km | 90 km | 100 km | |
| Model (1) | Model (2) | Model (3) | Model (4) | Model (5) | Model (6) | Model (7) | Model (8) | Model (9) | Model (10) | |
| Human activity | 1.52 ** (0.073) | 1.38 ** (0.061) | 0.91 ** (0.040) | 0.74 ** (0.033) | 0.70 ** (0.033) | 0.67 ** (0.033) | 0.64 ** (0.033) | 0.60 ** (0.032) | 0.57 ** (0.032) | 0.55 ** (0.032) |
| Constant | −0.000 (0.012) | −0.031 * (0.012) | −0.043 ** (0.013) | −0.050 ** (0.013) | −0.052 ** (0.014) | −0.053 ** (0.014) | −0.053 ** (0.015) | −0.054 ** (0.015) | −0.056 ** (0.016) | −0.058 ** (0.017) |
| Observations | 1085 | 1085 | 1085 | 1085 | 1085 | 1085 | 1085 | 1085 | 1085 | 1085 |
| R2 | 0.28 | 0.32 | 0.32 | 0.32 | 0.30 | 0.28 | 0.26 | 0.24 | 0.23 | 0.21 |
| (b) Regression results of 2017 | ||||||||||
| 10 km | 20 km | 30 km | 40 km | 50 km | 60 km | 70 km | 80 km | 90 km | 100 km | |
| Model (1) | Model (2) | Model (3) | Model (4) | Model (5) | Model (6) | Model (7) | Model (8) | Model (9) | Model (10) | |
| Human activity | 1.52 ** (0.072) | 1.35 ** (0.060) | 0.89 ** (0.039) | 0.74 ** (0.034) | 0.70 ** (0.033) | 0.67 ** (0.033) | 0.64 ** (0.033) | 0.60 ** (0.033) | 0.57 ** (0.033) | 0.54 ** (0.033) |
| Constant | 0.030 * (0.012) | 0.003 (0.012) | −0.008 (0.013) | −0.015 (0.013) | −0.016 (0.014) | −0.016 (0.014) | −0.016 (0.015) | −0.016 (0.016) | −0.018 (0.016) | −0.019 (0.017) |
| Observations | 1085 | 1085 | 1085 | 1085 | 1085 | 1085 | 1085 | 1085 | 1085 | 1085 |
| R2 | 0.29 | 0.32 | 0.32 | 0.31 | 0.29 | 0.27 | 0.25 | 0.23 | 0.22 | 0.20 |
Publisher’s Note: MDPI stays neutral with regard to jurisdictional claims in published maps and institutional affiliations. |
© 2022 by the authors. Licensee MDPI, Basel, Switzerland. This article is an open access article distributed under the terms and conditions of the Creative Commons Attribution (CC BY) license (https://creativecommons.org/licenses/by/4.0/).
Share and Cite
Jiang, B.; Li, S.; Li, J.; Zhang, Y.; Zheng, Z. Spatio-Temporal Dynamics and Sensitive Distance Identification of Light Pollution in Protected Areas Based on Muti-Source Data: A Case Study of Guangdong Province, China. Int. J. Environ. Res. Public Health 2022, 19, 12662. https://doi.org/10.3390/ijerph191912662
Jiang B, Li S, Li J, Zhang Y, Zheng Z. Spatio-Temporal Dynamics and Sensitive Distance Identification of Light Pollution in Protected Areas Based on Muti-Source Data: A Case Study of Guangdong Province, China. International Journal of Environmental Research and Public Health. 2022; 19(19):12662. https://doi.org/10.3390/ijerph191912662
Chicago/Turabian StyleJiang, Benyan, Shan Li, Jianjun Li, Yuli Zhang, and Zihao Zheng. 2022. "Spatio-Temporal Dynamics and Sensitive Distance Identification of Light Pollution in Protected Areas Based on Muti-Source Data: A Case Study of Guangdong Province, China" International Journal of Environmental Research and Public Health 19, no. 19: 12662. https://doi.org/10.3390/ijerph191912662