1. Introduction
China’s dual land ownership system that divides urban and rural areas has allowed local governments to monopolize land supply in the primary land market. Local governments can acquire agricultural land for large-scale development and transfer it at lower prices. Then, local governments use the low transfer price of industrial land as an effective means to attract an inflow of investment. In addition, local governments provide commercial and residential land at higher prices to compensate for the lack of local government financial resources by obtaining high land transfer revenue. This double second-hand land supply strategy fully utilizes the land’s economic value and facilitates China’s regional economy [
1]. However, it has also significantly damaged the regional ecological environment (EEQ) through pathways such as strengthening extensive economic growth, inhibiting industrial structure upgrading and hindering technological innovation [
2]. According to
the Chinese Ecology and Environment Status Bulletin, 53.4% of 337 Chinese cities did not meet the annual air quality standard in 2019. Numerous studies have shown that China’s long-term non-market-based land transfer has caused unreasonable industrial land planning, inefficient land use and backward industrial structure. Thus, this has a direct negative impact on regional air pollution [
2,
3,
4].
In 2015, the Chinese central government issued the
Opinions on the Pilot Work of Rural Land Acquisition. The market entry of rural collective operating construction land (MERCOCL) and the Homestead System reform were introduced into pilot implementation. Particularly, the MMERCOCL reform has broken the monopoly of the pilot local government on the primary land market and thus allowed the price mechanism to allocate land resources. It is regarded as an important measure for the Chinese government to promote rural land marketization and for the Chinese central government to reduce land market distortions, improve land use efficiency and upgrade regional industrial structure [
5,
6,
7]. Research in related fields shows that with the reduction in regional land market distortion, regional pollution-intensive industry entry [
8] and air pollution [
2] are significantly reduced. With the improvement of regional land use efficiency and industrial structure transformation and upgrading, regional energy conservation, emission reduction and air pollution control are effectively improved [
2,
9]. Therefore, as an important part of the rural land marketization reform, MERCOCL also impacts regional environmental quality.
In this paper, MERCOCL was used as an important indicator to measure China’s rural land marketization. Then, the ecological environmental effects of China’s rural land marketization were analyzed. Based on the Landsat 5/8 satellite and national ecological index (EI), a general regional EEQ assessment model in China was constructed to objectively evaluate the EEQ of 32 experimental areas and their neighboring counties. This paper addresses the following major issues: (1) What are the spatio-temporal differences in EEQ in the reform pilot areas? (2) Will MERCOCL improve China’s EEQ? (3) If MERCOCL positively impacts EEQ, what is the driving mechanism for MERCOCL to improve EEQ? (4) Considering the complexity of MERCOCL, is there any spatial heterogeneity in the impact of MERCOCL on EEQ? This study is of great significance in China’s efforts to promote market-oriented allocation of land factors and continuous pollution control.
This paper is organized as follows: following the Introduction,
Section 2 is the literature review;
Section 3 is the theoretical mechanism analysis;
Section 4 presents the measurement method and data sources;
Section 5 demonstrates the research results;
Section 6 presents the conclusions.
2. Literature Review
Many studies have been focused on the MMERCOCL in China. Firstly, many scholars have focused on the necessity and importance of the MMERCOCL reform. For example, Guo et al. (2015) regarded the reform as an important means to promote land marketization in China [
10]. It effectively broke the monopoly of local governments on land management rights and promoted the equality and integration of urban and rural construction land rights [
11]. Gao et al. (2020) took it as an important strategic measure of rural industrial transformation and upgrading. Secondly [
5], some scholars have focused on the barriers broken by MERCOCL. For example, through a principal–agent model, Yan et al. (2021) found that a reasonable and optimized benefit distribution mechanism was an important guarantee for promoting the reform [
12]. Wang (2022) analyzed the interview data from five pilot regions and showed that effective coordination of the short-term interests of farmers and the long-term interests of rural collectives was crucial to the reform [
13]. Finally, with the further promotion of MERCOCL, an increasing number of scholars have started to show their concerns about the effects of MERCOCL. For example, Wen et al. (2022) found that MERCOCL effectively alleviated local construction land shortages by analyzing the pilot projects in Deqing County of Zhejiang Province and Nanhai District of Guangdong Province [
14]. Tian et al. (2020) studied the reform in four first-tier cities in China [
15]. Wen et al. (2020) explored the MERCOCL reform in the Nanhai District of Guangdong Province and found that the MERCOCL reform was ineffective in reducing local house and land prices due to local government revenue pressure [
16]. Based on a case study in Deqing, Zhejiang Province, Wang and Tan (2020) found that it effectively improved the local land allocation efficiency and directly raised farmers’ income levels [
17]. Various studies on MERCOCL have focused on status-quo discussions and case-based empirical analysis. Large-sample quantitative empirical studies have been rarely conducted. In addition, existing studies on the impact of the reform are still limited to conventional aspects such as land and income. However, few studies have examined the impact of MERCOCL on regional ecology.
In terms of the impact of land use on EEQ, existing studies have been carried out from three aspects. Firstly, many scholars have used the comprehensive econometric regression model and the land-use regression model proposed using the GIS technology of Briggs et al. (1997) to predict and analyze the distribution of environmental pollution at the urban scale [
18]. For example, previous studies on the distribution of urban environmental pollution show that the planning of urban land use has an important influence on environmental pollution [
19,
20,
21,
22]. Secondly, the effects of different land use types on EEQ have been studied. For example, Lu et al. (2020) found that artificial surfaces, arable land and desert could deteriorate EEQ, while forests and grasslands could effectively improve EEQ [
23]. This is consistent with the studies by Lin et al. (2020) and Xu et al. (2021) [
24,
25]. Thirdly, the influence of urban land-use efficiency on environmental pollution has been studied. Li et al. (2021) found an inverted U-shaped relationship between industrial land-use efficiency and environmental pollution using data from 270 Chinese cities from 2015 to 2018 [
4]. Liu et al. (2021) found that the mismatch of land resources exacerbated environmental pollution in local and neighboring regions by hindering industrial structure upgrading and inhibiting technological innovation [
2]. However, the effect of land reform policies on environmental quality in China has been rarely investigated. Finally, some scholars have also explored the impact of China’s rural land marketization on EEQ by taking different reform policies as examples. For example, based on an empirical study of 140 villages in five Chinese provinces, Xu et al. (2018) found that the Three Rights Separation Policy enabled farmers to increase the organic fertilizer input and promoted the agricultural ecological environment [
26]. Chen (2021) took an urban area in Yan’an, Shaanxi, China, as an example and found that rural residential land expansion deteriorated the ecological environment around the town [
27]. Yang (2018) believed that rural land circulation would significantly impact the rural ecological environment and constructed a more systematic rural land circulation environmental performance evaluation index system [
28]. In addition, few studies have used China’s high-precision and high-resolution EEQ data to investigate the impact of land use policies on EEQ from a micro perspective. Studies based on the MERCOCL reform are even rarer.
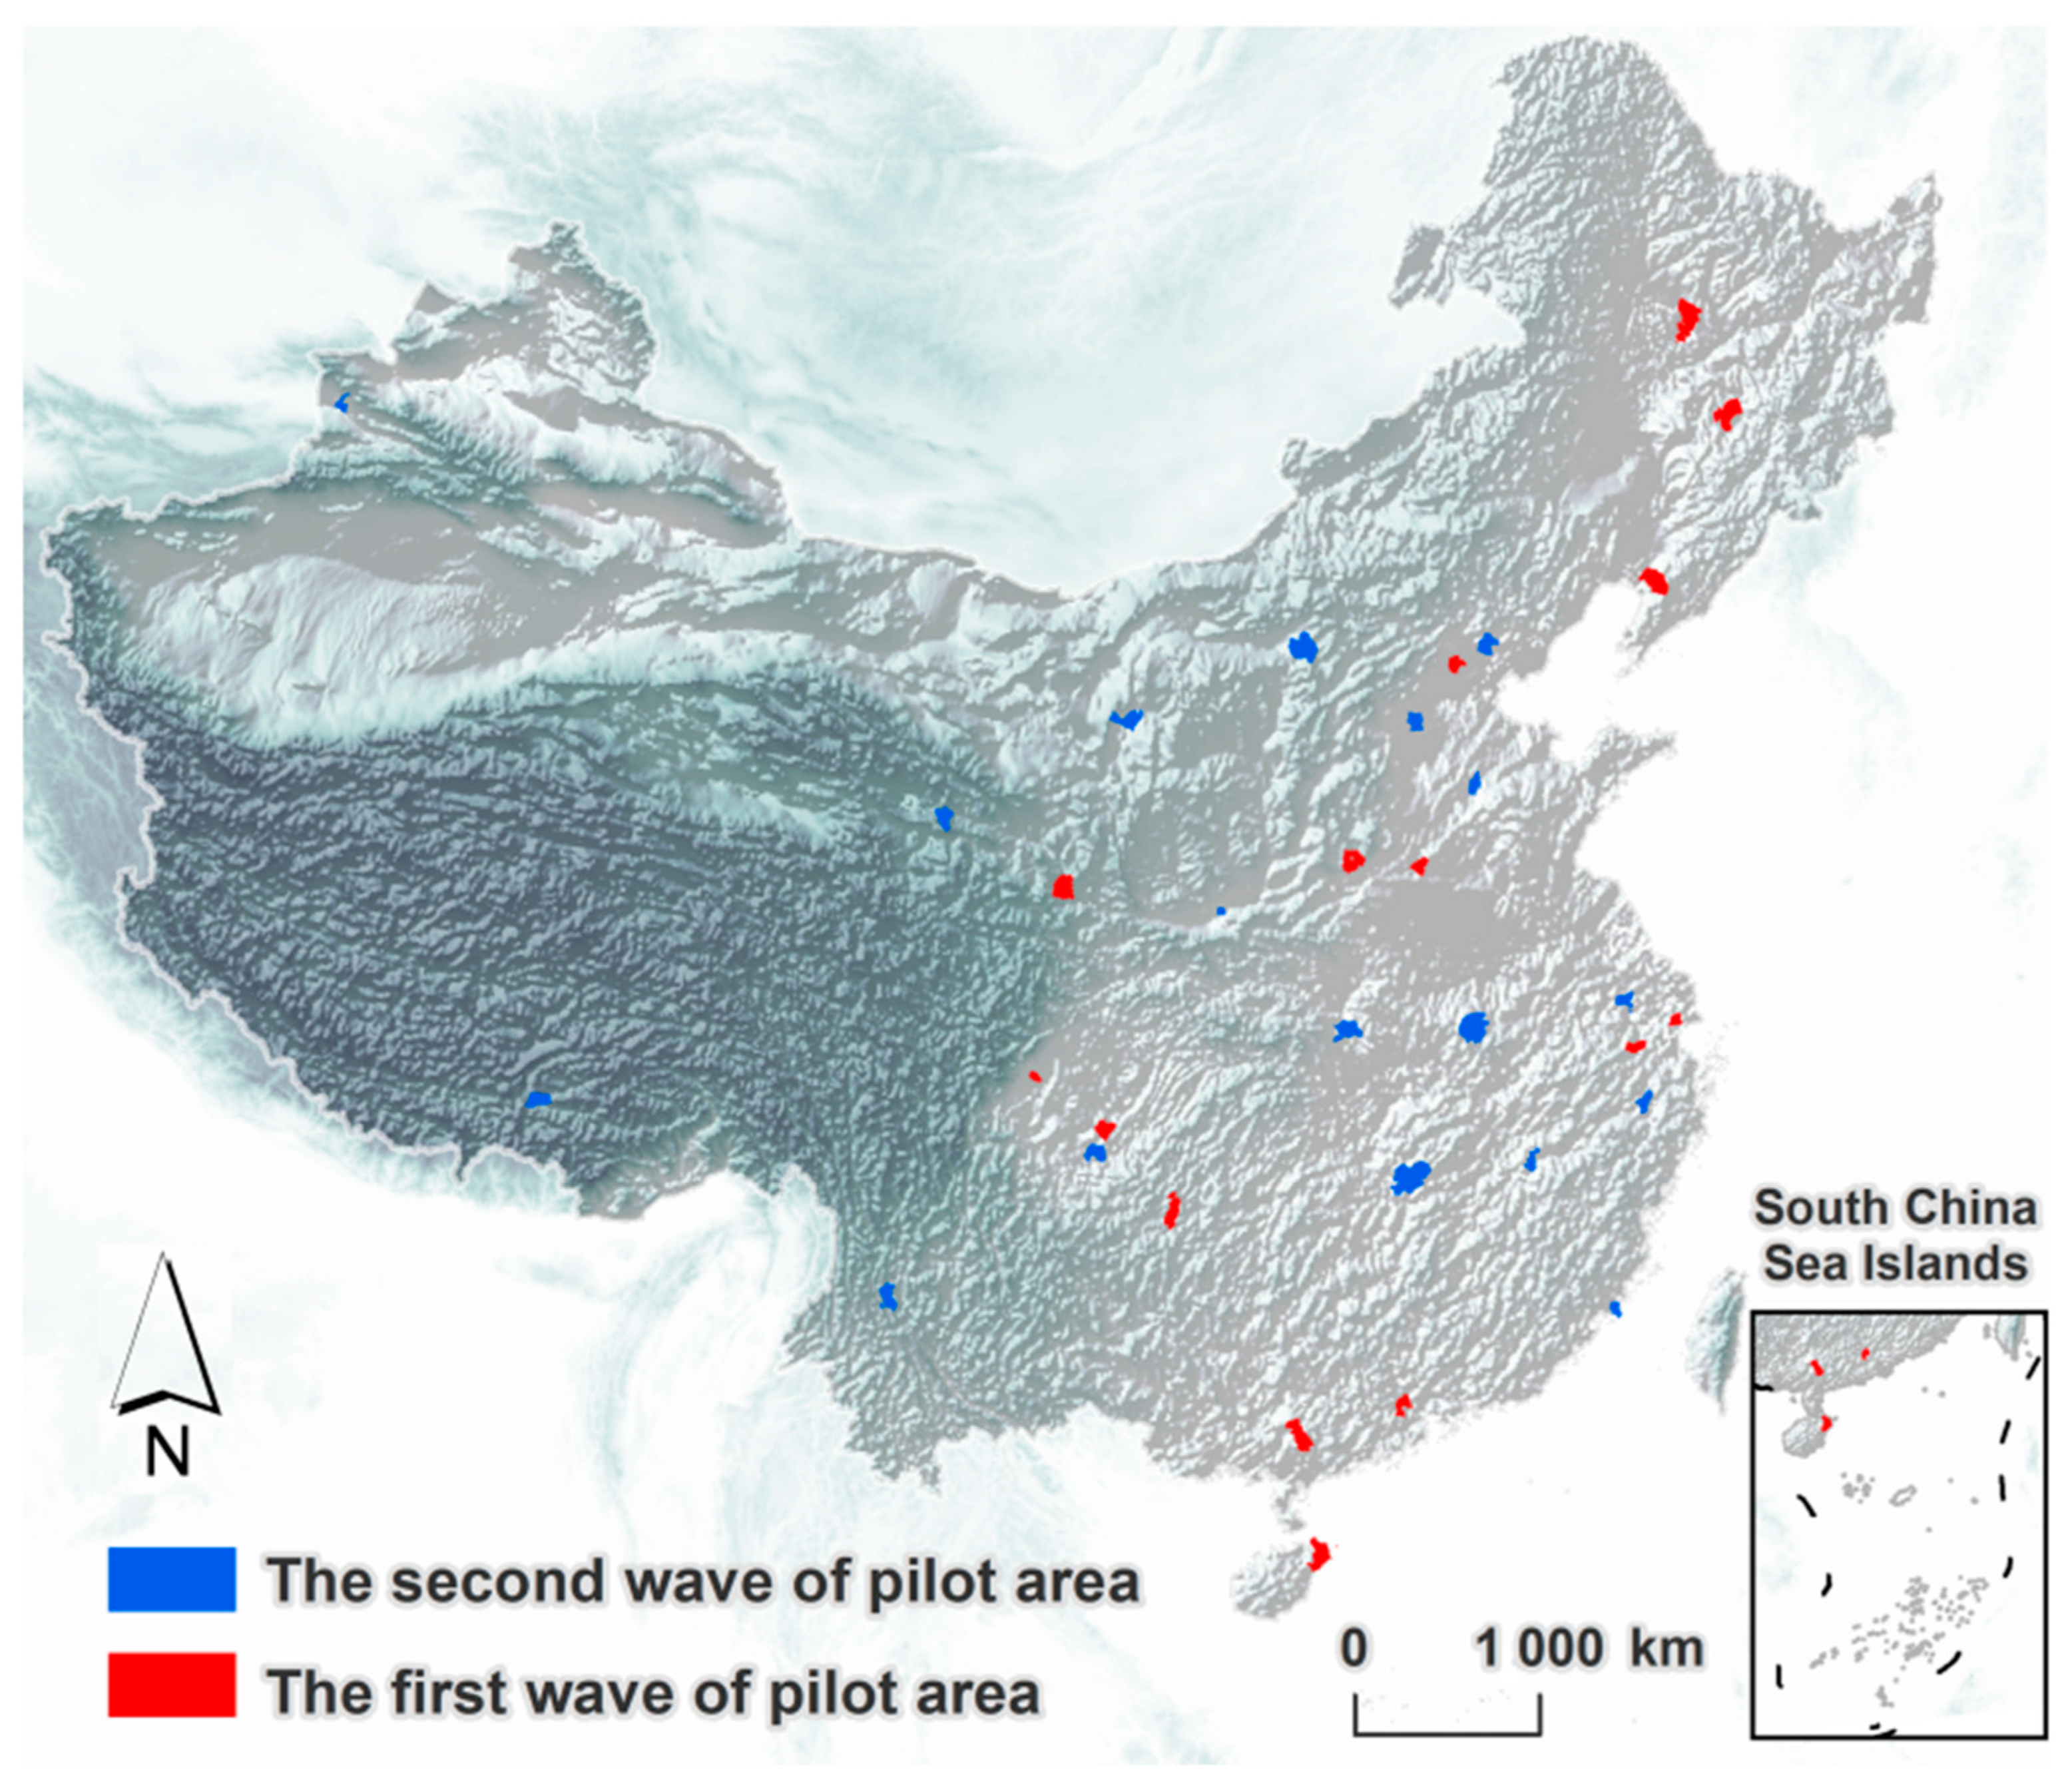
Despite the current research progress, there are still some shortcomings. Firstly, based on statistical or remote sensing data, previous studies lack an accurate evaluation of EEQ data. Secondly, existing studies on the impact of MERCOCL reform are still limited to conventional aspects such as land and income. Few studies have examined the impact of MERCOCL on regional ecology. Thirdly, although existing MERCOCL studies are abundant, they are mostly status quo discussions or case-based empirical analyses. Quantitative empirical studies with large samples are relatively rare. Therefore, based on the panel data of 229 Chinese counties (including 32 pilot counties) from 2011 to 2018, the spatial and temporal patterns of EEQ based on remote sensing data were analyzed. Furthermore, the impacts of MERCOCL on EEQ, the driving mechanism and spatial heterogeneity were also empirically investigated using the difference-in-differences (DID), the propensity score matching (PSM) model and the intermediary effect method.
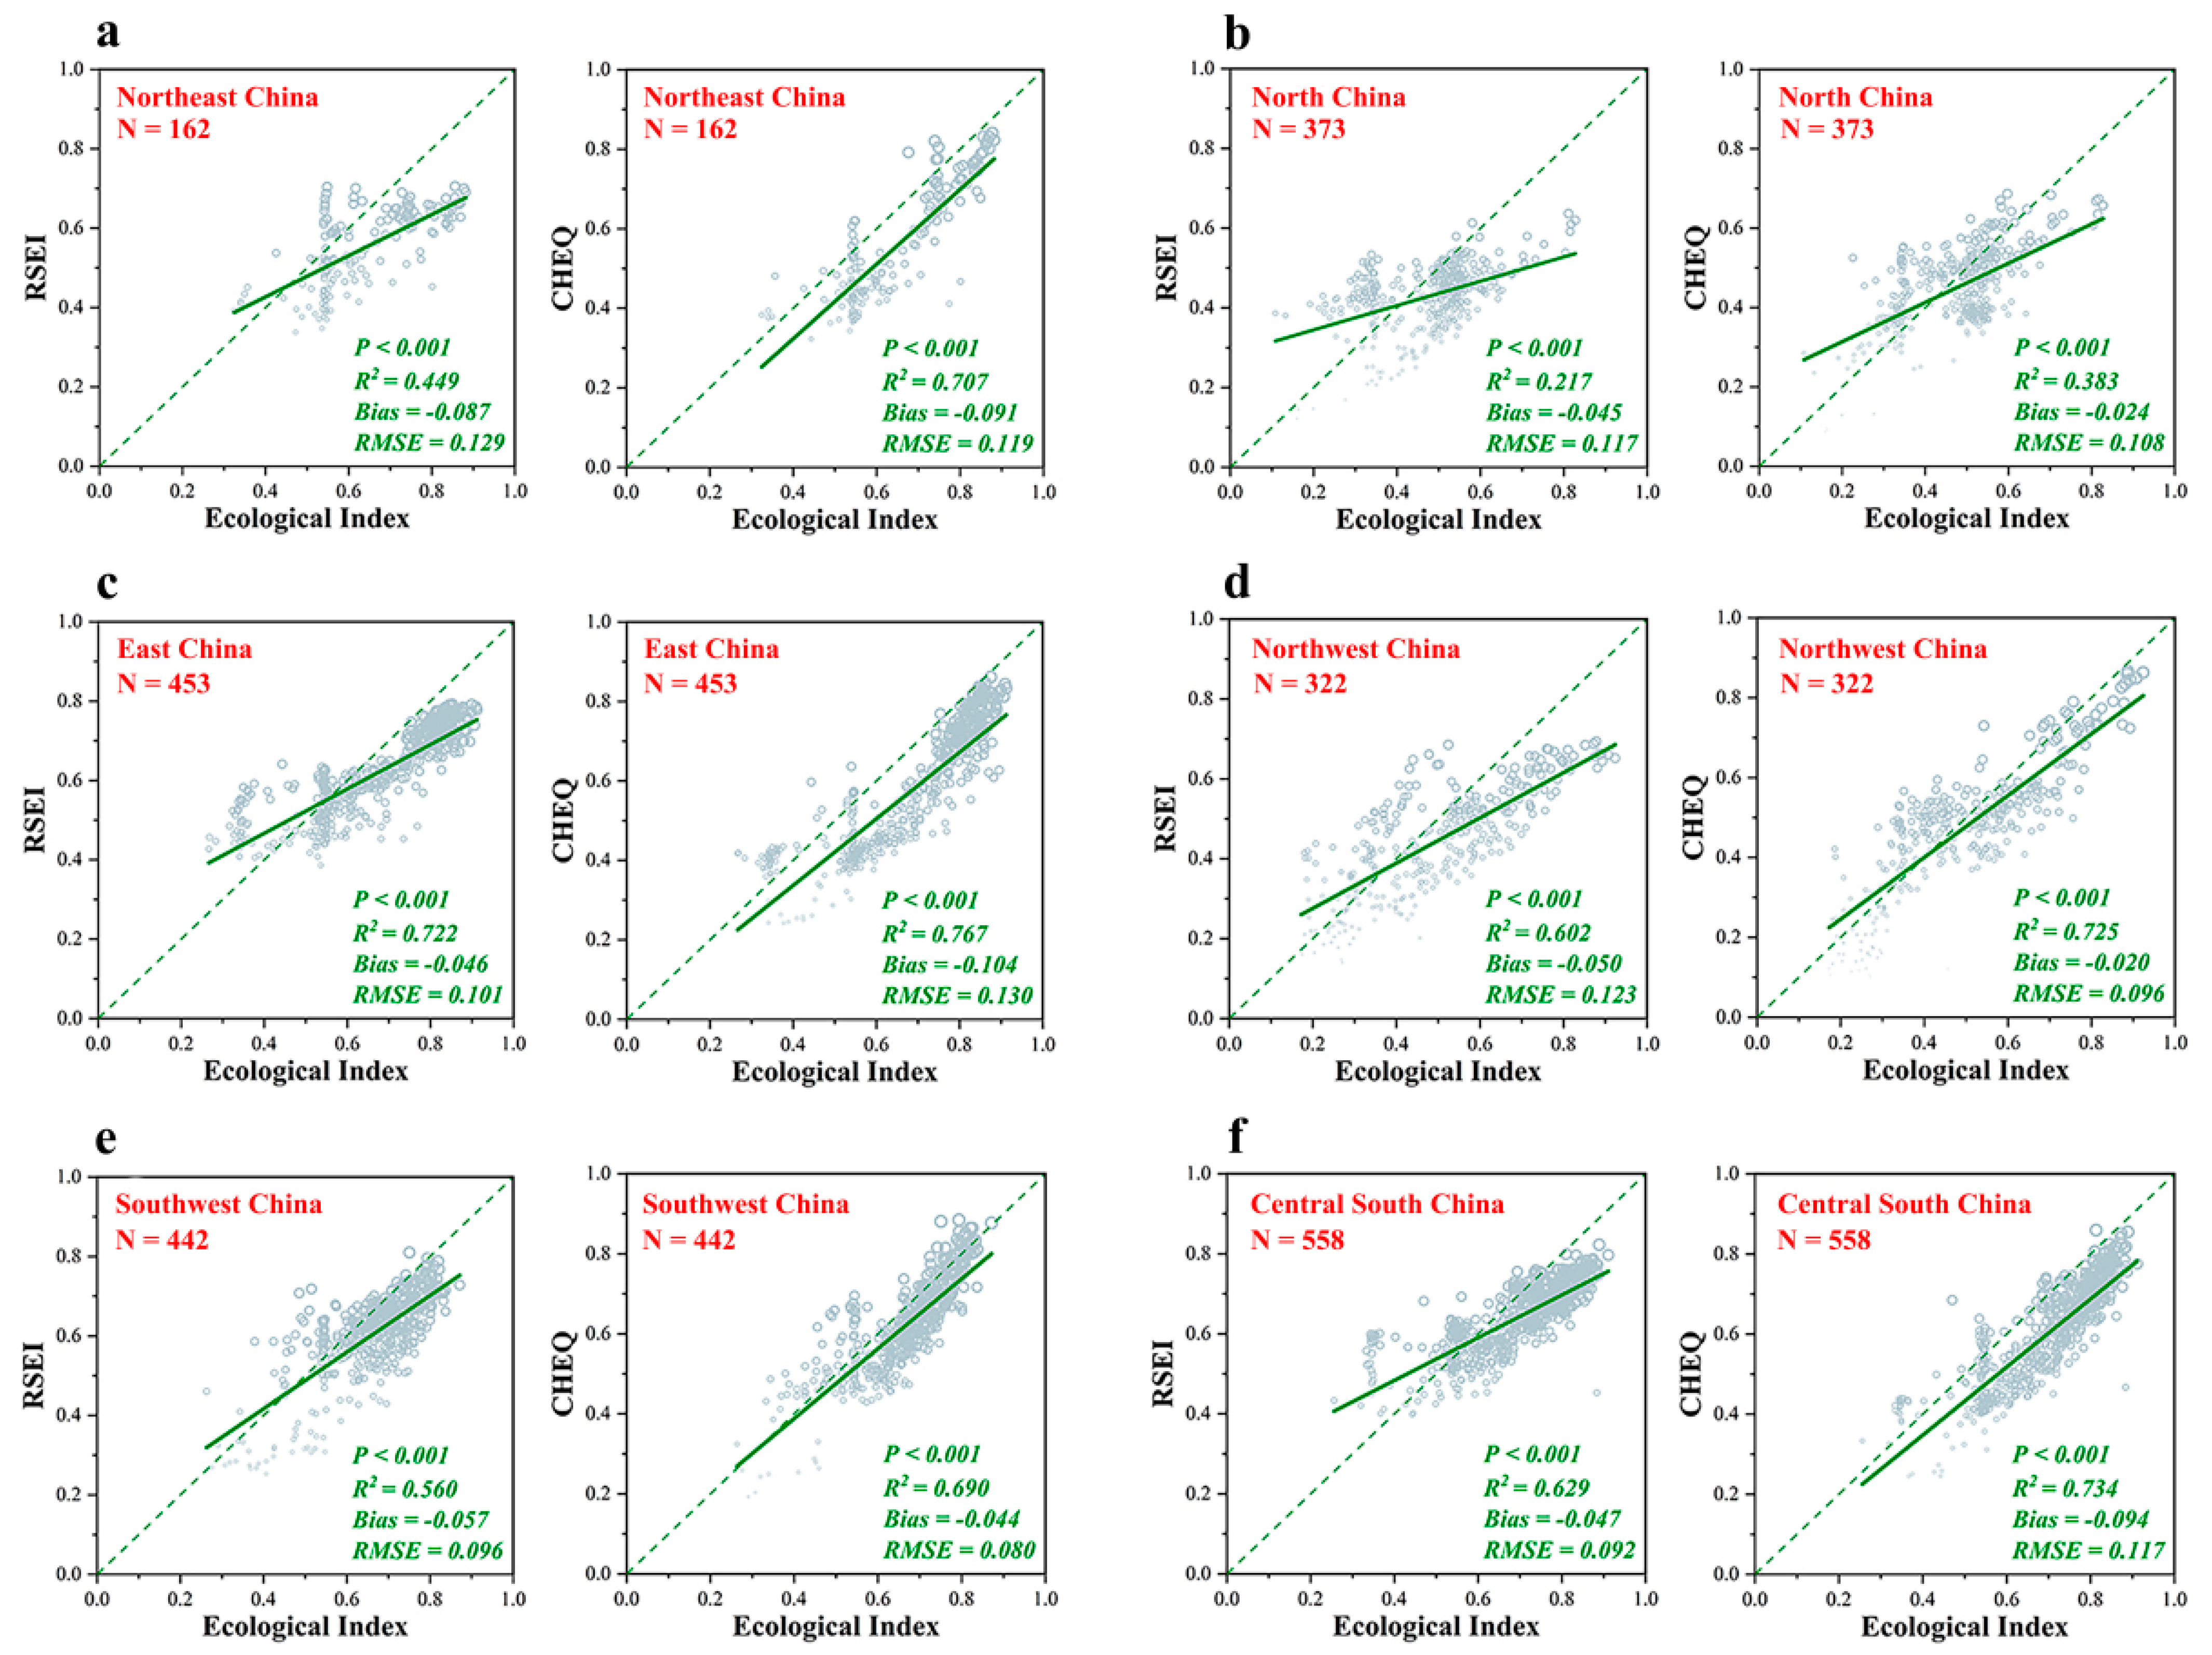
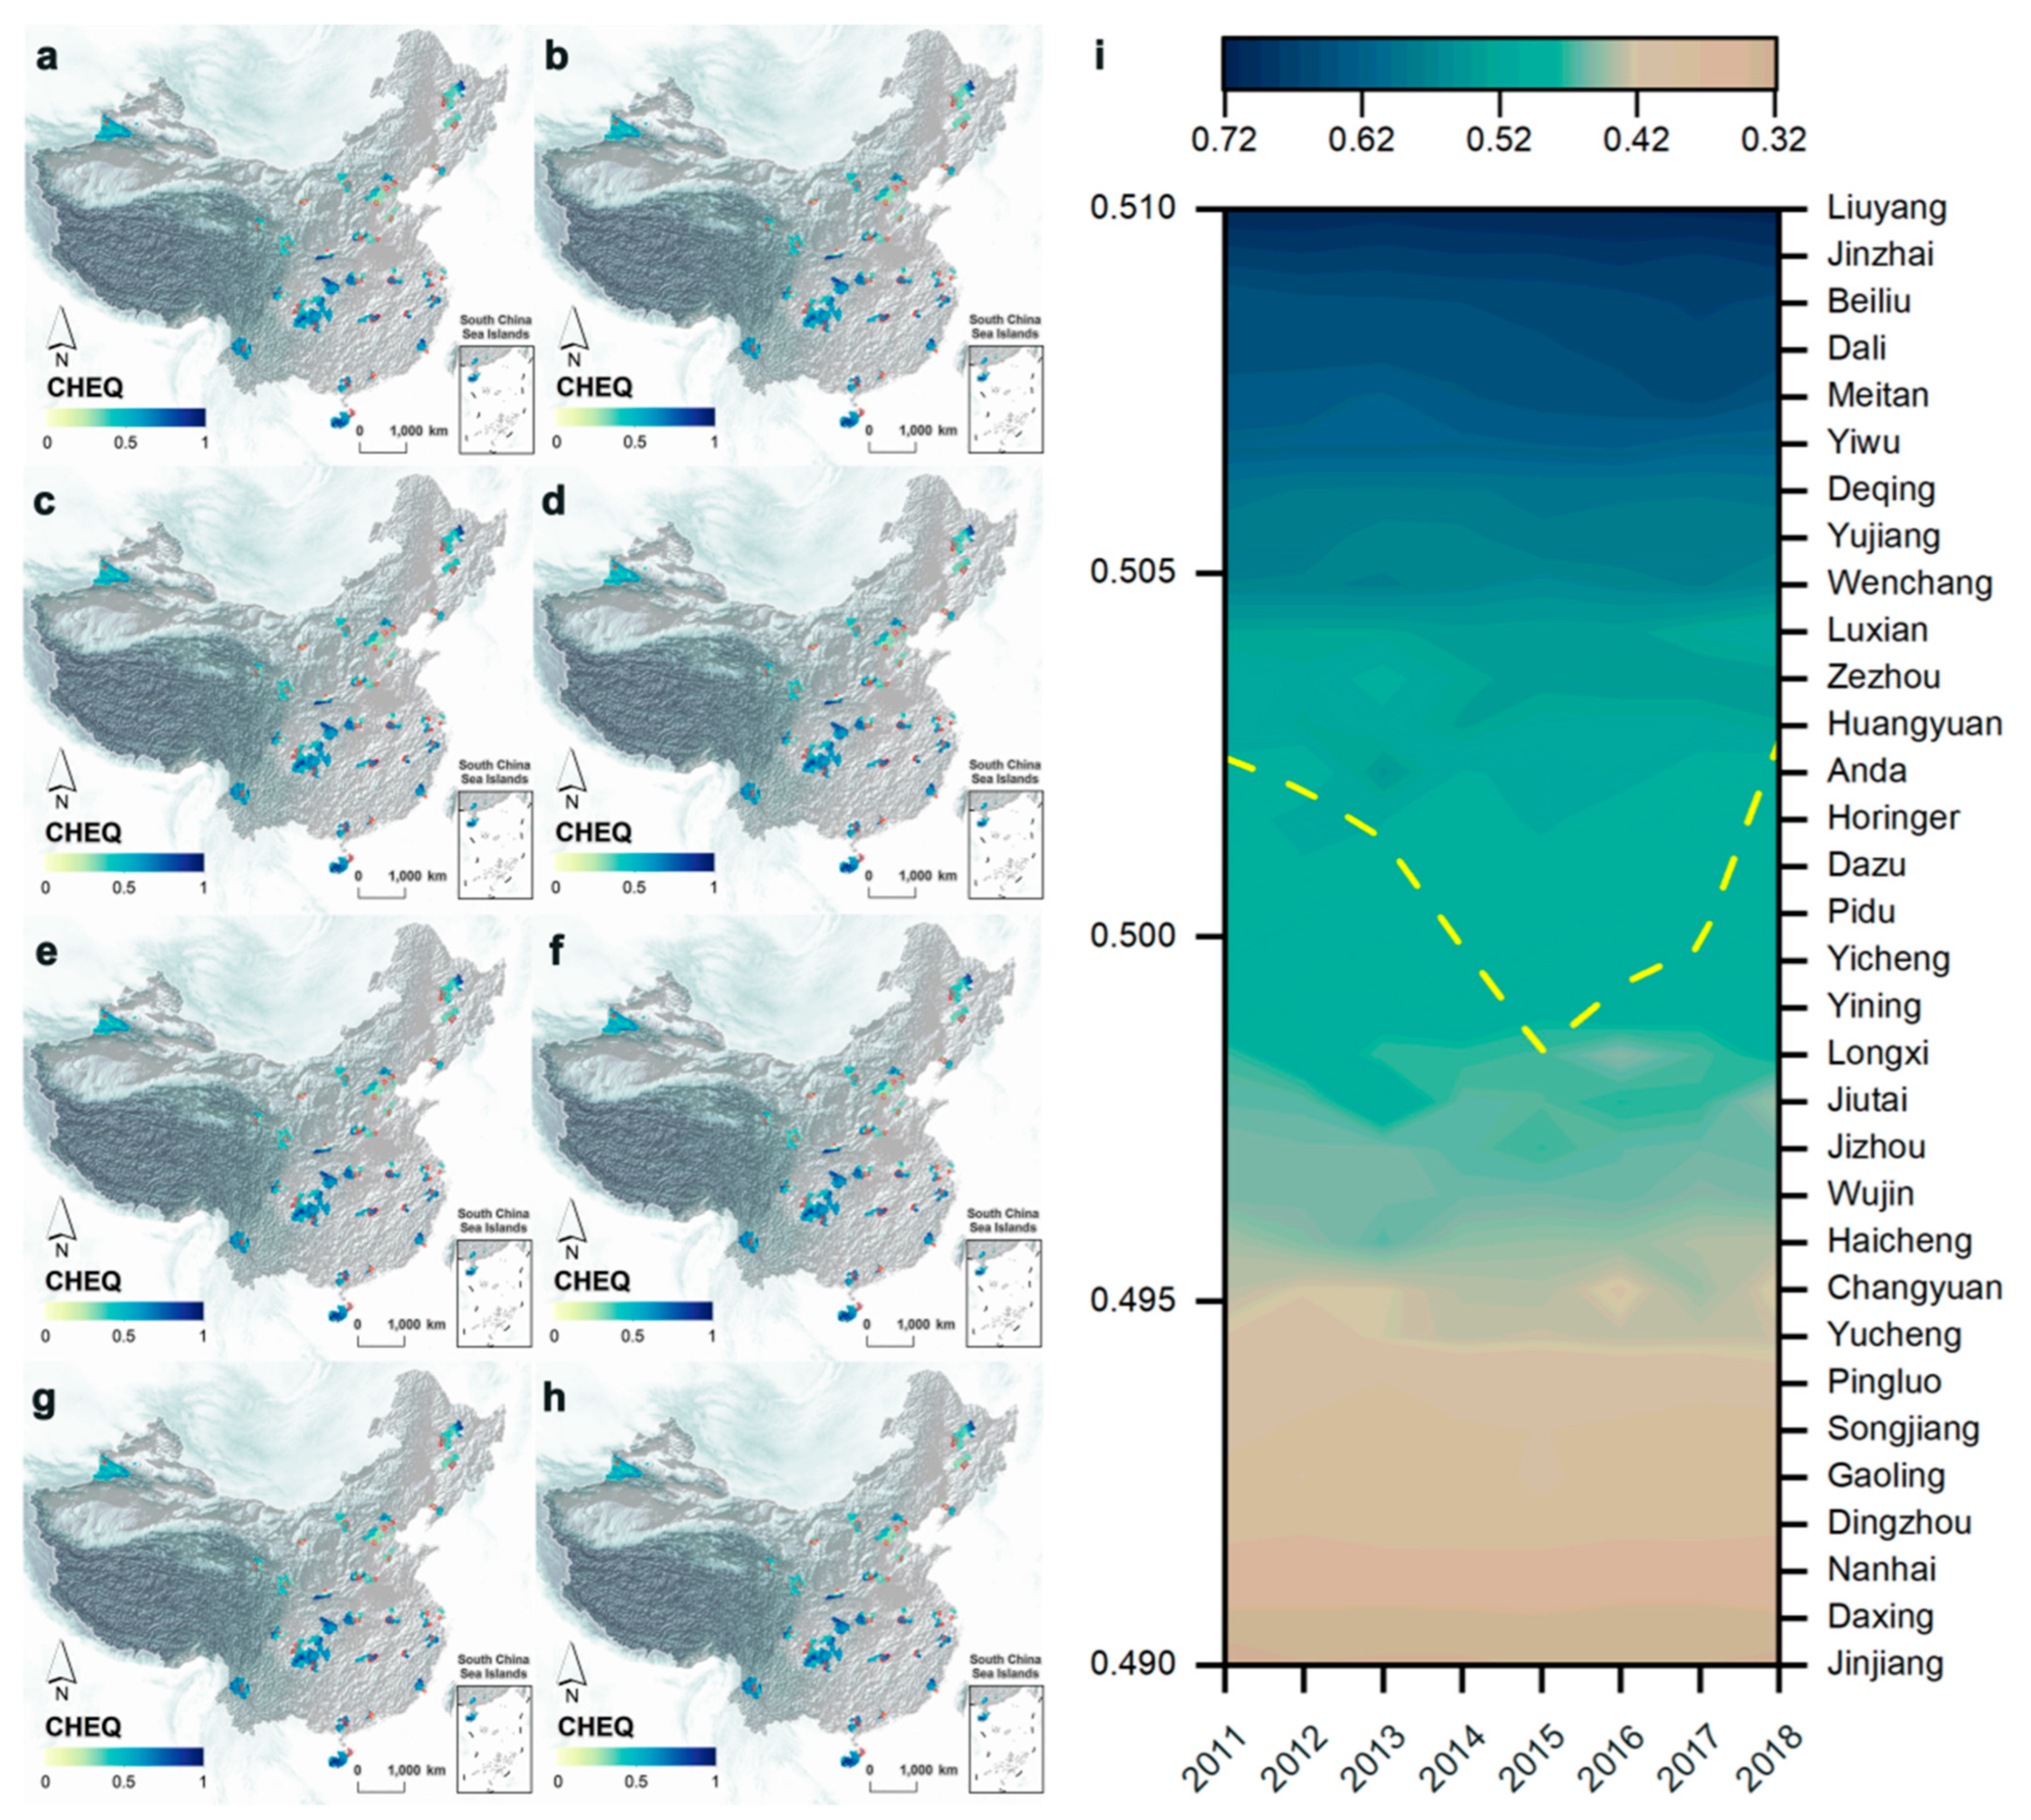
The contributions are as follows. Firstly, this article used Landsat images nationwide and the national county EI index data provided by the Ministry of Ecology and Environment to construct a high-resolution and high-precision assessment model of China’s EEQ. This model showed good universality and robustness. Based on this model, China’s EEQ data sets from 2011 to 2018 were produced. The distribution pattern and evolution process of EEQ in pilot cities in the recent ten years were also discussed. Secondly, MERCOCL was regarded as a quasi-natural experiment for the first time to investigate the impact of rural land marketization on EEQ. This study extends the literature on land use and EEQ. Thirdly, from the perspective of local industrial structure and population aggregation, this study examined the driving mechanism of the impact of the rural land market on EEQ. The impact mechanism of MERCOCL on EEQ was discussed. This will provide a valuable reference for improving the EEQ in subsequent pilot regions.
6. Conclusions
As an important part of China’s rural land marketization reform process, the MERCOCL policy significantly improved EEQ. However, the effects have been rarely studied. Therefore, a universal assessment model of China’s regional EEQ was built based on the Landsat 5/8 and the national EI provided by the Ministry of Ecology and Environment at the national district and county scale. A total of 229 Chinese counties (32 pilot counties and other counties in the pilot cities) from 2011 to 2018 were taken as the research objects. This paper empirically studied the evolution process, driving mechanism and spatial heterogeneity of EEQ from the perspective of MERCOCL, using the DID, the PSM-DID model and the intermediary effect model. The main conclusions are as follows:
- (1)
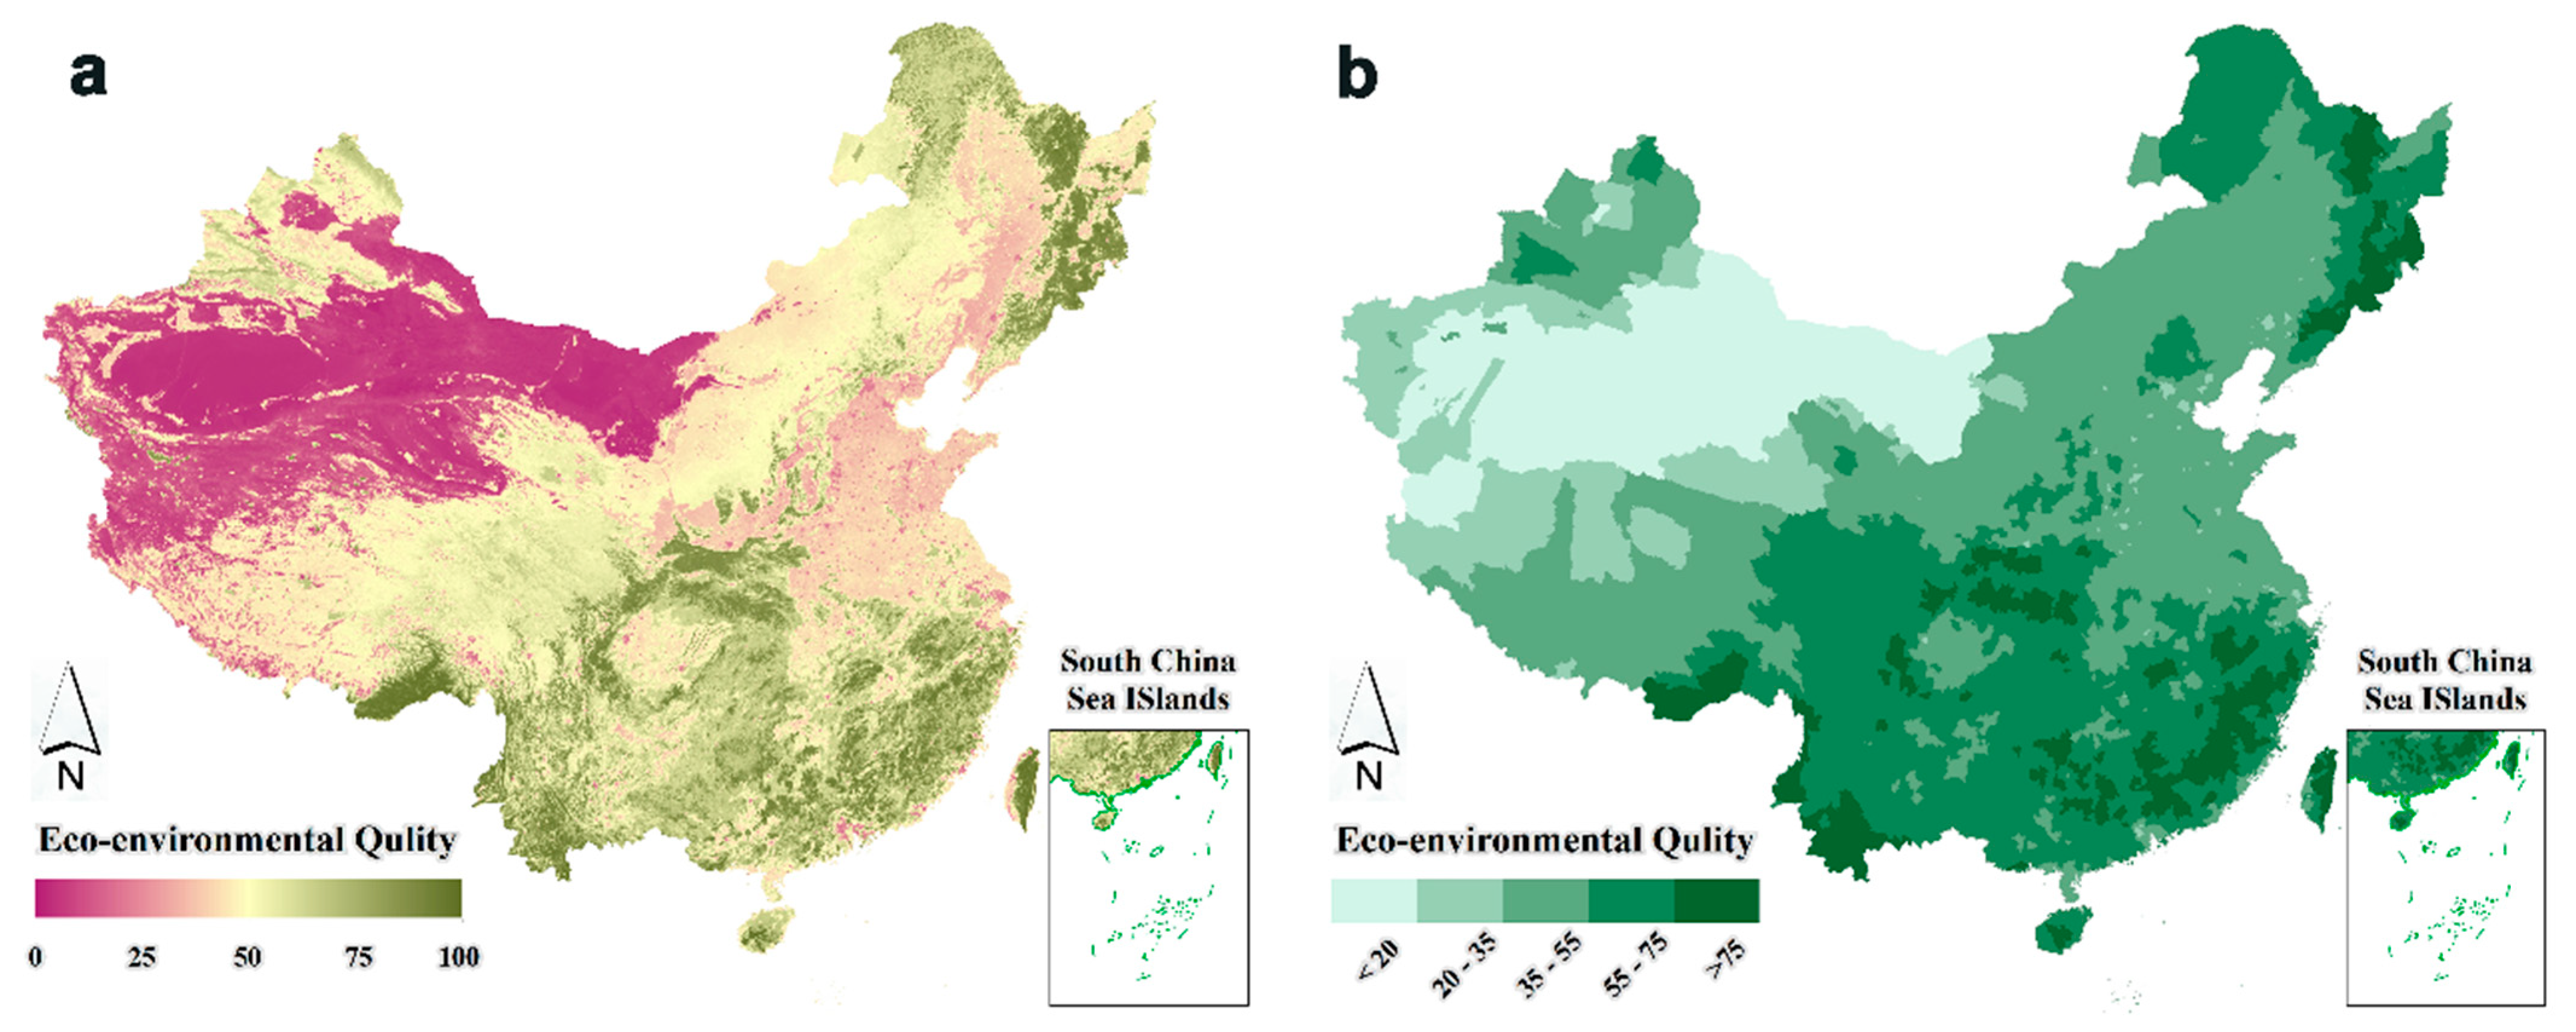
China’s EEQ presented a spatial distribution pattern of “high in the south, low in the north, high in the east and low in the west”. In areas with densely distributed forests, the EEQ was generally higher.
- (2)
MERCOCL had a significant improvement effect on EEQ, passing robustness tests. When a county implemented the MERCOCL policy, its eco-environmental quality index increased by 0.342. However, the improvement effect of the MERCOCL policy on EEQ did not appear until the second year after the implementation of the policy. It took some time for MERCOCL to play its ecological value.
- (3)
Regarding the mechanism, MERCOCL reduced the phenomenon of governments attracting backward industries and the EEQ degradation caused by excessive industrialization. MERCOCL was conducive to attracting population into cities, giving full play to the agglomeration effect of increased population density and promoting the improvement of EEQ.
- (4)
From the perspective of spatial heterogeneity, the regions with a higher economic development level and the southern region had a higher degree of industrial structure optimization and a more concentrated population. MERCOCL had a more significant improvement effect on EEQ in regions with lower economic development levels and lower latitudes (southern China). The conclusions indicate that the implementation of the MERCOCL policy in a region with a higher level of economic development will significantly increase the EEQ level by 0.337. The implementation of the MERCOCL policy in the southern region will significantly increase the EEQ level by 0.385.
The MERCOCL pilot is a new important measure of China’s land system reform, which has strongly promoted the market-oriented reform of China’s rural land. As an important part of China’s rural land market-oriented reform process, this study discussed the impact of MERCOCL reform on EEQ and the spatio-temporal evolution characteristics of EEQ at the district and county level in China in depth. This will deepen the understanding of MERCOCL’s ecological effects and provide scientific data support for scientists, policymakers, companies, investors and civil society to mitigate the eco-environmental risks from China’s future rural land marketization. In addition, this study also analyzed the driving effect of MERCOCL on EEQ from the perspectives of industrial structure optimization, population aggregation and government intervention. This will provide an effective path reference for the MERCOCL policy to achieve ecological and environmental benefits.
However, this study also has some limitations. Firstly, although the EEQ data produced in this study have good accuracy in China, the spatial resolution of CHEQ data (only 1000 m) is currently limited by factors such as the availability of remote sensing data and the calculation speed. The resolution is insufficient for counties with small areas. This may bring some uncertainties to the results. In the future, more in-depth research will be conducted to improve the spatial resolution of CHEQ data. Attempts will be made to increase the spatial resolution of CHEQ to 30 m in the next stage. Secondly, only the samples up to 2018 are used due to data availability. Thus, it is difficult to investigate the long-term effect of the MERCOCL policy. In the subsequent research, samples over a longer period will be selected to investigate the long-term impact of the MERCOCL policy on EEQ. Finally, this study only examines the impact of the MERCOCL policy on local EEQ without considering the spillover effect of the MERCOCL policy, i.e., the impact of MERCOCL on EEQ in surrounding areas. Thus, the spillover effect of the MERCOCL policy will also be focused on.
Finally, local governments should actively promote a successful experience of MERCOCL to the whole country to effectively solve the problems of insufficient land supply in the urban construction expansion and status inequality in the transformation of agricultural land into non-agricultural land. It is also necessary to actively guide the effective implementation of MERCOCL, form a reasonable land transfer price and reduce the ecological environment damage due to irrational land use.


