
Establishing Height-for-Age Z-Score Growth Reference Curves and Stunting Prevalence in Children and Adolescents in Pakistan

 , , ,
, , ,  and
and 
Abstract
1. Introduction
2. Materials and Methods
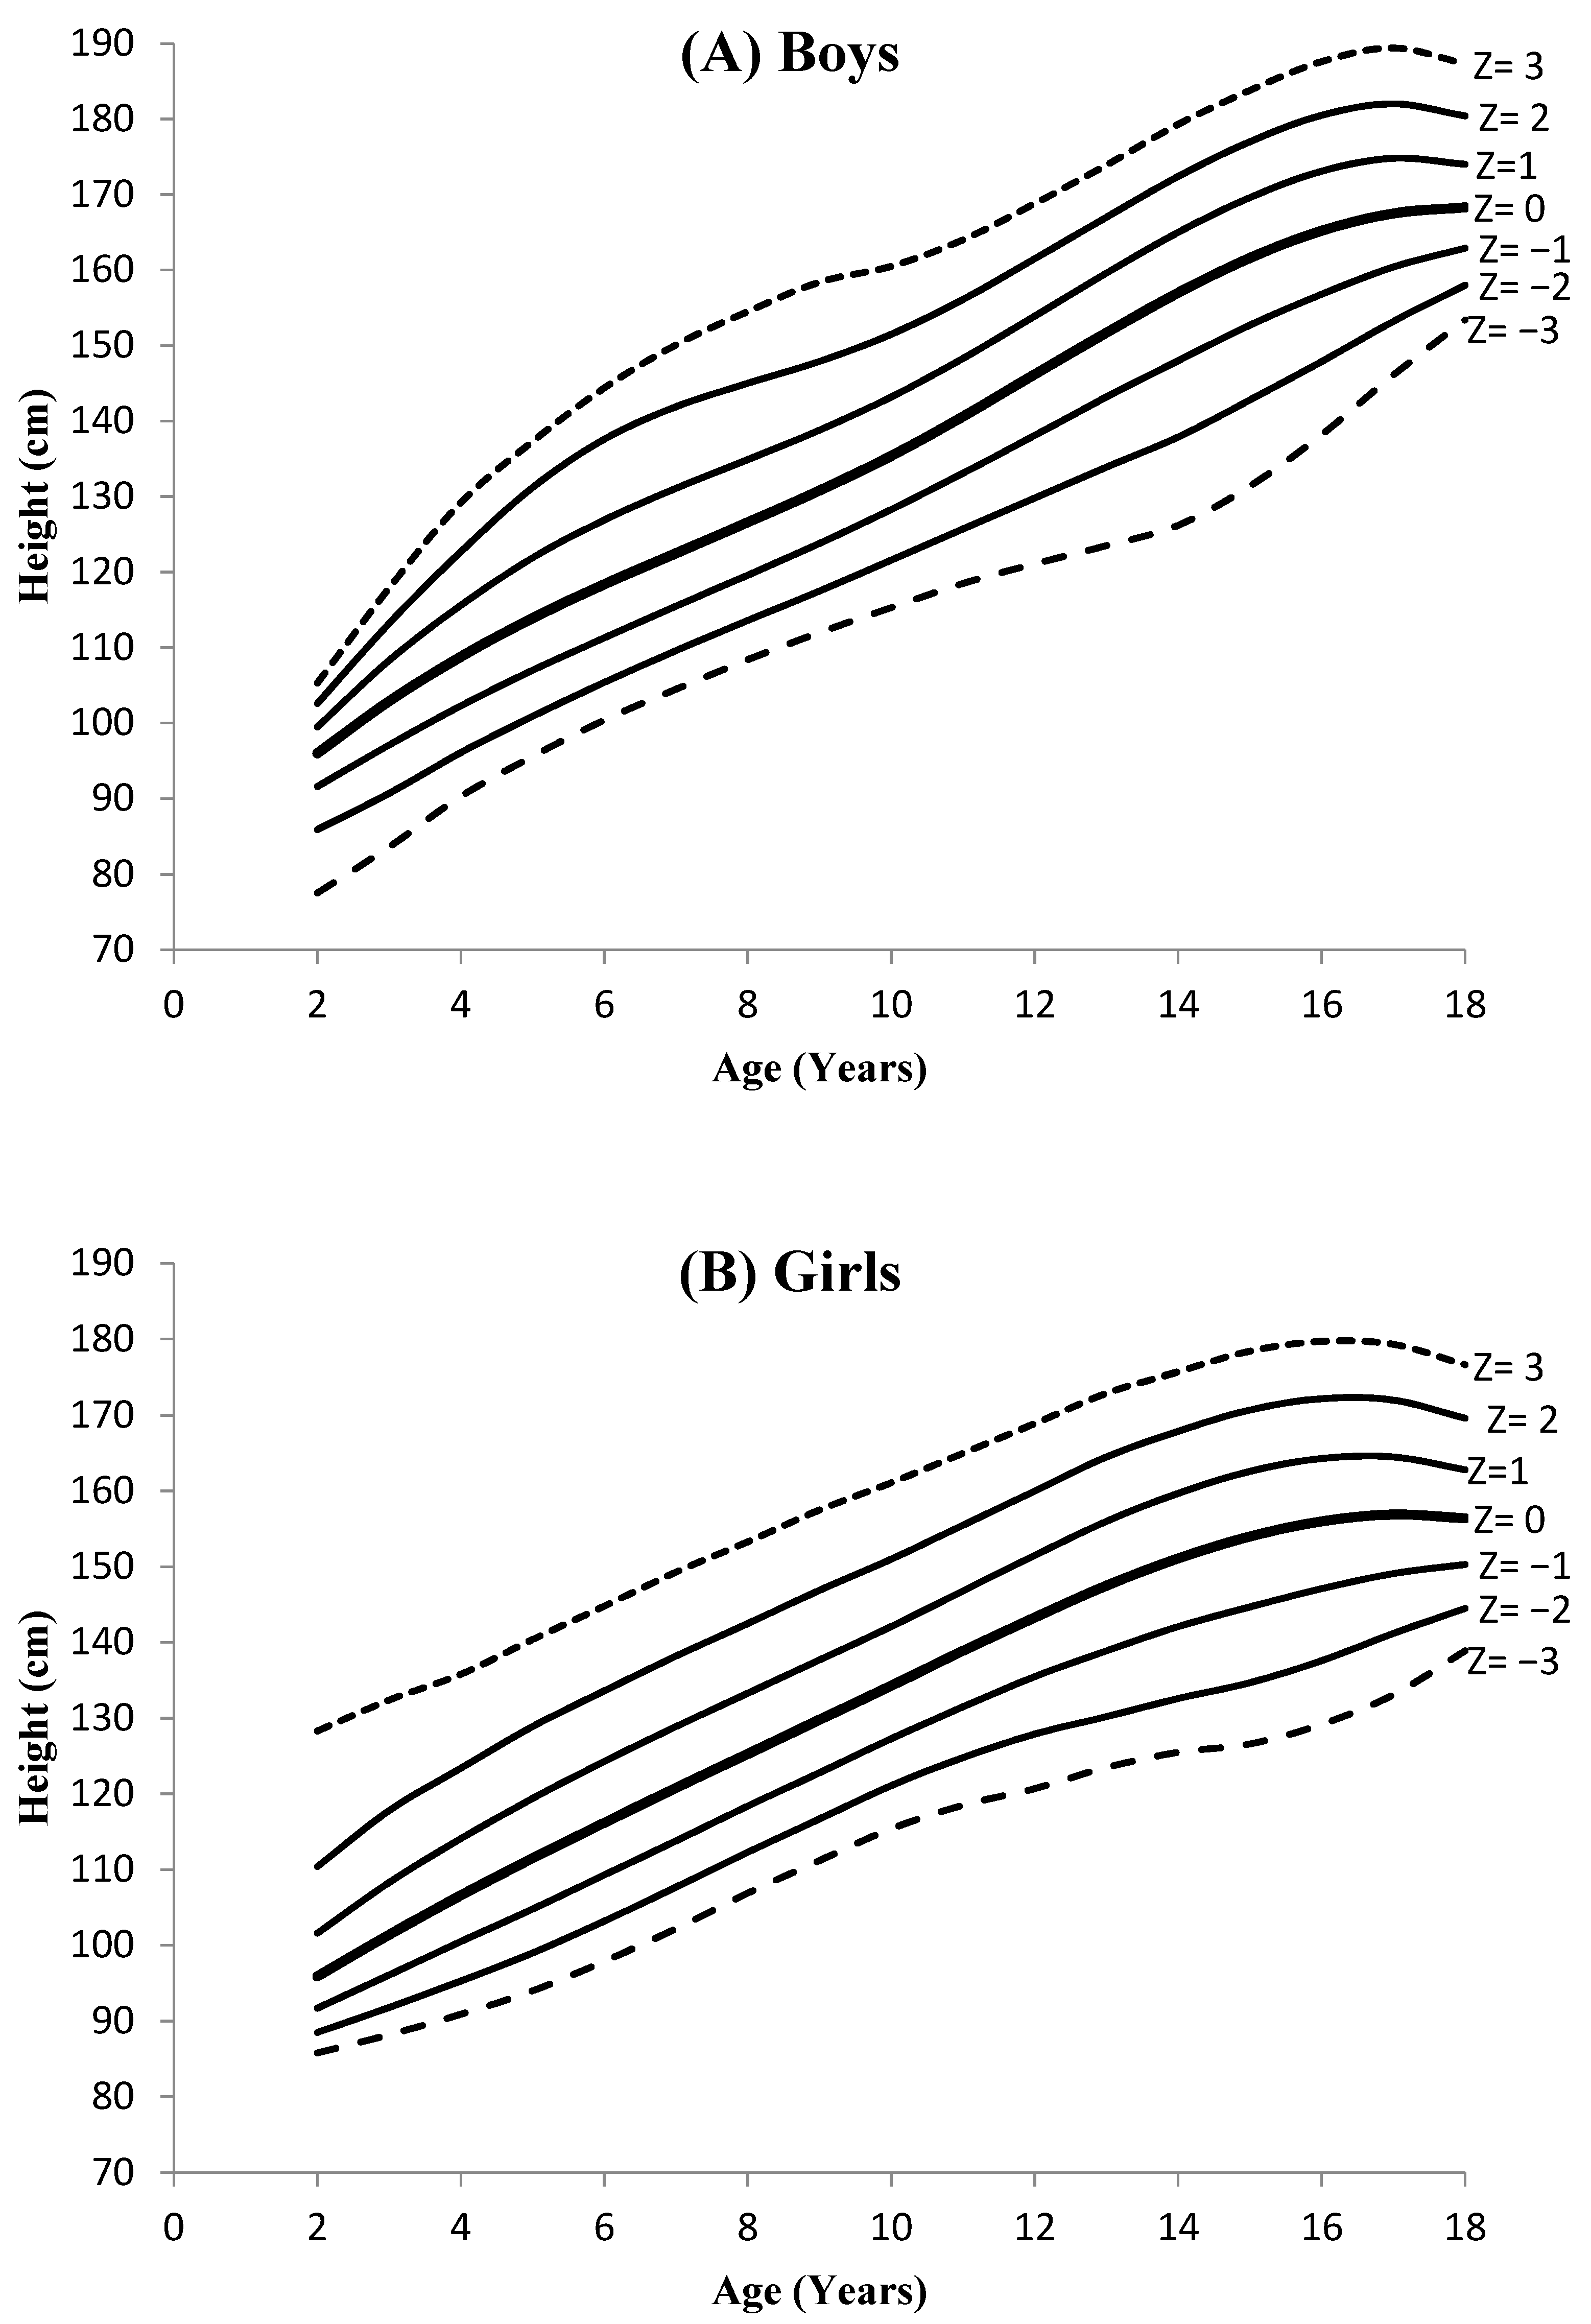
3. Results
4. Discussion
5. Conclusions
Supplementary Materials
Author Contributions
Funding
Institutional Review Board Statement
Informed Consent Statement
Data Availability Statement
Conflicts of Interest
References
- Webb, P.; Stordalen, G.A.; Singh, S.; Wijesinha-Bettoni, R.; Shetty, P.; Lartey, A. Hunger and malnutrition in the 21st century. BMJ 2018, 361, k2238. [Google Scholar] [CrossRef] [PubMed]
- World Health Organization. Physical status: The use and interpretation of anthropometry. Report of a WHO Expert Committee. World Health Organ. Tech. Rep. Ser. 1995, 854, 1–452. [Google Scholar]
- Quamme, S.H.; Iversen, P.O. Prevalence of child stunting in Sub-Saharan Africa and its risk factors. Clin. Nutr. Open Sci. 2022, 42, 49–61. [Google Scholar] [CrossRef]
- World Health Organization. Nutrition in Universal Health Coverage (No. WHO/NMH/NHD/19.24); World Health Organization: Geneva, Switzerland, 2019. [Google Scholar]
- UNICEF. Levels and trends in child malnutrition. In eSocialSciences; UNICEF: New York, NY, USA, 2018. [Google Scholar]
- Sheely, T.; Carey, E.; Sharma, S.; Biadgilign, S. Trends in energy and nutrient supply in Ethopia: A prospective from FAO food balance sheets. Nutr. J. 2019, 18, 1–12. [Google Scholar]
- Mahmood, T.; Abbas, F.; Kumar, R.; Somrongthong, R. Why under five children are stunted in Pakistan? A multilevel analysis of Punjab Multiple Indicator Cluster Survey (MICS- 2014). BMC Public Health 2020, 20, 952. [Google Scholar] [CrossRef] [PubMed]
- Khan, G.N.; Turab, A.; Khan, M.I.; Rizvi, A.; Shaheen, F.; Ullah, A.; Hussain, A.; Hussain, I.; Ahmed, I.; Yaqoob, M.; et al. Prevalence and associated factors of malnutrition among children under five years in Sindh, Pakistan: A cross-sectional stuy. BMC Nutr. 2016, 2, 69. [Google Scholar] [CrossRef]
- World Health Organization; United Nations Children’s Fund; World Bank. Levels and Trends in Child Malnutrition: Key Findings of the 2019 Edition of the Joint Child Malnutrition Estimates; World Health Organization: Geneva, Switzerland, 2019; ISBN 9789240025257 (electronic version). [Google Scholar]
- Development Initiatives. 2018 Global Nutrition Report: Shining a Light to Spur Action on Nutrition; Global Nutrition Report: London, UK, 2018. [Google Scholar]
- United Nations Children’s Fund. Press Release on Global Nutrition Report 2018; United Nations Children’s Fund: New York, NY, USA, 2018. [Google Scholar]
- UNICEF. Government of Pakistan. The 2018 Pakistan National Nutrition Survey; UNICEF: New York, NY, USA, 2018. [Google Scholar]
- World Health Organization. WHO Child Growth Standards: Length/Height-for-Age, Weight-for-Age, Weight-for-Length, Weight-for-Height and Body Mass Index-for-Age: Methods and Development; World Health Organization: Geneva, Switzerland, 2006; ISBN 924154693X. [Google Scholar]
- de Onis, M.; Onyango, A.W.; Borghi, E.; Siyam, A.; Nishida, C.; Siekmann, J. Development of a WHO growth reference for school-aged children and adolescents. Bull. World Health Organ. 2007, 85, 660–667. [Google Scholar] [CrossRef]
- Kuczmarski, R.J.; Ogden, C.L.; Guo, S.S.; Grummer-Strawn, L.M.; Flegal, K.M.; Mei, Z.; Wei, R.; Curtin, L.R.; Roche, A.F.; Johnson, C.L. 2000 CDC Growth Charts for the United States: Methods and development. Vital Health Stat. 2002, 11, 1–190. [Google Scholar]
- Preedy, V.R. Handbook of Anthropometry: Physical Measures of Human form in Health and Disease; Springer Science & Business Media: Berlin, Germany, 2012; ISBN 1441917888. [Google Scholar]
- Natale, V.; Rajagopalan, A. Worldwide variation in human growth and the World Health Organization growth standards: A systematic review. BMJ Open. 2014, 4, e003735. [Google Scholar] [CrossRef]
- Payandeh, A.; Shakeri, M.T.; Safarian, M.; Tabesh, H. Application of non-parametric quantile regression for fitting height-for-age curves. Gundishapur. J. Health Sci. 2014, 6, 221–226. [Google Scholar]
- Kato, N.; Takimoto, H.; Yokoyama, P.; Yokoya, S.; Tanaka, T.; Tada, H. Updated Japanese growth references for infants and preschool children, based on historical, ethnic and environmental characteristics. Acta Pediatr. 2014, 103, 251–261. [Google Scholar] [CrossRef] [PubMed]
- Asif, M.; Aslam, M.; Altaf, S.; Mustafa, S. Developing waist circumference, waist-to-height ratio percentile curves for Pakistani children and adolescents aged 2–18 years using Lambda-Mu-Sigma (LMS) method. J. Pediatr. Endocrinol. Metab. 2020, 33, 983–993. [Google Scholar] [CrossRef] [PubMed]
- Asif, M.; Aslam, M.; Khan, S.; Altaf, S.; Ahmad, S.; Qasim, M.; Ali, H.; Wyszyńska, J. Developing neck circumference growth reference charts for Pakistani children and adolescents using the lambda–mu–sigma and quantile regression method. Public Health Nutr. 2021, 24, 5641–5649. [Google Scholar] [CrossRef]
- Asif, M.; Aslam, M.; Wyszyńska, J.; Altaf, S. Establishing body mass index growth charts for Pakistani children and adolescents using the Lambda-Mu-Sigma (LMS) and quantile regression method. Minerva Pediatr. 2020. [Google Scholar] [CrossRef]
- Zong, X.-N.; Li, H. Construction of a New Growth References for China Based on Urban Chinese Children: Comparison with the WHO Growth Standards. PLoS ONE 2013, 8, e59569. [Google Scholar] [CrossRef] [PubMed]
- Marwaha, R.K.; Tandon, N.; Ganie, M.A.; Kanwar, R.; Shivaprasad, C.; Sabharwal, A.; Bhadra, K.; Narang, A. Nationwide reference data for height, weight and body mass index of Indian schoolchildren. Natl. Med. J. India 2011, 24, 269–277. [Google Scholar]
- Neyzi, O.; Furman, A.; Bundak, R.; Gunoz, H.; Darendeliler, F.; Bas, F. Growth references for Turkish children aged 6 to 18 years. Acta Paediatr. 2006, 95, 1635–1641. [Google Scholar] [CrossRef]
- Mushtaq, M.U.; Gull, S.; Mushtaq, K.; Abdullah, H.M.; Khurshid, U.; Shahid, U.; Shad, M.A.; Akram, J. Height, weight and BMI percentiles and nutritional status relative to the international growth references among Pakistani school-aged children. BMC Pediatr. 2012, 12, 31. [Google Scholar] [CrossRef]
- Qaisar, R.; Karim, A. A comparison of international and national references to measure the prevalence of stunting in Pakistani school-age girls. Sci. Rep. 2022, 12, 5501. [Google Scholar] [CrossRef]
- Asif, M.; Aslam, M.; Qasim, M.; Altaf, S.; Ismail, A.; Ali, H. A dataset about anthropometric measurements of the Pakistani children and adolescents using a cross-sectional multi-ethnic anthropometric survey. Data Br. 2021, 34, 106642. [Google Scholar] [CrossRef]
- Asif, M.; Aslam, M.; Sajid, M.; Saima, A. Age-specific differences and interrelation between anthropometric variables in Pakistani children aged 2 to 19 years. Rawal Med. J. 2018, 43, 164. [Google Scholar]
- World Medical Association World Medical Association Declaration of Helsinki: Ethical Principles for Medical Research Involving Human Subjects. JAMA 2013, 310, 2191–2194. [CrossRef] [PubMed]
- Cole, T.J.; Green, P.J. Smoothing reference centile curves: The lms method and penalized likelihood. Stat. Med. 1992, 11, 1305–1319. [Google Scholar] [CrossRef] [PubMed]
- McHugh, M.L. Interrater reliability: The kappa statistic. Biochem. Med. 2012, 22, 276–282. [Google Scholar] [CrossRef]
- Jafar, T.H.; Qadri, Z.; Islam, M.; Hatcher, J.; Bhutta, Z.A.; Chaturvedi, N. Rise in childhood obesity with persistently high rates of undernutrition among urban school-aged Indo-Asian children. Arch. Dis. Child. 2008, 93, 373–378. [Google Scholar] [CrossRef]
- Mushtaq, M.U.; Gull, S.; Khurshid, U.; Shahid, U.; Shad, M.A.; Siddiqui, A.M. Prevalence and socio-demographic correlates of stunting and thinness among Pakistani primary school children. BMC Public Health 2011, 11, 790. [Google Scholar] [CrossRef]
- Khuwaja, S.; Selwyn, B.J.; Shah, S.M. Prevalence and Correlates of Stunting among Primary School Children in Rural Areas of Southern Pakistan. J. Trop. Pediatr. 2005, 51, 72–77. [Google Scholar] [CrossRef]


| Age (Years) | Boys | Girls | ||||||||
|---|---|---|---|---|---|---|---|---|---|---|
| N | Mean ± SD | Stunting a (%) | Stunting b (%) | Stunting c (%) | N | Mean ± SD | Stunting a (%) | Stunting b (%) | Stunting c (%) | |
| 02 | 19 | 96.58 ± 4.03 | 5.3 | 0 | 0 | 43 | 96.37 ± 4.75 NS | 0 | 0 | 0 |
| 03 | 100 | 102.69 ± 5.82 | 1.0 | 0 | 0 | 170 | 101.71 ± 6.50 NS | 1.8 | 0 | 0 |
| 04 | 208 | 108.54 ± 8.43 | 8.2 | 2.4 | 2.9 | 313 | 106.45 ± 7.91 S | 5.4 | 2.9 | 2.2 |
| 05 | 240 | 112.78 ± 7.13 | 5.8 | 5.0 | 5.0 | 381 | 111.30 ± 7.38 S | 3.4 | 4.2 | 6.6 |
| 06 | 292 | 119.36 ± 7.81 | 3.4 | 4.5 | 7.9 | 405 | 117.15 ± 6.99 S | 1.2 | 2.0 | 4.0 |
| 07 | 279 | 123.70 ± 7.18 | 2.5 | 3.9 | 6.1 | 381 | 122.21 ± 7.64 S | 1.6 | 3.1 | 8.4 |
| 08 | 273 | 128.21 ± 7.63 | 2.9 | 2.6 | 7.3 | 376 | 127.55 ± 8.07 NS | 1.6 | 2.9 | 8.0 |
| 09 | 247 | 132.65 ± 7.18 | 3.2 | 3.6 | 8.9 | 336 | 130.73 ± 6.65 S | 1.2 | 5.7 | 11.3 |
| 10 | 420 | 139.19 ± 7.76 | 2.1 | 3.3 | 14.5 | 459 | 132.59 ± 7.93 S | 5.2 | 15.9 | 26.4 |
| 11 | 439 | 140.09 ± 7.89 | 2.3 | 5.9 | 15.0 | 325 | 138.37 ± 8.05 NS | 1.2 | 17.2 | 21.8 |
| 12 | 675 | 144.45 ± 8.28 | 2.4 | 9.3 | 19.1 | 436 | 142.97 ± 8.60 S | 3.9 | 26.8 | 34.4 |
| 13 | 593 | 149.07 ± 9.28 | 5.2 | 18.0 | 25.5 | 460 | 148.96 ± 8.77 NS | 1.5 | 23.7 | 38.3 |
| 14 | 563 | 156.52 ± 9.28 | 5.2 | 16.0 | 23.8 | 341 | 150.50 ± 8.87 S | 2.6 | 30.8 | 38.7 |
| 15 | 546 | 162.98 ± 7.77 | 1.6 | 11.2 | 17.6 | 257 | 153.33 ± 8.27 S | 1.2 | 23.3 | 42.8 |
| 16 | 381 | 165.83 ± 7.37 | 1.8 | 11.3 | 21.0 | 191 | 155.97 ± 9.81 S | 3.1 | 19.4 | 30.4 |
| 17 | 169 | 167.66 ± 6.41 | 3.0 | 7.7 | 23.1 | 129 | 157.01 ± 5.74 S | 0 | 10.1 | 20.9 |
| 18 | 95 | 167.78 ± 6.71 | 7.4 | 16.8 | 32.6 | 126 | 157.33 ± 5.74 S | 4.8 | 11.1 | 21.4 |
| Age groups (years) | ||||||||||
| 2–10 | 2078 | 123.23 ± 12.92 | 3.6 | 3.4 | 7.7 | 2864 | 120.16 ± 12.76 S | 2.7 | 5.2 | 9.4 |
| 11–18 | 3461 | 153.77 ± 12.61 | 3.3 | 12.1 | 21.0 | 2265 | 148.47 ± 10.37 S | 2.3 | 22.6 | 33.2 |
| 02–18 | 5539 | 142.31 ± 19.51 | 3.4 | 8.8 | 16.0 | 5129 | 132.66 ± 10.33 S | 2.5 | 12.8 | 19.9 |
| City of residence | ||||||||||
| Lahore | 2839 | 142.20 ± 19.30 | 2.7 | 8.3 | 16.0 | 2091 | 135.04 ± 19.52 S | 2.1 | 11.5 | 18.7 |
| R. pindi/Isl | 1764 | 142.81 ± 21.01 | 2.8 | 7.5 | 13.7 | 1926 | 131.35 ± 17.01 S | 2.6 | 14.0 | 21.0 |
| Multan | 936 | 141.73 ± 18.01 | 6.7 | 12.9 | 20.6 | 1112 | 130.46 ± 17.59 S | 3.1 | 13.3 | 20.3 |
| F = 1.05(p = 0.349) | F = 30.97(p = 0.000) | |||||||||
| Age (Years) | L | S | M | Z = −3 | Z = −2 | Z = −1 | Z = 0 | Z = 1 | Z = 2 | Z = 3 |
|---|---|---|---|---|---|---|---|---|---|---|
| Boys | ||||||||||
| 2 | 5.73 | 0.041 | 95.95 | 77.5 | 85.9 | 91.6 | 96.0 | 99.5 | 102.6 | 105.3 |
| 3 | 2.51 | 0.054 | 102.92 | 83.6 | 90.7 | 97.1 | 102.9 | 108.3 | 113.2 | 117.9 |
| 4 | 0.23 | 0.061 | 108.81 | 90.3 | 96.1 | 102.3 | 108.8 | 115.6 | 122.7 | 129.2 |
| 5 | −1.23 | 0.065 | 113.88 | 95.6 | 100.9 | 107.0 | 113.9 | 121.9 | 131.2 | 137.3 |
| 6 | −1.98 | 0.065 | 118.36 | 100.4 | 105.4 | 111.3 | 118.4 | 126.9 | 137.6 | 144.4 |
| 7 | −2.15 | 0.063 | 122.51 | 104.5 | 109.6 | 115.5 | 122.5 | 131.1 | 141.9 | 150.1 |
| 8 | −1.85 | 0.060 | 126.57 | 108.4 | 113.6 | 119.6 | 126.6 | 134.9 | 145.0 | 154.5 |
| 9 | −1.20 | 0.057 | 130.80 | 112.0 | 117.5 | 123.8 | 130.8 | 138.8 | 147.9 | 158.4 |
| 10 | −0.32 | 0.055 | 135.44 | 115.3 | 121.6 | 128.3 | 135.4 | 143.2 | 151.5 | 160.5 |
| 11 | 0.68 | 0.054 | 140.64 | 118.5 | 125.7 | 133.1 | 140.6 | 148.3 | 156.1 | 164.0 |
| 12 | 1.64 | 0.054 | 146.18 | 121.1 | 129.8 | 138.1 | 146.2 | 153.9 | 161.5 | 168.8 |
| 13 | 2.43 | 0.054 | 151.73 | 123.5 | 133.9 | 143.2 | 151.7 | 159.6 | 167.0 | 173.9 |
| 14 | 2.88 | 0.054 | 156.97 | 126.2 | 137.9 | 148.0 | 157.0 | 165.0 | 172.4 | 179.3 |
| 15 | 2.87 | 0.052 | 161.56 | 131.4 | 142.8 | 152.7 | 161.6 | 169.6 | 177.0 | 183.8 |
| 16 | 2.24 | 0.049 | 165.19 | 138.2 | 147.9 | 156.8 | 165.2 | 173.1 | 180.5 | 187.6 |
| 17 | 0.84 | 0.043 | 167.53 | 146.1 | 153.2 | 160.4 | 167.5 | 174.8 | 182.0 | 189.4 |
| 18 | −1.48 | 0.033 | 168.25 | 153.4 | 158.0 | 162.9 | 168.3 | 174.0 | 180.4 | 187.3 |
| Girls | ||||||||||
| 2 | −5.20 | 0.050 | 95.91 | 85.8 | 88.5 | 91.7 | 95.9 | 101.6 | 110.4 | 128.3 |
| 3 | −3.31 | 0.059 | 101.41 | 88.2 | 91.8 | 96.1 | 101.4 | 108.3 | 117.8 | 132.4 |
| 4 | −2.13 | 0.063 | 106.59 | 90.1 | 95.3 | 100.5 | 106.6 | 114.1 | 123.4 | 135.8 |
| 5 | −1.50 | 0.065 | 111.51 | 94.0 | 99.0 | 104.8 | 111.5 | 119.4 | 128.9 | 140.4 |
| 6 | −1.26 | 0.064 | 116.23 | 97.9 | 103.2 | 109.3 | 116.2 | 124.3 | 133.6 | 144.8 |
| 7 | −1.25 | 0.062 | 120.82 | 102.2 | 107.7 | 113.8 | 120.8 | 128.9 | 138.2 | 149.3 |
| 8 | −1.33 | 0.059 | 125.32 | 106.9 | 112.3 | 118.4 | 125.3 | 133.3 | 142.5 | 153.3 |
| 9 | −1.32 | 0.057 | 129.79 | 111.2 | 116.7 | 122.8 | 129.8 | 137.7 | 146.9 | 157.5 |
| 10 | −1.08 | 0.055 | 134.31 | 115.4 | 121.1 | 127.3 | 134.3 | 142.1 | 151.0 | 161.1 |
| 11 | −0.50 | 0.055 | 138.87 | 118.5 | 124.8 | 131.5 | 138.9 | 146.8 | 155.5 | 165.0 |
| 12 | 0.29 | 0.056 | 143.33 | 120.7 | 127.9 | 135.5 | 143.3 | 151.5 | 160.0 | 168.9 |
| 13 | 1.13 | 0.058 | 147.47 | 123.5 | 130.2 | 138.9 | 147.5 | 156.0 | 164.5 | 172.9 |
| 14 | 1.84 | 0.058 | 151.10 | 125.5 | 132.6 | 142.1 | 151.1 | 159.7 | 167.9 | 175.7 |
| 15 | 2.23 | 0.058 | 154.01 | 126.6 | 134.7 | 144.7 | 154.0 | 162.6 | 170.7 | 178.4 |
| 16 | 2.15 | 0.055 | 156.01 | 129.2 | 137.6 | 147.1 | 156.0 | 164.3 | 172.2 | 179.7 |
| 17 | 1.40 | 0.049 | 156.88 | 133.1 | 141.2 | 149.1 | 156.9 | 164.5 | 172.0 | 179.3 |
| 18 | −0.17 | 0.040 | 156.43 | 138.9 | 144.5 | 150.3 | 156.4 | 162.8 | 169.6 | 176.6 |
| Age (Years) | Present Study | WHO [13,14] | USCDC [15] | Mushtaq et al. (2012) [26] | Marwaha et al. (2011) [24] | Neyzi et al. (2015) [25] | Zong and Li (2013) [23] |
|---|---|---|---|---|---|---|---|
| Boys | |||||||
| 2 | 96.0 | 87.1 | 86.8 | 88.2 | 88.50 | ||
| 3 | 102.9 | 96.0 | 95.2 | 101.2 | 96.8 | 96.80 | |
| 4 | 108.8 | 103.3 | 102.5 | 106.8 | 104.0 | 104.1 | |
| 5 | 113.9 | 110.1 | 109.1 | 113.3 | 112.4 | 110.4 | 111.1 |
| 6 | 118.4 | 116.0 | 115.6 | 118.2 | 117.7 | 116.1 | 117.7 |
| 7 | 122.5 | 121.7 | 122.0 | 123.5 | 122.9 | 121.5 | 124.0 |
| 8 | 126.6 | 127.3 | 128.1 | 128.6 | 128.1 | 126.9 | 130.0 |
| 9 | 130.8 | 132.6 | 133.7 | 133.3 | 133.3 | 132.1 | 135.4 |
| 10 | 135.4 | 137.8 | 138.8 | 137.2 | 138.6 | 137.6 | 140.2 |
| 11 | 140.6 | 143.1 | 143.7 | 140.5 | 144.2 | 143.8 | 145.3 |
| 12 | 146.2 | 149.1 | 149.3 | 143.2 | 150.1 | 150.6 | 151.9 |
| 13 | 151.7 | 156.0 | 156.4 | 156.1 | 157.7 | 159.5 | |
| 14 | 157.0 | 163.2 | 164.1 | 161.4 | 164.9 | 165.9 | |
| 15 | 161.6 | 169.0 | 170.1 | 165.9 | 170.3 | 169.8 | |
| 16 | 165.2 | 172.9 | 173.6 | 169.2 | 173.4 | 171.6 | |
| 17 | 167.5 | 175.2 | 175.3 | 171.9 | 175.0 | 172.3 | |
| 18 | 168.3 | 176.1 | 176.1 | 174.3 | 176.2 | 172.7 | |
| Girls | |||||||
| 2 | 95.9 | 85.7 | 85.4 | 86.80 | 87.20 | ||
| 3 | 101.4 | 95.0 | 94.2 | 99.4 | 95.40 | 95.60 | |
| 4 | 106.6 | 102.7 | 101.0 | 105.2 | 102.5 | 103.1 | |
| 5 | 111.5 | 109.6 | 107.9 | 114.1 | 110.8 | 109.1 | 110.2 |
| 6 | 116.2 | 115.1 | 115.0 | 118.7 | 116.4 | 115.1 | 116.6 |
| 7 | 120.8 | 120.8 | 121.7 | 123.4 | 121.9 | 121.1 | 122.5 |
| 8 | 125.3 | 126.6 | 127.8 | 128.2 | 127.6 | 126.7 | 128.5 |
| 9 | 129.8 | 132.5 | 133.1 | 133.3 | 133.5 | 132.1 | 134.1 |
| 10 | 134.3 | 138.6 | 138.2 | 138.5 | 139.4 | 137.9 | 140.1 |
| 11 | 138.9 | 145.0 | 144.2 | 143.7 | 145.0 | 145.4 | 146.6 |
| 12 | 143.3 | 151.2 | 151.4 | 148.6 | 149.8 | 153.1 | 152.4 |
| 13 | 147.5 | 156.4 | 157.3 | 153.3 | 157.8 | 156.3 | |
| 14 | 151.1 | 159.8 | 160.4 | 155.5 | 160.4 | 158.6 | |
| 15 | 154.0 | 161.7 | 161.9 | 156.9 | 161.7 | 159.8 | |
| 16 | 156.0 | 162.5 | 161.4 | 157.6 | 162.4 | 160.1 | |
| 17 | 156.9 | 162.9 | 162.5 | 158.1 | 162.7 | 160.3 | |
| 18 | 156.4 | 163.1 | 162.9 | 158.5 | 163.1 | 160.6 |
Publisher’s Note: MDPI stays neutral with regard to jurisdictional claims in published maps and institutional affiliations. |
© 2022 by the authors. Licensee MDPI, Basel, Switzerland. This article is an open access article distributed under the terms and conditions of the Creative Commons Attribution (CC BY) license (https://creativecommons.org/licenses/by/4.0/).
Share and Cite
Asif, M.; Aslam, M.; Mazhar, I.; Ali, H.; Ismail, T.; Matłosz, P.; Wyszyńska, J. Establishing Height-for-Age Z-Score Growth Reference Curves and Stunting Prevalence in Children and Adolescents in Pakistan. Int. J. Environ. Res. Public Health 2022, 19, 12630. https://doi.org/10.3390/ijerph191912630
Asif M, Aslam M, Mazhar I, Ali H, Ismail T, Matłosz P, Wyszyńska J. Establishing Height-for-Age Z-Score Growth Reference Curves and Stunting Prevalence in Children and Adolescents in Pakistan. International Journal of Environmental Research and Public Health. 2022; 19(19):12630. https://doi.org/10.3390/ijerph191912630
Chicago/Turabian StyleAsif, Muhammad, Muhammad Aslam, Iqra Mazhar, Hamza Ali, Tariq Ismail, Piotr Matłosz, and Justyna Wyszyńska. 2022. "Establishing Height-for-Age Z-Score Growth Reference Curves and Stunting Prevalence in Children and Adolescents in Pakistan" International Journal of Environmental Research and Public Health 19, no. 19: 12630. https://doi.org/10.3390/ijerph191912630
APA StyleAsif, M., Aslam, M., Mazhar, I., Ali, H., Ismail, T., Matłosz, P., & Wyszyńska, J. (2022). Establishing Height-for-Age Z-Score Growth Reference Curves and Stunting Prevalence in Children and Adolescents in Pakistan. International Journal of Environmental Research and Public Health, 19(19), 12630. https://doi.org/10.3390/ijerph191912630