
Establishing Height-for-Age Z-Score Growth Reference Curves and Stunting Prevalence in Children and Adolescents in Pakistan

 , , ,
, , ,  and
and 
Abstract
:1. Introduction
2. Materials and Methods
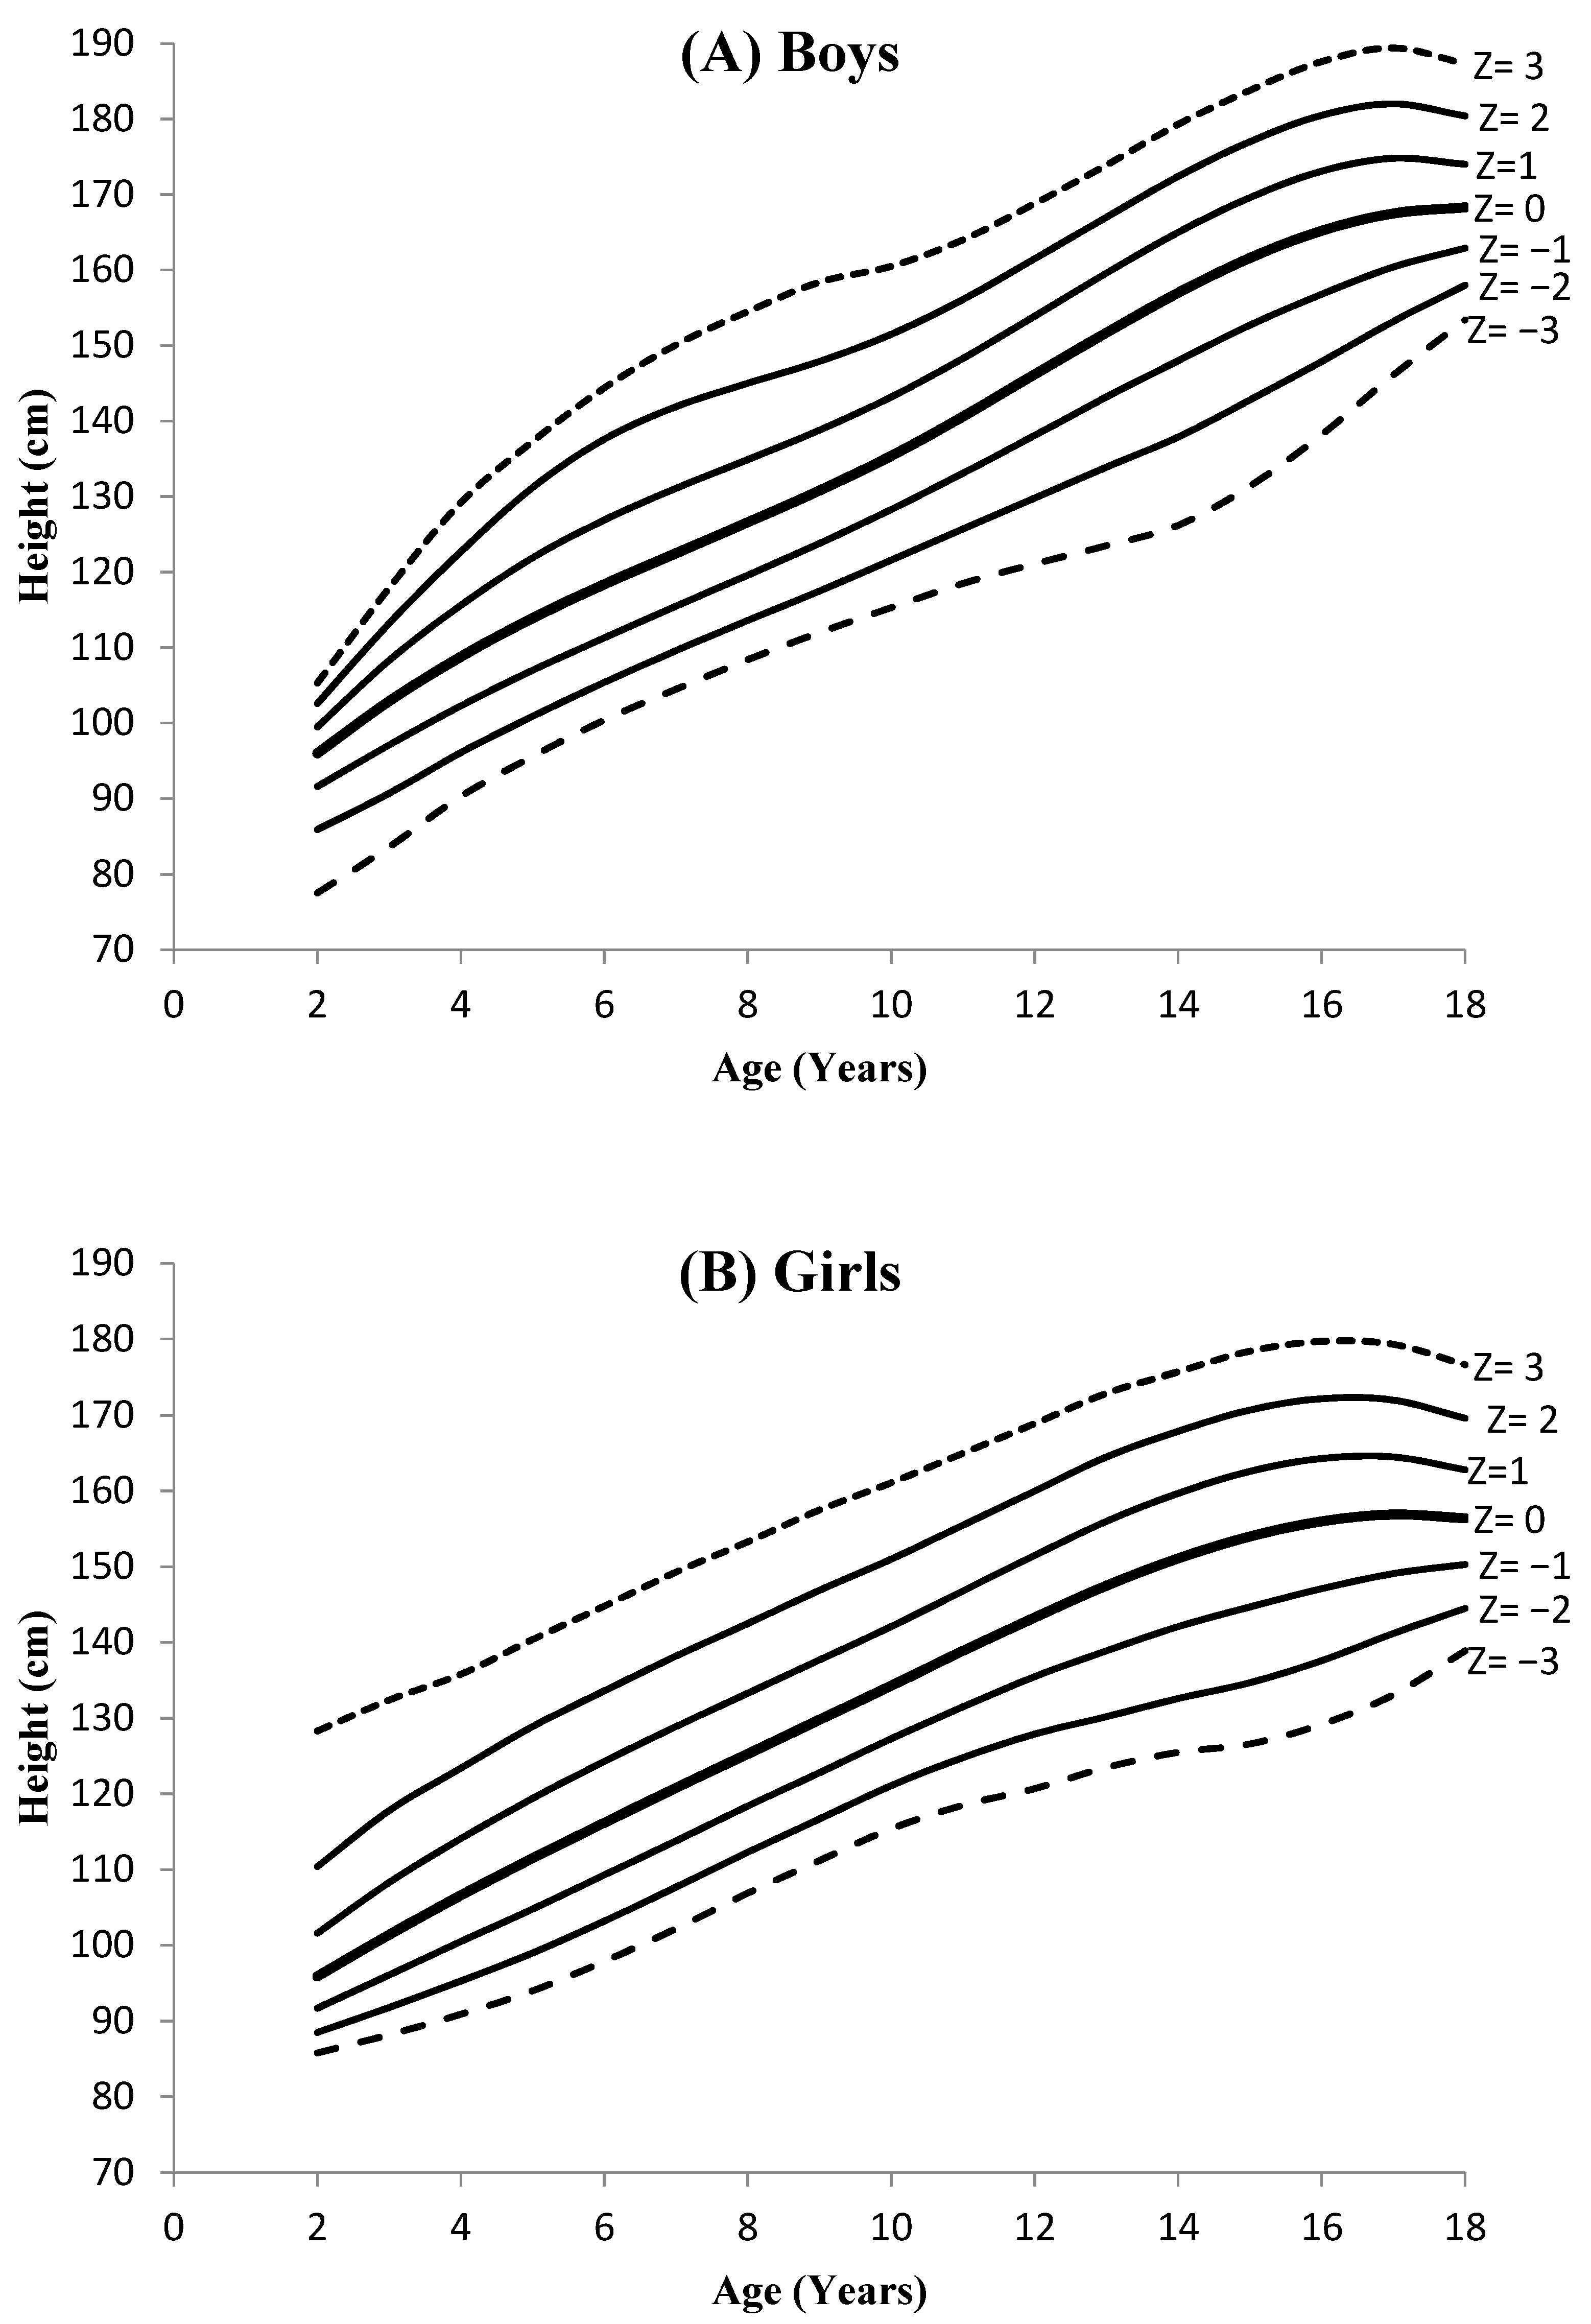
3. Results
4. Discussion
5. Conclusions
Supplementary Materials
Author Contributions
Funding
Institutional Review Board Statement
Informed Consent Statement
Data Availability Statement
Conflicts of Interest
References
- Webb, P.; Stordalen, G.A.; Singh, S.; Wijesinha-Bettoni, R.; Shetty, P.; Lartey, A. Hunger and malnutrition in the 21st century. BMJ 2018, 361, k2238. [Google Scholar] [CrossRef] [PubMed] [Green Version]
- World Health Organization. Physical status: The use and interpretation of anthropometry. Report of a WHO Expert Committee. World Health Organ. Tech. Rep. Ser. 1995, 854, 1–452. [Google Scholar]
- Quamme, S.H.; Iversen, P.O. Prevalence of child stunting in Sub-Saharan Africa and its risk factors. Clin. Nutr. Open Sci. 2022, 42, 49–61. [Google Scholar] [CrossRef]
- World Health Organization. Nutrition in Universal Health Coverage (No. WHO/NMH/NHD/19.24); World Health Organization: Geneva, Switzerland, 2019. [Google Scholar]
- UNICEF. Levels and trends in child malnutrition. In eSocialSciences; UNICEF: New York, NY, USA, 2018. [Google Scholar]
- Sheely, T.; Carey, E.; Sharma, S.; Biadgilign, S. Trends in energy and nutrient supply in Ethopia: A prospective from FAO food balance sheets. Nutr. J. 2019, 18, 1–12. [Google Scholar]
- Mahmood, T.; Abbas, F.; Kumar, R.; Somrongthong, R. Why under five children are stunted in Pakistan? A multilevel analysis of Punjab Multiple Indicator Cluster Survey (MICS- 2014). BMC Public Health 2020, 20, 952. [Google Scholar] [CrossRef] [PubMed]
- Khan, G.N.; Turab, A.; Khan, M.I.; Rizvi, A.; Shaheen, F.; Ullah, A.; Hussain, A.; Hussain, I.; Ahmed, I.; Yaqoob, M.; et al. Prevalence and associated factors of malnutrition among children under five years in Sindh, Pakistan: A cross-sectional stuy. BMC Nutr. 2016, 2, 69. [Google Scholar] [CrossRef]
- World Health Organization; United Nations Children’s Fund; World Bank. Levels and Trends in Child Malnutrition: Key Findings of the 2019 Edition of the Joint Child Malnutrition Estimates; World Health Organization: Geneva, Switzerland, 2019; ISBN 9789240025257 (electronic version). [Google Scholar]
- Development Initiatives. 2018 Global Nutrition Report: Shining a Light to Spur Action on Nutrition; Global Nutrition Report: London, UK, 2018. [Google Scholar]
- United Nations Children’s Fund. Press Release on Global Nutrition Report 2018; United Nations Children’s Fund: New York, NY, USA, 2018. [Google Scholar]
- UNICEF. Government of Pakistan. The 2018 Pakistan National Nutrition Survey; UNICEF: New York, NY, USA, 2018. [Google Scholar]
- World Health Organization. WHO Child Growth Standards: Length/Height-for-Age, Weight-for-Age, Weight-for-Length, Weight-for-Height and Body Mass Index-for-Age: Methods and Development; World Health Organization: Geneva, Switzerland, 2006; ISBN 924154693X. [Google Scholar]
- de Onis, M.; Onyango, A.W.; Borghi, E.; Siyam, A.; Nishida, C.; Siekmann, J. Development of a WHO growth reference for school-aged children and adolescents. Bull. World Health Organ. 2007, 85, 660–667. [Google Scholar] [CrossRef]
- Kuczmarski, R.J.; Ogden, C.L.; Guo, S.S.; Grummer-Strawn, L.M.; Flegal, K.M.; Mei, Z.; Wei, R.; Curtin, L.R.; Roche, A.F.; Johnson, C.L. 2000 CDC Growth Charts for the United States: Methods and development. Vital Health Stat. 2002, 11, 1–190. [Google Scholar]
- Preedy, V.R. Handbook of Anthropometry: Physical Measures of Human form in Health and Disease; Springer Science & Business Media: Berlin, Germany, 2012; ISBN 1441917888. [Google Scholar]
- Natale, V.; Rajagopalan, A. Worldwide variation in human growth and the World Health Organization growth standards: A systematic review. BMJ Open. 2014, 4, e003735. [Google Scholar] [CrossRef] [Green Version]
- Payandeh, A.; Shakeri, M.T.; Safarian, M.; Tabesh, H. Application of non-parametric quantile regression for fitting height-for-age curves. Gundishapur. J. Health Sci. 2014, 6, 221–226. [Google Scholar]
- Kato, N.; Takimoto, H.; Yokoyama, P.; Yokoya, S.; Tanaka, T.; Tada, H. Updated Japanese growth references for infants and preschool children, based on historical, ethnic and environmental characteristics. Acta Pediatr. 2014, 103, 251–261. [Google Scholar] [CrossRef] [PubMed] [Green Version]
- Asif, M.; Aslam, M.; Altaf, S.; Mustafa, S. Developing waist circumference, waist-to-height ratio percentile curves for Pakistani children and adolescents aged 2–18 years using Lambda-Mu-Sigma (LMS) method. J. Pediatr. Endocrinol. Metab. 2020, 33, 983–993. [Google Scholar] [CrossRef] [PubMed]
- Asif, M.; Aslam, M.; Khan, S.; Altaf, S.; Ahmad, S.; Qasim, M.; Ali, H.; Wyszyńska, J. Developing neck circumference growth reference charts for Pakistani children and adolescents using the lambda–mu–sigma and quantile regression method. Public Health Nutr. 2021, 24, 5641–5649. [Google Scholar] [CrossRef]
- Asif, M.; Aslam, M.; Wyszyńska, J.; Altaf, S. Establishing body mass index growth charts for Pakistani children and adolescents using the Lambda-Mu-Sigma (LMS) and quantile regression method. Minerva Pediatr. 2020. [Google Scholar] [CrossRef]
- Zong, X.-N.; Li, H. Construction of a New Growth References for China Based on Urban Chinese Children: Comparison with the WHO Growth Standards. PLoS ONE 2013, 8, e59569. [Google Scholar] [CrossRef] [PubMed] [Green Version]
- Marwaha, R.K.; Tandon, N.; Ganie, M.A.; Kanwar, R.; Shivaprasad, C.; Sabharwal, A.; Bhadra, K.; Narang, A. Nationwide reference data for height, weight and body mass index of Indian schoolchildren. Natl. Med. J. India 2011, 24, 269–277. [Google Scholar]
- Neyzi, O.; Furman, A.; Bundak, R.; Gunoz, H.; Darendeliler, F.; Bas, F. Growth references for Turkish children aged 6 to 18 years. Acta Paediatr. 2006, 95, 1635–1641. [Google Scholar] [CrossRef]
- Mushtaq, M.U.; Gull, S.; Mushtaq, K.; Abdullah, H.M.; Khurshid, U.; Shahid, U.; Shad, M.A.; Akram, J. Height, weight and BMI percentiles and nutritional status relative to the international growth references among Pakistani school-aged children. BMC Pediatr. 2012, 12, 31. [Google Scholar] [CrossRef] [Green Version]
- Qaisar, R.; Karim, A. A comparison of international and national references to measure the prevalence of stunting in Pakistani school-age girls. Sci. Rep. 2022, 12, 5501. [Google Scholar] [CrossRef]
- Asif, M.; Aslam, M.; Qasim, M.; Altaf, S.; Ismail, A.; Ali, H. A dataset about anthropometric measurements of the Pakistani children and adolescents using a cross-sectional multi-ethnic anthropometric survey. Data Br. 2021, 34, 106642. [Google Scholar] [CrossRef]
- Asif, M.; Aslam, M.; Sajid, M.; Saima, A. Age-specific differences and interrelation between anthropometric variables in Pakistani children aged 2 to 19 years. Rawal Med. J. 2018, 43, 164. [Google Scholar]
- World Medical Association World Medical Association Declaration of Helsinki: Ethical Principles for Medical Research Involving Human Subjects. JAMA 2013, 310, 2191–2194. [CrossRef] [PubMed] [Green Version]
- Cole, T.J.; Green, P.J. Smoothing reference centile curves: The lms method and penalized likelihood. Stat. Med. 1992, 11, 1305–1319. [Google Scholar] [CrossRef] [PubMed]
- McHugh, M.L. Interrater reliability: The kappa statistic. Biochem. Med. 2012, 22, 276–282. [Google Scholar] [CrossRef]
- Jafar, T.H.; Qadri, Z.; Islam, M.; Hatcher, J.; Bhutta, Z.A.; Chaturvedi, N. Rise in childhood obesity with persistently high rates of undernutrition among urban school-aged Indo-Asian children. Arch. Dis. Child. 2008, 93, 373–378. [Google Scholar] [CrossRef]
- Mushtaq, M.U.; Gull, S.; Khurshid, U.; Shahid, U.; Shad, M.A.; Siddiqui, A.M. Prevalence and socio-demographic correlates of stunting and thinness among Pakistani primary school children. BMC Public Health 2011, 11, 790. [Google Scholar] [CrossRef]
- Khuwaja, S.; Selwyn, B.J.; Shah, S.M. Prevalence and Correlates of Stunting among Primary School Children in Rural Areas of Southern Pakistan. J. Trop. Pediatr. 2005, 51, 72–77. [Google Scholar] [CrossRef]

| Age (Years) | Boys | Girls | ||||||||
|---|---|---|---|---|---|---|---|---|---|---|
| N | Mean ± SD | Stunting a (%) | Stunting b (%) | Stunting c (%) | N | Mean ± SD | Stunting a (%) | Stunting b (%) | Stunting c (%) | |
| 02 | 19 | 96.58 ± 4.03 | 5.3 | 0 | 0 | 43 | 96.37 ± 4.75 NS | 0 | 0 | 0 |
| 03 | 100 | 102.69 ± 5.82 | 1.0 | 0 | 0 | 170 | 101.71 ± 6.50 NS | 1.8 | 0 | 0 |
| 04 | 208 | 108.54 ± 8.43 | 8.2 | 2.4 | 2.9 | 313 | 106.45 ± 7.91 S | 5.4 | 2.9 | 2.2 |
| 05 | 240 | 112.78 ± 7.13 | 5.8 | 5.0 | 5.0 | 381 | 111.30 ± 7.38 S | 3.4 | 4.2 | 6.6 |
| 06 | 292 | 119.36 ± 7.81 | 3.4 | 4.5 | 7.9 | 405 | 117.15 ± 6.99 S | 1.2 | 2.0 | 4.0 |
| 07 | 279 | 123.70 ± 7.18 | 2.5 | 3.9 | 6.1 | 381 | 122.21 ± 7.64 S | 1.6 | 3.1 | 8.4 |
| 08 | 273 | 128.21 ± 7.63 | 2.9 | 2.6 | 7.3 | 376 | 127.55 ± 8.07 NS | 1.6 | 2.9 | 8.0 |
| 09 | 247 | 132.65 ± 7.18 | 3.2 | 3.6 | 8.9 | 336 | 130.73 ± 6.65 S | 1.2 | 5.7 | 11.3 |
| 10 | 420 | 139.19 ± 7.76 | 2.1 | 3.3 | 14.5 | 459 | 132.59 ± 7.93 S | 5.2 | 15.9 | 26.4 |
| 11 | 439 | 140.09 ± 7.89 | 2.3 | 5.9 | 15.0 | 325 | 138.37 ± 8.05 NS | 1.2 | 17.2 | 21.8 |
| 12 | 675 | 144.45 ± 8.28 | 2.4 | 9.3 | 19.1 | 436 | 142.97 ± 8.60 S | 3.9 | 26.8 | 34.4 |
| 13 | 593 | 149.07 ± 9.28 | 5.2 | 18.0 | 25.5 | 460 | 148.96 ± 8.77 NS | 1.5 | 23.7 | 38.3 |
| 14 | 563 | 156.52 ± 9.28 | 5.2 | 16.0 | 23.8 | 341 | 150.50 ± 8.87 S | 2.6 | 30.8 | 38.7 |
| 15 | 546 | 162.98 ± 7.77 | 1.6 | 11.2 | 17.6 | 257 | 153.33 ± 8.27 S | 1.2 | 23.3 | 42.8 |
| 16 | 381 | 165.83 ± 7.37 | 1.8 | 11.3 | 21.0 | 191 | 155.97 ± 9.81 S | 3.1 | 19.4 | 30.4 |
| 17 | 169 | 167.66 ± 6.41 | 3.0 | 7.7 | 23.1 | 129 | 157.01 ± 5.74 S | 0 | 10.1 | 20.9 |
| 18 | 95 | 167.78 ± 6.71 | 7.4 | 16.8 | 32.6 | 126 | 157.33 ± 5.74 S | 4.8 | 11.1 | 21.4 |
| Age groups (years) | ||||||||||
| 2–10 | 2078 | 123.23 ± 12.92 | 3.6 | 3.4 | 7.7 | 2864 | 120.16 ± 12.76 S | 2.7 | 5.2 | 9.4 |
| 11–18 | 3461 | 153.77 ± 12.61 | 3.3 | 12.1 | 21.0 | 2265 | 148.47 ± 10.37 S | 2.3 | 22.6 | 33.2 |
| 02–18 | 5539 | 142.31 ± 19.51 | 3.4 | 8.8 | 16.0 | 5129 | 132.66 ± 10.33 S | 2.5 | 12.8 | 19.9 |
| City of residence | ||||||||||
| Lahore | 2839 | 142.20 ± 19.30 | 2.7 | 8.3 | 16.0 | 2091 | 135.04 ± 19.52 S | 2.1 | 11.5 | 18.7 |
| R. pindi/Isl | 1764 | 142.81 ± 21.01 | 2.8 | 7.5 | 13.7 | 1926 | 131.35 ± 17.01 S | 2.6 | 14.0 | 21.0 |
| Multan | 936 | 141.73 ± 18.01 | 6.7 | 12.9 | 20.6 | 1112 | 130.46 ± 17.59 S | 3.1 | 13.3 | 20.3 |
| F = 1.05(p = 0.349) | F = 30.97(p = 0.000) | |||||||||
| Age (Years) | L | S | M | Z = −3 | Z = −2 | Z = −1 | Z = 0 | Z = 1 | Z = 2 | Z = 3 |
|---|---|---|---|---|---|---|---|---|---|---|
| Boys | ||||||||||
| 2 | 5.73 | 0.041 | 95.95 | 77.5 | 85.9 | 91.6 | 96.0 | 99.5 | 102.6 | 105.3 |
| 3 | 2.51 | 0.054 | 102.92 | 83.6 | 90.7 | 97.1 | 102.9 | 108.3 | 113.2 | 117.9 |
| 4 | 0.23 | 0.061 | 108.81 | 90.3 | 96.1 | 102.3 | 108.8 | 115.6 | 122.7 | 129.2 |
| 5 | −1.23 | 0.065 | 113.88 | 95.6 | 100.9 | 107.0 | 113.9 | 121.9 | 131.2 | 137.3 |
| 6 | −1.98 | 0.065 | 118.36 | 100.4 | 105.4 | 111.3 | 118.4 | 126.9 | 137.6 | 144.4 |
| 7 | −2.15 | 0.063 | 122.51 | 104.5 | 109.6 | 115.5 | 122.5 | 131.1 | 141.9 | 150.1 |
| 8 | −1.85 | 0.060 | 126.57 | 108.4 | 113.6 | 119.6 | 126.6 | 134.9 | 145.0 | 154.5 |
| 9 | −1.20 | 0.057 | 130.80 | 112.0 | 117.5 | 123.8 | 130.8 | 138.8 | 147.9 | 158.4 |
| 10 | −0.32 | 0.055 | 135.44 | 115.3 | 121.6 | 128.3 | 135.4 | 143.2 | 151.5 | 160.5 |
| 11 | 0.68 | 0.054 | 140.64 | 118.5 | 125.7 | 133.1 | 140.6 | 148.3 | 156.1 | 164.0 |
| 12 | 1.64 | 0.054 | 146.18 | 121.1 | 129.8 | 138.1 | 146.2 | 153.9 | 161.5 | 168.8 |
| 13 | 2.43 | 0.054 | 151.73 | 123.5 | 133.9 | 143.2 | 151.7 | 159.6 | 167.0 | 173.9 |
| 14 | 2.88 | 0.054 | 156.97 | 126.2 | 137.9 | 148.0 | 157.0 | 165.0 | 172.4 | 179.3 |
| 15 | 2.87 | 0.052 | 161.56 | 131.4 | 142.8 | 152.7 | 161.6 | 169.6 | 177.0 | 183.8 |
| 16 | 2.24 | 0.049 | 165.19 | 138.2 | 147.9 | 156.8 | 165.2 | 173.1 | 180.5 | 187.6 |
| 17 | 0.84 | 0.043 | 167.53 | 146.1 | 153.2 | 160.4 | 167.5 | 174.8 | 182.0 | 189.4 |
| 18 | −1.48 | 0.033 | 168.25 | 153.4 | 158.0 | 162.9 | 168.3 | 174.0 | 180.4 | 187.3 |
| Girls | ||||||||||
| 2 | −5.20 | 0.050 | 95.91 | 85.8 | 88.5 | 91.7 | 95.9 | 101.6 | 110.4 | 128.3 |
| 3 | −3.31 | 0.059 | 101.41 | 88.2 | 91.8 | 96.1 | 101.4 | 108.3 | 117.8 | 132.4 |
| 4 | −2.13 | 0.063 | 106.59 | 90.1 | 95.3 | 100.5 | 106.6 | 114.1 | 123.4 | 135.8 |
| 5 | −1.50 | 0.065 | 111.51 | 94.0 | 99.0 | 104.8 | 111.5 | 119.4 | 128.9 | 140.4 |
| 6 | −1.26 | 0.064 | 116.23 | 97.9 | 103.2 | 109.3 | 116.2 | 124.3 | 133.6 | 144.8 |
| 7 | −1.25 | 0.062 | 120.82 | 102.2 | 107.7 | 113.8 | 120.8 | 128.9 | 138.2 | 149.3 |
| 8 | −1.33 | 0.059 | 125.32 | 106.9 | 112.3 | 118.4 | 125.3 | 133.3 | 142.5 | 153.3 |
| 9 | −1.32 | 0.057 | 129.79 | 111.2 | 116.7 | 122.8 | 129.8 | 137.7 | 146.9 | 157.5 |
| 10 | −1.08 | 0.055 | 134.31 | 115.4 | 121.1 | 127.3 | 134.3 | 142.1 | 151.0 | 161.1 |
| 11 | −0.50 | 0.055 | 138.87 | 118.5 | 124.8 | 131.5 | 138.9 | 146.8 | 155.5 | 165.0 |
| 12 | 0.29 | 0.056 | 143.33 | 120.7 | 127.9 | 135.5 | 143.3 | 151.5 | 160.0 | 168.9 |
| 13 | 1.13 | 0.058 | 147.47 | 123.5 | 130.2 | 138.9 | 147.5 | 156.0 | 164.5 | 172.9 |
| 14 | 1.84 | 0.058 | 151.10 | 125.5 | 132.6 | 142.1 | 151.1 | 159.7 | 167.9 | 175.7 |
| 15 | 2.23 | 0.058 | 154.01 | 126.6 | 134.7 | 144.7 | 154.0 | 162.6 | 170.7 | 178.4 |
| 16 | 2.15 | 0.055 | 156.01 | 129.2 | 137.6 | 147.1 | 156.0 | 164.3 | 172.2 | 179.7 |
| 17 | 1.40 | 0.049 | 156.88 | 133.1 | 141.2 | 149.1 | 156.9 | 164.5 | 172.0 | 179.3 |
| 18 | −0.17 | 0.040 | 156.43 | 138.9 | 144.5 | 150.3 | 156.4 | 162.8 | 169.6 | 176.6 |
| Age (Years) | Present Study | WHO [13,14] | USCDC [15] | Mushtaq et al. (2012) [26] | Marwaha et al. (2011) [24] | Neyzi et al. (2015) [25] | Zong and Li (2013) [23] |
|---|---|---|---|---|---|---|---|
| Boys | |||||||
| 2 | 96.0 | 87.1 | 86.8 | 88.2 | 88.50 | ||
| 3 | 102.9 | 96.0 | 95.2 | 101.2 | 96.8 | 96.80 | |
| 4 | 108.8 | 103.3 | 102.5 | 106.8 | 104.0 | 104.1 | |
| 5 | 113.9 | 110.1 | 109.1 | 113.3 | 112.4 | 110.4 | 111.1 |
| 6 | 118.4 | 116.0 | 115.6 | 118.2 | 117.7 | 116.1 | 117.7 |
| 7 | 122.5 | 121.7 | 122.0 | 123.5 | 122.9 | 121.5 | 124.0 |
| 8 | 126.6 | 127.3 | 128.1 | 128.6 | 128.1 | 126.9 | 130.0 |
| 9 | 130.8 | 132.6 | 133.7 | 133.3 | 133.3 | 132.1 | 135.4 |
| 10 | 135.4 | 137.8 | 138.8 | 137.2 | 138.6 | 137.6 | 140.2 |
| 11 | 140.6 | 143.1 | 143.7 | 140.5 | 144.2 | 143.8 | 145.3 |
| 12 | 146.2 | 149.1 | 149.3 | 143.2 | 150.1 | 150.6 | 151.9 |
| 13 | 151.7 | 156.0 | 156.4 | 156.1 | 157.7 | 159.5 | |
| 14 | 157.0 | 163.2 | 164.1 | 161.4 | 164.9 | 165.9 | |
| 15 | 161.6 | 169.0 | 170.1 | 165.9 | 170.3 | 169.8 | |
| 16 | 165.2 | 172.9 | 173.6 | 169.2 | 173.4 | 171.6 | |
| 17 | 167.5 | 175.2 | 175.3 | 171.9 | 175.0 | 172.3 | |
| 18 | 168.3 | 176.1 | 176.1 | 174.3 | 176.2 | 172.7 | |
| Girls | |||||||
| 2 | 95.9 | 85.7 | 85.4 | 86.80 | 87.20 | ||
| 3 | 101.4 | 95.0 | 94.2 | 99.4 | 95.40 | 95.60 | |
| 4 | 106.6 | 102.7 | 101.0 | 105.2 | 102.5 | 103.1 | |
| 5 | 111.5 | 109.6 | 107.9 | 114.1 | 110.8 | 109.1 | 110.2 |
| 6 | 116.2 | 115.1 | 115.0 | 118.7 | 116.4 | 115.1 | 116.6 |
| 7 | 120.8 | 120.8 | 121.7 | 123.4 | 121.9 | 121.1 | 122.5 |
| 8 | 125.3 | 126.6 | 127.8 | 128.2 | 127.6 | 126.7 | 128.5 |
| 9 | 129.8 | 132.5 | 133.1 | 133.3 | 133.5 | 132.1 | 134.1 |
| 10 | 134.3 | 138.6 | 138.2 | 138.5 | 139.4 | 137.9 | 140.1 |
| 11 | 138.9 | 145.0 | 144.2 | 143.7 | 145.0 | 145.4 | 146.6 |
| 12 | 143.3 | 151.2 | 151.4 | 148.6 | 149.8 | 153.1 | 152.4 |
| 13 | 147.5 | 156.4 | 157.3 | 153.3 | 157.8 | 156.3 | |
| 14 | 151.1 | 159.8 | 160.4 | 155.5 | 160.4 | 158.6 | |
| 15 | 154.0 | 161.7 | 161.9 | 156.9 | 161.7 | 159.8 | |
| 16 | 156.0 | 162.5 | 161.4 | 157.6 | 162.4 | 160.1 | |
| 17 | 156.9 | 162.9 | 162.5 | 158.1 | 162.7 | 160.3 | |
| 18 | 156.4 | 163.1 | 162.9 | 158.5 | 163.1 | 160.6 |
Publisher’s Note: MDPI stays neutral with regard to jurisdictional claims in published maps and institutional affiliations. |
© 2022 by the authors. Licensee MDPI, Basel, Switzerland. This article is an open access article distributed under the terms and conditions of the Creative Commons Attribution (CC BY) license (https://creativecommons.org/licenses/by/4.0/).
Share and Cite
Asif, M.; Aslam, M.; Mazhar, I.; Ali, H.; Ismail, T.; Matłosz, P.; Wyszyńska, J. Establishing Height-for-Age Z-Score Growth Reference Curves and Stunting Prevalence in Children and Adolescents in Pakistan. Int. J. Environ. Res. Public Health 2022, 19, 12630. https://doi.org/10.3390/ijerph191912630
Asif M, Aslam M, Mazhar I, Ali H, Ismail T, Matłosz P, Wyszyńska J. Establishing Height-for-Age Z-Score Growth Reference Curves and Stunting Prevalence in Children and Adolescents in Pakistan. International Journal of Environmental Research and Public Health. 2022; 19(19):12630. https://doi.org/10.3390/ijerph191912630
Chicago/Turabian StyleAsif, Muhammad, Muhammad Aslam, Iqra Mazhar, Hamza Ali, Tariq Ismail, Piotr Matłosz, and Justyna Wyszyńska. 2022. "Establishing Height-for-Age Z-Score Growth Reference Curves and Stunting Prevalence in Children and Adolescents in Pakistan" International Journal of Environmental Research and Public Health 19, no. 19: 12630. https://doi.org/10.3390/ijerph191912630
APA StyleAsif, M., Aslam, M., Mazhar, I., Ali, H., Ismail, T., Matłosz, P., & Wyszyńska, J. (2022). Establishing Height-for-Age Z-Score Growth Reference Curves and Stunting Prevalence in Children and Adolescents in Pakistan. International Journal of Environmental Research and Public Health, 19(19), 12630. https://doi.org/10.3390/ijerph191912630