
Changes in Public Sentiment under the Background of Major Emergencies—Taking the Shanghai Epidemic as an Example

Abstract
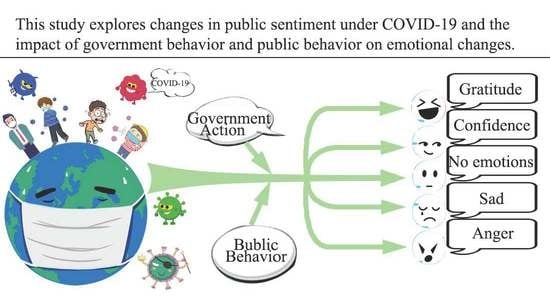
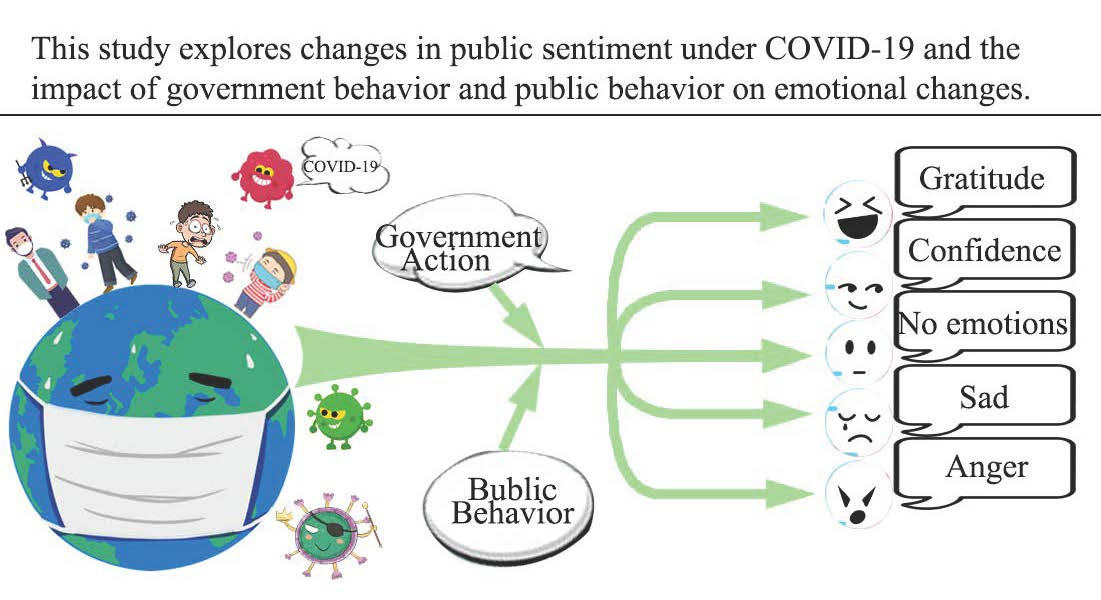
1. Introduction
2. Deep Learning in the Emotion Domain
3. Methodology
3.1. Study Design
3.2. Data Sources
3.2.1. Acquisition of Weibo Comment Data
3.2.2. Data Preprocessing
 represents
sadness,
represents
sadness,  represents bitterness, and
  represents gratitude. Accordingly, the expressions in the
comments were converted into their text equivalent. (6) Punctuation and special
symbols were removed to obtain higher accuracy for the ERNIE pre-training
model. (7) We also checked the posting volume of Weibo accounts and the posting
time of recent Weibo accounts to ensure that the users of Weibo and the Weibo
accounts were not fake or fraudulent. After cleaning, 89,468 valid comment data
were obtained. The response rate of the participants was 66.85%.
represents gratitude. Accordingly, the expressions in the
comments were converted into their text equivalent. (6) Punctuation and special
symbols were removed to obtain higher accuracy for the ERNIE pre-training
model. (7) We also checked the posting volume of Weibo accounts and the posting
time of recent Weibo accounts to ensure that the users of Weibo and the Weibo
accounts were not fake or fraudulent. After cleaning, 89,468 valid comment data
were obtained. The response rate of the participants was 66.85%.3.3. Methods
3.3.1. Lexical Analysis of Chinese (LAC)
3.3.2. Keyword Weight Calculation
3.3.3. ERNIE Pre-Training Model
3.3.4. Estimating Transfer Entropy via Copula Entropy
3.3.5. Semantic Network Analysis
4. Results
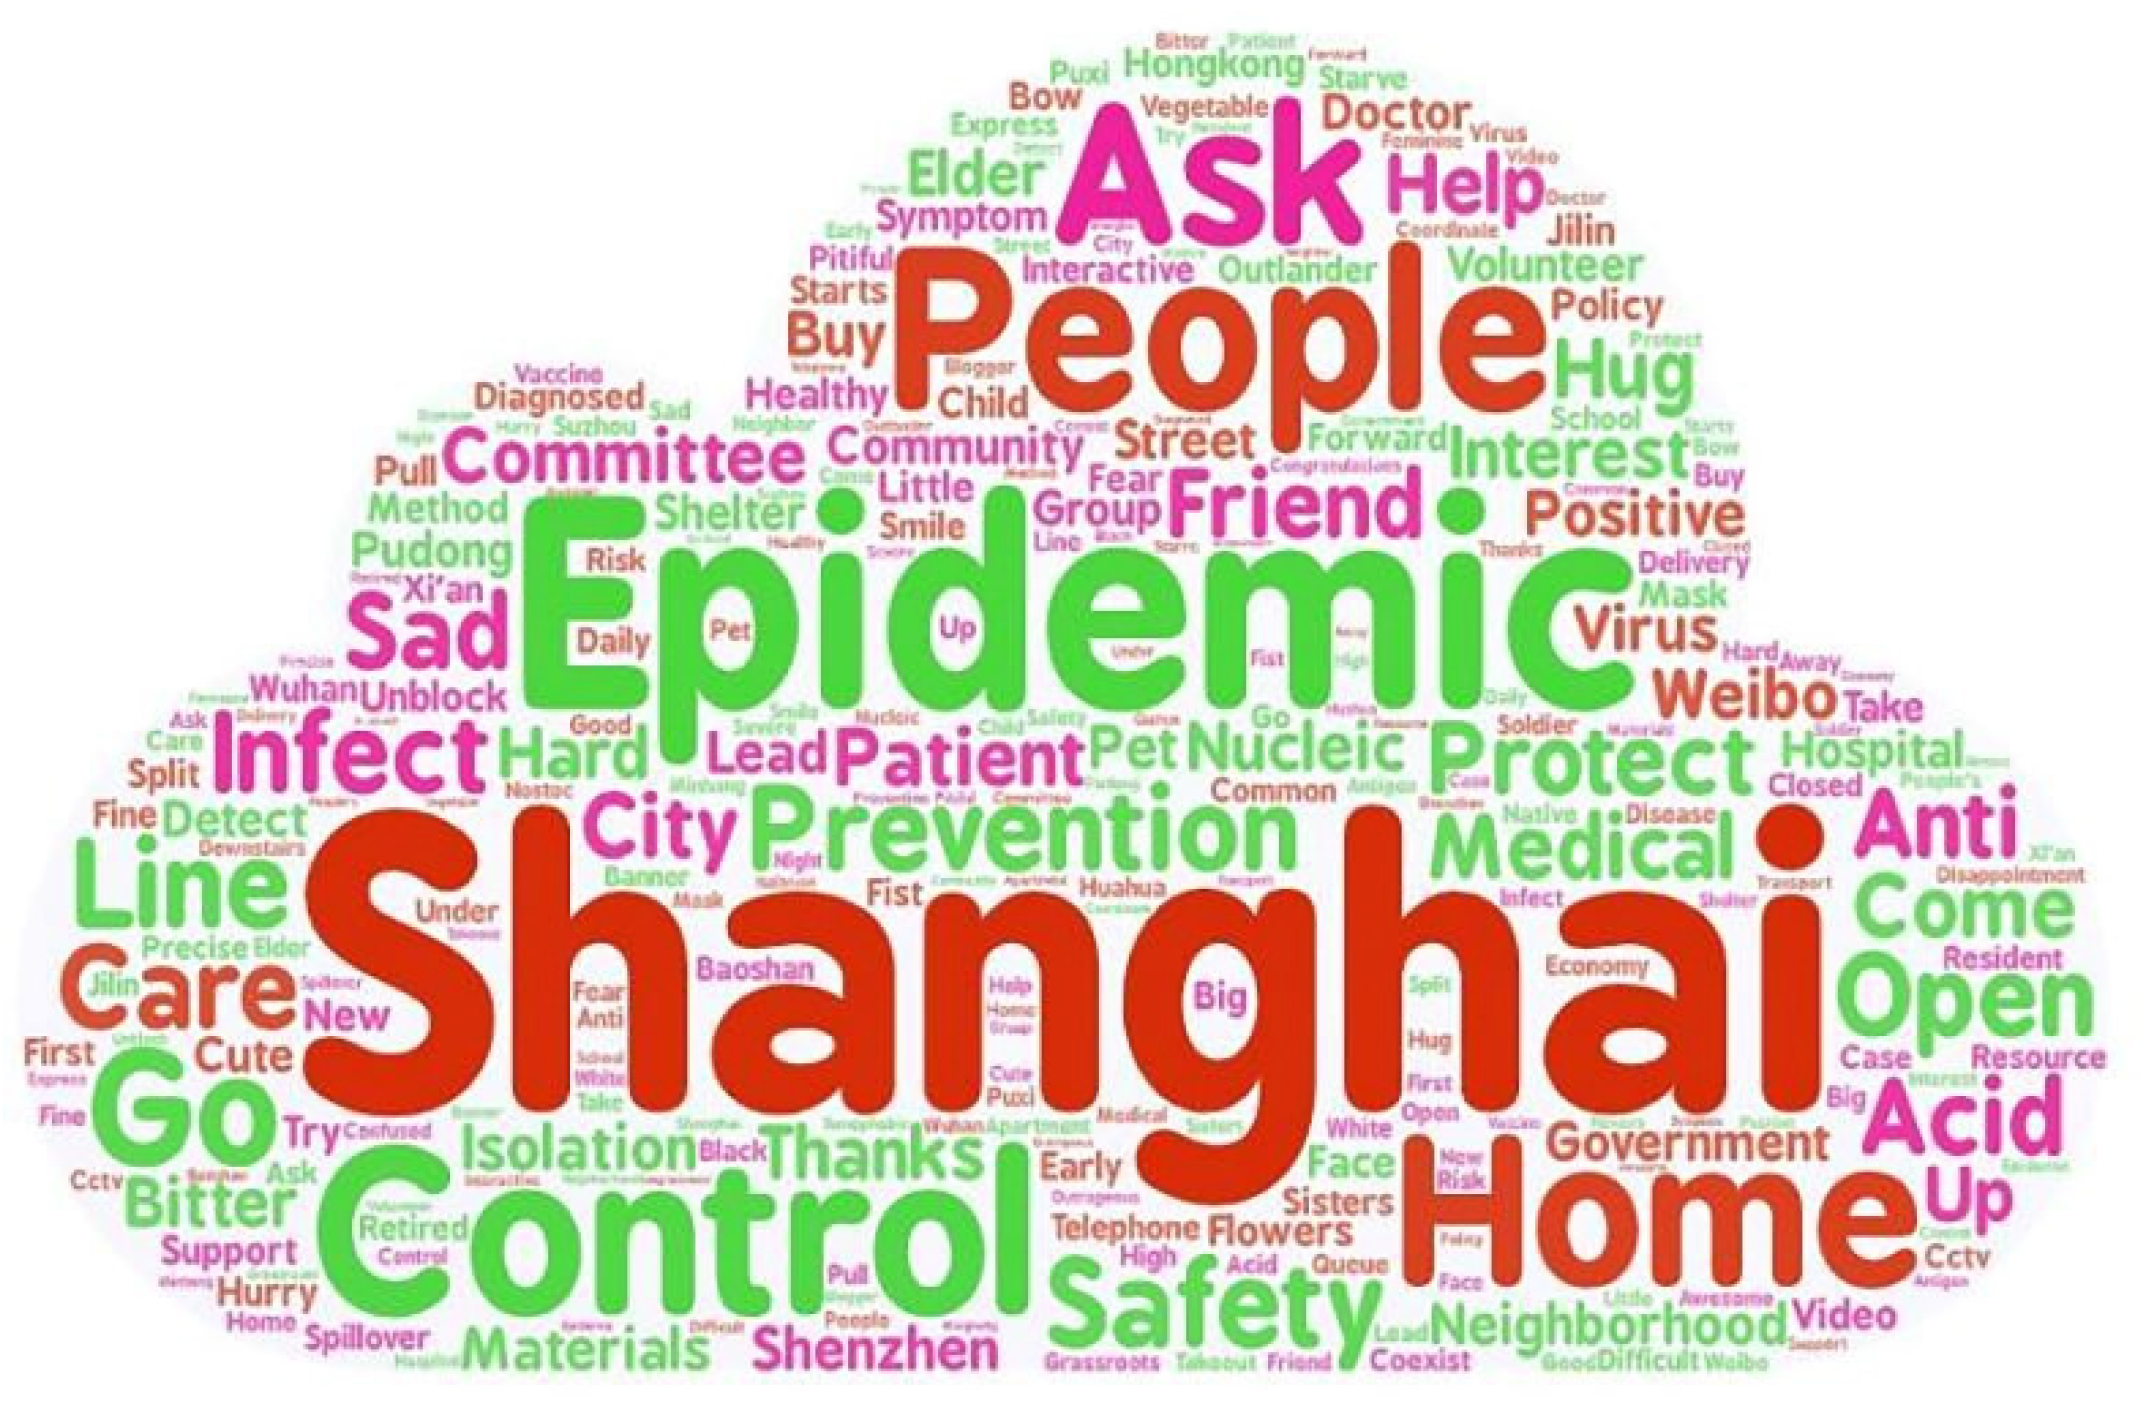
4.1. Data Analysis
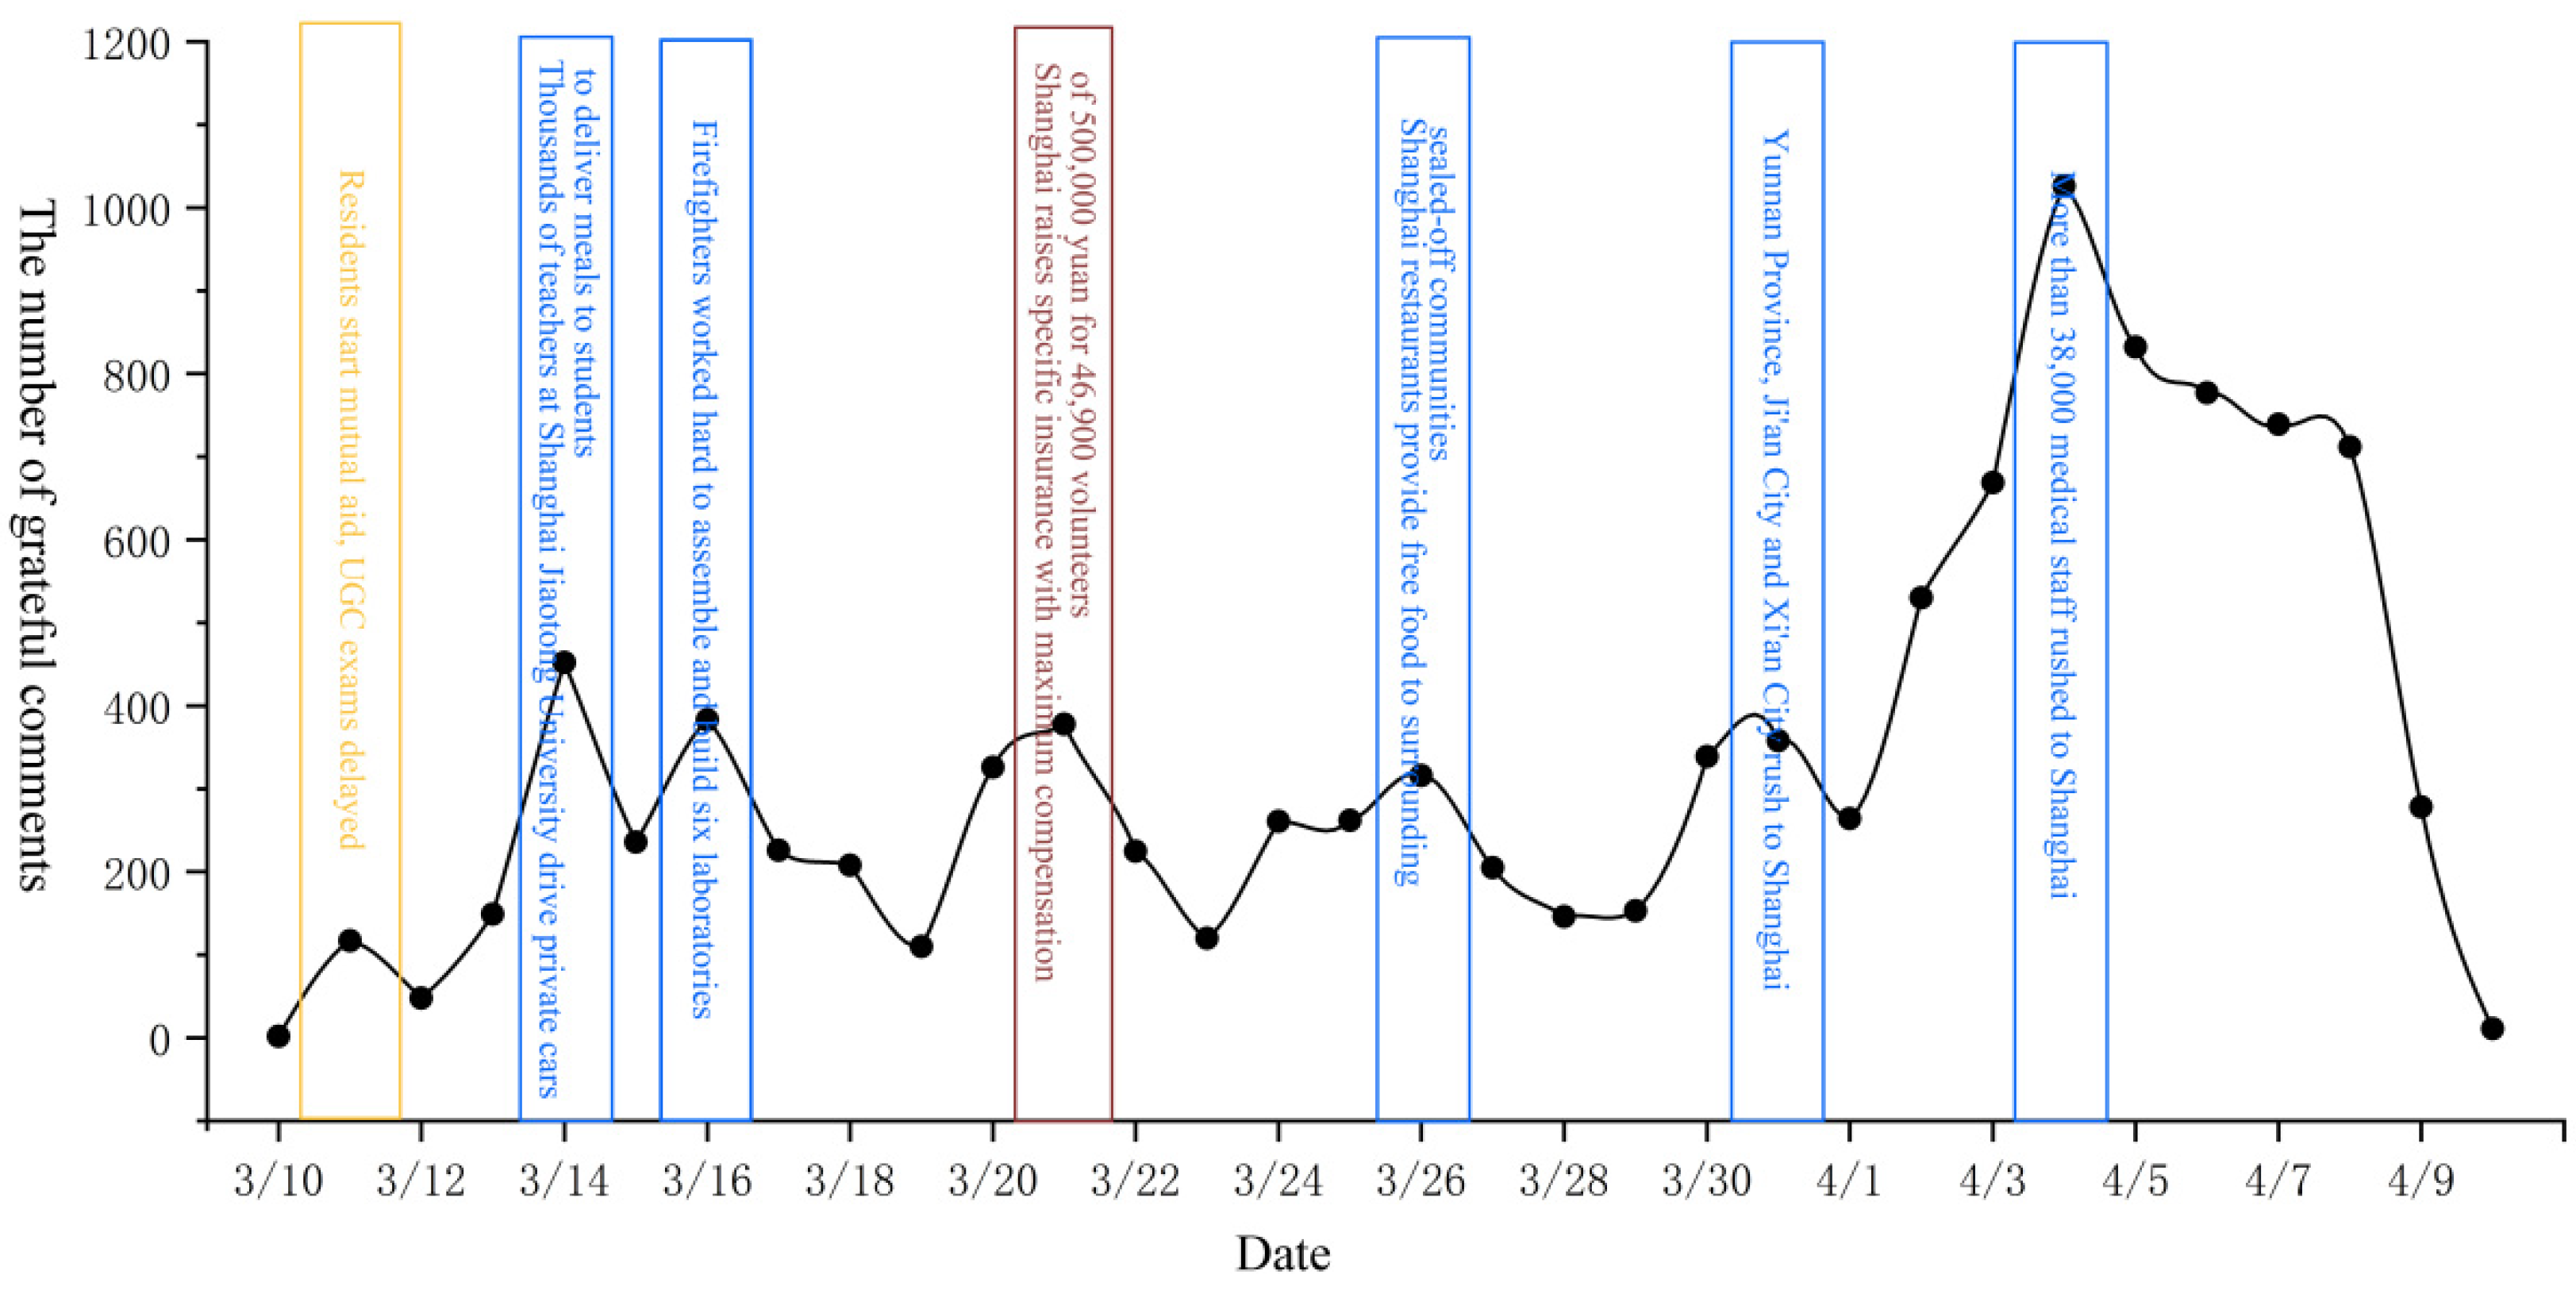
4.2. Temporal Changes in Emotion Classification
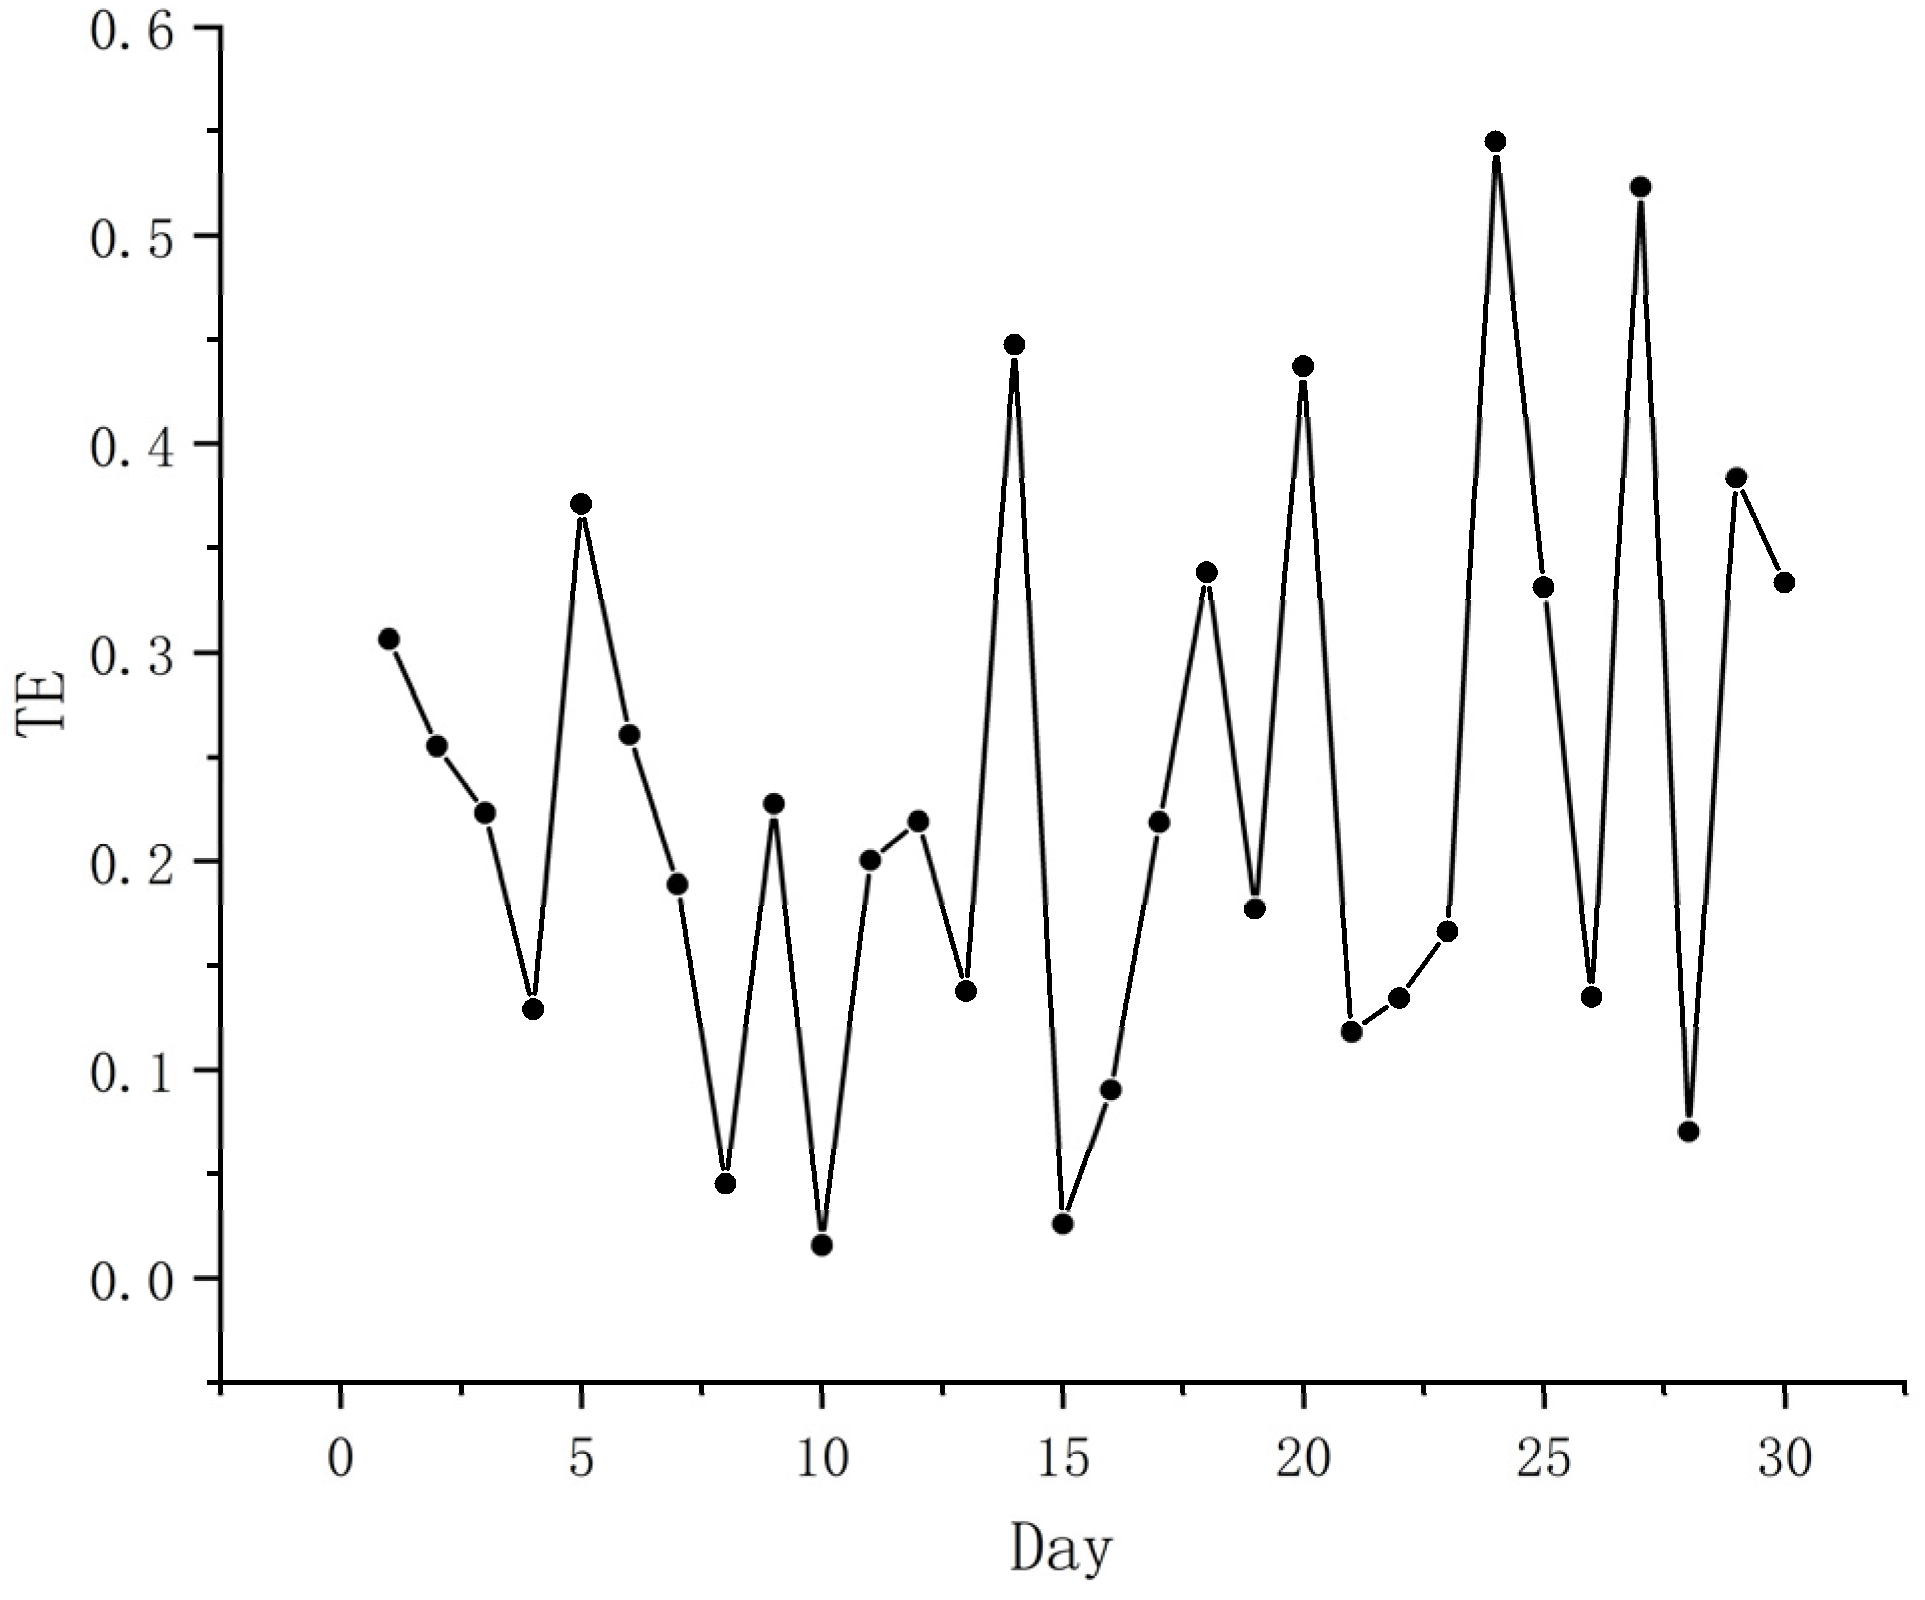
4.3. Analysis of Causality
4.4. Social Network Analysis in Different Emotional Periods
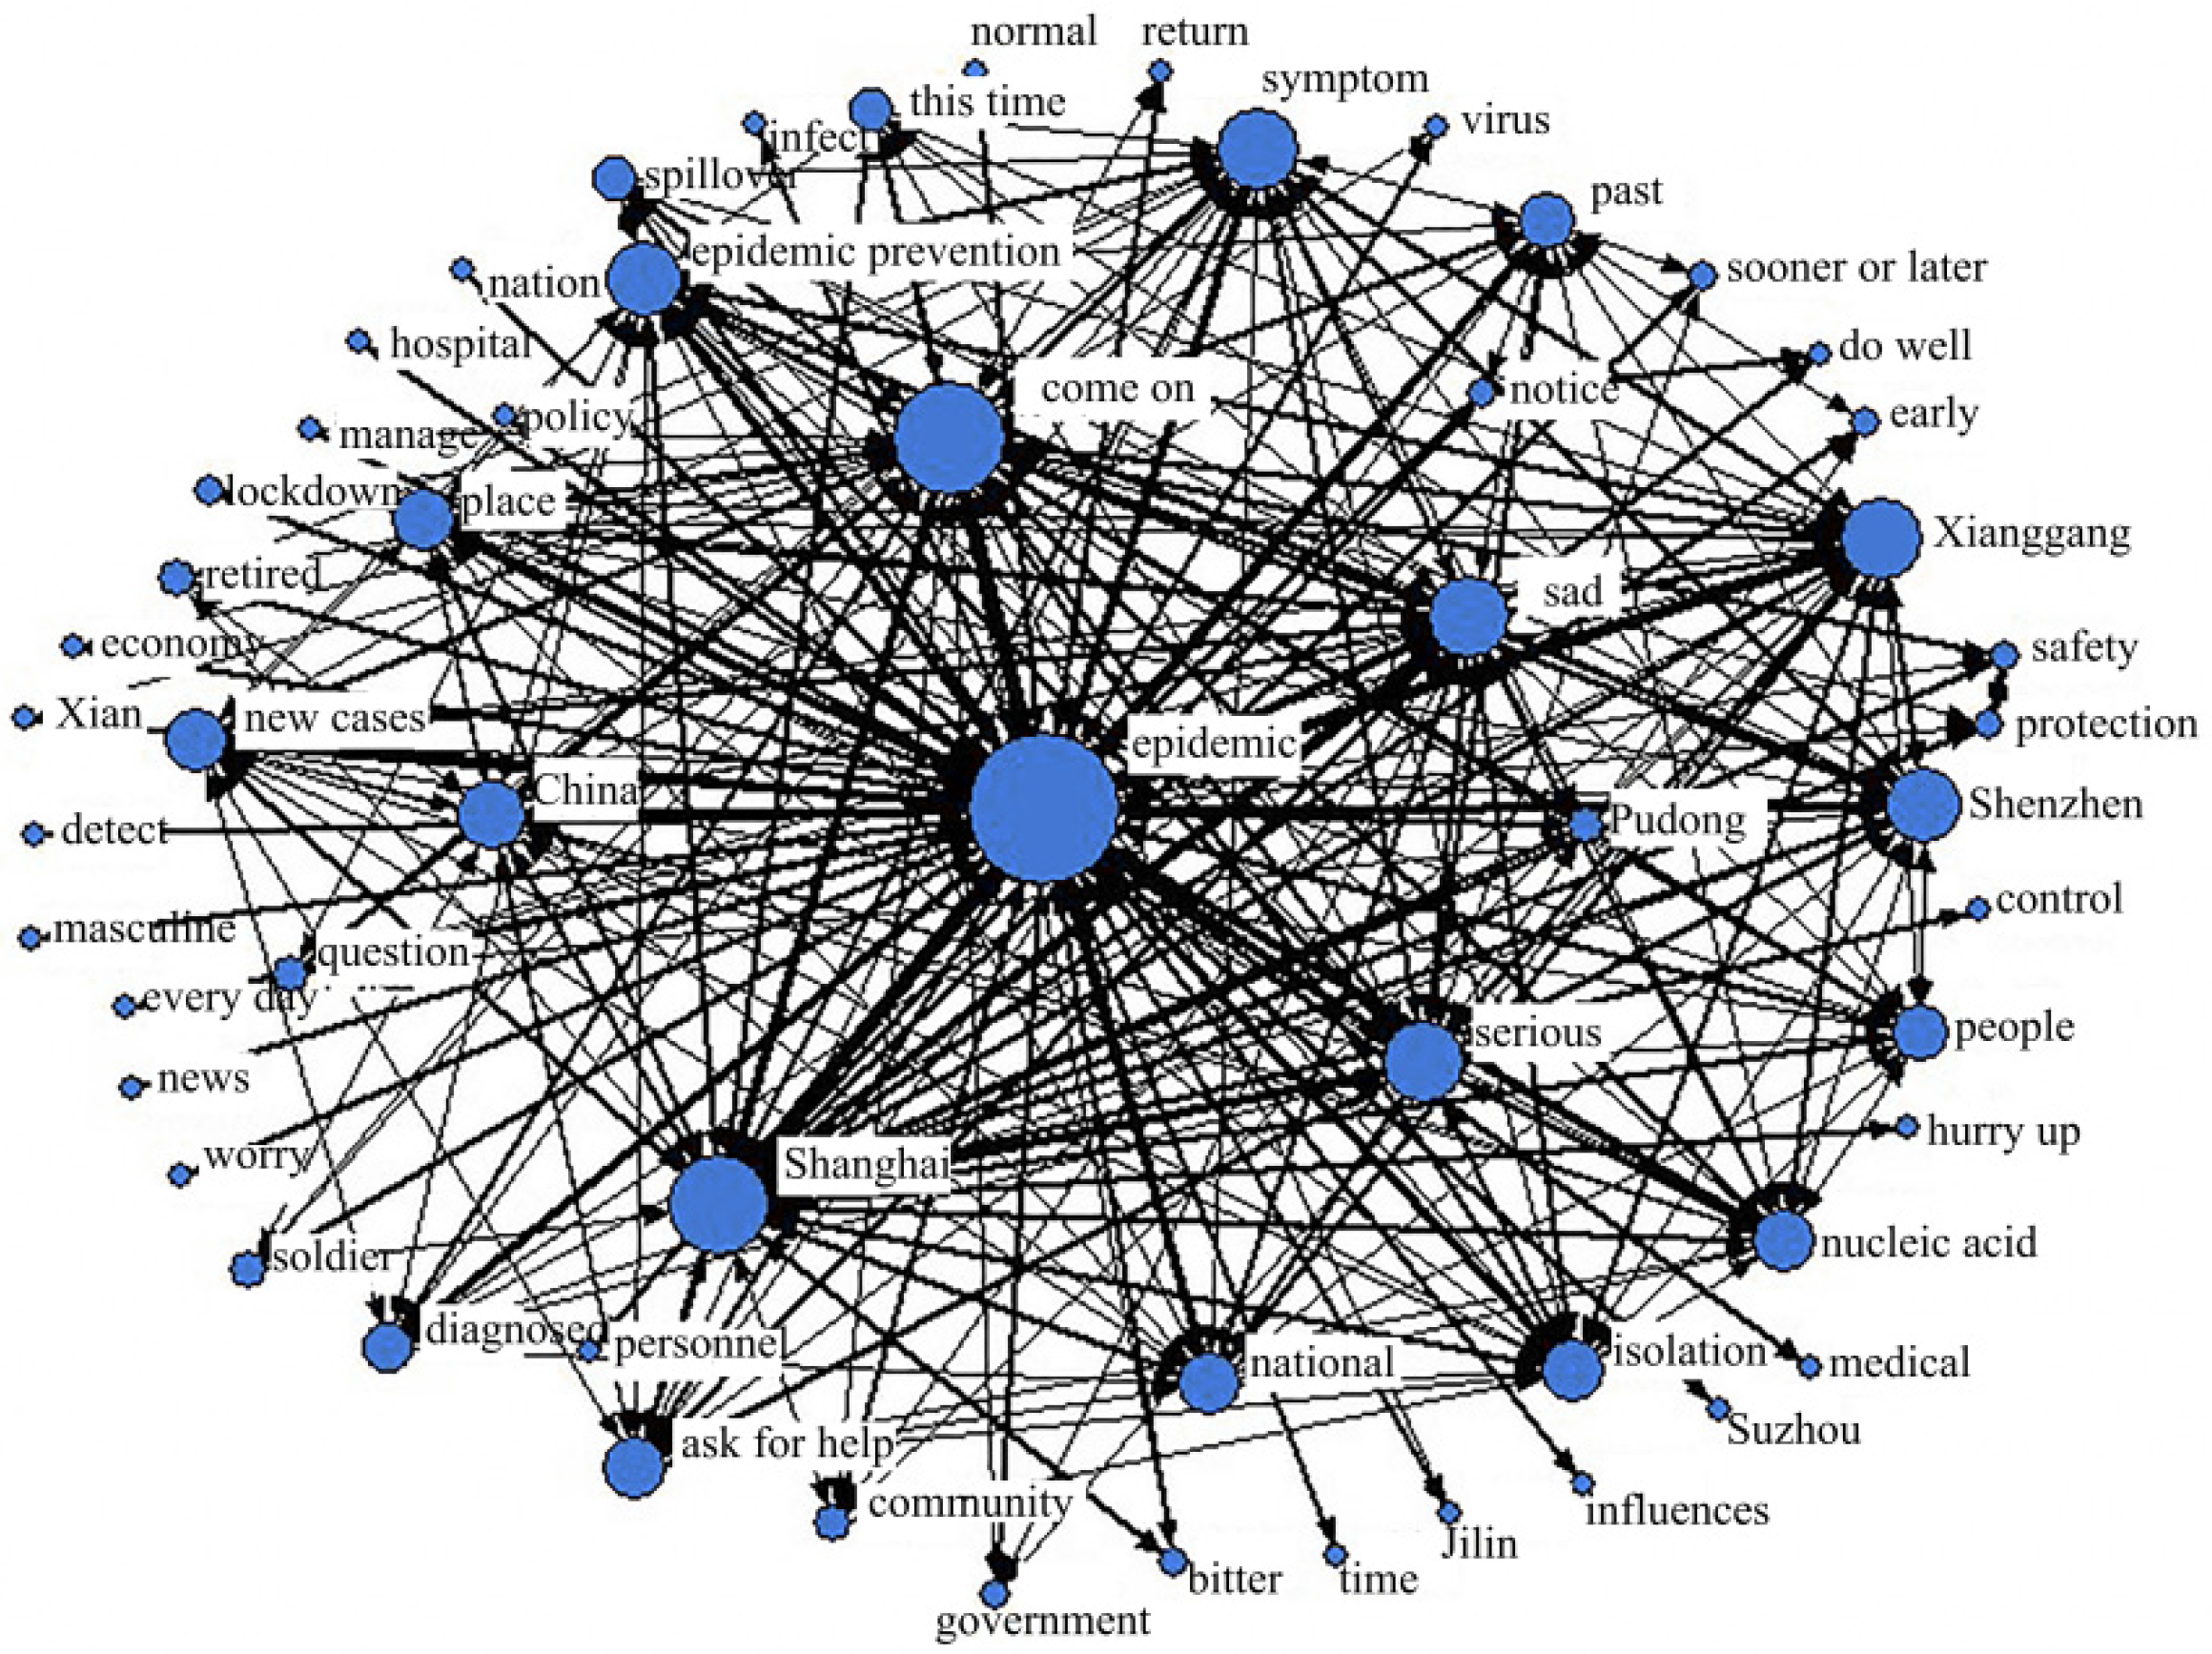
4.4.1. Emotional Fermentation Period
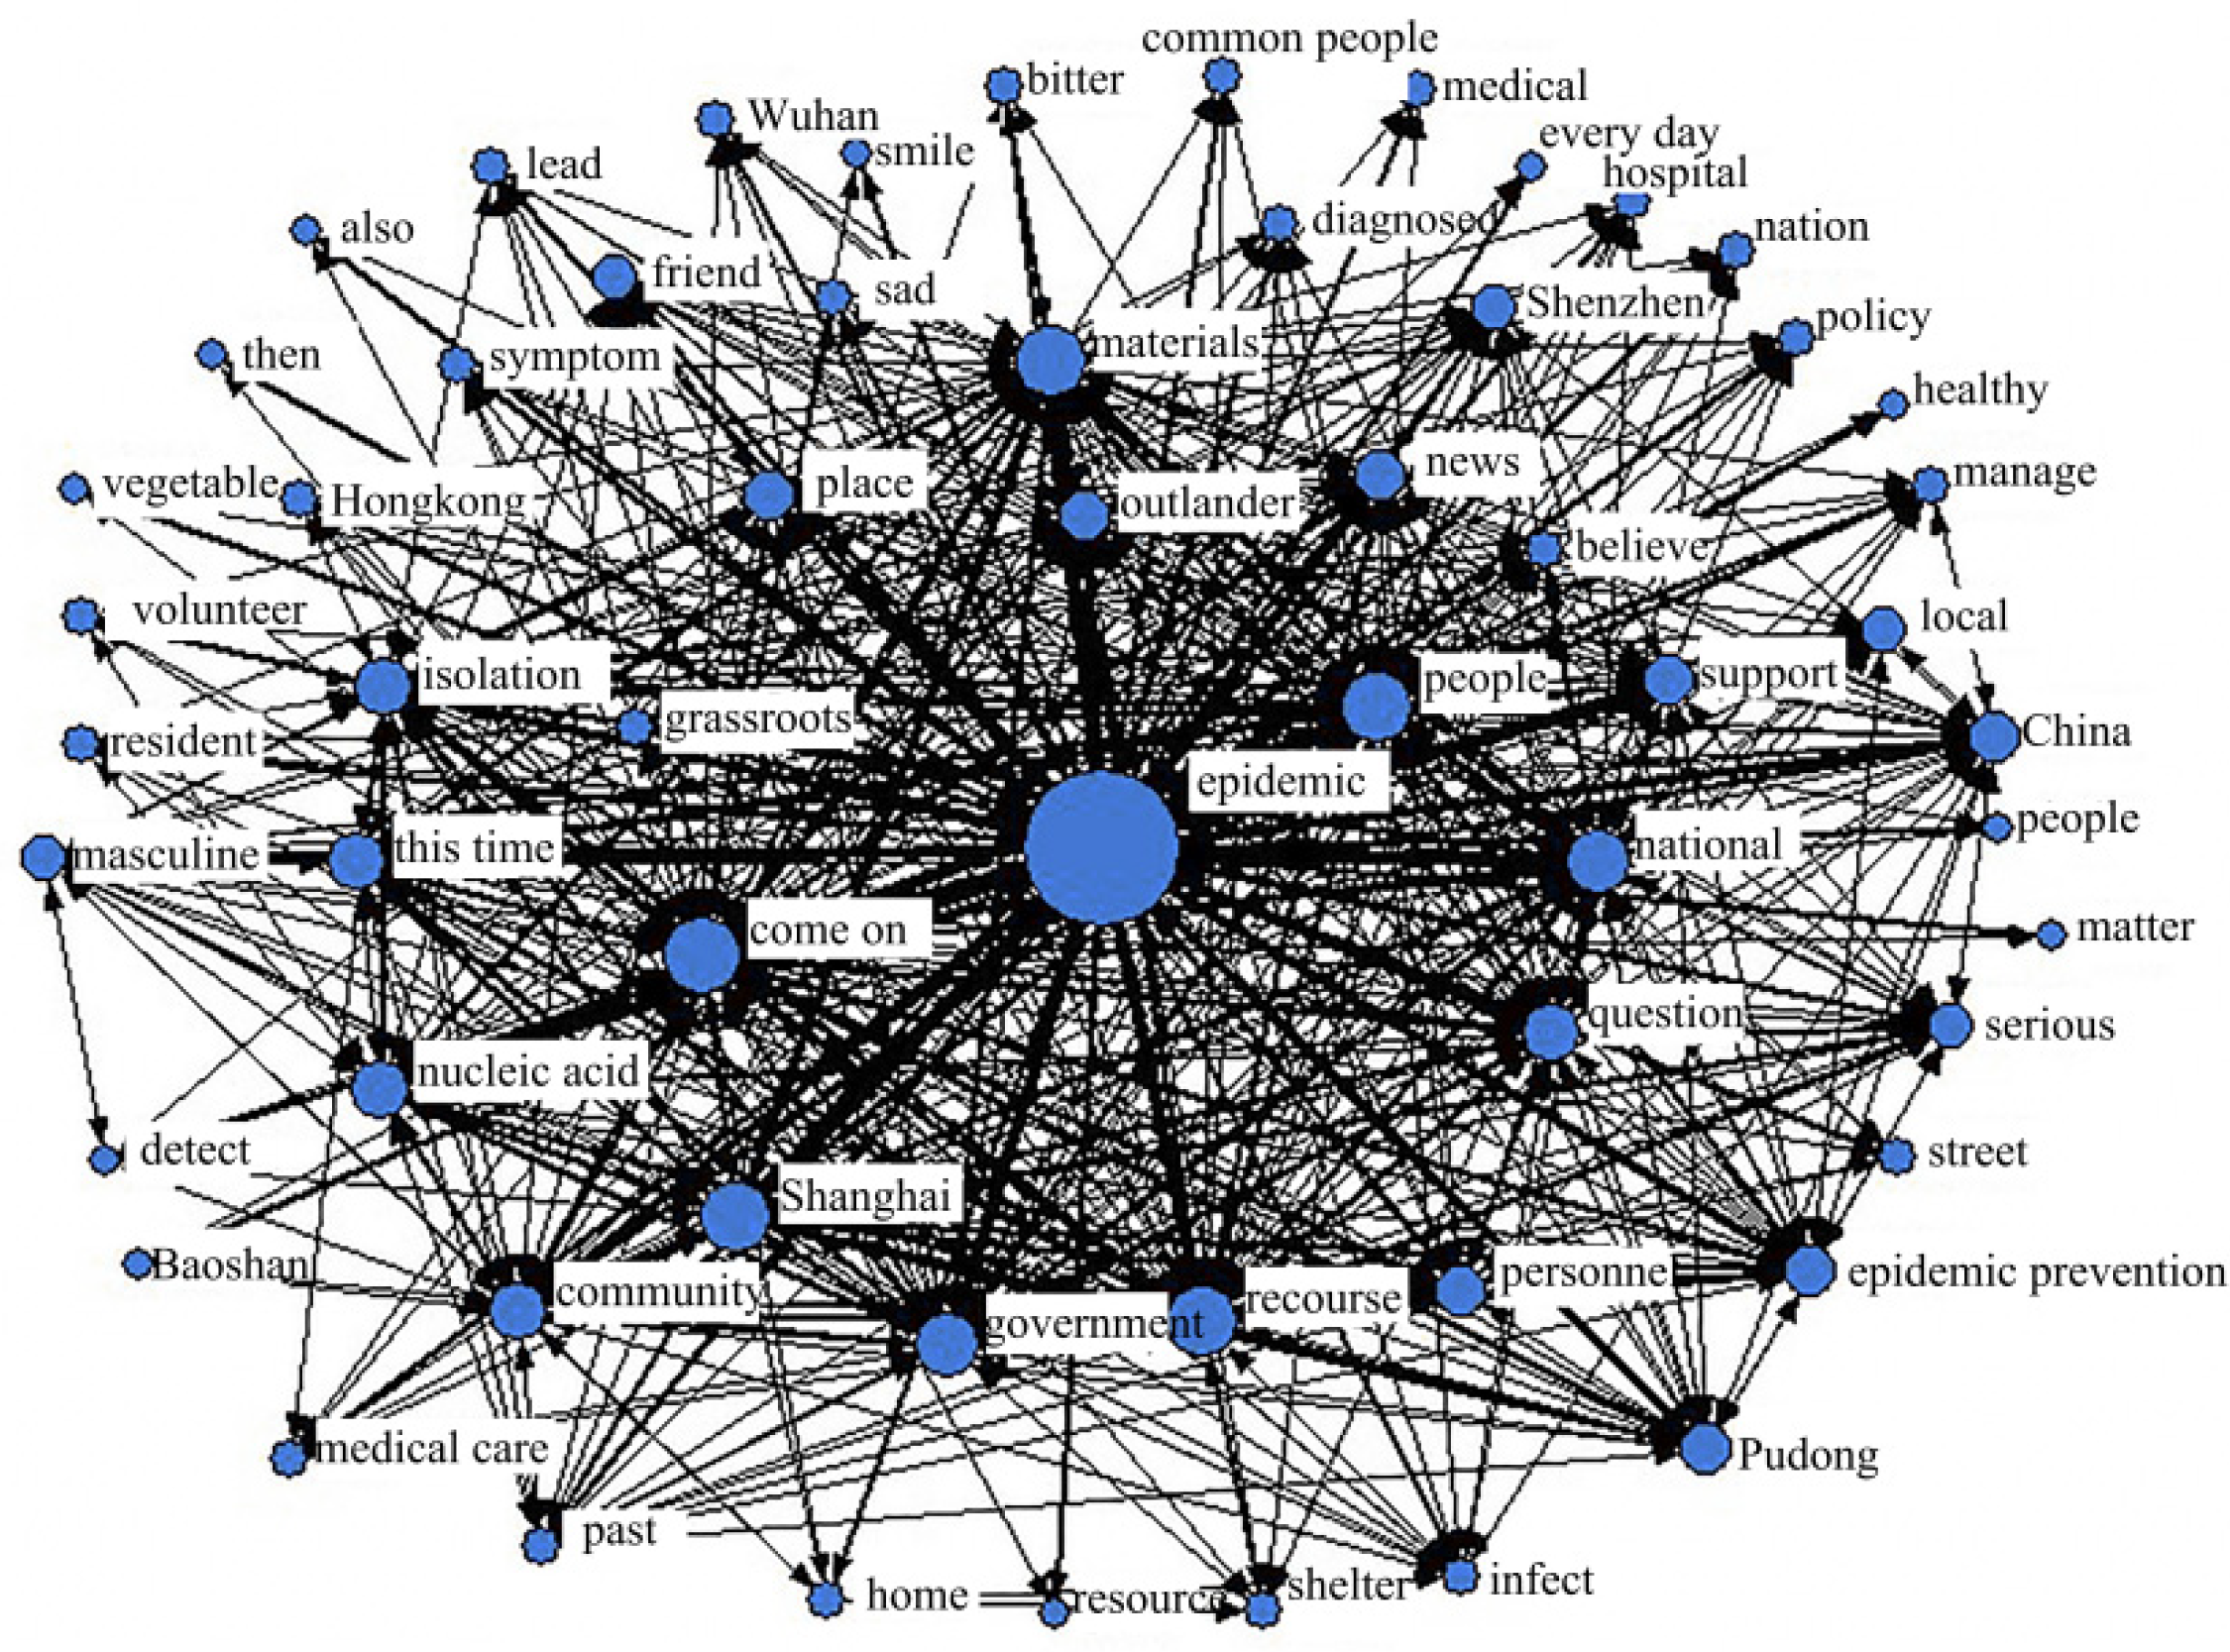
4.4.2. Emotional Climax Period
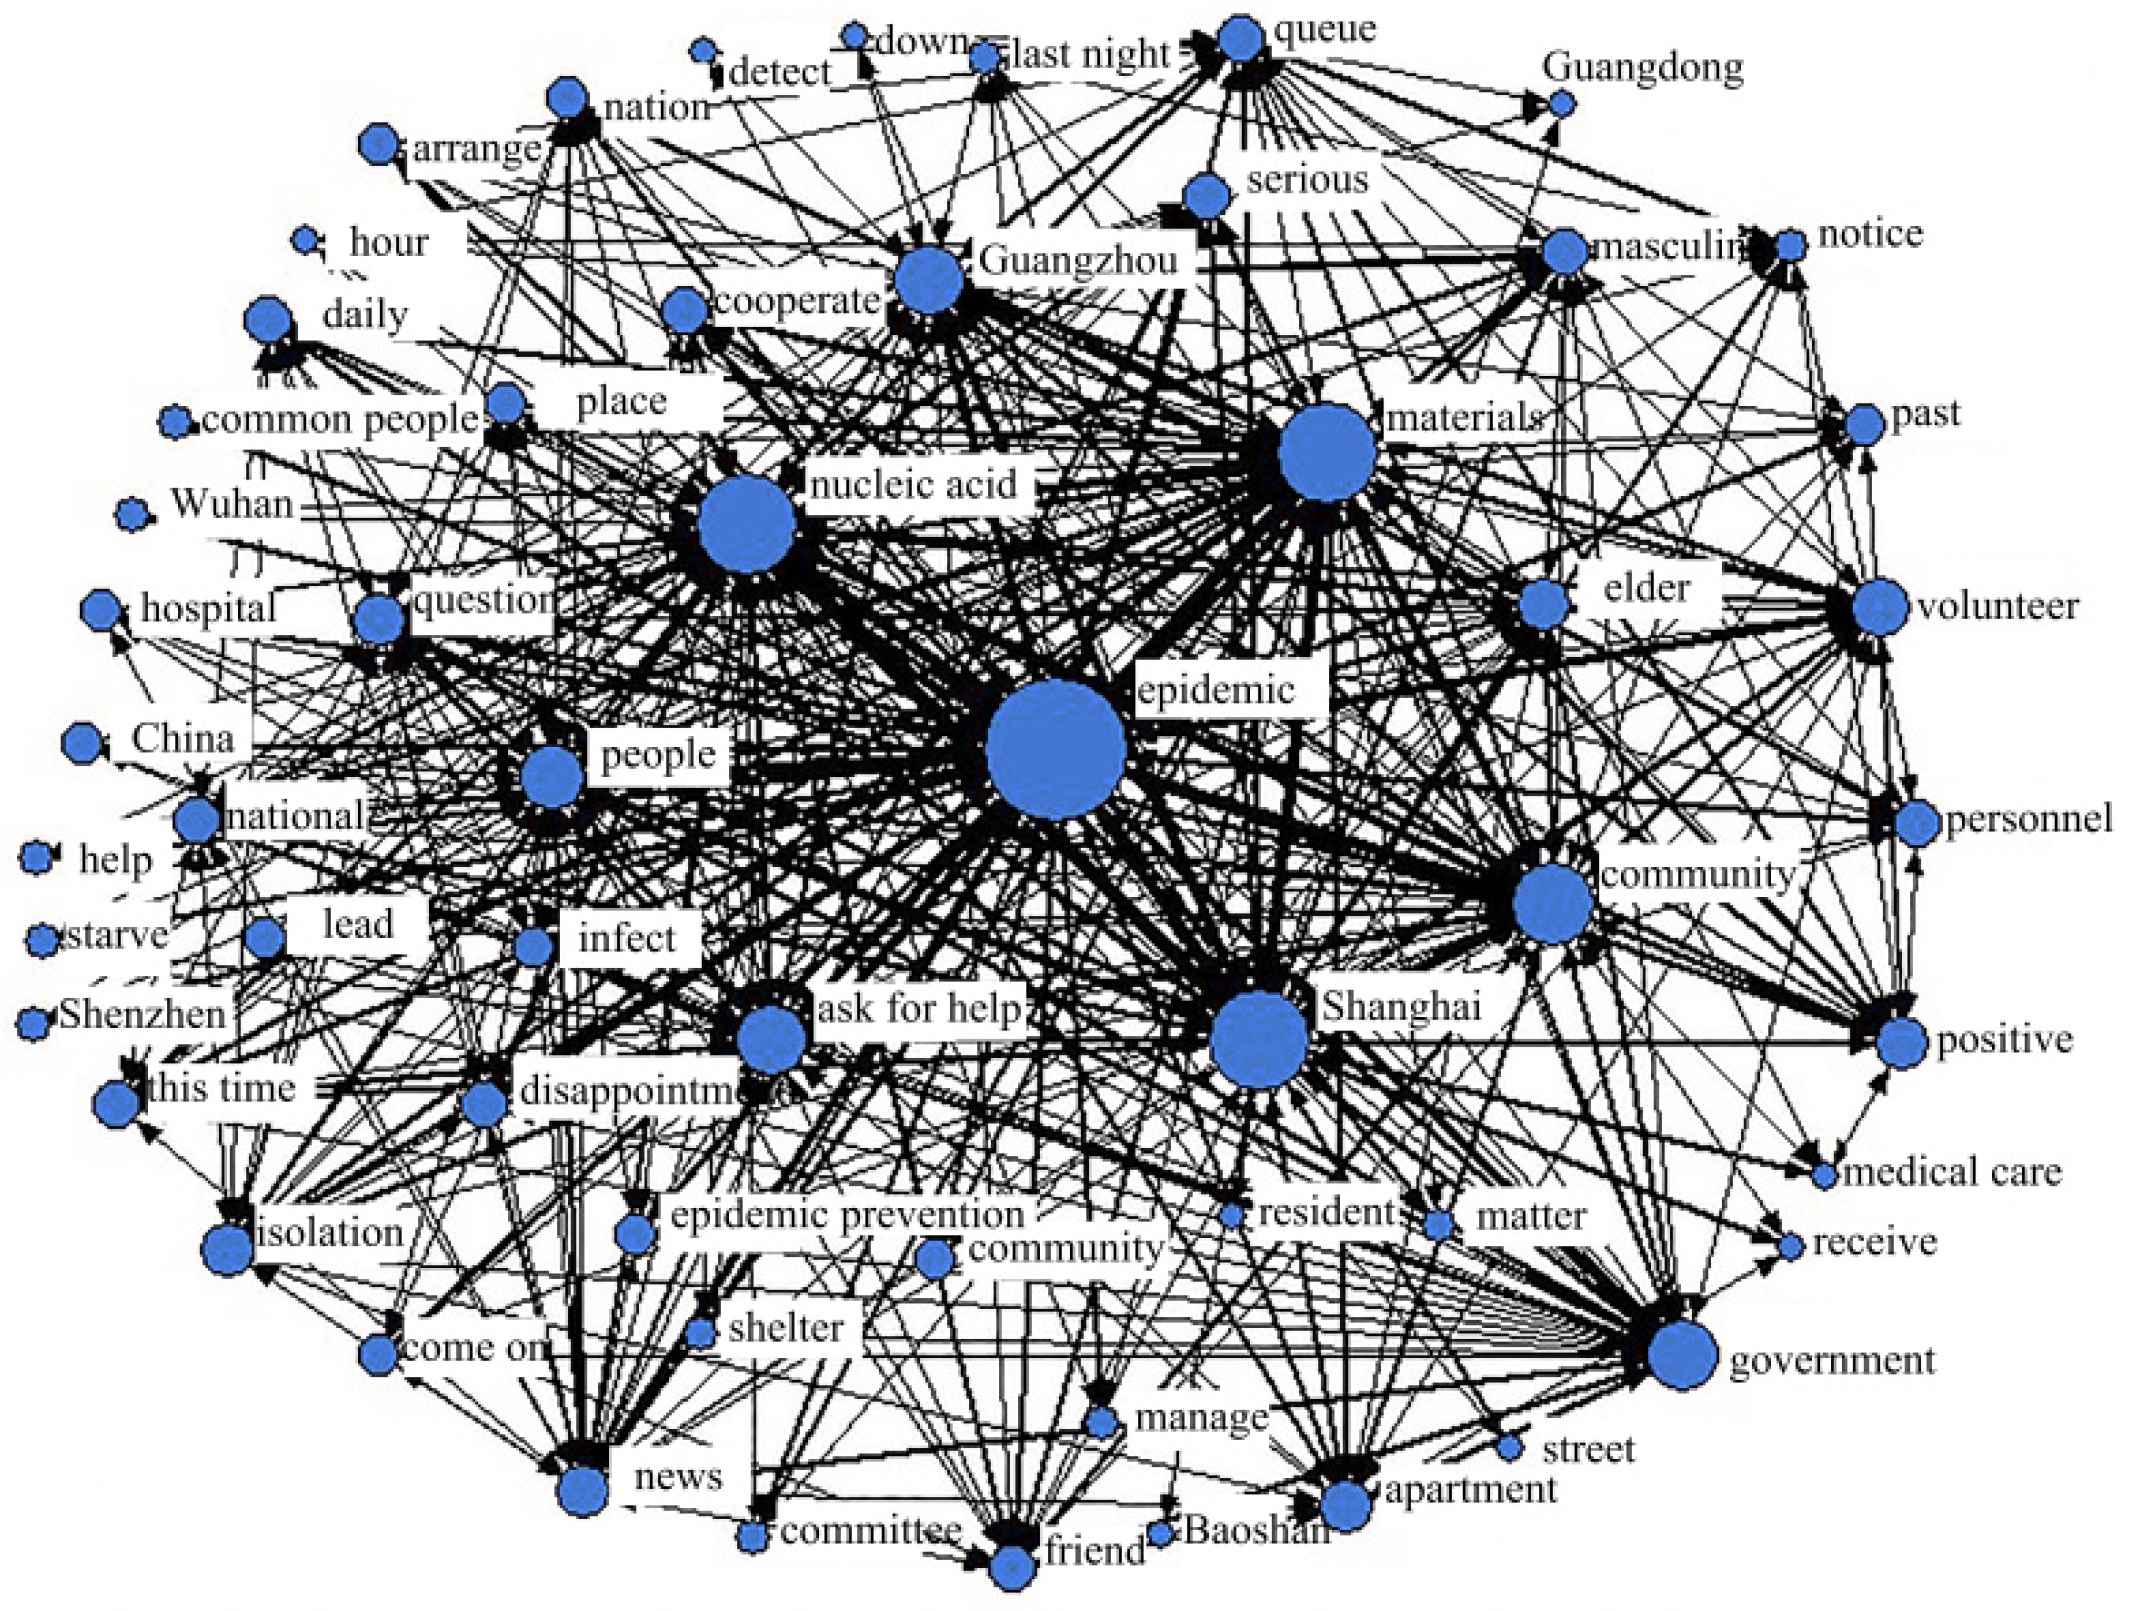
4.4.3. Emotional Chaos Period
5. Discussion
5.1. Significance and Recommendations
- (1)
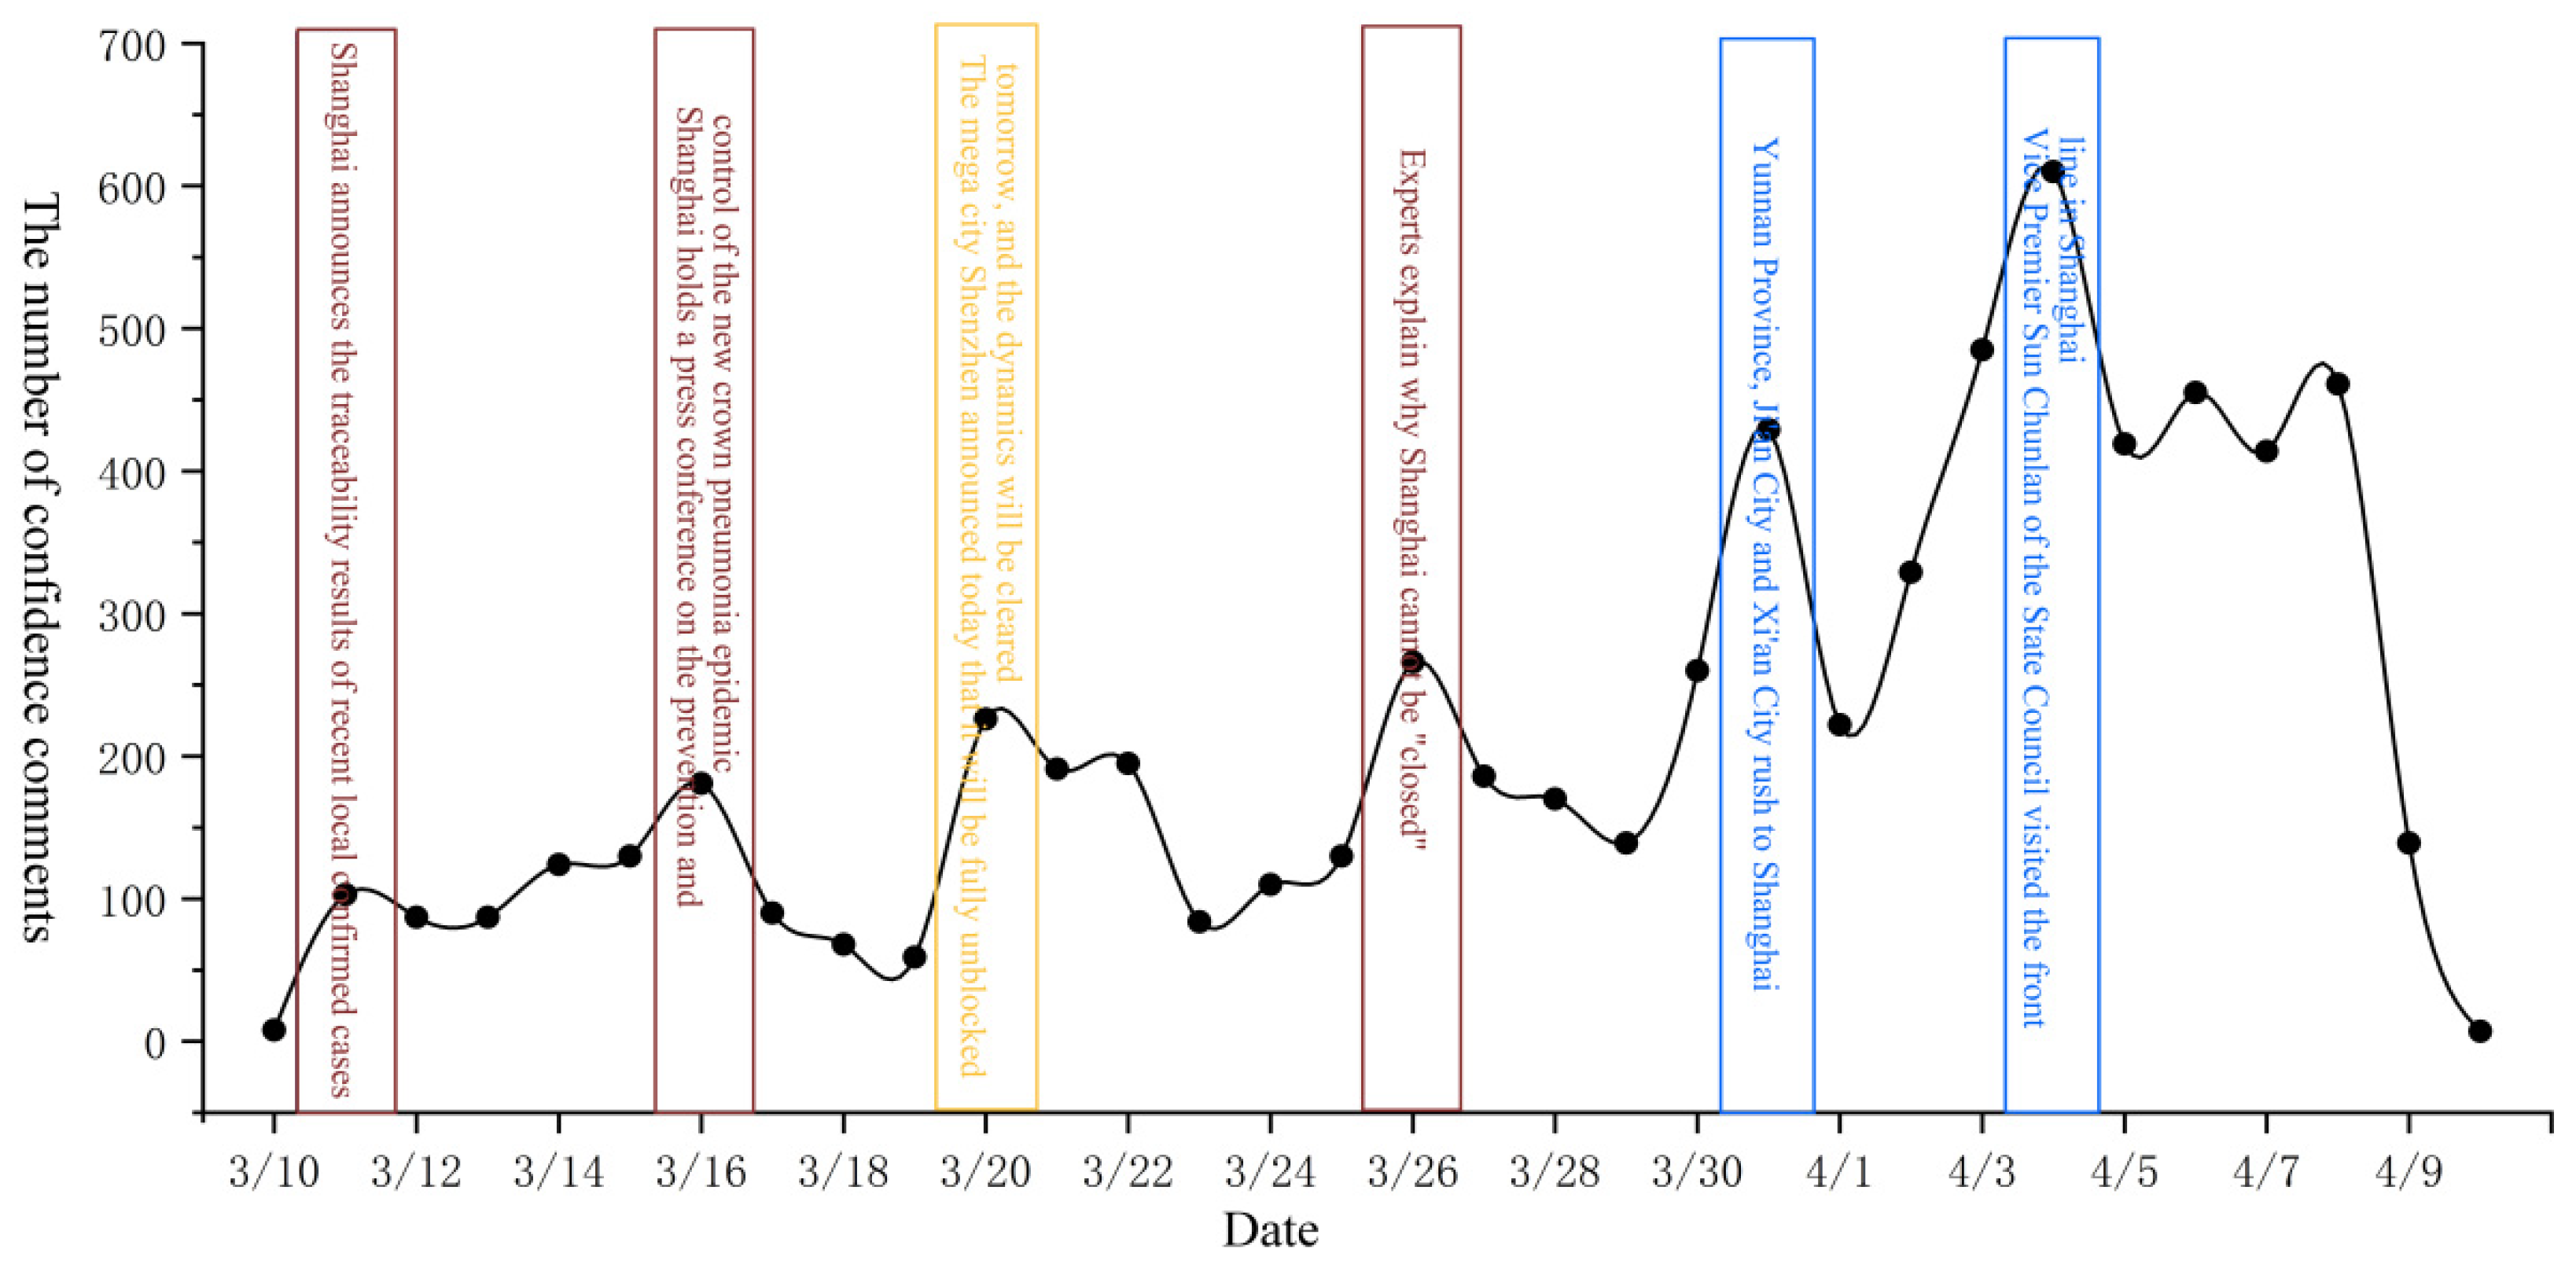
- The emotional fermentation period is generally at the early stage of the epidemic, where the impact of the epidemic is at its lowest and is not yet wide-ranging. At this time, prevention and control measures should be taken in a timely manner to ensure two-way communication and exchanges with the masses. The active publication of anti-epidemic events will help facilitate the public’s positive emotions to combat the epidemic and ensure the effective implementation of anti-epidemic policies. The public needs to lead by example, provide help and care to others, maintain a good attitude, and actively pay attention to the national government’s epidemic prevention policies and dynamic changes during the epidemic, but refrain from excessive remarks.
- (2)
- When the public mood reaches its climax, it signifies that the epidemic has begun to affect the normal lives of most local residents and has even begun to permeate to other provinces and cities. The focus should be on improving emergency medical treatment capabilities and material supply and demand matching capabilities, as well as the effective stabilization and standardization of markets. The media should publicize as much as possible, local anti-epidemic heroic deeds and the anti-epidemic assistance of other provinces and municipalities to reduce the focus on daily living issues and negative emotions caused by the epidemic. In addition, since most of the attention of the public is on the epidemic itself, the most obvious fundamental action to regulate the negative emotions of the public is to effectively control the spread of the epidemic.
- (3)
- When public sentiment reaches a chaotic stage, it signifies that the spread of the epidemic has exceeded most of the public’s expectations, and they gradually begin to reduce their attention on the epidemic and its corresponding events. The erroneous notion, “do not take measures and let the epidemic continue to develop,” gradually emerges in the hearts of the public. To guide citizens more effectively, it is necessary to strengthen epidemic prevention measures, reduce the number of new cases every day, and provide the public with actual data showing progress.
5.2. Limitations and Scope for Future Study
6. Conclusions
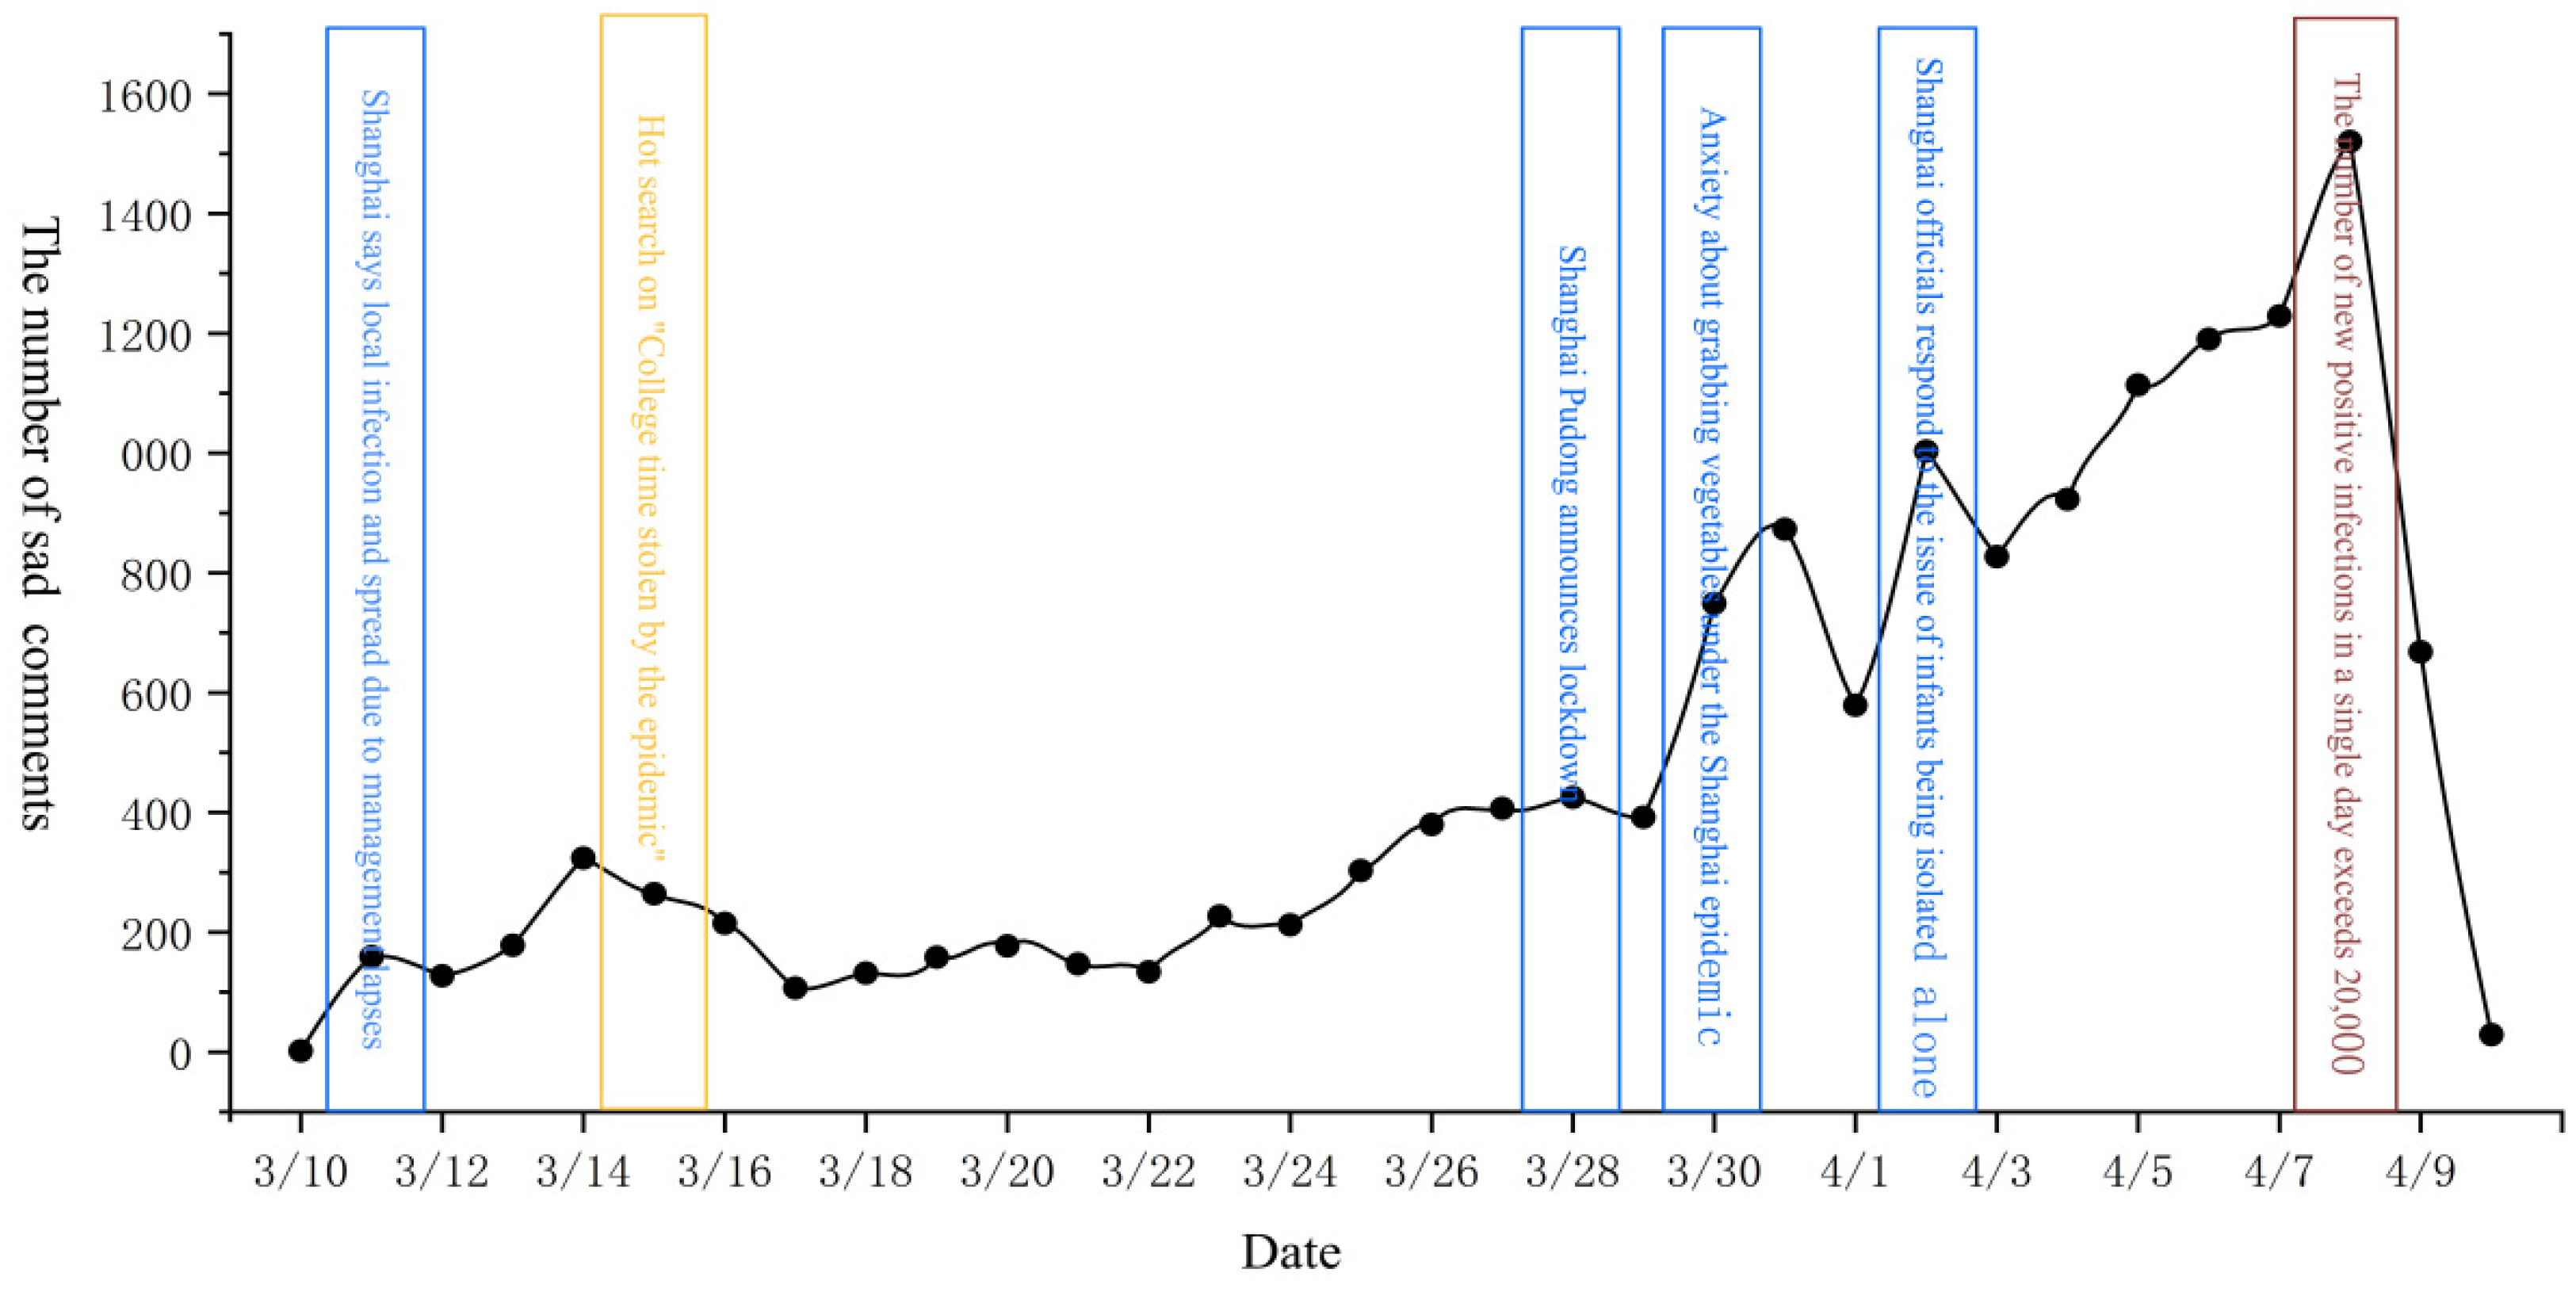
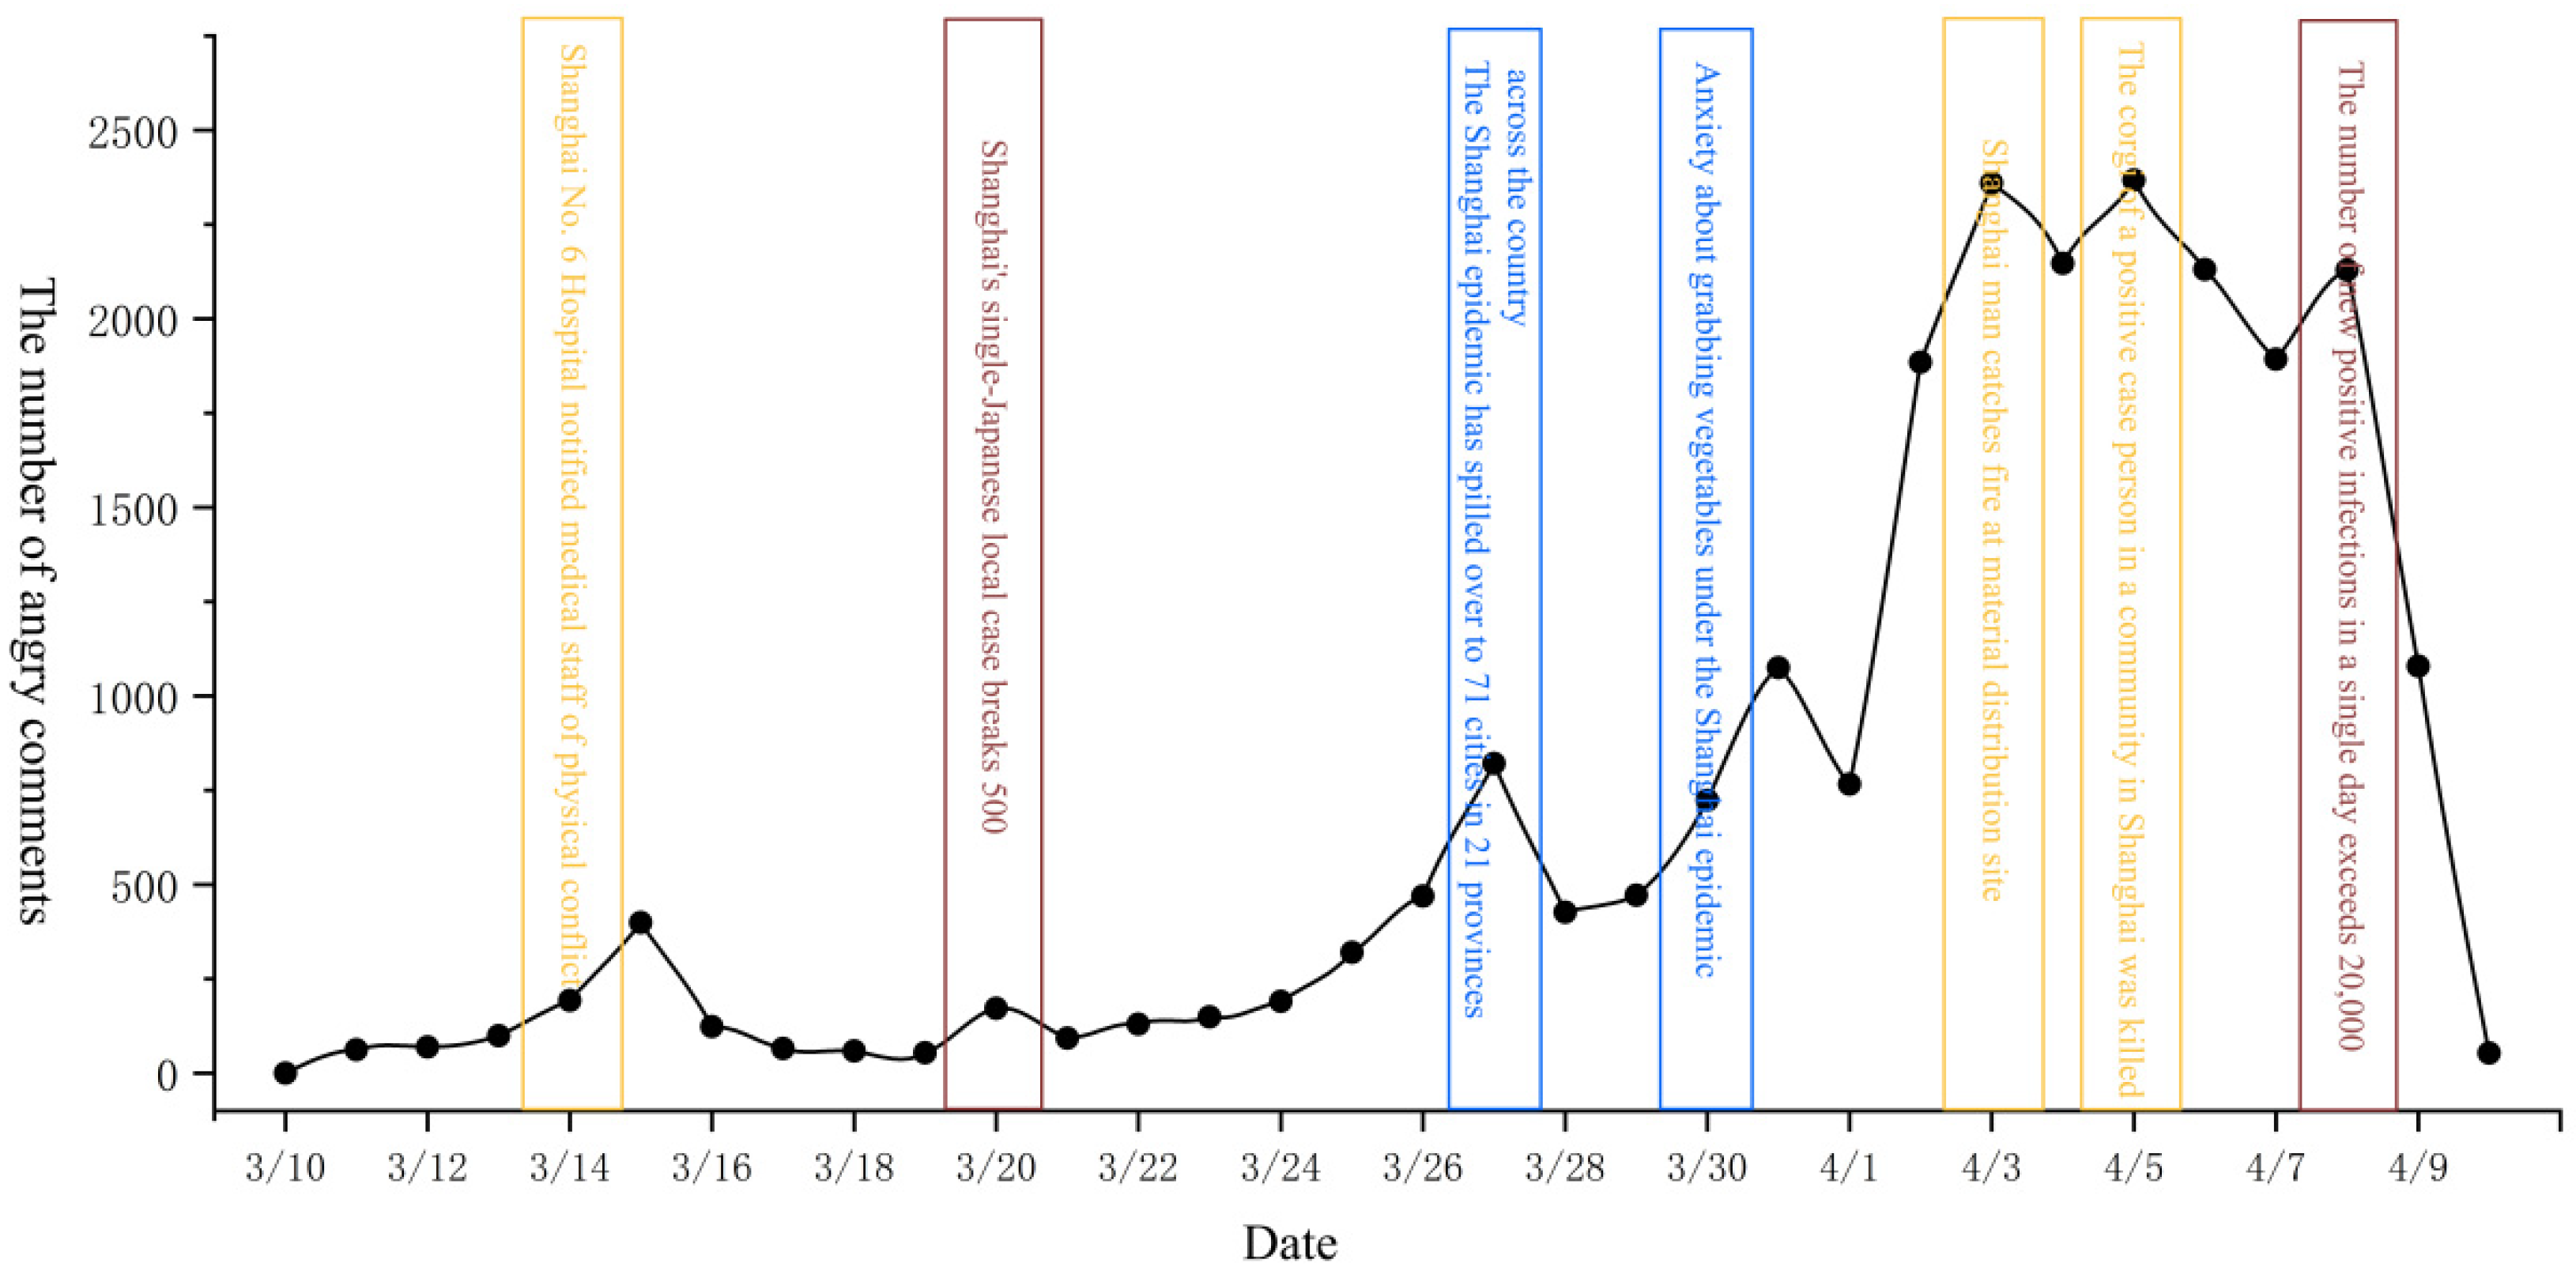
- During a public health emergency, public sentiment can be greatly affected. During the Shanghai outbreak, negative emotions dominated known emotional responses. In addition, among the negative emotions, sadness accounted for 16.96% and anger accounted for 25.68%. Therefore, anger was the primary negative emotion expressed;
- Public sentiment during the epidemic was affected by factors such as public behavior, government behavior, and the severity of the epidemic. In the pre-period, public behavior and government behavior dominated public sentiment. Later, the severity of the epidemic gradually dominated public sentiment;
- From the perspective of time series changes, the changes in public sentiment during the Shanghai epidemic can be divided into three periods: the emotional fermentation period, the emotional climax period, and the emotional chaos period. Through social network analysis, it was found that the epidemic has always been the core of public attention. However, as the emotional period changed, the positive sentiment of the public began to fade. Instead, the public became concerned about their own safety and security.
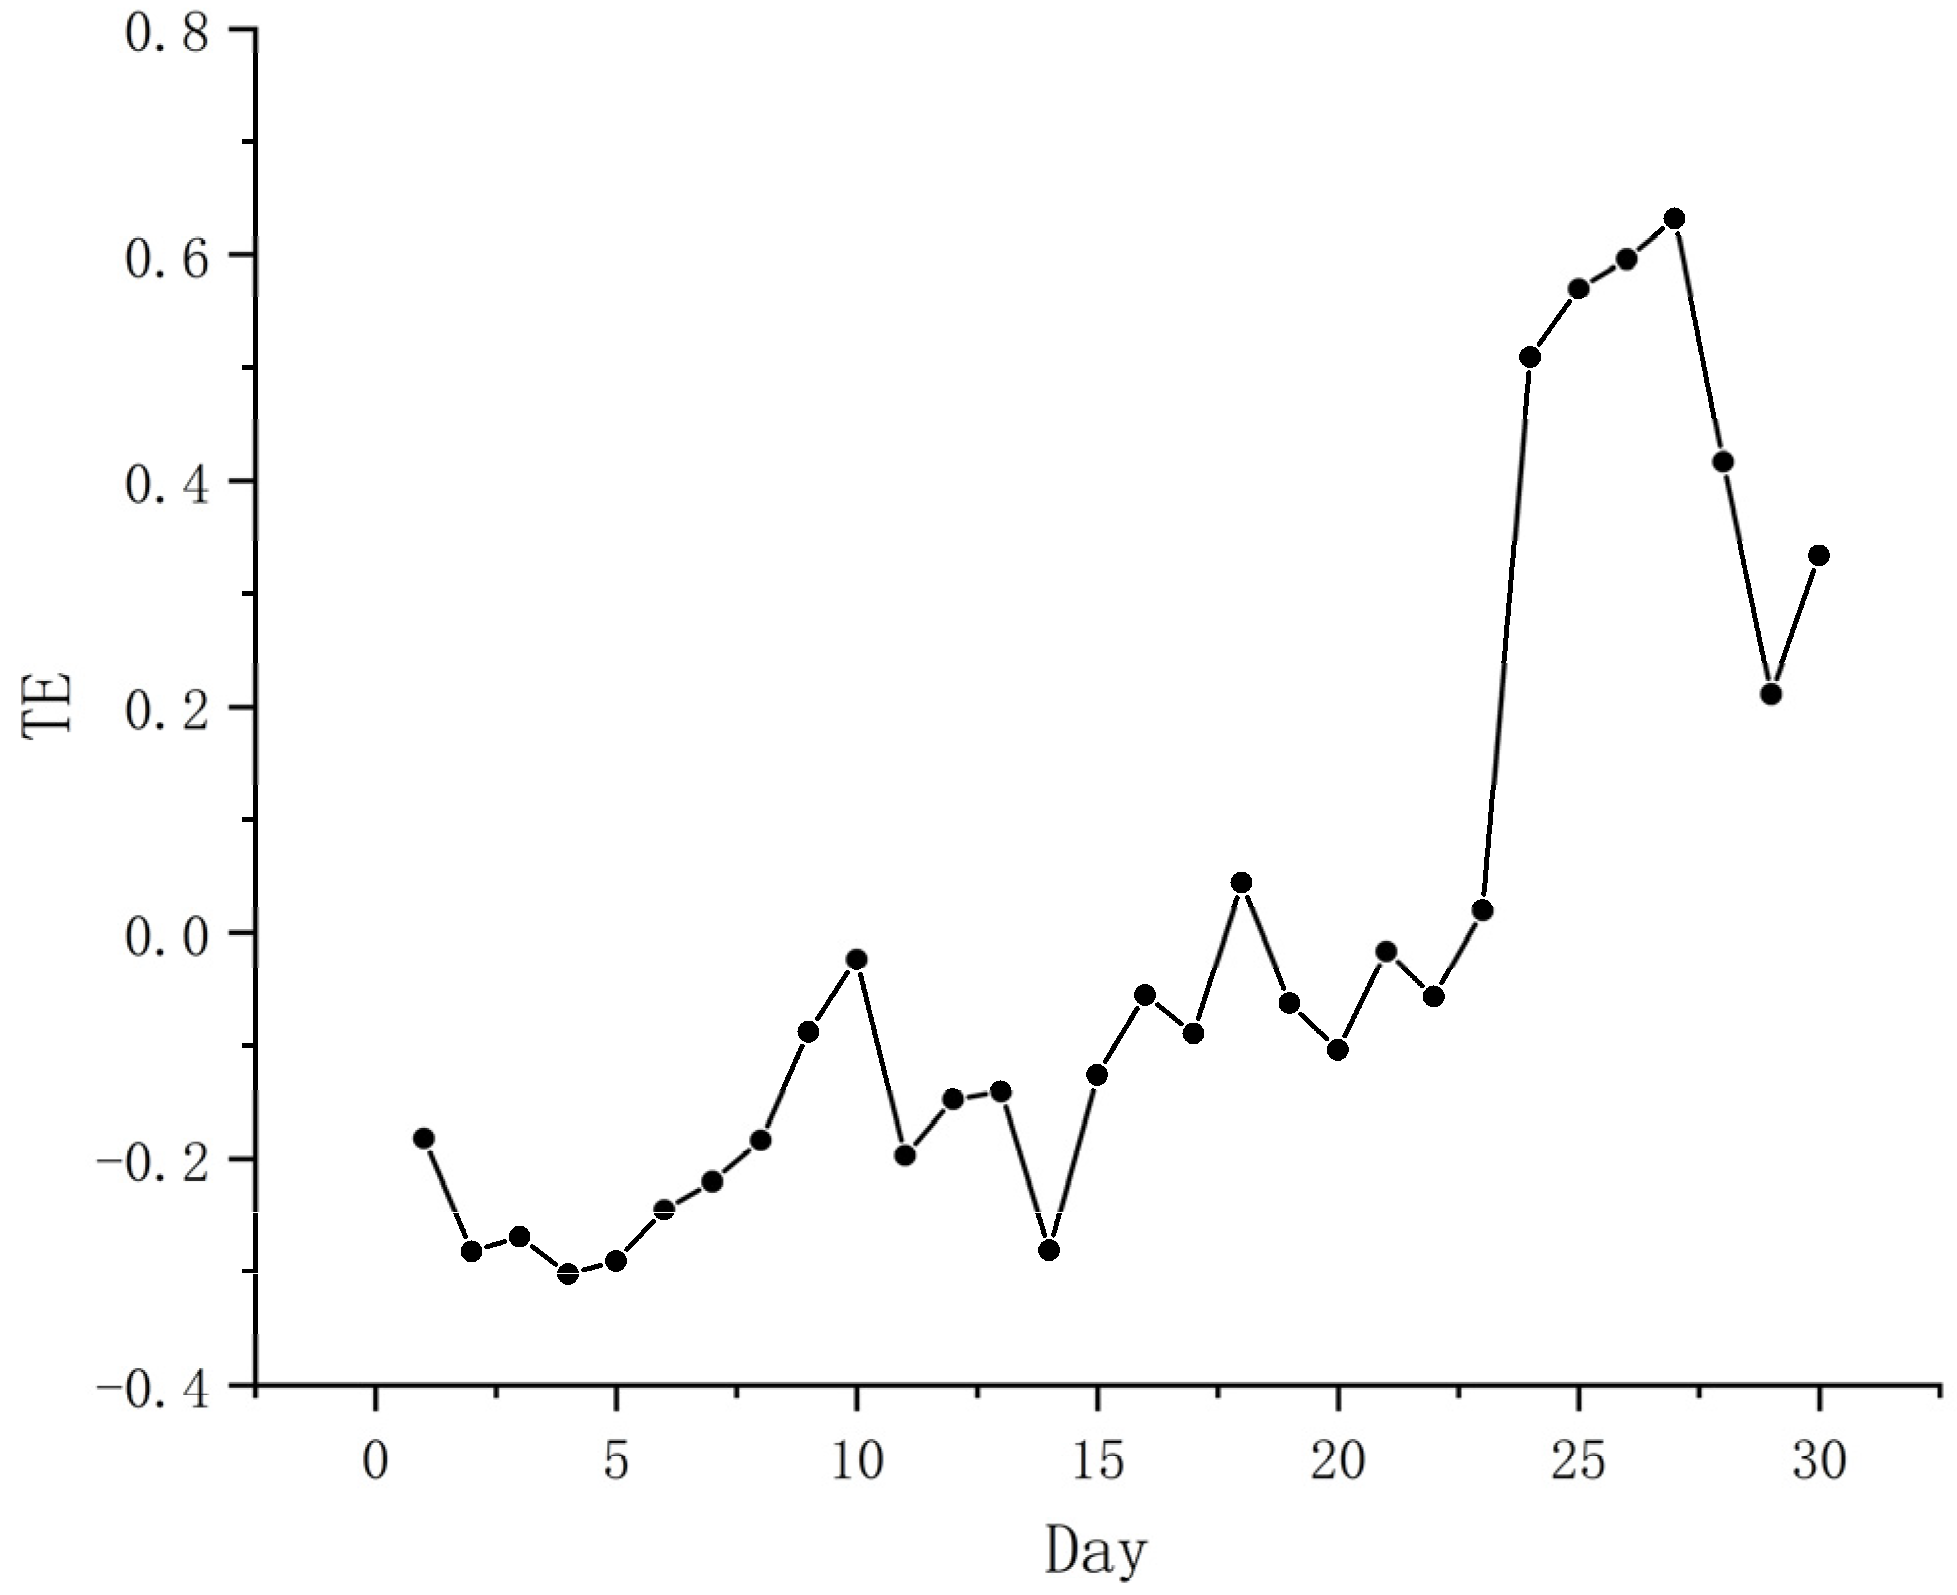
- The impact of the epidemic on the negative emotions of the public was greater than on the positive emotions, indicating that the public is more likely to experience negative emotions during major adverse health events. In addition, a causal relationship between positive emotions and negative emotions was detected, indicating that positive emotions have a certain inhibitory effect on negative emotions.
Author Contributions
Funding
Institutional Review Board Statement
Informed Consent Statement
Data Availability Statement
Acknowledgments
Conflicts of Interest
References
- Wang, J.; Shao, W.; Yan, Y.; Kim, J. The effect of “Wuhan closure” on the COVID-19 pandemic in China. Fluct. Noise Lett. 2021, 20, 2150052. [Google Scholar] [CrossRef]
- Yang, X.; Zhou, S.; Liu, Y. Research on the states, evolution and communication effects of online emotion under magnitude outburst infectious disease emergencies: Analysis of microblog public opinion during COVID-19 pandemic. Libr. Inf. Stud. 2021, 04, 91–100. [Google Scholar]
- Li, M.H.; Chen, Z.; Rao, L.L. Emotion, analytic thinking and susceptibility to misinformation during the COVID-19 outbreak. Comput. Hum. Behav. 2022, 133, 107295. [Google Scholar] [CrossRef]
- Chen, Y.; Zhang, L.; Qi, H.; You, W.; Nie, C.; Ye, L.; Xu, P. Relationship between negative emotions and job burnout in medical staff during the prevention and control of the COVID-19 epidemic: The mediating role of psychological resilience. Front. Psychiatry 2022, 13, 857134. [Google Scholar] [CrossRef]
- Chang, J.; Li, J. Spatiotemporal distribution of COVID-19 and public anxiety: Analysis based on micro-blog data. Hum. Geogr. 2021, 3, 47–57. [Google Scholar]
- Li, S.; Wang, Y.; Filieri, R.; Zhu, Y. Eliciting positive emotion through strategic responses to COVID-19 crisis: Evidence from the tourism sector. Tour. Manag. 2022, 90, 104485. [Google Scholar] [CrossRef]
- Jiang, W.; Hao, Z.; Wang, Y.; Cao, W.; Xia, J.; Wu, H.; Fan, C. Spatiotemporal characteristics of groups’ emotional responses to pandemic driven by Urban Weibo Date: A case study of COVID-19 pandemic in Wuhan and Shijiazhuang. Geogr Geo-Inf. Sci. 2022, 38, 5–14. [Google Scholar]
- Kim, D.; Park, C.; Kim, E.; Han, J.; Song, H. Social sharing of emotion during the COVID-19 pandemic. Cyberpsychol. Behav. Soc. Netw. 2022, 25, 369–376. [Google Scholar] [CrossRef]
- Feizollah, A.; Anuar, N.B.; Mehdi, R.; Firdaus, A.; Sulaiman, A. Understanding COVID-19 halal vaccination discourse on Facebook and Twitter using aspect-based sentiment analysis and text emotion analysis. Int. J. Environ. Res. Public Health 2022, 19, 6269. [Google Scholar] [CrossRef]
- Jun, J.; Zain, A.; Chen, Y.; Kim, S.H. Adverse mentions, negative sentiment, and emotions in COVID-19 vaccine tweets and their association with vaccination uptake: Global comparison of 192 countries. Vaccines 2022, 10, 735. [Google Scholar] [CrossRef] [PubMed]
- Xu, K. Mechanism of negative emotions of the elderly in normalization period of COVID-19: A mediated mediation model. Front. Public Health 2022, 10, 941958. [Google Scholar] [CrossRef] [PubMed]
- Pandey, V.; Talan, A.; Mahendru, M.; Shahzad, U. Studying the psychology of coping negative emotions during COVID-19: A quantitative analysis from India. Environ. Sci. Pollut. Res. Int. 2022, 29, 11142–11159. [Google Scholar] [CrossRef] [PubMed]
- Al-Laith, A.; Alenezi, M. Monitoring people’s emotions and symptoms from Arabic tweets during the COVID-19 pandemic. Information 2021, 12, 86. [Google Scholar] [CrossRef]
- Almars, A.M.; Atlam, E.S.; Noor, T.H.; Elmarhomy, G.; Alagamy, R.; Gad, I. Users opinion and emotion understanding in social media regarding COVID-19 vaccine. Computing 2022, 104, 1481–1496. [Google Scholar] [CrossRef]
- Garcia, M.B. Sentiment analysis of tweets on coronavirus disease 2019 (COVID-19) pandemic from Metro Manila, Philippines. Cybern. Inf. Technol. 2020, 20, 141–155. [Google Scholar] [CrossRef]
- Xavier, T.; Lambert, J. Sentiment and emotion trends in nurses’ tweets about the COVID-19 pandemic. J. Nurs. Scholarsh. 2022, 0, 1–10. [Google Scholar] [CrossRef] [PubMed]
- Lyu, J.C.; Le Han, E.L.; Luli, G.K. COVID-19 vaccine–related discussion on Twitter: Topic modeling and sentiment analysis. J. Med. Internet Res. 2021, 23, e24435. [Google Scholar] [CrossRef]
- Zhong, Z.; Ji, X. Emotional calculation in Internet public Opinion Research. New S Res. 2022, 1, 19–25. [Google Scholar]
- Hinton, G.E.; Osindero, S.; Teh, Y.W. A fast-learning algorithm for deep belief nets. Neural Comput. 2006, 18, 1527–1554. [Google Scholar] [CrossRef]
- Bandyopadhyay, S.; Thakur, S.S.; Mandal, J.K. Emotion detection for online recommender system using deep learning: A proposed method. Innov. Syst. Softw. Eng. 2022, 1–8. [Google Scholar] [CrossRef]
- Bao, Q.; Zhang, X.; Wu, X.; Zhang, Q.; Chen, J. Research on public environmental perception of emotion, taking haze as an example. Int. J. Environ. Res. Public Health 2021, 18, 12115. [Google Scholar] [CrossRef]
- Nag, S.; Basu, M.; Sanyal, S.; Banerjee, A.; Ghosh, D. On the application of deep learning and multifractal techniques to classify emotions and instruments using Indian Classical Music. Phys. A 2022, 597, 127261. [Google Scholar] [CrossRef]
- Sam Abraham, S.; Lajish, V.L.; Gangan, M.P. Readers’ affect: Predicting and understanding readers’ emotions with deep learning. J. Big Data 2022, 9, 1–31. [Google Scholar]
- Serrano-Guerrero, J.; Bani-Doumi, M.; Romero, F.P.; Olivas, J.A. Understanding what patients think about hospitals: A deep learning approach for detecting emotions in patient opinions. Artif. Intell. Med. 2022, 128, 102298. [Google Scholar] [CrossRef] [PubMed]
- Zhang, S.; Li, C. Research on feature fusion speech emotion recognition technology for smart teaching. Mob. Inf. Syst. 2022, 2022, 1–9. [Google Scholar] [CrossRef]
- Liu, J.; Wang, H. Analysis of educational mental health and emotion based on deep learning and computational intelligence optimization. Front. Psychol. 2022, 13, 898609. [Google Scholar] [CrossRef] [PubMed]
- Devlin, J.; Chang, M.W.; Lee, K.; Toutanova, K. BERT: Pre-training of deep bidirectional transformers for language understanding. arXiv 2018, arXiv:1810.04805. [Google Scholar]
- Bitar, H.; Babour, A.; Nafa, F.; Alzamzami, O.; Alismail, S. Increasing women’s knowledge about HPV using BERT text summarization: An online randomized study. Int. J. Environ. Res. Public Health 2022, 19, 8100. [Google Scholar] [CrossRef]
- Yong, L.; Xiaojun, Y.; Yi, L.; Ruijun, L.; Qingyu, J. A new emotion analysis fusion and complementary model based on online food reviews. Comput. Electr. Eng. 2022, 98, 107679. [Google Scholar] [CrossRef]
- Tanana, M.J.; Soma, C.S.; Kuo, P.B.; Bertagnolli, N.M.; Dembe, A.; Pace, B.T.; Srikumar, V.; Atkins, D.C.; Imel, Z.E. How do you feel? Using natural language processing to automatically rate emotion in psychotherapy. Behav. Res. Methods 2021, 53, 2069–2082. [Google Scholar] [CrossRef]
- Cui, l.; Qu, L.; He, D. Evaluating emotional perception of spatial hotspots via deep learning: A case study of shanghai. Hum. Geogr. 2021, 36, 121–130. [Google Scholar]
- Sun, Y.; Wang, S.; Li, Y.; Feng, S.; Chen, X.; Zhang, H.; Tian, X.; Zhu, D.; Tian, H.; Wu, H.E. Enhanced representation through knowledge integration. arXiv 2019, arXiv:1904.09223. [Google Scholar]
- Xu, J.; Hu, L. Geospatial semantics analysis of the Qinghai–Tibetan Plateau based on microblog short texts. ISPRS Int. J. Geo-Inf. 2021, 10, 682. [Google Scholar] [CrossRef]
- Zhang, H.; Sun, S.; Hu, Y.; Liu, J.; Guo, Y. Sentiment classification for Chinese text based on interactive multitask learning. IEEE Access 2020, 8, 129626–129635. [Google Scholar] [CrossRef]
- Liu, C.; Tan, X.; Zhou, T.; Zhang, W.; Liu, J.; Lu, X. Emoji use in China: Popularity patterns and changes due to COVID-19. Appl. Intell. 2022, 1–11. [Google Scholar] [CrossRef]
- Cheng, N.; Li, B.; Ge, S.; Hao, X.; Feng, M. A joint model of automatic sentence segmentation and lexical analysis for ancient Chinese based on BiLSTM-CRF model. J. Chin. Inf. Process. 2020, 34, 1–9. [Google Scholar]
- Guo, A.; Yang, T. Research and improvement of feature words weight based on TFIDF algorithm. In Proceedings of the IEEE Information Technology, Networking, Electronic and Automation Control Conference, Chongqing, China, 20–22 May 2016; Volume 2016, pp. 415–419. [Google Scholar]
- Jiao, Z.; Sun, S.; Sun, K. Chinese lexical analysis with deep bi-gru-crf network. arXiv 2018, arXiv:1807.01882. [Google Scholar]
- Che, J.; Tang, L.; Deng, S.; Su, X. Chinese word segmentation based on bi- directional GRU-CRF model. Int. J. Perform. Eng. 2018, 14, 3066–3075. [Google Scholar] [CrossRef]
- Che, J.; Tang, L.; Deng, S.; Su, X. Military named entity recognition with character embedding combining word position. J. Gun Launch Control 2019, 03, 50–55. [Google Scholar]
- Jones, K.S. A statistical interpretation of term specificity and its application in retrieval. J. Doc. 1972, 28, 11–21. [Google Scholar] [CrossRef]
- Sun, T.; Zhang, Y.; Yang, F.; Yang, X.; Jiang, Y.; Wang, Z.; Li, K. A novel term-weighting approach in text classification over skewed data sets. Inf. Int. Interdiscip. J. 2010, 13, 621–633. [Google Scholar]
- Li, T.; Huo, Q.; Yan, Y.; Xu, Y. Chinese relation extraction model based on ERNIE and attention mechanism. J. Chin. Comput. Syst. 2022, 43, 1226–1231. [Google Scholar]
- Schreiber, T. Measuring information transfer. Phys. Rev. Lett. 2000, 85, 461–464. [Google Scholar] [CrossRef] [PubMed]
- Kwon, O.; Yang, J.-S. Information flow between stock indices. Europhys. Lett. 2008, 82, 68003. [Google Scholar] [CrossRef]
- Bekiros, S.; Nguyen, D.K.; Junior, L.S.; Uddin, G.S. Information diffusion, cluster formation and entropy-based network dynamics in equity and commodity markets. Eur. J. Oper. Res. 2017, 256, 945–961. [Google Scholar] [CrossRef]
- Kim, Y.; Kim, J.; Yook, S.H. Information transfer network of global market indices. Phys. A 2015, 430, 39–45. [Google Scholar] [CrossRef]
- Ma, J.; Sun, Z. Mutual information is copula entropy. Tsinghua Sci. Technol. 2011, 16, 51–54. [Google Scholar] [CrossRef]
- Ma, J. Estimating transfer entropy via copula entropy. arXiv 2019, arXiv:1910.04375. [Google Scholar]
- Byun, H.M.; Park, Y.J.; Yun, E.K. An exploratory study on the policy for facilitating of health behaviors related to particulate matter: Using topic and semantic network analysis of media text. J. Korean Acad. Nurs. 2021, 51, 68–79. [Google Scholar] [CrossRef]
- Folkman, S. The case for positive emotions in the stress process. Anxiety Stress Coping 2008, 21, 3–14. [Google Scholar] [CrossRef]
- Batchelder, A.W.; Carrico, A.W.; Acree, M.; Hecht, F.M.; Moskowitz, J.T. Positive and negative self-conscious emotion and transmission risk following HIV diagnosis. AIDS Behav. 2018, 22, 1496–1502. [Google Scholar] [CrossRef]
- Ma, T.W.; Bryant, F.B.; Hou, W.K. Associations of trait positive emotion regulation with everyday emotions: An experience sampling approach. Int. J. Psychol. 2020, 55, 871–881. [Google Scholar] [CrossRef] [PubMed]
- Diener, E. Subjective well-being: The science of happiness and a proposal for a national index. Am. Psychol. 2000, 55, 34. [Google Scholar] [CrossRef] [PubMed]
- Fredrickson, B.L.; Levenson, R.W. Positive emotions speed recovery from the cardiovascular sequelae of negative emotions. Cogn. Emot. 1998, 12, 191–220. [Google Scholar] [CrossRef] [PubMed]
- Sun, N.; Wei, L.; Shi, S.; Jiao, D.; Song, R.; Ma, L.; Wang, H.; Wang, C.; Wang, Z.; You, Y.; et al. A qualitative study on the psychological experience of caregivers of COVID-19 patients. Am. J. Infect. Control 2020, 48, 592–598. [Google Scholar] [CrossRef]
- Prikhidko, A.; Long, H.; Wheaton, M.G. The effect of concerns about COVID-19 on anxiety, stress, parental burnout, and emotion regulation: The role of susceptibility to digital emotion contagion. Front. Public Health 2020, 8, 567250. [Google Scholar] [CrossRef]
- Briseño-García, A. Board interlocks and Corporate Social Responsibility data in the Mexican Stock Exchange. Data Brief 2022, 42, 108231. [Google Scholar] [CrossRef]
- Wang, Y.; Xi, M.; Chen, H.; Lu, C. Evolution and driving mechanism of tourism flow networks in the Yangtze River Delta urban agglomeration based on social network analysis and geographic information system: A double-network perspective. Sustainability 2022, 14, 7656. [Google Scholar] [CrossRef]
- Houston, D.M.; McKee, K.J.; Carroll, L.; Marsh, H. Using humour to promote psychological wellbeing in residential homes for older people. Aging Ment. Health 1998, 2, 328–332. [Google Scholar] [CrossRef]
- Keltner, D.; Bonanno, G.A. A study of laughter and dissociation: Distinct correlates of laughter and smiling during bereavement. J. Pers. Soc. Psychol. 1997, 73, 687. [Google Scholar] [CrossRef]


| Comment Date | Reviewer Nickname | Title Link | Comment |
|---|---|---|---|
| 10 March 2022 | Goose egg sister is not softhearted | https://weibo.com/u/7338779976 (accessed on 20 April 2022) | Chengdu is almost free of the epidemic. We’re down to a low-risk area. Come on. |
| 3 April 2022 | Missing little kids | https://weibo.com/u/2036291735 (accessed on 20 April 2022) | Love your city and cooperate with all anti-epidemic arrangements. Fighting the epidemic together |
| 5 April 2022 | Cheese Pig Zyra | https://weibo.com/u/2608700454 (accessed on 20 April 2022) | I feel the management gap in the region. Baoshan has not distributed materials and parts of Pudong. |
| Key Words | Frequency | tf | idf | tfidf | Key Words | Frequency | tf | idf | tfidf |
|---|---|---|---|---|---|---|---|---|---|
| Shanghai | 19636 | 135.42 | 0.79 | 106.86 | Thanks | 1875 | 12.93 | 1.74 | 22.54 |
| Epidemic | 7781 | 53.66 | 1.15 | 61.97 | Ask for help | 1750 | 12.07 | 1.85 | 22.31 |
| Come on | 5027 | 34.67 | 1.36 | 47.30 | 1711 | 11.80 | 1.79 | 21.17 | |
| Community | 2989 | 20.61 | 1.58 | 32.60 | Positive | 1502 | 10.36 | 1.89 | 19.54 |
| Nucleic acid | 2941 | 20.28 | 1.60 | 32.44 | Government | 1530 | 10.55 | 1.81 | 19.14 |
| Isolation | 2829 | 19.51 | 1.62 | 31.58 | Epidemic prevention | 1455 | 10.03 | 1.87 | 18.79 |
| Sad | 2594 | 17.89 | 1.58 | 28.26 | Shenzhen | 1340 | 9.24 | 1.92 | 17.76 |
| Anti-epidemic | 2012 | 13.88 | 1.78 | 24.65 | Safety | 1380 | 9.52 | 1.84 | 17.50 |
| Materials | 2083 | 14.37 | 1.71 | 24.55 | Bitter | 1333 | 9.19 | 1.87 | 17.18 |
| Shanghai residents | 1930 | 13.31 | 1.76 | 23.49 | Hospital | 1259 | 8.68 | 1.96 | 17.03 |
| Emotion | Example |
|---|---|
| Gratitude | It’s hard work, the angels on the front line are hard work. Pay attention to protection and return safely. You guys are the best! |
| Confidence | I believe that the epidemic situation in Shanghai will soon see the light of day. |
| Sad | We haven’t started school in Shenzhen yet, sad! When the epidemic is over, it is estimated that another half semester will have passed. I am really heartbroken! |
| Anger | Are Shanghainese not Chinese? Half of the flight goes to Shanghai, have you ever thought that the life of Shanghai people is also life? |
| No emotion | The courier guys in Hangzhou should all be quarantined! Does it feel like the courier guys across the country have been quarantined? |
| Emotion Category | Accuracy | Recall | F1 |
|---|---|---|---|
| Gratitude | 0.9694 | 0.9596 | 0.9645 |
| Confidence | 0.9714 | 0.9533 | 0.9623 |
| Sad | 0.9184 | 0.9091 | 0.9137 |
| Anger | 0.7593 | 0.8454 | 0.8000 |
| No emotion | 0.8132 | 0.7551 | 0.7831 |
| Emotion Category | Quantity | Proportion | ||
|---|---|---|---|---|
| Positive emotions | Gratitude | 10,858 | 12.14% | 19.81% |
| Confidence | 6864 | 7.67% | ||
| Negative emotions | Sad | 15,174 | 16.96% | 42.64% |
| Anger | 22,975 | 25.68% | ||
| No emotion | 33,597 | 37.55% | 37.55% | |
| Date | Positive Emotions | Negative Emotions | Daily New Cases | Date | Positive Emotions | Negative Emotions | Daily New Cases |
|---|---|---|---|---|---|---|---|
| 3.10 | 10 | 2 | 75 | 3.25 | 21 | 221 | 2269 |
| 3.11 | 210 | 219 | 83 | 3.26 | 190 | 226 | 2676 |
| 3.12 | −85 | −25 | 65 | 3.27 | −191 | 379 | 3500 |
| 3.13 | 101 | 81 | 169 | 3.28 | −75 | −376 | 4477 |
| 3.14 | 340 | 240 | 139 | 3.29 | −24 | 12 | 5982 |
| 3.15 | −210 | 146 | 202 | 3.30 | 307 | 608 | 5653 |
| 3.16 | 198 | −325 | 158 | 3.31 | 188 | 476 | 4502 |
| 3.17 | −248 | −166 | 260 | 4.1 | −301 | −603 | 6311 |
| 3.18 | −40 | 19 | 374 | 4.2 | 373 | 1543 | 8226 |
| 3.19 | −107 | 21 | 509 | 4.3 | 295 | 299 | 9006 |
| 3.20 | 383 | 137 | 758 | 4.4 | 482 | −117 | 13,354 |
| 3.21 | 17 | −109 | 896 | 4.5 | −385 | 412 | 17,077 |
| 3.22 | −149 | 24 | 981 | 4.6 | −19 | −161 | 19,982 |
| 3.23 | −216 | 112 | 983 | 4.7 | −79 | −199 | 21,222 |
| 3.24 | 167 | 26 | 1609 | 4.8 | 20 | 527 | 23,624 |
Publisher’s Note: MDPI stays neutral with regard to jurisdictional claims in published maps and institutional affiliations. |
© 2022 by the authors. Licensee MDPI, Basel, Switzerland. This article is an open access article distributed under the terms and conditions of the Creative Commons Attribution (CC BY) license (https://creativecommons.org/licenses/by/4.0/).
Share and Cite
Zhang, B.; Lin, J.; Luo, M.; Zeng, C.; Feng, J.; Zhou, M.; Deng, F. Changes in Public Sentiment under the Background of Major Emergencies—Taking the Shanghai Epidemic as an Example. Int. J. Environ. Res. Public Health 2022, 19, 12594. https://doi.org/10.3390/ijerph191912594
Zhang B, Lin J, Luo M, Zeng C, Feng J, Zhou M, Deng F. Changes in Public Sentiment under the Background of Major Emergencies—Taking the Shanghai Epidemic as an Example. International Journal of Environmental Research and Public Health. 2022; 19(19):12594. https://doi.org/10.3390/ijerph191912594
Chicago/Turabian StyleZhang, Bowen, Jinping Lin, Man Luo, Changxian Zeng, Jiajia Feng, Meiqi Zhou, and Fuying Deng. 2022. "Changes in Public Sentiment under the Background of Major Emergencies—Taking the Shanghai Epidemic as an Example" International Journal of Environmental Research and Public Health 19, no. 19: 12594. https://doi.org/10.3390/ijerph191912594
APA StyleZhang, B., Lin, J., Luo, M., Zeng, C., Feng, J., Zhou, M., & Deng, F. (2022). Changes in Public Sentiment under the Background of Major Emergencies—Taking the Shanghai Epidemic as an Example. International Journal of Environmental Research and Public Health, 19(19), 12594. https://doi.org/10.3390/ijerph191912594