
Association of Absolute and Relative Handgrip Strength with Prevalent Metabolic Syndrome in Adults: Korea National Health and Nutrition Examination Survey 2014–2018


Abstract
:1. Introduction
2. Materials and Methods
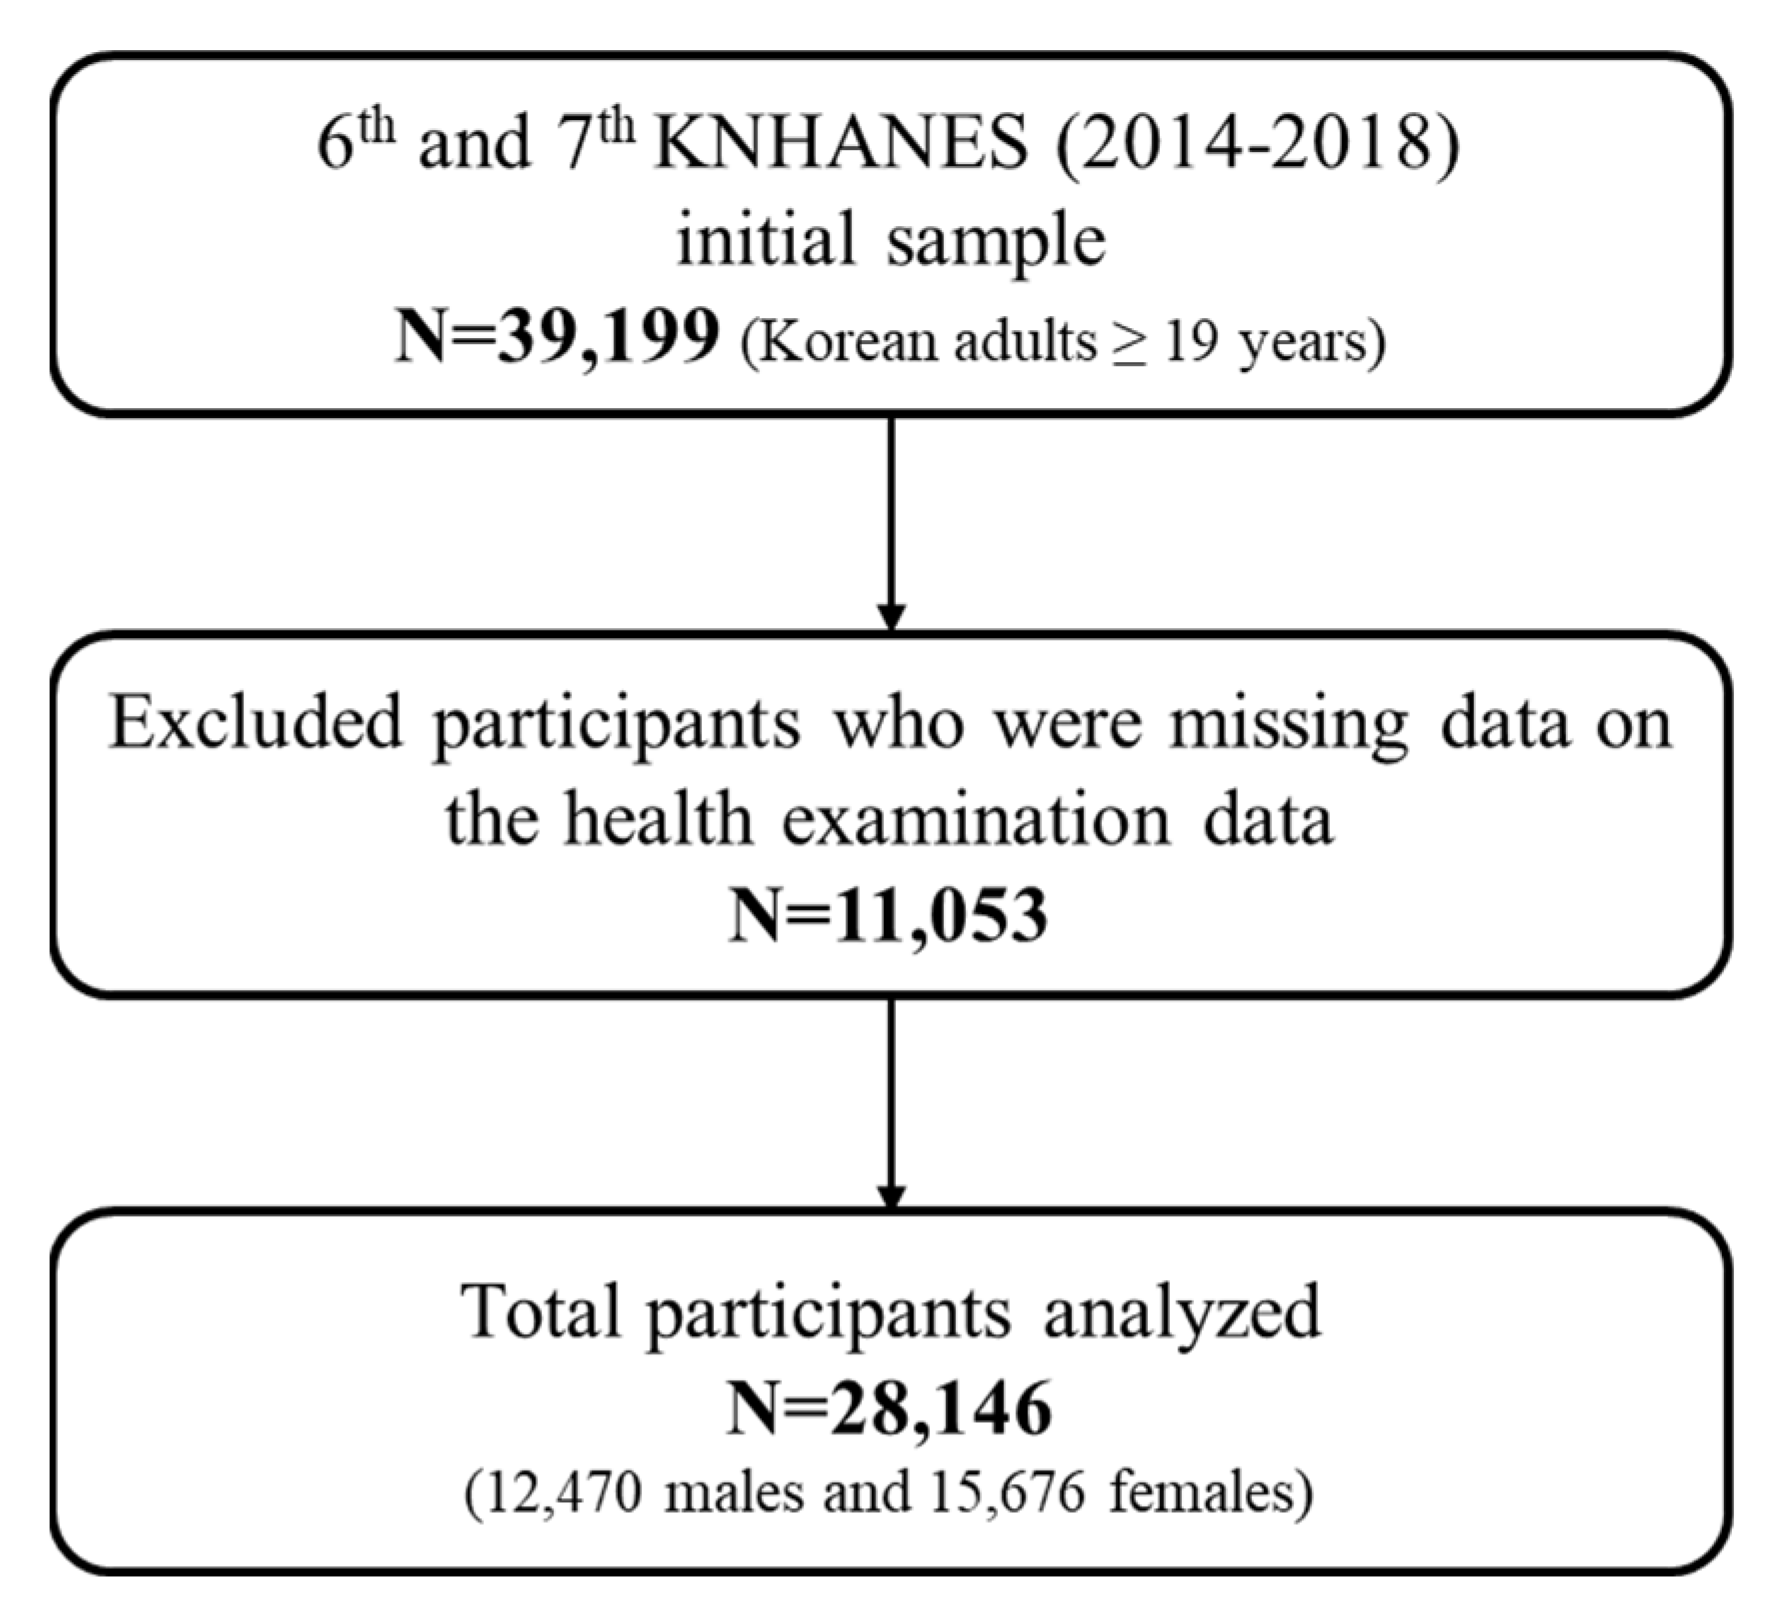
2.1. Study Participants
2.2. Anthropometric and Biochemistry Measures
2.3. HGS Measurement
2.4. MetS Diagnosis and Covariates
2.5. Statistical Analyses
3. Results
3.1. Baseline Characteristics
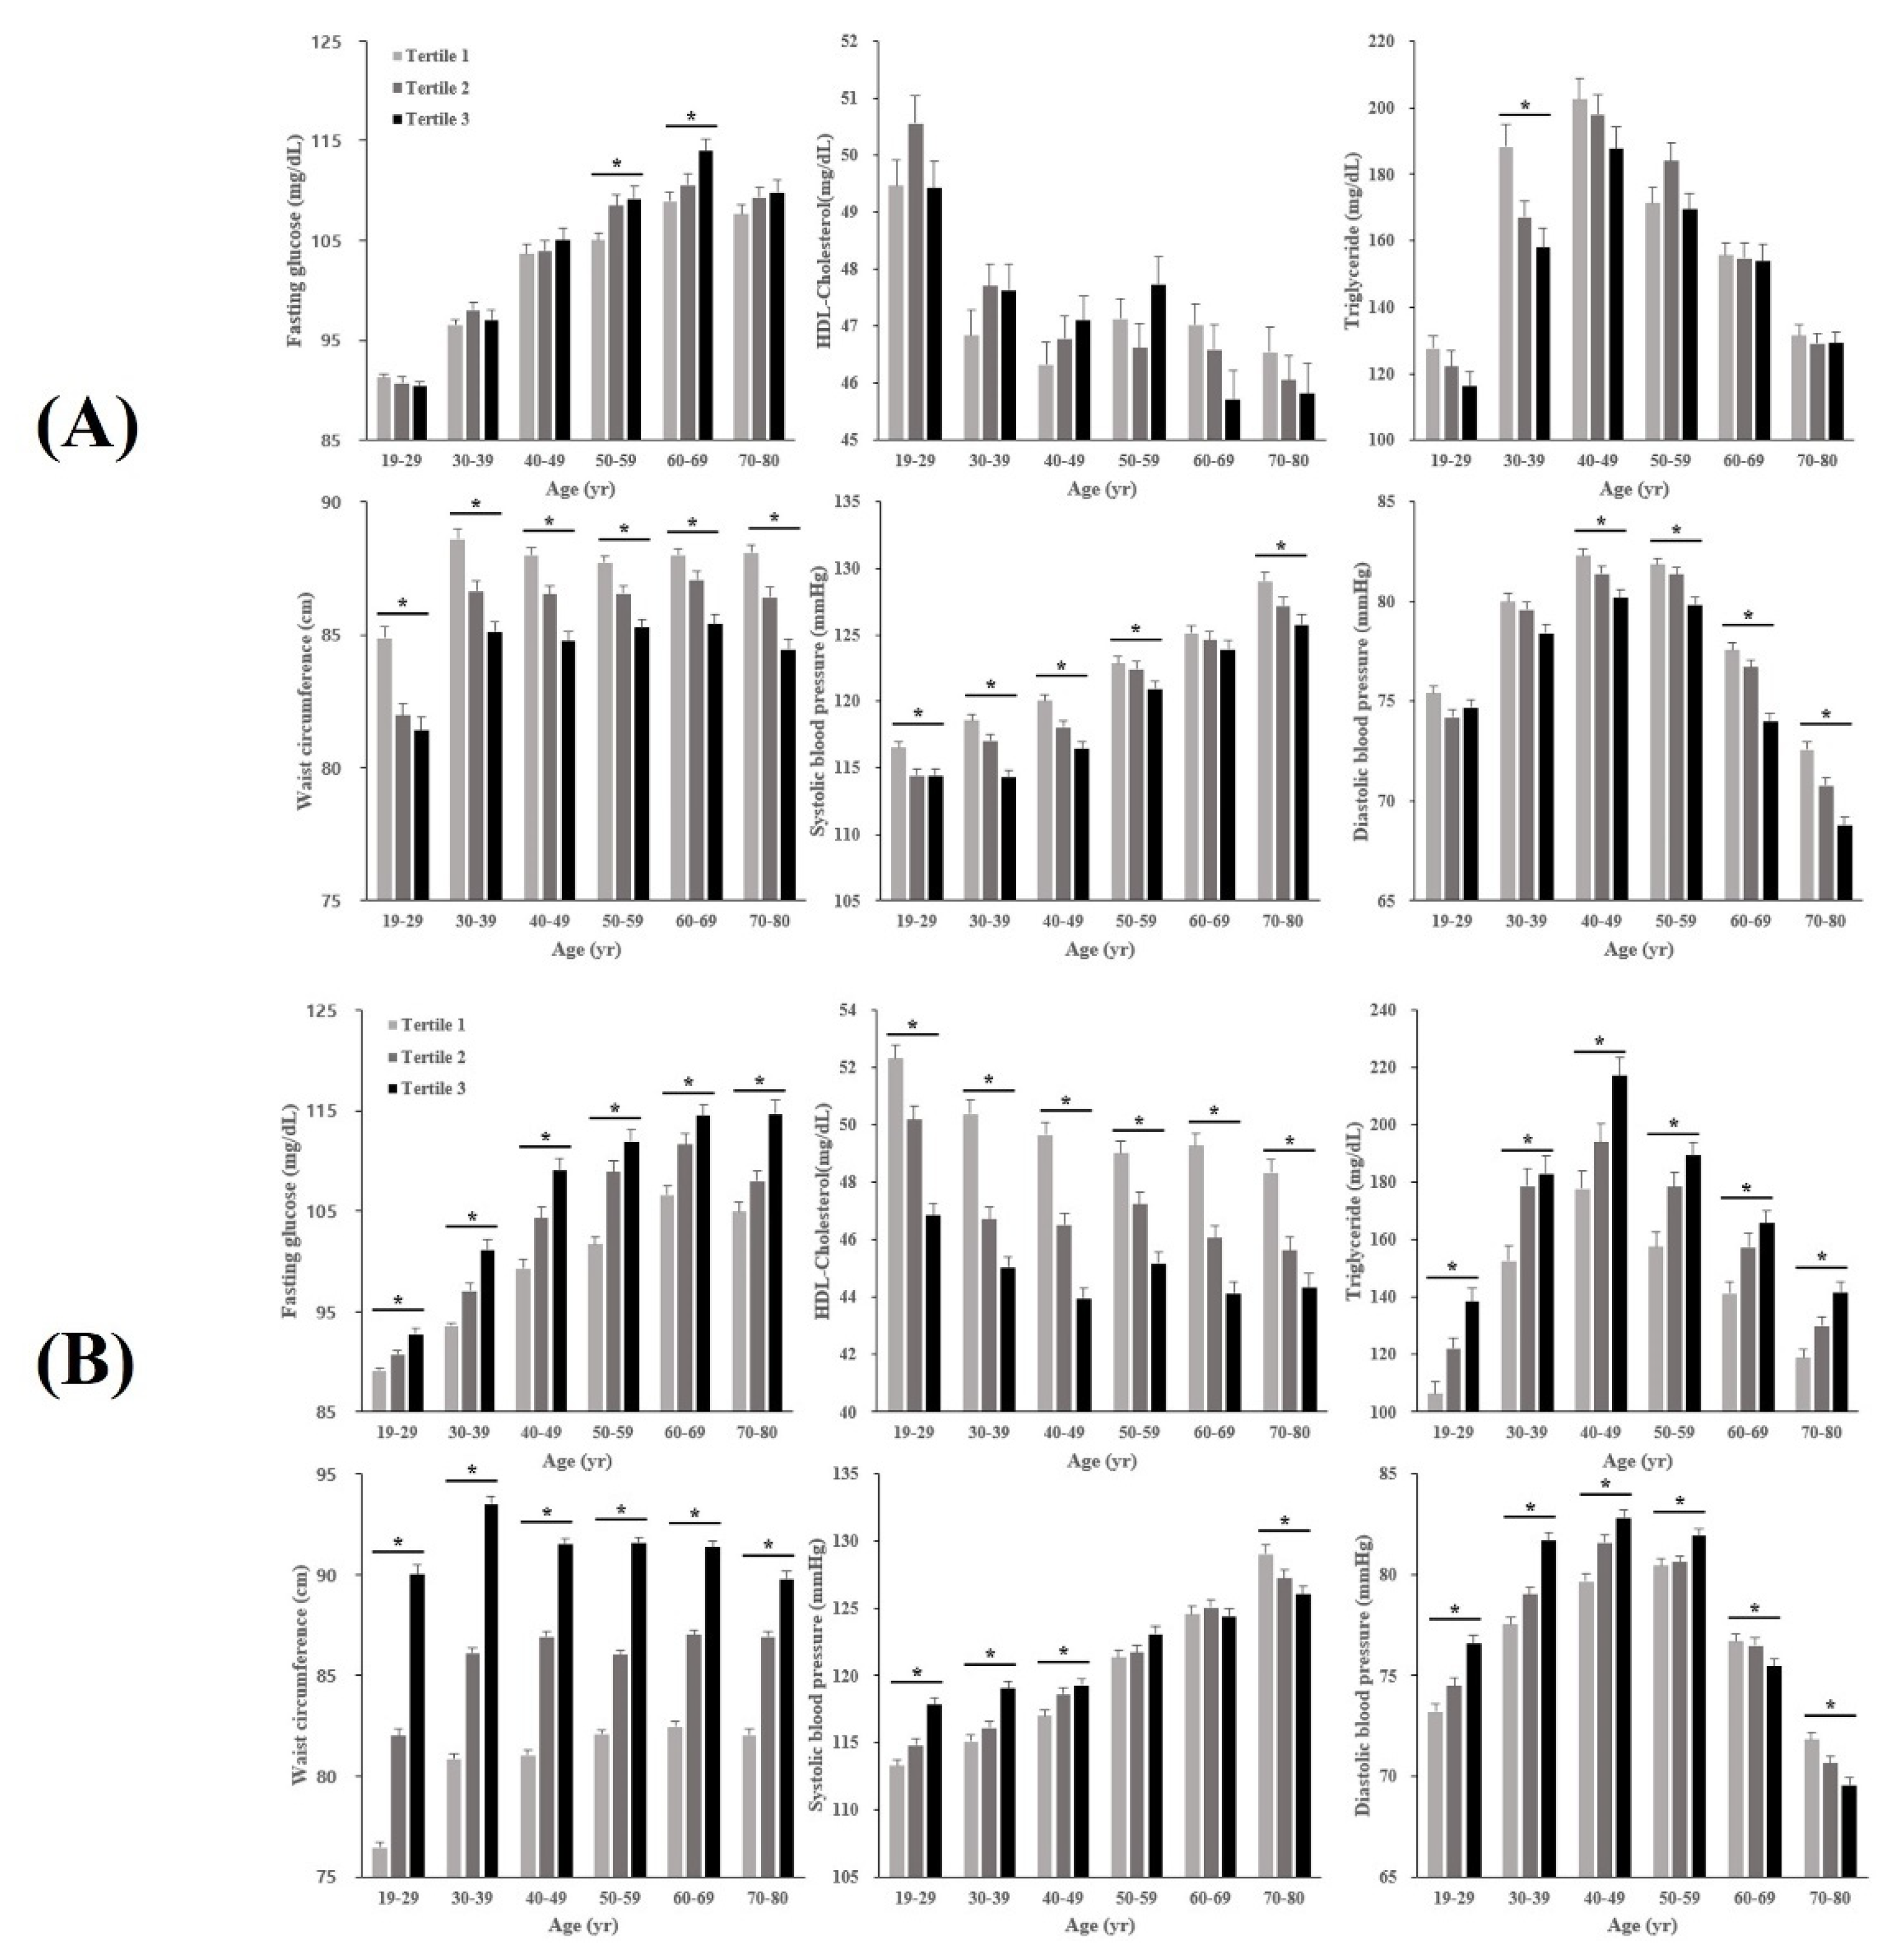
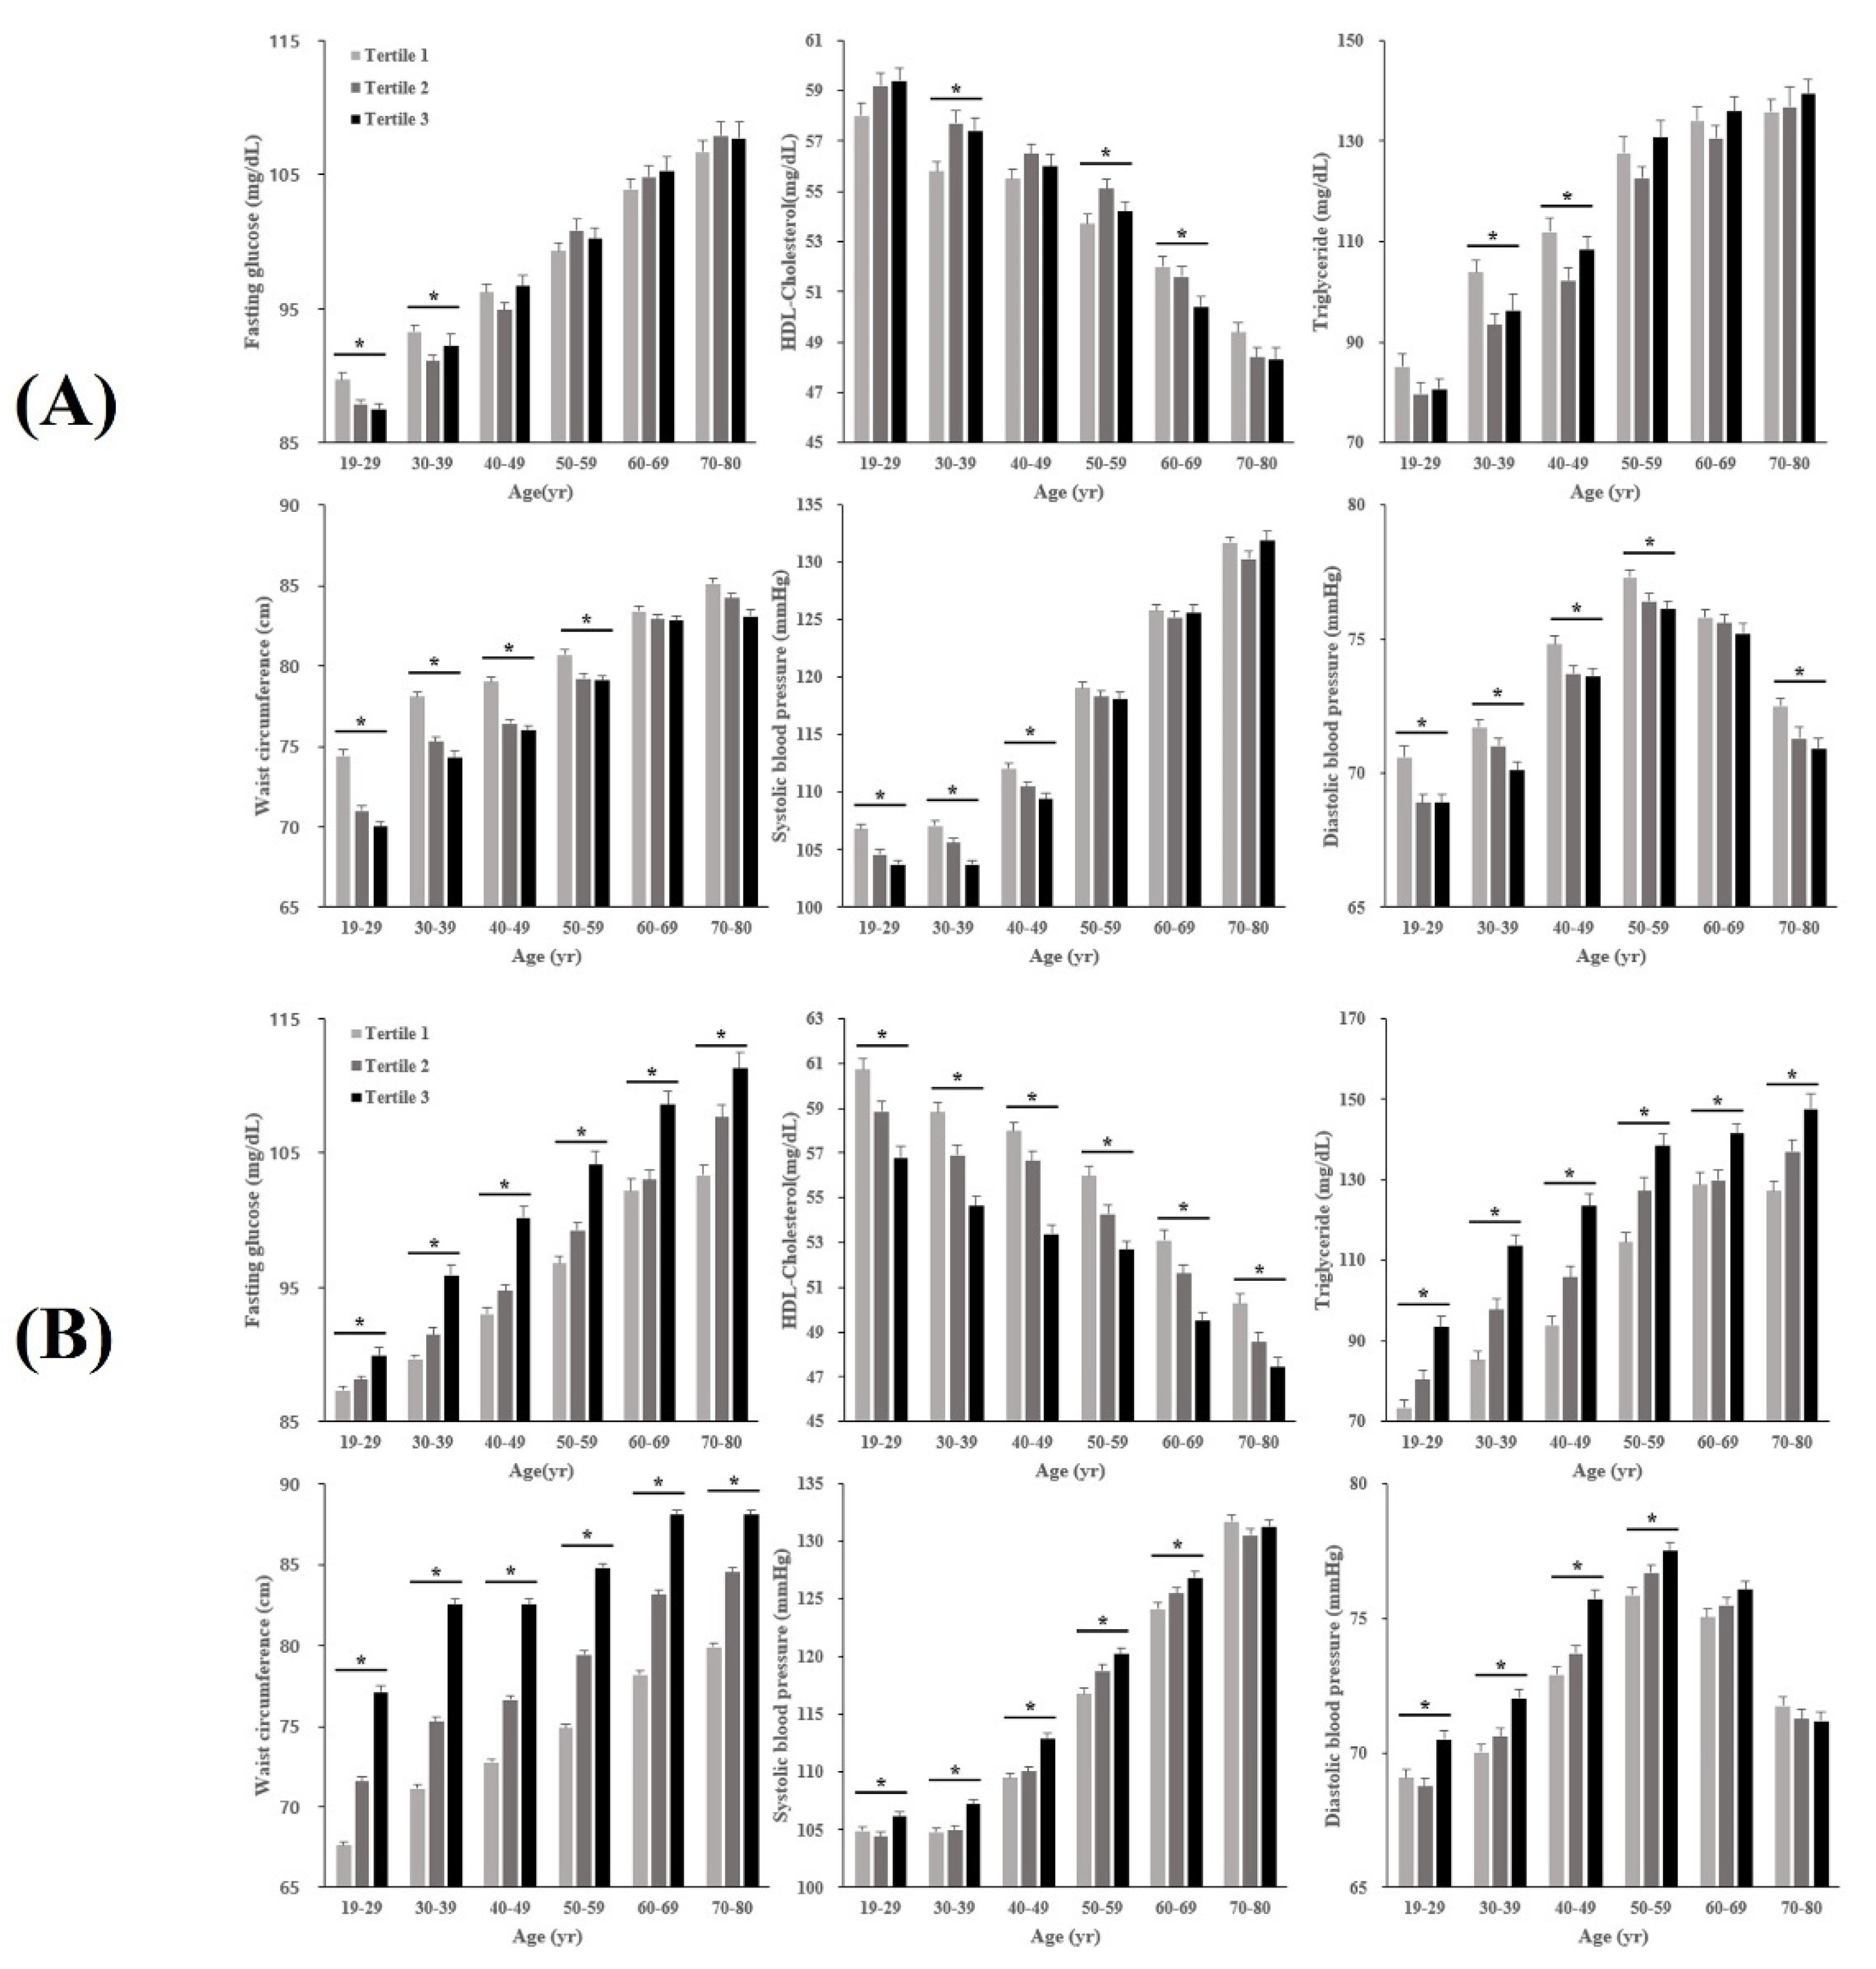
3.2. Characteristics of MetS Components across AHGS and RHGS Tertiles by Age Groups
3.3. Association of Absolute and Relative HGS with MetS in Males
3.4. Association of Absolute and Relative HGS with MetS in Females
4. Discussion
5. Conclusions
Supplementary Materials
Author Contributions
Funding
Institutional Review Board Statement
Informed Consent Statement
Data Availability Statement
Acknowledgments
Conflicts of Interest
References
- Saklayen, M.G. The global epidemic of the metabolic syndrome. Curr. Hypertens. Rep. 2018, 20, 12. [Google Scholar] [CrossRef] [PubMed] [Green Version]
- Grundy, S.M. Metabolic syndrome: A multiplex cardiovascular risk factor. J. Clin. Endocrinol. Metab. 2007, 92, 399–404. [Google Scholar] [CrossRef] [PubMed]
- Esposito, K.; Chiodini, P.; Colao, A.; Lenzi, A.; Giugliano, D. Metabolic syndrome and risk of cancer: A systematic review and meta-analysis. Diabetes Care 2012, 35, 2402–2411. [Google Scholar] [CrossRef] [PubMed] [Green Version]
- The International Diabetes Federation (IDF). The IDF Consensus Worldwide Definition of the Metabolic Syndrome; IDF Communications: Brussels, Belgium, 2006; pp. 1–24. [Google Scholar]
- Alberti, K.G.M.M.; Eckel, R.F.; Grundy, S.M.; Zimmet, P.Z.; Cleeman, J.I.; Donato, K.A.; Fruchart, J.-C.; James, W.P.T.; Loria, C.M.; Smith, S.C., Jr. Harmonizing the metabolic syndrome: A joint interim statement of the international diabetes federation task force on epidemiology and prevention; national heart, lung, and blood institute; American heart association; world heart federation; international atherosclerosis society; and international association for the study of obesity. Circulation 2009, 120, 1640–1645. [Google Scholar]
- Petersen, K.F.; Dufour, S.; Savage, D.B.; Bilz, S.; Solomon, G.; Yonemitsu, S.; Cline, G.W.; Befroy, D.; Zemany, L.; Kahn, B.B.; et al. The role of skeletal muscle insulin resistance in the pathogenesis of the metabolic syndrome. Proc. Natl. Acad. Sci. USA 2007, 104, 12587–12594. [Google Scholar] [CrossRef] [Green Version]
- Jurca, R.; Lamonte, M.J.; Church, T.S.; Earnest, C.P.; Fitzgerald, S.J.; Barlow, C.E.; Jordan, A.N.; Kampert, J.B.; Blair, S.N. Associations of muscle strength and fitness with metabolic syndrome in men. Med. Sci. Sports Exerc. 2004, 36, 1301–1307. [Google Scholar] [CrossRef] [Green Version]
- Koopman, R.; van Loon, L.J. Aging, exercise, and muscle protein metabolism. J. Appl. Physiol. 2009, 106, 2040–2048. [Google Scholar] [CrossRef]
- Sayer, A.A.; Syddall, H.; Dennison, E.; Martin, H.; Phillips, D.; Cooper, C.; Byrne, C.D. Grip strength and the metabolic syndrome: Findings from the Hertfordshire Cohort Study. QJM 2007, 100, 707–713. [Google Scholar] [CrossRef] [Green Version]
- Cetinus, E.; Buyukbese, M.A.; Uzel, M.; Ekerbicer, H.; Karaoguz, A. Hand grip strength in patients with type 2 diabetes mellitus. Diabetes Res. Clin. Pract. 2005, 70, 278–286. [Google Scholar] [CrossRef]
- Li, R.; Xia, J.; Zhang, X.; Gathirua-Mwangi, W.G.; Guo, J.; Li, Y.; Mckenzie, S.; Song, Y. Associations of muscle mass and strength with all-cause mortality among US older adults. Med. Sci. Sports Exerc. 2018, 50, 458. [Google Scholar] [CrossRef]
- Isoyama, N.; Qureshi, A.R.; Avesani, C.M.; Lindholm, B.; Bàràny, P.; Heimbürger, O.; Cederholm, T.; Stenvinkel, P.; Carrero, J.J. Comparative associations of muscle mass and muscle strength with mortality in dialysis patients. Clin. J. Am. Soc. Nephrol. 2014, 9, 1720–1728. [Google Scholar] [CrossRef] [PubMed] [Green Version]
- Newman, A.B.; Kupelian, V.; Visser, M.; Simonsick, E.M.; Goodpaster, B.H.; Kritchevsky, S.B.; Tylavsky, F.A.; Rubin, S.M.; Harris, T.B. Strength, but not muscle mass, is associated with mortality in the health, aging and body composition study cohort. J. Gerontol. Ser. A Biol. Sci. Med. Sci. 2006, 61, 72–77. [Google Scholar] [CrossRef] [PubMed] [Green Version]
- Goodpaster, B.H.; Park, S.W.; Harris, T.B.; Kritchevsky, S.B.; Nevitt, M.; Schwartz, A.V.; Simonsick, E.M.; Tylavsky, F.A.; Visser, M.; Newman, A.B.; et al. The loss of skeletal muscle strength, mass, and quality in older adults: The health, aging and body composition study. J. Gerontol. Ser. A Biol. Sci. Med. Sci. 2006, 61, 1059–1064. [Google Scholar] [CrossRef] [PubMed]
- Hughes, V.A.; Frontera, W.R.; Wood, M.; Evans, W.J.; Dallal, G.E.; Roubenoff, R.; Singh, M.A.F. Longitudinal muscle strength changes in older adults: Influence of muscle mass, physical activity, and health. J. Gerontol. Ser. A Biol. Sci. Med. Sci. 2001, 56, B209–B217. [Google Scholar] [CrossRef]
- Wind, A.E.; Takken, T.; Helders, P.J.; Engelbert, R.H. Is grip strength a predictor for total muscle strength in healthy children, adolescents, and young adults? Eur. J. Pediatr. 2010, 169, 281–287. [Google Scholar] [CrossRef]
- Chung, C.J.; Wu, C.; Jones, M.; Kato, T.S.; Dam, T.T.; Givens, R.C.; Templeton, D.L.; Maurer, M.S.; Naka, Y.; Takayama, H.; et al. Reduced handgrip strength as a marker of frailty predicts clinical outcomes in patients with heart failure undergoing ventricular assist device placement. J. Card. Fail. 2014, 20, 310–315. [Google Scholar] [CrossRef] [Green Version]
- Jochem, C.; Leitzmann, M.; Volaklis, K.; Aune, D.; Strasser, B. Association between muscular strength and mortality in clinical populations: A systematic review and meta-analysis. J. Am. Med. Dir. Assoc. 2019, 20, 1213–1223. [Google Scholar] [CrossRef]
- McGrath, R.P.; Kraemer, W.J.; Al Snih, S.; Peterson, M.D. Handgrip strength and health in aging adults. Sports Med. 2018, 48, 1993–2000. [Google Scholar] [CrossRef]
- Kawamoto, R.; Ninomiya, D.; Kasai, Y.; Kusunoki, T.; Ohtsuka, N.; Kumagi, T.; Abe, M. Handgrip strength is associated with metabolic syndrome among middle-aged and elderly community-dwelling persons. Clin. Exp. Hypertens. 2016, 38, 245–251. [Google Scholar] [CrossRef]
- Hong, S. Association of relative handgrip strength and metabolic syndrome in Korean older adults: Korea National Health and Nutrition Examination Survey VII-1. J. Obes. Metab. Syndr. 2019, 28, 53. [Google Scholar] [CrossRef] [Green Version]
- Kang, Y.; Park, S.; Kim, S.; Koh, H. Handgrip strength among Korean adolescents with metabolic syndrome in 2014–2015. J. Clin. Densitom. 2020, 23, 271–277. [Google Scholar] [CrossRef] [PubMed]
- Ji, C.; Xia, Y.; Tong, S.; Wu, Q.; Zhao, Y. Association of handgrip strength with the prevalence of metabolic syndrome in US adults: The national health and nutrition examination survey. Aging 2020, 12, 7818. [Google Scholar] [CrossRef] [PubMed]
- Yang, E.J.; Lim, S.; Lim, J.-Y.; Kim, K.W.; Jang, H.C.; Paik, N.-J. Association between muscle strength and metabolic syndrome in older Korean men and women: The Korean Longitudinal Study on Health and Aging. Metabolism 2012, 61, 317–324. [Google Scholar] [CrossRef] [PubMed]
- Budziareck, M.B.; Duarte, R.R.P.; Barbosa-Silva, M.C.G. Reference values and determinants for handgrip strength in healthy subjects. Clin. Nutr. 2008, 27, 357–362. [Google Scholar] [CrossRef]
- Yi, D.; Khang, A.R.; Lee, H.W.; Son, S.M.; Kang, Y.H. Relative handgrip strength as a marker of metabolic syndrome: The Korea National Health and Nutrition Examination Survey (KNHANES) VI (2014–2015). Diabetes Metab. Syndr. Obes. Targets Ther. 2018, 11, 227. [Google Scholar] [CrossRef] [Green Version]
- Byeon, J.Y.; Lee, M.K.; Yu, M.-S.; Kang, M.J.; Lee, D.H.; Kim, K.C.; Im, J.A.; Kim, S.H.; Jeon, J.Y. Lower relative handgrip strength is significantly associated with a higher prevalence of the metabolic syndrome in adults. Metab. Syndr. Relat. Disord. 2019, 17, 280–288. [Google Scholar] [CrossRef]
- Chun, S.-W.; Kim, W.; Choi, K.H. Comparison between grip strength and grip strength divided by body weight in their relationship with metabolic syndrome and quality of life in the elderly. PLoS ONE 2019, 14, e0222040. [Google Scholar] [CrossRef]
- Ho, F.K.W.; A Celis-Morales, C.; Rocha, F.P.; Sillars, A.; Welsh, P.; Welsh, C.; Anderson, J.; Lyall, D.M.; Mackay, D.F.; Sattar, N.; et al. The association of grip strength with health outcomes does not differ if grip strength is used in absolute or relative terms: A prospective cohort study. Age Ageing 2019, 48, 684–691. [Google Scholar] [CrossRef]
- Rantanen, T.; Harris, T.; Leveille, S.G.; Visser, M.; Foley, D.; Masaki, K.; Guralnik, J.M. Muscle strength and body mass index as long-term predictors of mortality in initially healthy men. J. Gerontol. Ser. A Biol. Sci. Med. Sci. 2000, 55, M168–M173. [Google Scholar] [CrossRef] [Green Version]
- Kim, Y.; Wijndaele, K.; Lee, D.C.; Sharp, S.J.; Wareham, N.; Brage, S. Independent and joint associations of grip strength and adiposity with all-cause and cardiovascular disease mortality in 403,199 adults: The UK Biobank study. Am. J. Clin. Nutr. 2017, 106, 773–782. [Google Scholar] [CrossRef] [Green Version]
- Chong, H.; Choi, Y.E.; Kong, J.Y.; Park, J.H.; Yoo, H.J.; Byeon, J.H.; Lee, H.J.; Lee, S.H. Association of Hand Grip Strength and Cardiometabolic Markers in Korean Adult Population: The Korea National Health and Nutrition Examination Survey 2015–2016. Korean J. Fam. Med. 2020, 41, 291–298. [Google Scholar] [CrossRef] [PubMed]
- McGrath, R.; Hackney, K.J.; Ratamess, N.A.; Vincent, B.M.; Clark, B.C.; Kraemer, W.J. Absolute and body mass index normalized handgrip strength percentiles by gender, ethnicity, and hand dominance in Americans. Adv. Geriatr. Med. Res. 2020, 2, e200005. [Google Scholar]
- Kweon, S.; Kim, Y.; Jang, M.-J.; Kim, Y.; Kim, K.; Choi, S.; Chun, C.; Khang, Y.-H.; Oh, K. Data resource profile: The Korea national health and nutrition examination survey (KNHANES). Int. J. Epidemiol. 2014, 43, 69–77. [Google Scholar] [CrossRef] [PubMed] [Green Version]
- Judd, C.M.; McClelland, G.H.; Ryan, C.S. Data Analysis: A Model Comparison Approach to Regression, ANOVA, and Beyond, 3rd ed.; Routlegde: New York, NY, USA, 2017; p. 378. [Google Scholar]
- Ugoni, A.; Walker, B.F. The Chi Square Test. COMSIG Rev. 1995, 4, 61–64. [Google Scholar] [PubMed]
- Sperandei, S. Understanding logistic regression analysis. Biochem. Med. 2014, 15, 12–18. [Google Scholar] [CrossRef] [PubMed]
- Teixeira, J.E.; Bragada, J.A.; Bragada, J.P.; Coelho, J.P.; Pinto, I.G.; Reis, L.P. Structural Equation Modelling for Predicting the Relative Contribution of Each Component in the Metabolic Syndrome Status Change. Int. J. Environ. Res. Public Health 2022, 19, 3384. [Google Scholar] [CrossRef] [PubMed]
- Scott, D.; Park, M.S.; Kim, T.N.; Ryu, J.Y.; Hong, H.C.; Yoo, H.J.; Baik, S.H.; Jones, G.; Choi, K.M. Associations of low muscle mass and the metabolic syndrome in Caucasian and Asian middle-aged and older adults. J. Nutr. Health Aging 2016, 20, 248–255. [Google Scholar] [CrossRef]
- Kim, B.C.; Kim, M.K.; Han, K.; Lee, S.-Y.; Lee, S.-H.; Ko, S.-H.; Kwon, H.-S.; Merchant, A.T.; Yim, H.W.; Lee, W.-C.; et al. Low muscle mass is associated with metabolic syndrome only in nonobese young adults: The Korea National Health and Nutrition Examination Survey 2008–2010. Nutr. Res. 2015, 35, 1070–1078. [Google Scholar] [CrossRef]
- Ferrara, C.M.; Goldberg, A.P.; Ortmeyer, H.K.; Ryan, A.S. Effects of aerobic and resistive exercise training on glucose disposal and skeletal muscle metabolism in older men. J. Gerontol. Ser. A Biol. Sci. Med. Sci. 2006, 61, 480–487. [Google Scholar] [CrossRef] [Green Version]
- Helander, I.; Westerblad, H.; Katz, A. Effects of glucose on contractile function, [Ca2+]i, and glycogen in isolated mouse skeletal muscle. Am. J. Physiol.-Cell. Physiol. 2002, 282, C1306–C1312. [Google Scholar] [CrossRef] [Green Version]
- Lee, S.S.; Kim, D.H.; Nam, G.E.; Nam, H.Y.; Kim, Y.E.; Lee, S.H.; Han, K.D.; Park, Y.G. Association between Metabolic Syndrome and Menstrual Irregularity in Middle-Aged Korean Women. Korean J. Fam. Med. 2016, 37, 31–36. [Google Scholar] [CrossRef] [PubMed] [Green Version]
- Vishnu, A.; Gurka, M.J.; DeBoer, M.D. The Severity of the Metabolic Syndrome Increases over Time within Individuals, Independent of Baseline Metabolic Syndrome Status and Medication Use: The Atherosclerosis Risk in Communities Study. Atherosclerosis 2015, 246, 278–285. [Google Scholar] [CrossRef] [PubMed]
- Hunt, K.J.; Heiss, G.; Sholinsky, P.D.; Province, M.A. Familial history of metabolic disorders and the multiple metabolic syndrome: The NHLBI family heart study. Genet. Epidemiol. 2000, 19, 395–409. [Google Scholar] [CrossRef]


| Males (n = 12,470) | Females (n = 15,676) | |||||||
|---|---|---|---|---|---|---|---|---|
| Characteristics | T1 > 43 kg | 37 kg ≤ T2 ≤ 43 kg | 37 kg > T3 | p | T1 > 26 kg | 22 kg ≤ T2 ≤ 26 kg | 22 kg > T3 | p |
| (n = 4379) | (n = 4250) | (n = 3841) | (n = 6327) | (n = 4649) | (n = 4700) | |||
| Age, years | 43.1 ± 12.6 | 50.3 ± 15.6 * | 61.4 ± 17.1 ** | <0.001 | 45.4 ± 13.5 | 50.3 ± 16.0 * | 60.0 ± 17.8 ** | <0.001 |
| Height, cm | 173.7 ± 5.8 | 170.2 ± 6.0 * | 166.2 ± 6.7 ** | <0.001 | 159.9 ± 5.7 | 157.1 ± 5.9 * | 153.4 ± 6.7 ** | <0.001 |
| Weight, kg | 76.3 ± 11.4 | 70.6 ± 10.4 * | 64.8 ± 10.4 ** | <0.001 | 60.7 ± 9.7 | 57.1 ± 8.4 * | 55.2 ± 8.8 ** | <0.001 |
| BMI, kg/m2 | 25.3 ± 3.3 | 24.4 ± 3.2 * | 23.4 ± 3.2 ** | <0.001 | 23.8 ± 3.7 | 23.2 ± 3.5 * | 23.5 ± 3.6 ** | <0.001 |
| MetS component | ||||||||
| WC, cm | 87.3 ± 8.8 | 86.1 ± 8.8 * | 84.9 ± 9.3 ** | <0.001 | 79.1 ± 9.8 | 78.3 ± 9.7 * | 80.2 ± 10.2 ** | <0.001 |
| SBP, mmHg | 119.9 ± 13.4 | 120.8 ± 15.2 * | 122.8 ± 16.4 ** | <0.001 | 114.2 ± 16.0 | 116.0 ± 17.4 * | 121.4 ± 19.5 ** | <0.001 |
| DBP, mmHg | 79.9 ± 9.9 | 78.1 ± 9.9 * | 73.9 ± 10.5 ** | <0.001 | 74.0 ± 9.6 | 73.2 ± 9.5 * | 72.5 ± 9.8 ** | <0.001 |
| Glucose, mg/dL | 100.8 ± 21.0 | 104.4 ± 27.4 * | 107.4 ± 29.4 ** | <0.001 | 96.6 ± 18.6 | 98.0 ± 23.1 * | 102.0 ± 26.0 ** | <0.001 |
| HDL-C, mg/dL | 47.3 ± 10.9 | 47.5 ± 11.3 | 46.6 ± 11.8 ** | 0.002 | 55.1 ± 12.6 | 55.0 ± 12.8 | 52.2 ± 12.5 ** | <0.001 |
| TG, mg/dL | 172.7 ± 144.8 | 162.7 ± 136.7 * | 144.5 ± 107.3 ** | <0.001 | 112.8 ± 86.5 | 112.3 ± 74.3 | 124.7 ± 84.6 ** | <0.001 |
| Absolute handgrip strength, kg | 48.8 ± 4.4 | 40.0 ± 2.0 * | 30.9 ± 4.8 ** | <0.001 | 29.1 ± 2.8 | 23.5 ± 1.1 * | 17.9 ± 2.9 ** | <0.001 |
| Relative handgrip strength | 0.65 ± 0.1 | 0.58 ± 0.1 * | 0.49 ± 0.1 ** | <0.001 | 0.49 ± 0.1 | 0.42 ± 0.1 * | 0.33 ± 0.1 ** | <0.001 |
| No. of MetS components, n (%) a | <0.001 | <0.001 | ||||||
| 1 | 1046 (24.6) | 1000 (24.4) | 928 (26.1) | 1251 (25.4) | 1388 (25) | 901 (21.2) | ||
| 2 | 986 (23.2) | 988 (24.1) | 921 (26) | 1025 (20.8) | 1042 (18.8) | 916 (21.6) | ||
| 3 | 726 (17.1) | 736 (18) | 614 (17.3) | 652 (13.2) | 792 (14.3) | 851 (20.1) | ||
| 4 | 437 (10.3) | 384 (9.4) | 328 (9.2) | 370 (7.5) | 437 (7.9) | 501 (11.8) | ||
| 5 | 134 (3.2) | 92 (2.2) | 71 (2) | 92 (1.9) | 125 (2.3) | 168 (4) | ||
| MetS | 1297 (30.5) | 1212 (29.6) | 1013 (28.5) | 0.004 | 1114 (22.6) | 1354 (24.4) | 1520 (35.8) | <0.001 |
| Alcohol consumption | <0.001 | <0.001 | ||||||
| None | 318 (7.3) | 487 (11.5) | 741 (19.3) | 1070 (16.9) | 827 (17.8) | 996 (21.2) | ||
| ≤1 time/month | 871 (19.9) | 888 (20.9) | 718 (18.7) | 2261 (35.8) | 1608 (34.6) | 1343 (28.6) | ||
| 2–4 time/month | 1308 (29.9) | 1112 (26.2) | 774 (20.2) | 1420 (22.5) | 913 (19.7) | 572 (12.2) | ||
| 2–3 times/week | 1154 (26.4) | 951 (22.4) | 665 (17.3) | 695 (11.0) | 405 (8.7) | 270 (5.7) | ||
| ≥4 times/week | 495 (11.3) | 545 (12.8) | 520 (13.5) | 154 (2.4) | 115 (2.5) | 111 (2.4) | ||
| Smoking status | <0.001 | <0.001 | ||||||
| Never or past | 2470 (56.4) | 2663 (62.7) | 2680 (69.8) | 5866 (92.8) | 4330 (93.2) | 4342 (92.4) | ||
| Current | 1786 (40.8) | 1485 (34.9) | 1031 (26.8) | 353 (5.6) | 223 (4.8) | 176 (3.7) | ||
| Education | <0.001 | <0.001 | ||||||
| Elementary school | 123 (2.8) | 380 (8.9) | 906 (23.6) | 627 (9.9) | 925 (19.9) | 1891 (40.3) | ||
| Middle school | 235 (5.4) | 449 (10.6) | 562 (14.6) | 557 (8.8) | 538 (11.6) | 516 (11.0) | ||
| High school | 1204 (27.5) | 1150 (27.1) | 853 (22.2) | 1968 (31.1) | 1172 (25.2) | 792 (16.9) | ||
| College or higher | 2139 (48.8) | 1727 (40.6) | 1016 (26.5) | 2593 (41) | 1586 (34.2) | 1030 (21.9) | ||
| Income (quartile) | <0.001 | <0.001 | ||||||
| Lowest | 296 (6.8) | 589 (13.9) | 1238 (32.2) | 627 (9.9) | 841 (18.1) | 1687 (35.9) | ||
| Mid–low | 955 (21.8) | 1037 (24.4) | 1011 (26.3) | 557 (8.8) | 1171 (25.2) | 1104 (23.5) | ||
| Mid–high | 1506 (34.4) | 1216 (28.6) | 799 (20.8) | 1968 (31.1) | 1298 (28.0) | 929 (19.8) | ||
| Highest | 1616 (36.9) | 1391 (32.7) | 763 (19.9) | 2593 (41.0) | 1317 (28.4) | 952 (20.3) | ||
| Resistance training (days/week) | <0.001 | <0.001 | ||||||
| None | 2511 (57.3) | 2658 (62.5) | 2633 (68.5) | 668 (10.6) | 3685 (79.3) | 3894 (82.9) | ||
| 1–2 | 522 (11.9) | 425 (10.0) | 244 (6.4) | 1556 (24.6) | 301 (6.5) | 175 (3.7) | ||
| 3–4 | 534 (12.2) | 407 (9.6) | 255 (6.6) | 1974 (31.2) | 245 (5.3) | 155 (3.3) | ||
| ≥5 | 455 (10.4) | 508 (12.0) | 420 (10.9) | 2096 (33.2) | 202 (4.3) | 136 (2.9) | ||
| Age (Years) | Absolute HGS | n | Unadjusted | Adjusted | Relative HGS | n | Unadjusted | Adjusted |
|---|---|---|---|---|---|---|---|---|
| Odds Ratio (95% CI) | Odds Ratio (95% CI) | |||||||
| Total | 43 kg < T1 | 4379 | Referent | Referent | 0.62 < T1 | 4159 | Referent | Referent |
| 37 kg ≤ T2 ≤ 43 kg | 4250 | 0.94 (0.86–1.04) | 0.83 (0.75–0.93) | 0.53 ≤ T2 ≤ 0.62 | 4154 | 2.30 (2.07–2.56) | 2.32 (2.06–2.62) | |
| 37 kg > T3 | 3841 | 0.85 (0.77–0.94) | 0.59 (0.52–0.67) | 0.53 > T3 | 4157 | 3.59 (2.23–3.99) | 3.69 (3.27–4.16) | |
| 19–29 | 44 kg < T1 | 585 | Referent | Referent | 0.63 kg < T1 | 524 | Referent | Referent |
| 39 kg ≤ T2 ≤ 44 kg | 513 | 0.59 (0.39–0.88) | 0.59 (0.38–0.92) | 0.54 ≤ T2 ≤ 0.63 | 523 | 5.93 (2.76–12.71) | 6.03 (2.65–13.70) | |
| 39 kg > T3 | 472 | 0.57 (0.37–0.87) | 0.55 (0.34–0.89) | 0.54 > T3 | 523 | 14.13 (6.79–29.42) | 16.26 (7.37–35.89) | |
| 30–39 | 47 kg < T1 | 741 | Referent | Referent | 0.65 < T1 | 651 | Referent | Referent |
| 42 kg ≤ T2 ≤ 47 kg | 621 | 0.59 (0.46–0.76) | 0.53 (0.40–0.71) | 0.55 ≤ T2 ≤ 0.65 | 651 | 2.36 91.75–3.19) | 2.43 (1.72–3.42) | |
| 42 kg > T3 | 590 | 0.61 (0.48–0.79) | 0.60 (0.45–0.80) | 0.55 > T3 | 650 | 5.29 (3.97–7.04) | 6.15 (4.41–8.57) | |
| 40–49 | 46 kg < T1 | 766 | Referent | Referent | 0.65 < T1 | 741 | Referent | Referent |
| 41 kg ≤ T2 ≤ 46 kg | 781 | 0.81 (0.66–1.00) | 0.84 (0.66–1.07) | 0.55 ≤ T2 ≤ 0.65 | 740 | 2.33 (1.83–2.98) | 2.50 (1.89–3.31) | |
| 41 kg > T3 | 673 | 0.69 (0.55–0.86) | 0.74 (0.57–0.95) | 0.55 > T3 | 739 | 4.39 (3.46–5.57) | 5.34 (4.05–7.05) | |
| 50–59 | 43 kg < T1 | 848 | Referent | Referent | 0.64 < T1 | 793 | Referent | Referent |
| 39 kg ≤ T2 ≤ 43 kg | 781 | 0.99 (0.81–1.21) | 1.05 (0.84–1.31) | 0.55 ≤ T2 ≤ 0.64 | 791 | 1.68 (1.34–2.11) | 1.76 (1.38–2.26) | |
| 39 kg > T3 | 747 | 0.78 (0.64–0.97) | 0.78 (0.61–0.99) | 0.55 > T3 | 792 | 3.70 (2.98–4.61) | 4.09 (3.20–5.22) | |
| 60–69 | 39 kg < T1 | 883 | Referent | Referent | 0.61 < T1 | 753 | Referent | Referent |
| 35 kg ≤ T2 ≤ 39 kg | 724 | 0.93 (0.76–1.15) | 1.02 (0.80–1.29) | 0.52 ≤ T2 ≤ 0.61 | 749 | 2.02 (1.60–2.55) | 2.16 (1.67–2.80) | |
| 35 kg > T3 | 646 | 0.88 (0.71–1.09) | 0.90 (0.70–1.16) | 0.52 > T3 | 751 | 3.15 (2.51–3.96) | 3.55 (2.74–4.59) | |
| 70–80 | 34 kg < T1 | 711 | Referent | Referent | 0.55 < T1 | 701 | Referent | Referent |
| 29 kg ≤ T2 ≤ 34 kg | 742 | 0.75 (0.60–0.94) | 0.75 (0.58–0.97) | 0.46 ≤ T2 ≤ 0.55 | 698 | 1.55 (1.22–1.99) | 1.60 (1.22–2.11) | |
| 29 kg > T3 | 646 | 0.58 (0.45–0.73) | 0.63 (0.47–0.85) | 0.46 > T3 | 700 | 2.10 (1.65–2.67) | 2.58 (1.95–3.41) | |
| Age (Years) | Absolute HGS | n | Unadjusted | Adjusted | Relative HGS | n | Unadjusted | Adjusted |
|---|---|---|---|---|---|---|---|---|
| Odds Ratio (95% CI) | Odds Ratio (95% CI) | |||||||
| Total | 26 kg < T1 | 6320 | Referent | Referent | 0.46 < T1 | 5224 | Referent | Referent |
| 22 kg ≤ T2 ≤ 26 kg | 4644 | 1.08 (0.99–1.18) | 0.78 (0.70–0.85) | 0.38 ≤ T2 ≤ 0.46 | 5220 | 2.50 (2.25–2.78) | 2.04 (1.83–2.28) | |
| 22 kg > T3 | 4697 | 1.70 (1.56–1.86) | 0.72 (0.65–0.79) | 0.38 > T3 | 5217 | 5.37 (4.85–5.94) | 3.28 (2.94–3.65) | |
| 19–29 | 26 kg < T1 | 677 | Referent | Referent | 0.48 < T1 | 617 | Referent | Referent |
| 23 kg ≤ T2 ≤ 26 kg | 603 | 0.34 (0.19–0.62) | 0.36 (0.20–0.65) | 0.41 ≤ T2 ≤ 0.48 | 616 | 2.72 (1.06–6.99) | 2.70 (1.05–6.96) | |
| 23 kg > T3 | 569 | 0.41 (0.23–0.73) | 0.42 (0.24–0.74) | 0.41 > T3 | 616 | 10.38 (4.44–24.27) | 10.08 (4.31–23.57) | |
| 30–39 | 27 kg < T1 | 1022 | Referent | Referent | 0.49 < T1 | 834 | Referent | Referent |
| 24 kg ≤ T2 ≤ 27 kg | 807 | 0.62 (0.46–0.85) | 0.63 (0.47–0.86) | 0.42 ≤ T2 ≤ 0.49 | 832 | 2.49 (1.57–3.95) | 2.55 (1.61–4.05) | |
| 24 kg > T3 | 670 | 0.56 (0.40–0.78) | 0.59 (0.42–0.83) | 0.42 > T3 | 833 | 7.11 (4.67–10.82) | 7.48 (4.90–11.42) | |
| 40–49 | 27 kg < T1 | 1116 | Referent | Referent | 0.49 kg < T1 | 967 | Referent | Referent |
| 24 kg ≤ T2 ≤ 27 kg | 959 | 0.52 (0.41–0.66) | 0.52 (0.41–0.66) | 0.41 ≤ T2 ≤ 0.49 | 967 | 1.91 (1.43–2.55) | 1.90 91.42–2.54) | |
| 24 kg > T3 | 824 | 0.66 (0.52–0.84) | 0.65 (0.51–0.83) | 0.41 > T3 | 965 | 4.05 (3.09–5.30) | 3.97 (3.03–5.20) | |
| 50–59 | 26 kg < T1 | 1130 | Referent | Referent | 0.47 < T1 | 1016 | Referent | Referent |
| 23 kg ≤ T2 ≤ 26 kg | 1059 | 0.86 (0.71–1.03) | 0.85 (0.70–1.02) | 0.39 ≤ T2 ≤ 0.47 | 1022 | 2.24 (1.80–2.79) | 2.22 (1.78–2.77) | |
| 23 kg > T3 | 868 | 0.91 (0.75–1.11) | 0.89 (0.73–1.09) | 0.39 > T3 | 1019 | 3.76 (3.03–4.66) | 3.72 (3.00–4.61) | |
| 60–69 | 24 kg < T1 | 1017 | Referent | Referent | 0.44 < T1 | 889 | Referent | Referent |
| 21 kg ≤ T2 ≤ 24 kg | 918 | 0.92 (0.76–1.10) | 0.89 (0.74–1.07) | 0.36 ≤ T2 ≤ 0.44 | 887 | 1.60 (1.32–1.95) | 1.57 (1.29–1.91) | |
| 21 kg > T3 | 728 | 1.03 (0.85–1.25) | 0.97 (0.80–1.18) | 0.36 > T3 | 887 | 2.74 (2.25–3.33) | 2.65 (2.18–3.23) | |
| 70–80 | 20 kg < T1 | 1043 | Referent | Referent | 0.39 < T1 | 899 | Referent | Referent |
| 17 kg ≤ T2 ≤ 20 kg | 862 | 0.88 (0.73–1.05) | 0.90 (0.75–1.08) | 0.31 ≤ T2 ≤ 0.39 | 898 | 1.48 (1.22–1.78) | 1.52 (1.26–1.84) | |
| 17 kg > T3 | 789 | 0.87 (0.72–1.04) | 0.90 (0.74–1.10) | 0.31 > T3 | 897 | 1.90 (1.58–2.29) | 2.02 (1.66–2.45) | |
Publisher’s Note: MDPI stays neutral with regard to jurisdictional claims in published maps and institutional affiliations. |
© 2022 by the authors. Licensee MDPI, Basel, Switzerland. This article is an open access article distributed under the terms and conditions of the Creative Commons Attribution (CC BY) license (https://creativecommons.org/licenses/by/4.0/).
Share and Cite
Hong, S.; Oh, M.; Kim, Y.; Jeon, J.Y. Association of Absolute and Relative Handgrip Strength with Prevalent Metabolic Syndrome in Adults: Korea National Health and Nutrition Examination Survey 2014–2018. Int. J. Environ. Res. Public Health 2022, 19, 12585. https://doi.org/10.3390/ijerph191912585
Hong S, Oh M, Kim Y, Jeon JY. Association of Absolute and Relative Handgrip Strength with Prevalent Metabolic Syndrome in Adults: Korea National Health and Nutrition Examination Survey 2014–2018. International Journal of Environmental Research and Public Health. 2022; 19(19):12585. https://doi.org/10.3390/ijerph191912585
Chicago/Turabian StyleHong, Sunghyun, Minsuk Oh, Youngwon Kim, and Justin Y. Jeon. 2022. "Association of Absolute and Relative Handgrip Strength with Prevalent Metabolic Syndrome in Adults: Korea National Health and Nutrition Examination Survey 2014–2018" International Journal of Environmental Research and Public Health 19, no. 19: 12585. https://doi.org/10.3390/ijerph191912585