

Development of an mHealth Platform for Adolescent Obesity Prevention: User-Centered Design Approach

 ,
,  , ,
, , 
Abstract
:1. Introduction
1.1. Context
1.2. Related Work
1.3. Goal
2. Materials and Methods
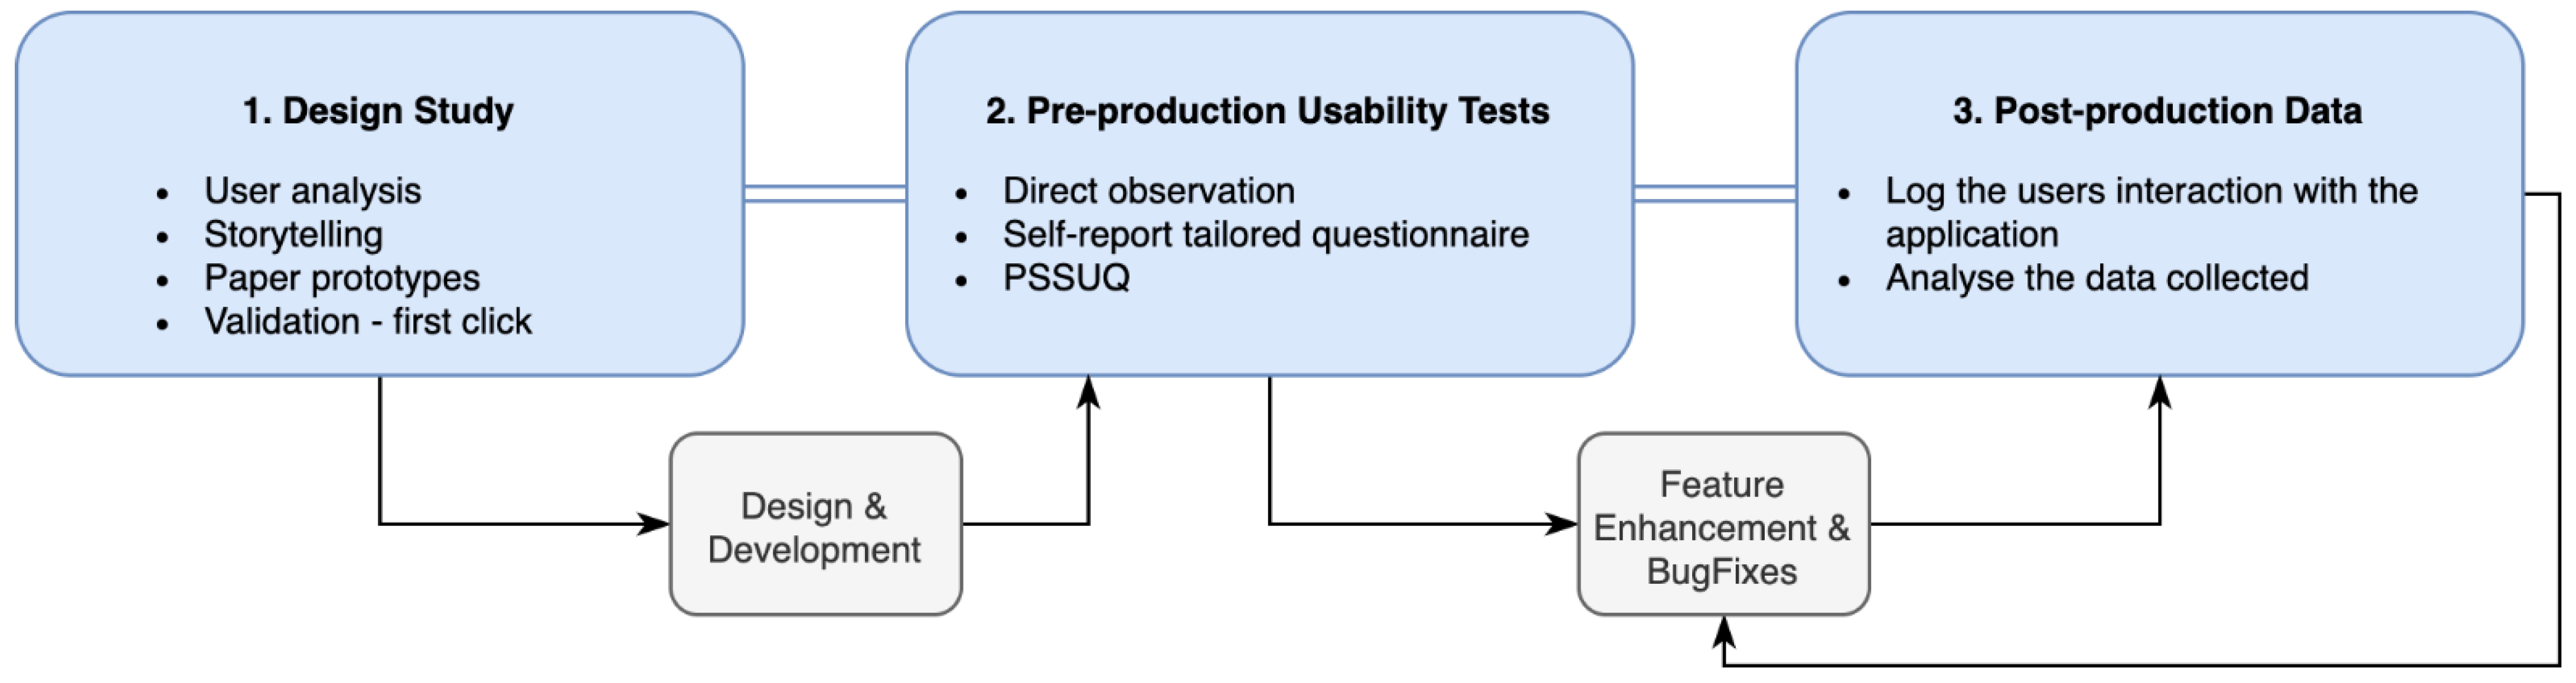
2.1. Three-Phase UCD Model
2.1.1. Phase 1—Design Study
2.1.2. Phase 2—Pre-Production Usability Tests
2.1.3. Phase 3—Post-Production Data
3. Results
3.1. Phase 1—Design Study
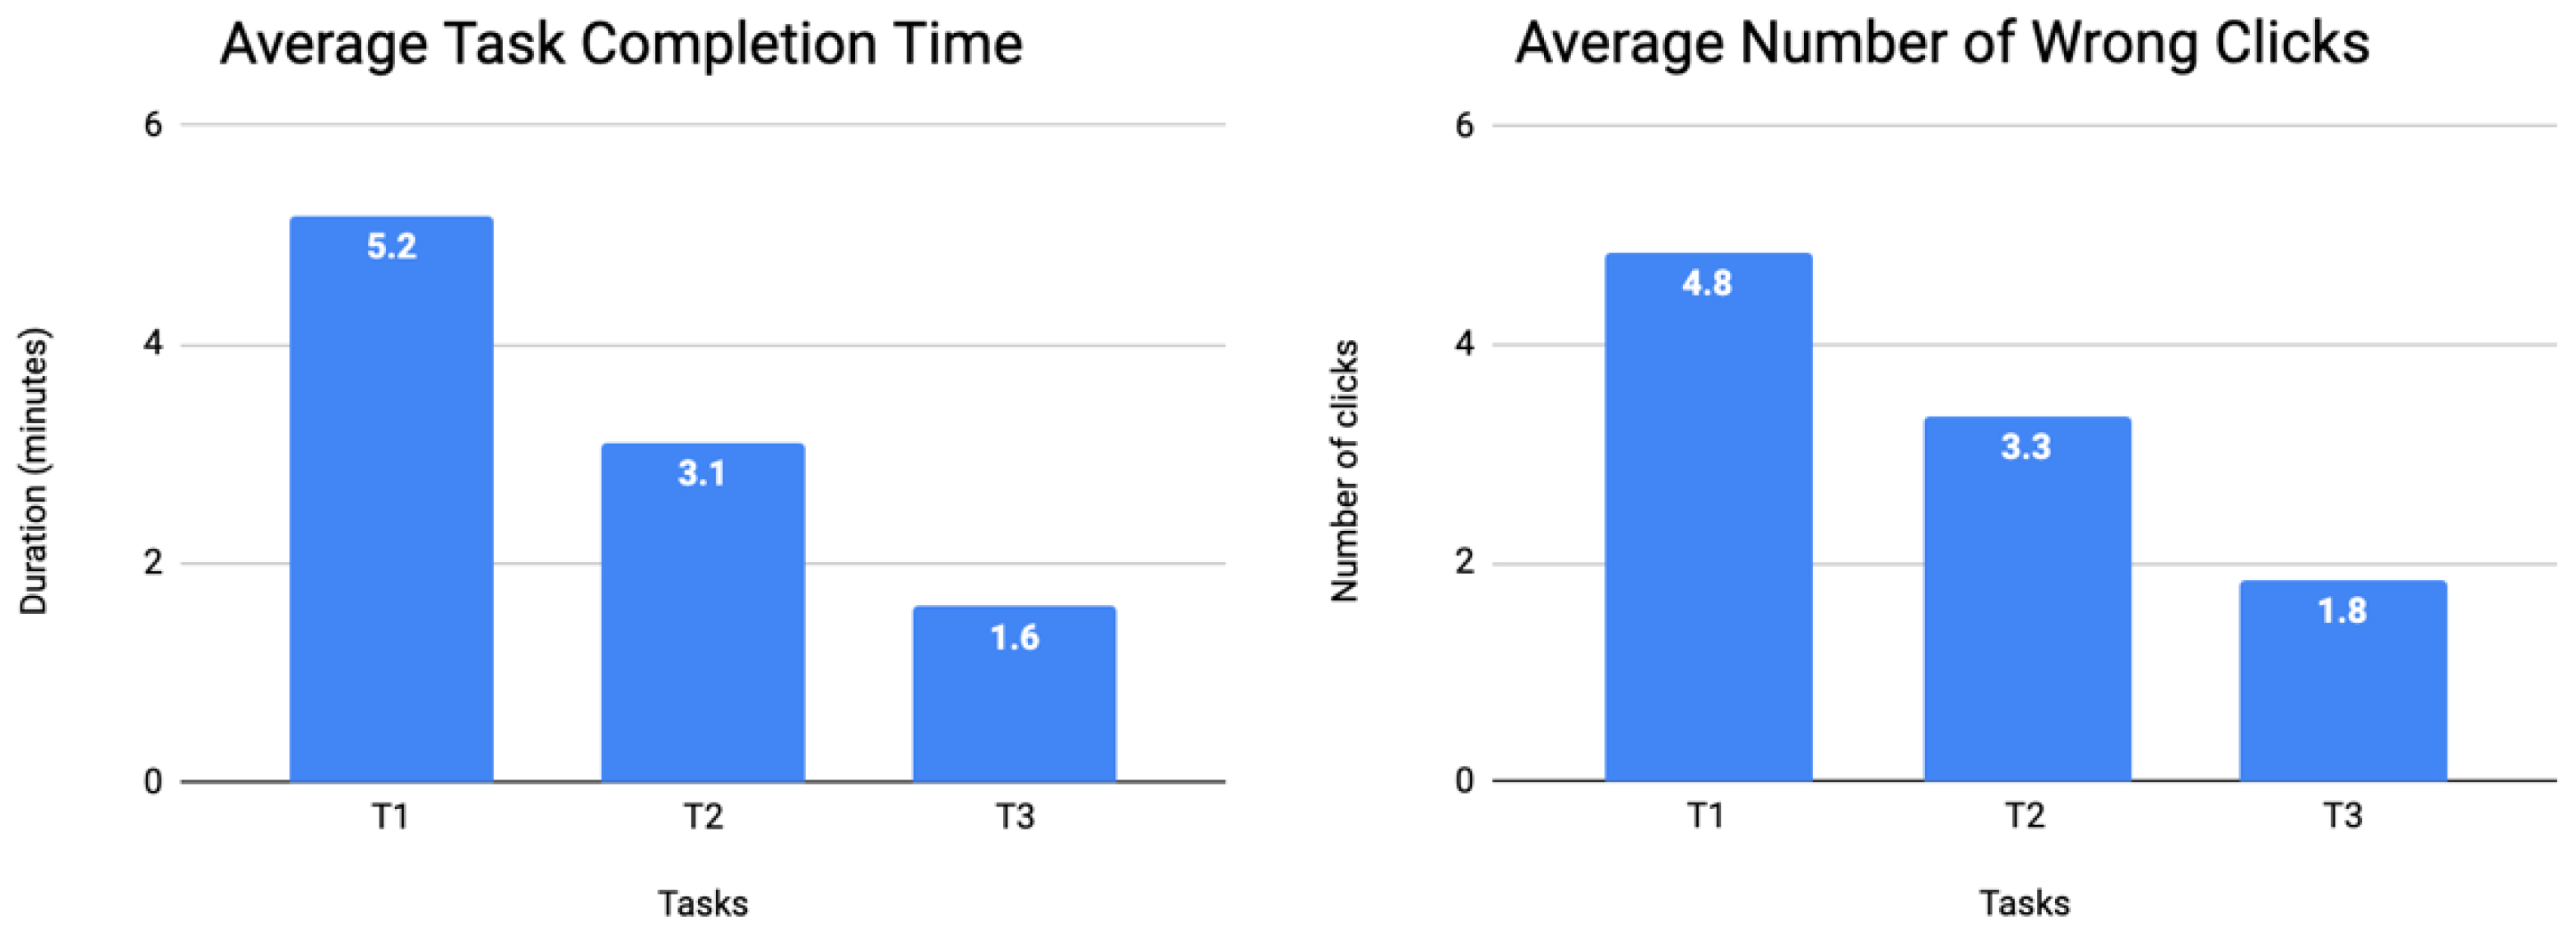
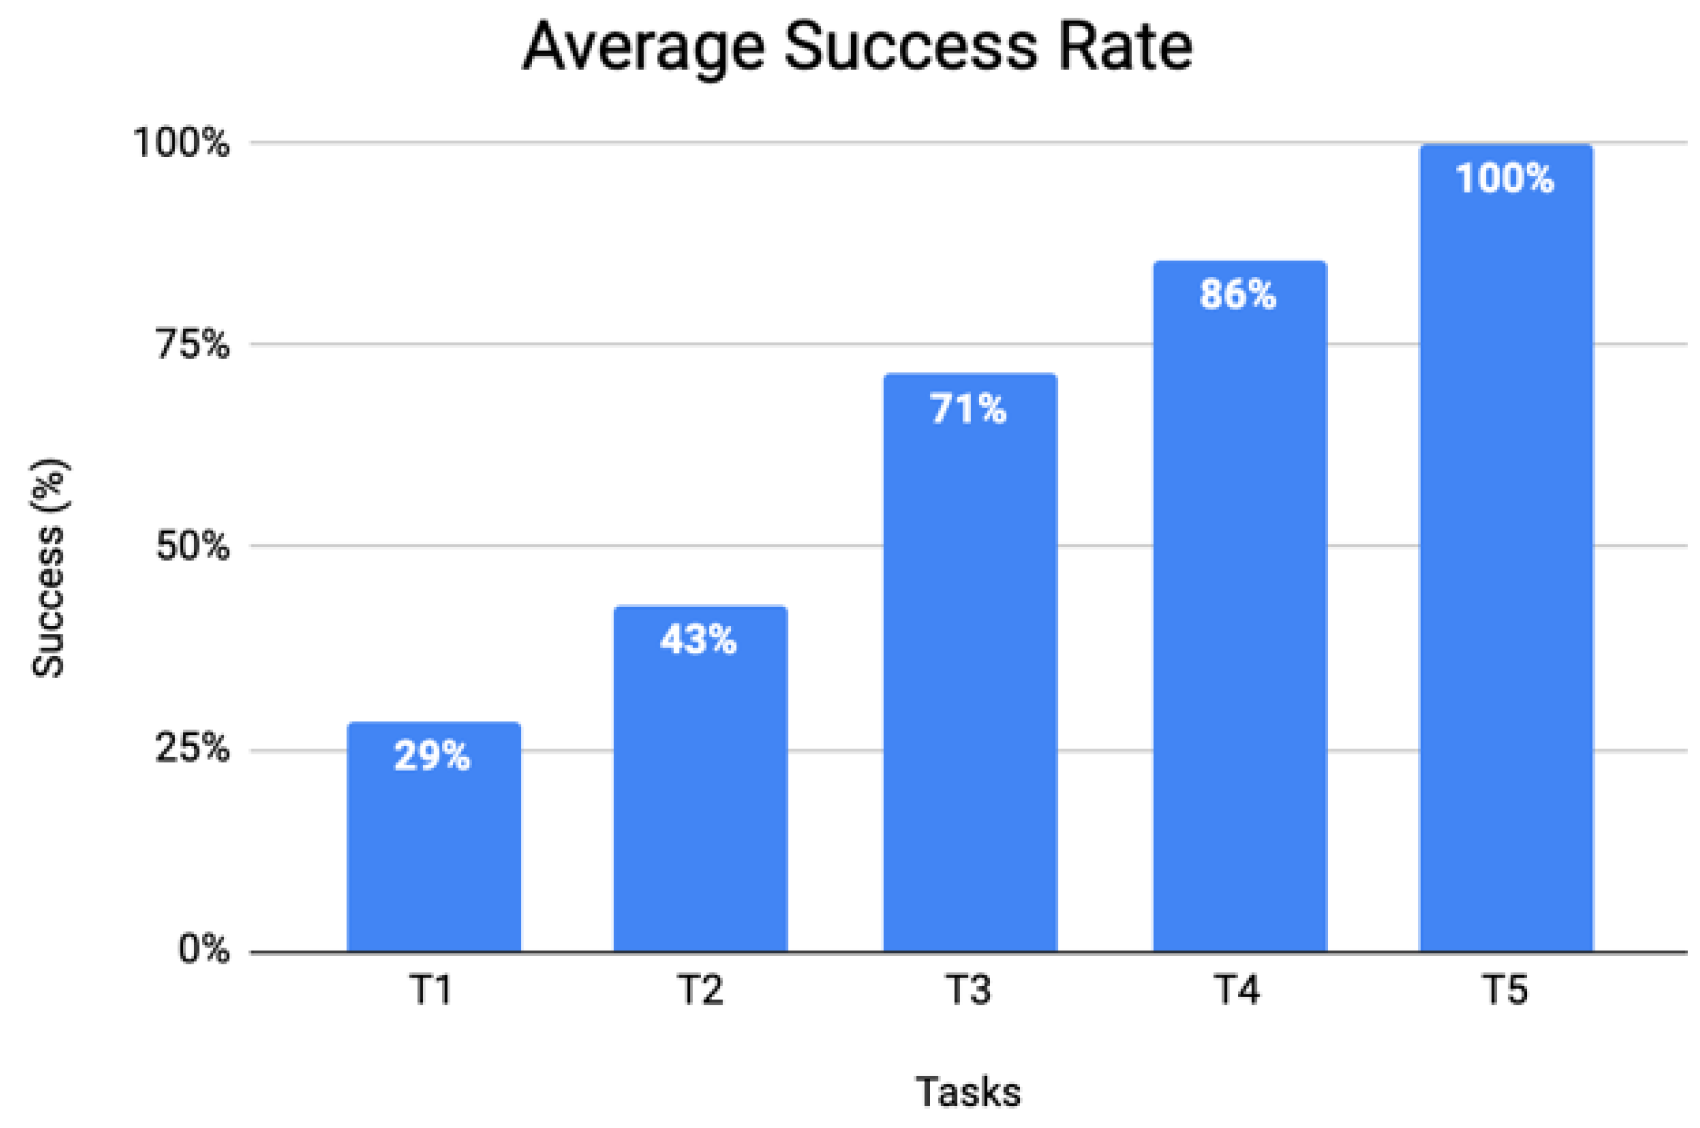
3.2. Phase 2—Pre-Production Usability Tests
- Avatar (A)—six (out of nine) occurrences
- Information (I)—six (out of nine) occurrences
- Navigation Flow (NF)—five (out of nine) occurrences
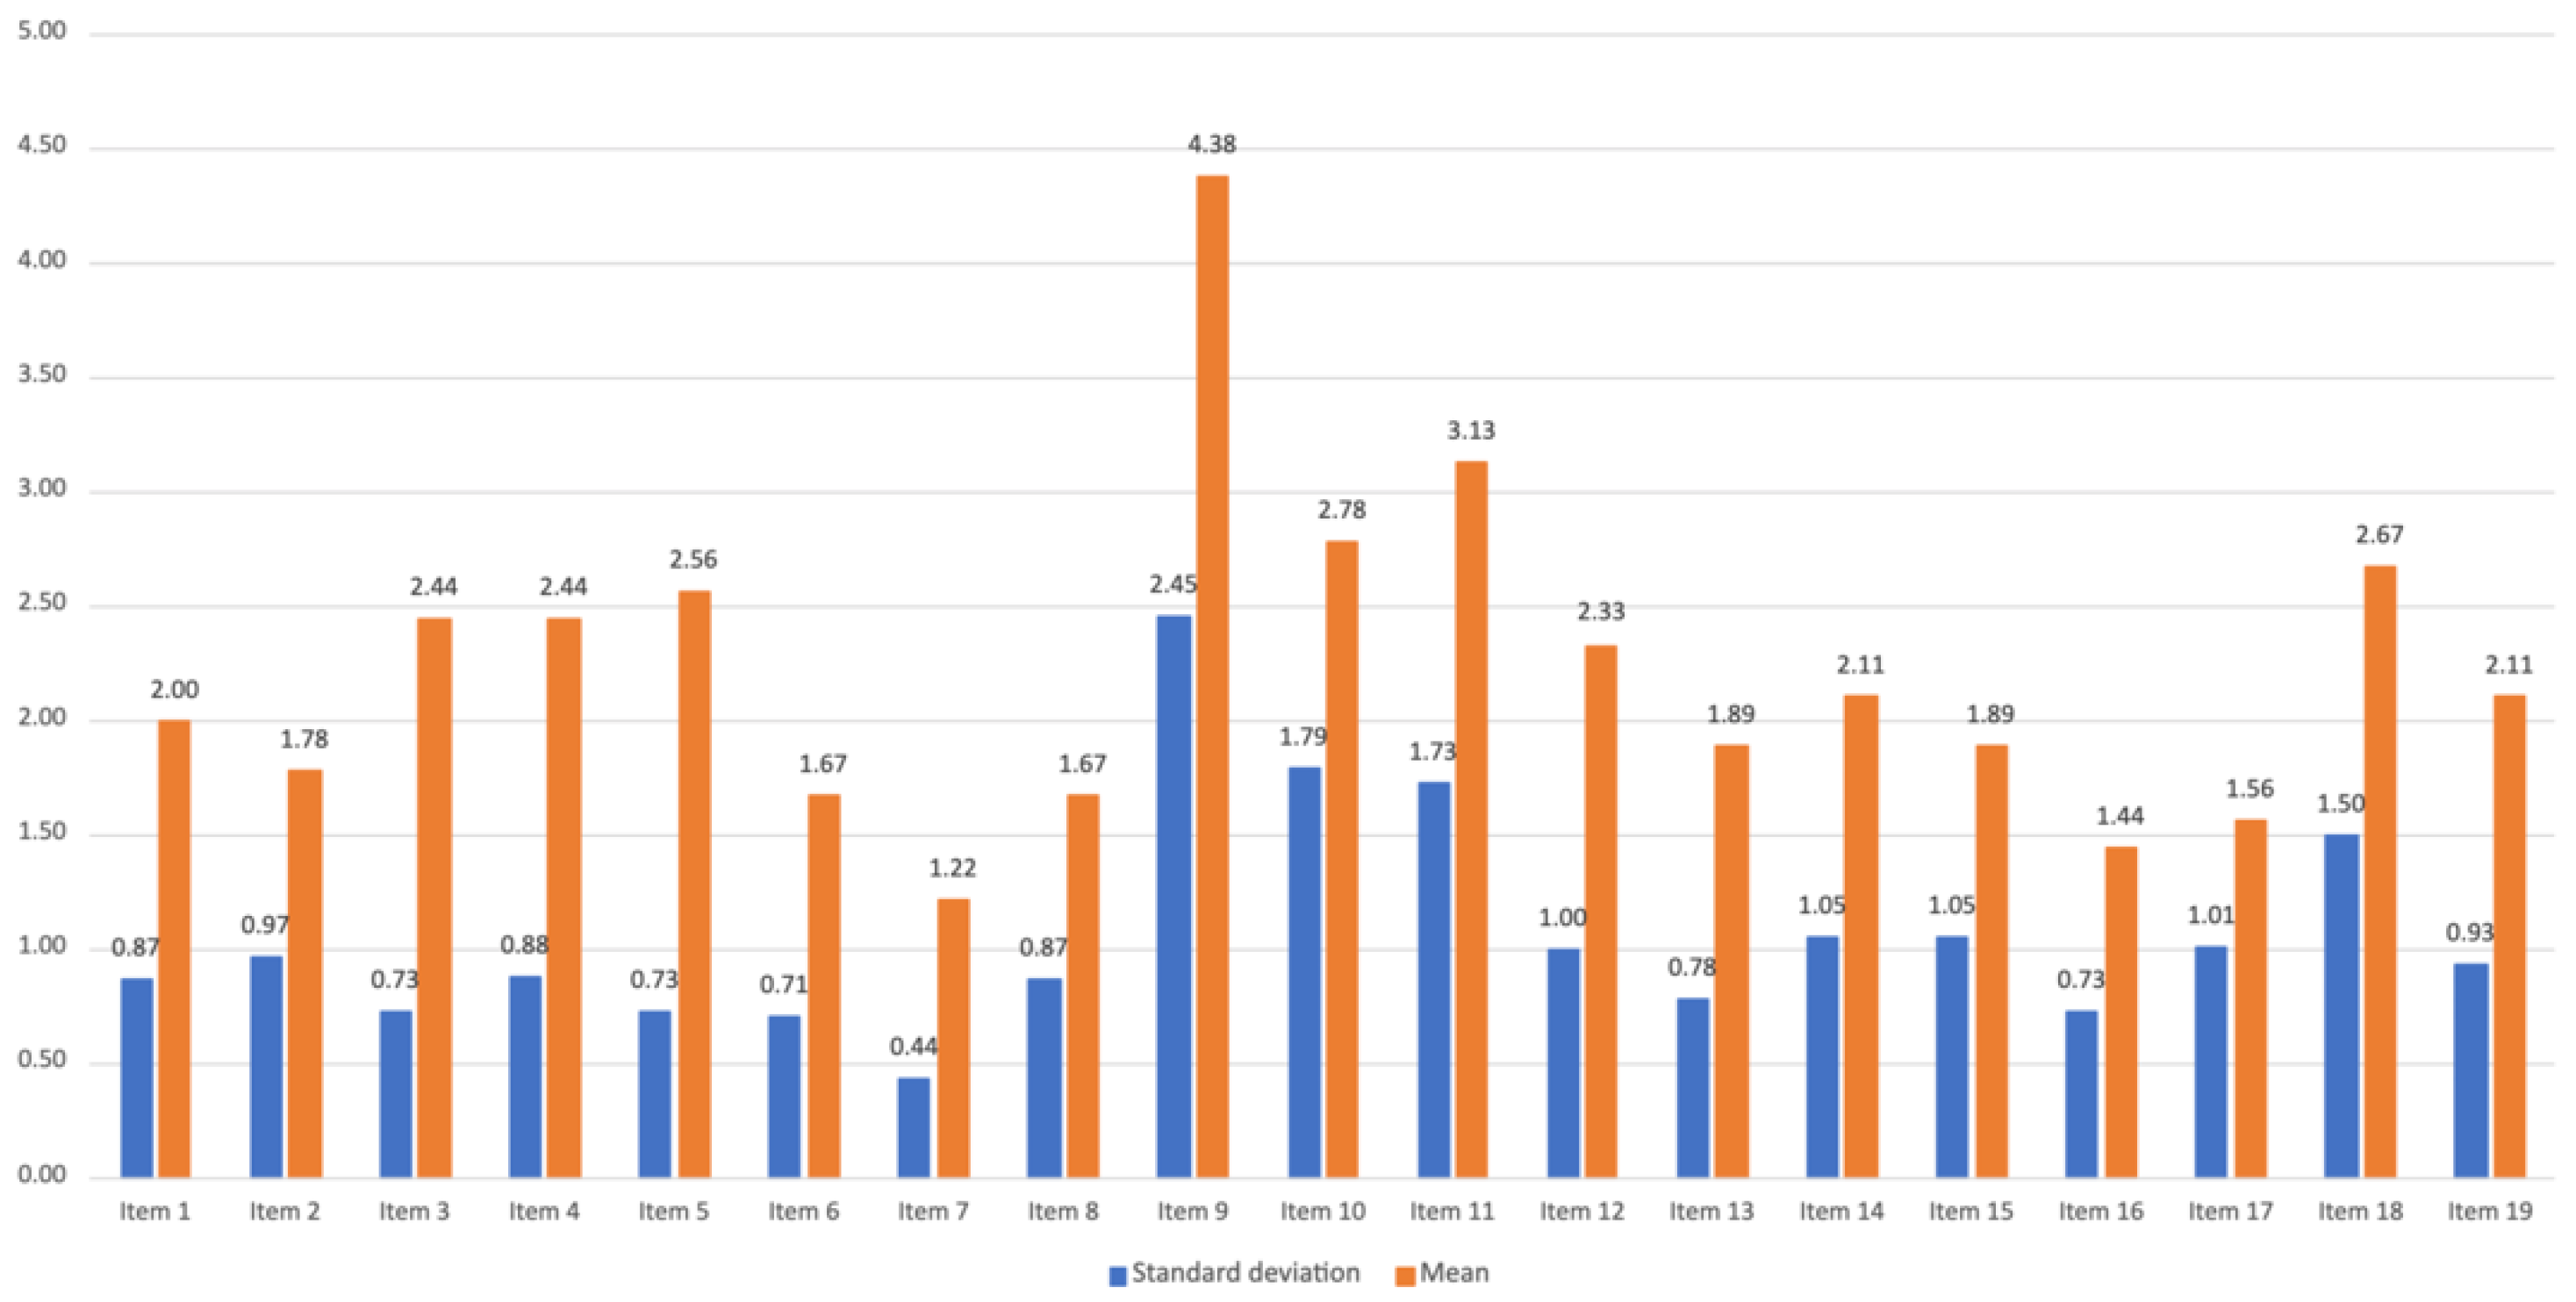
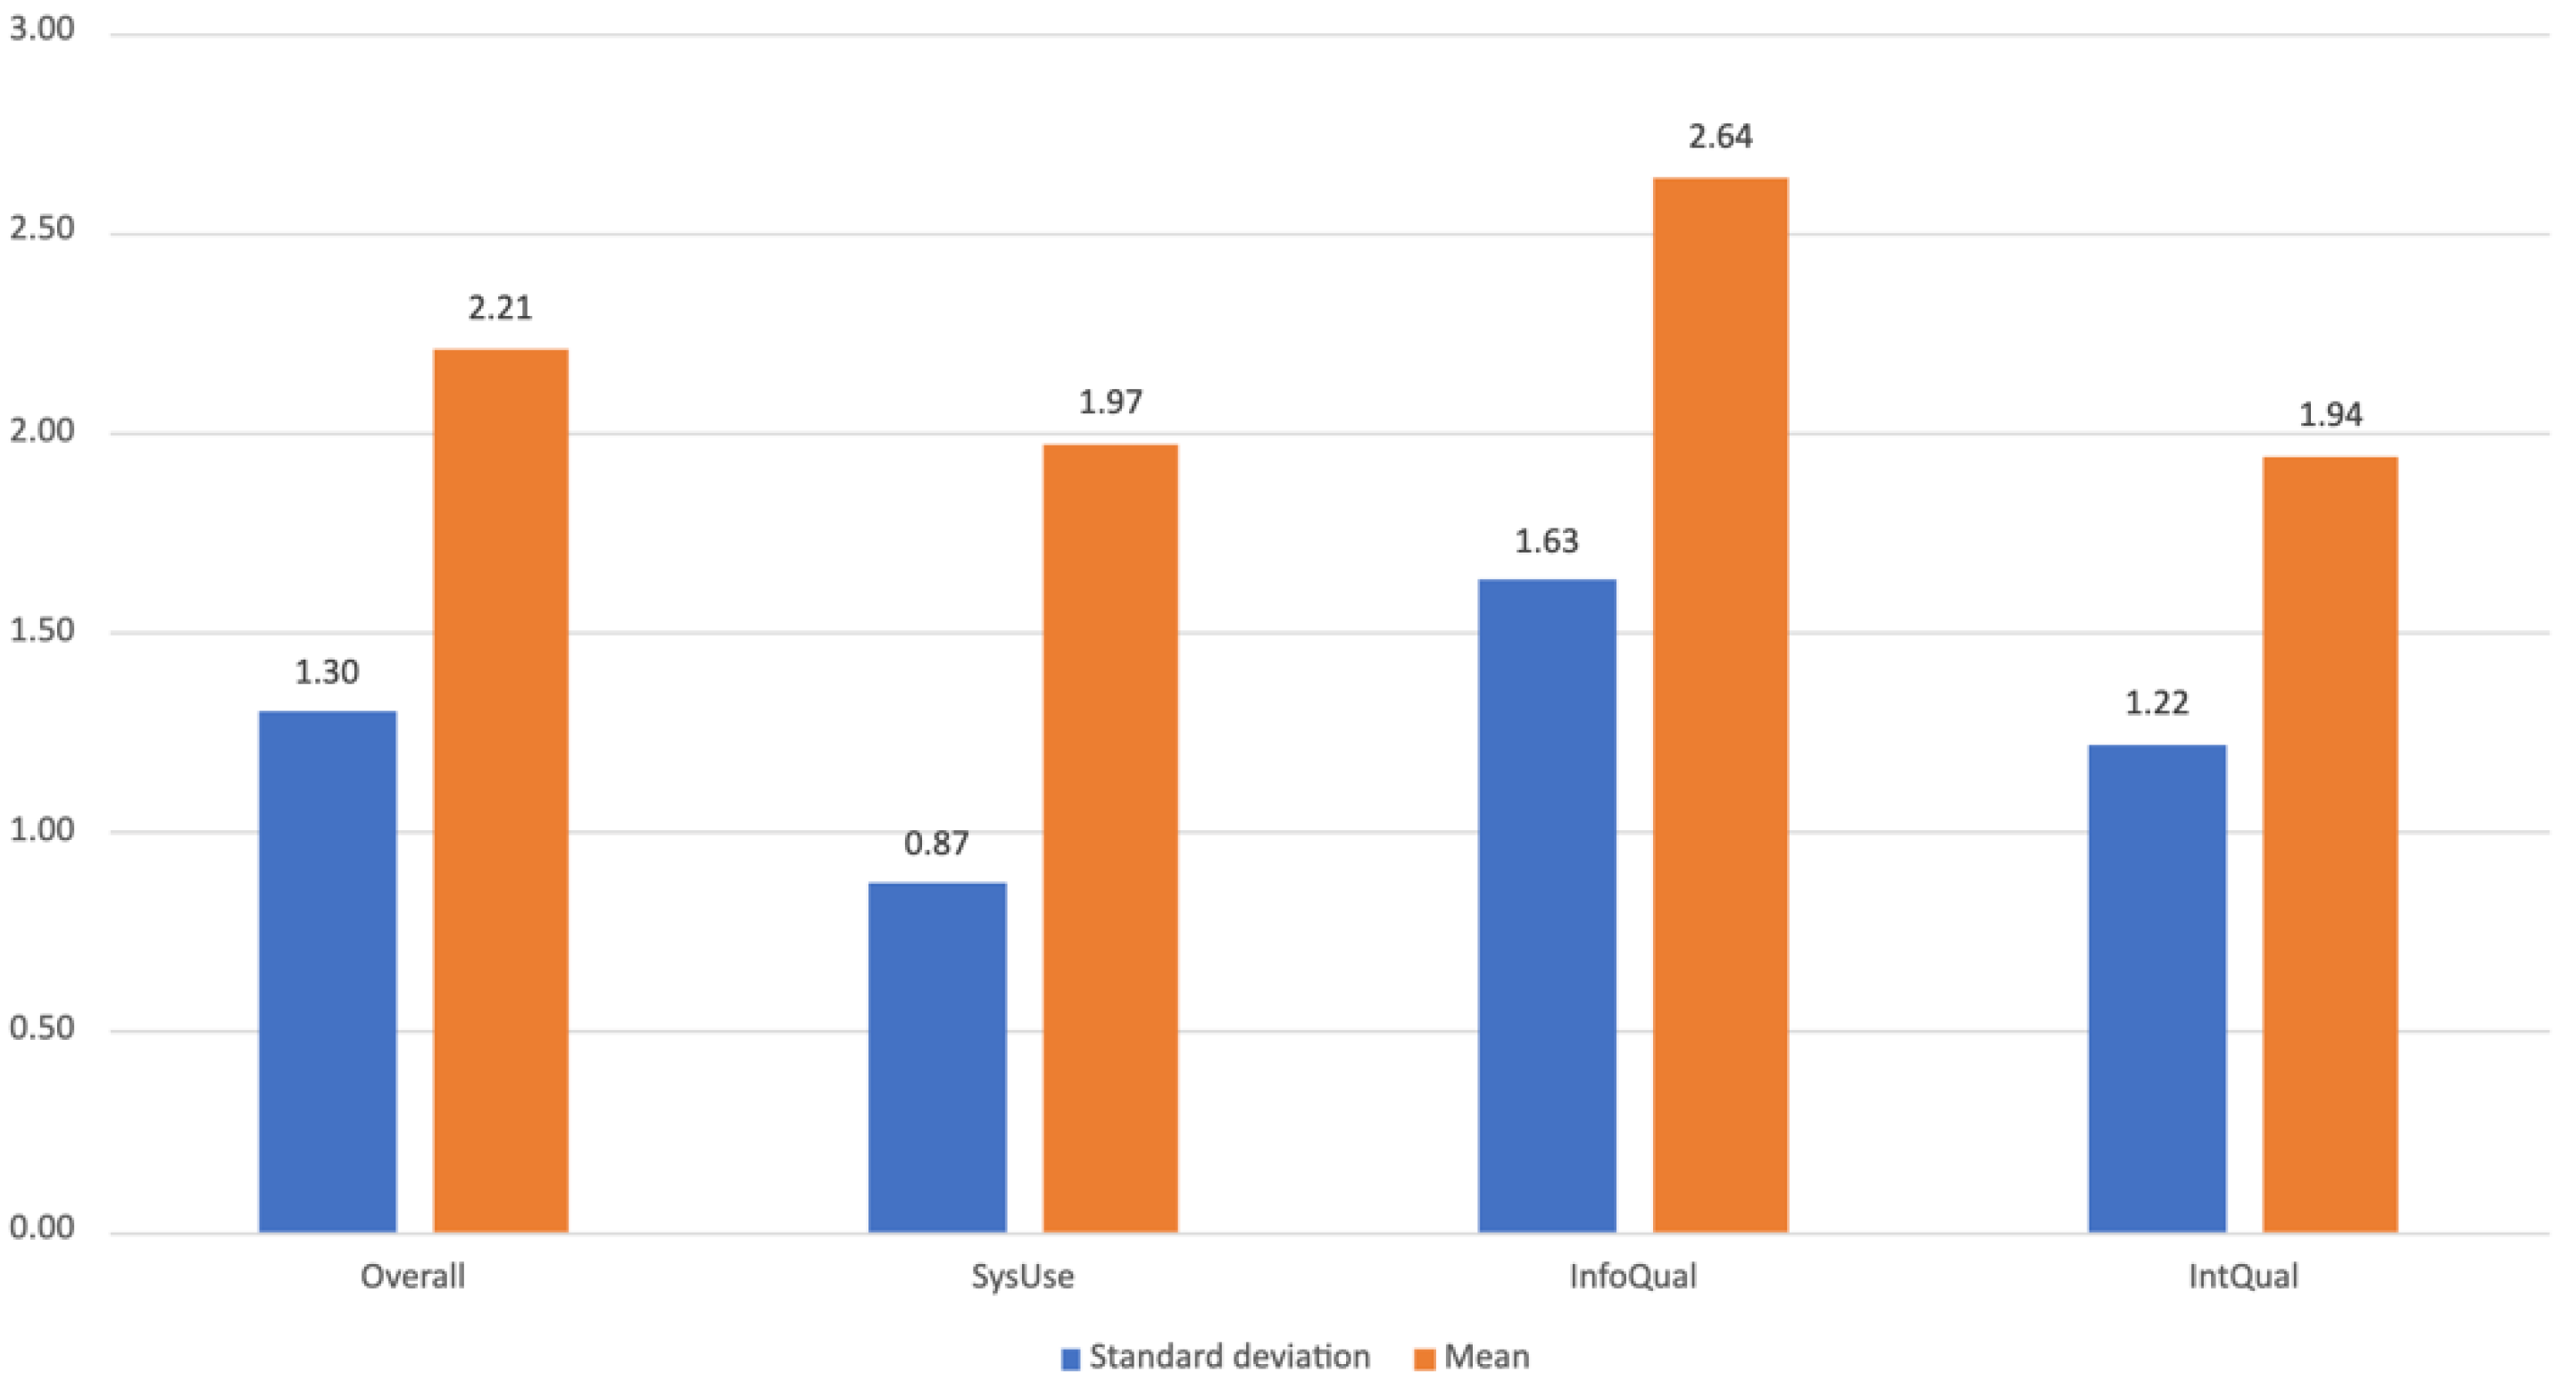
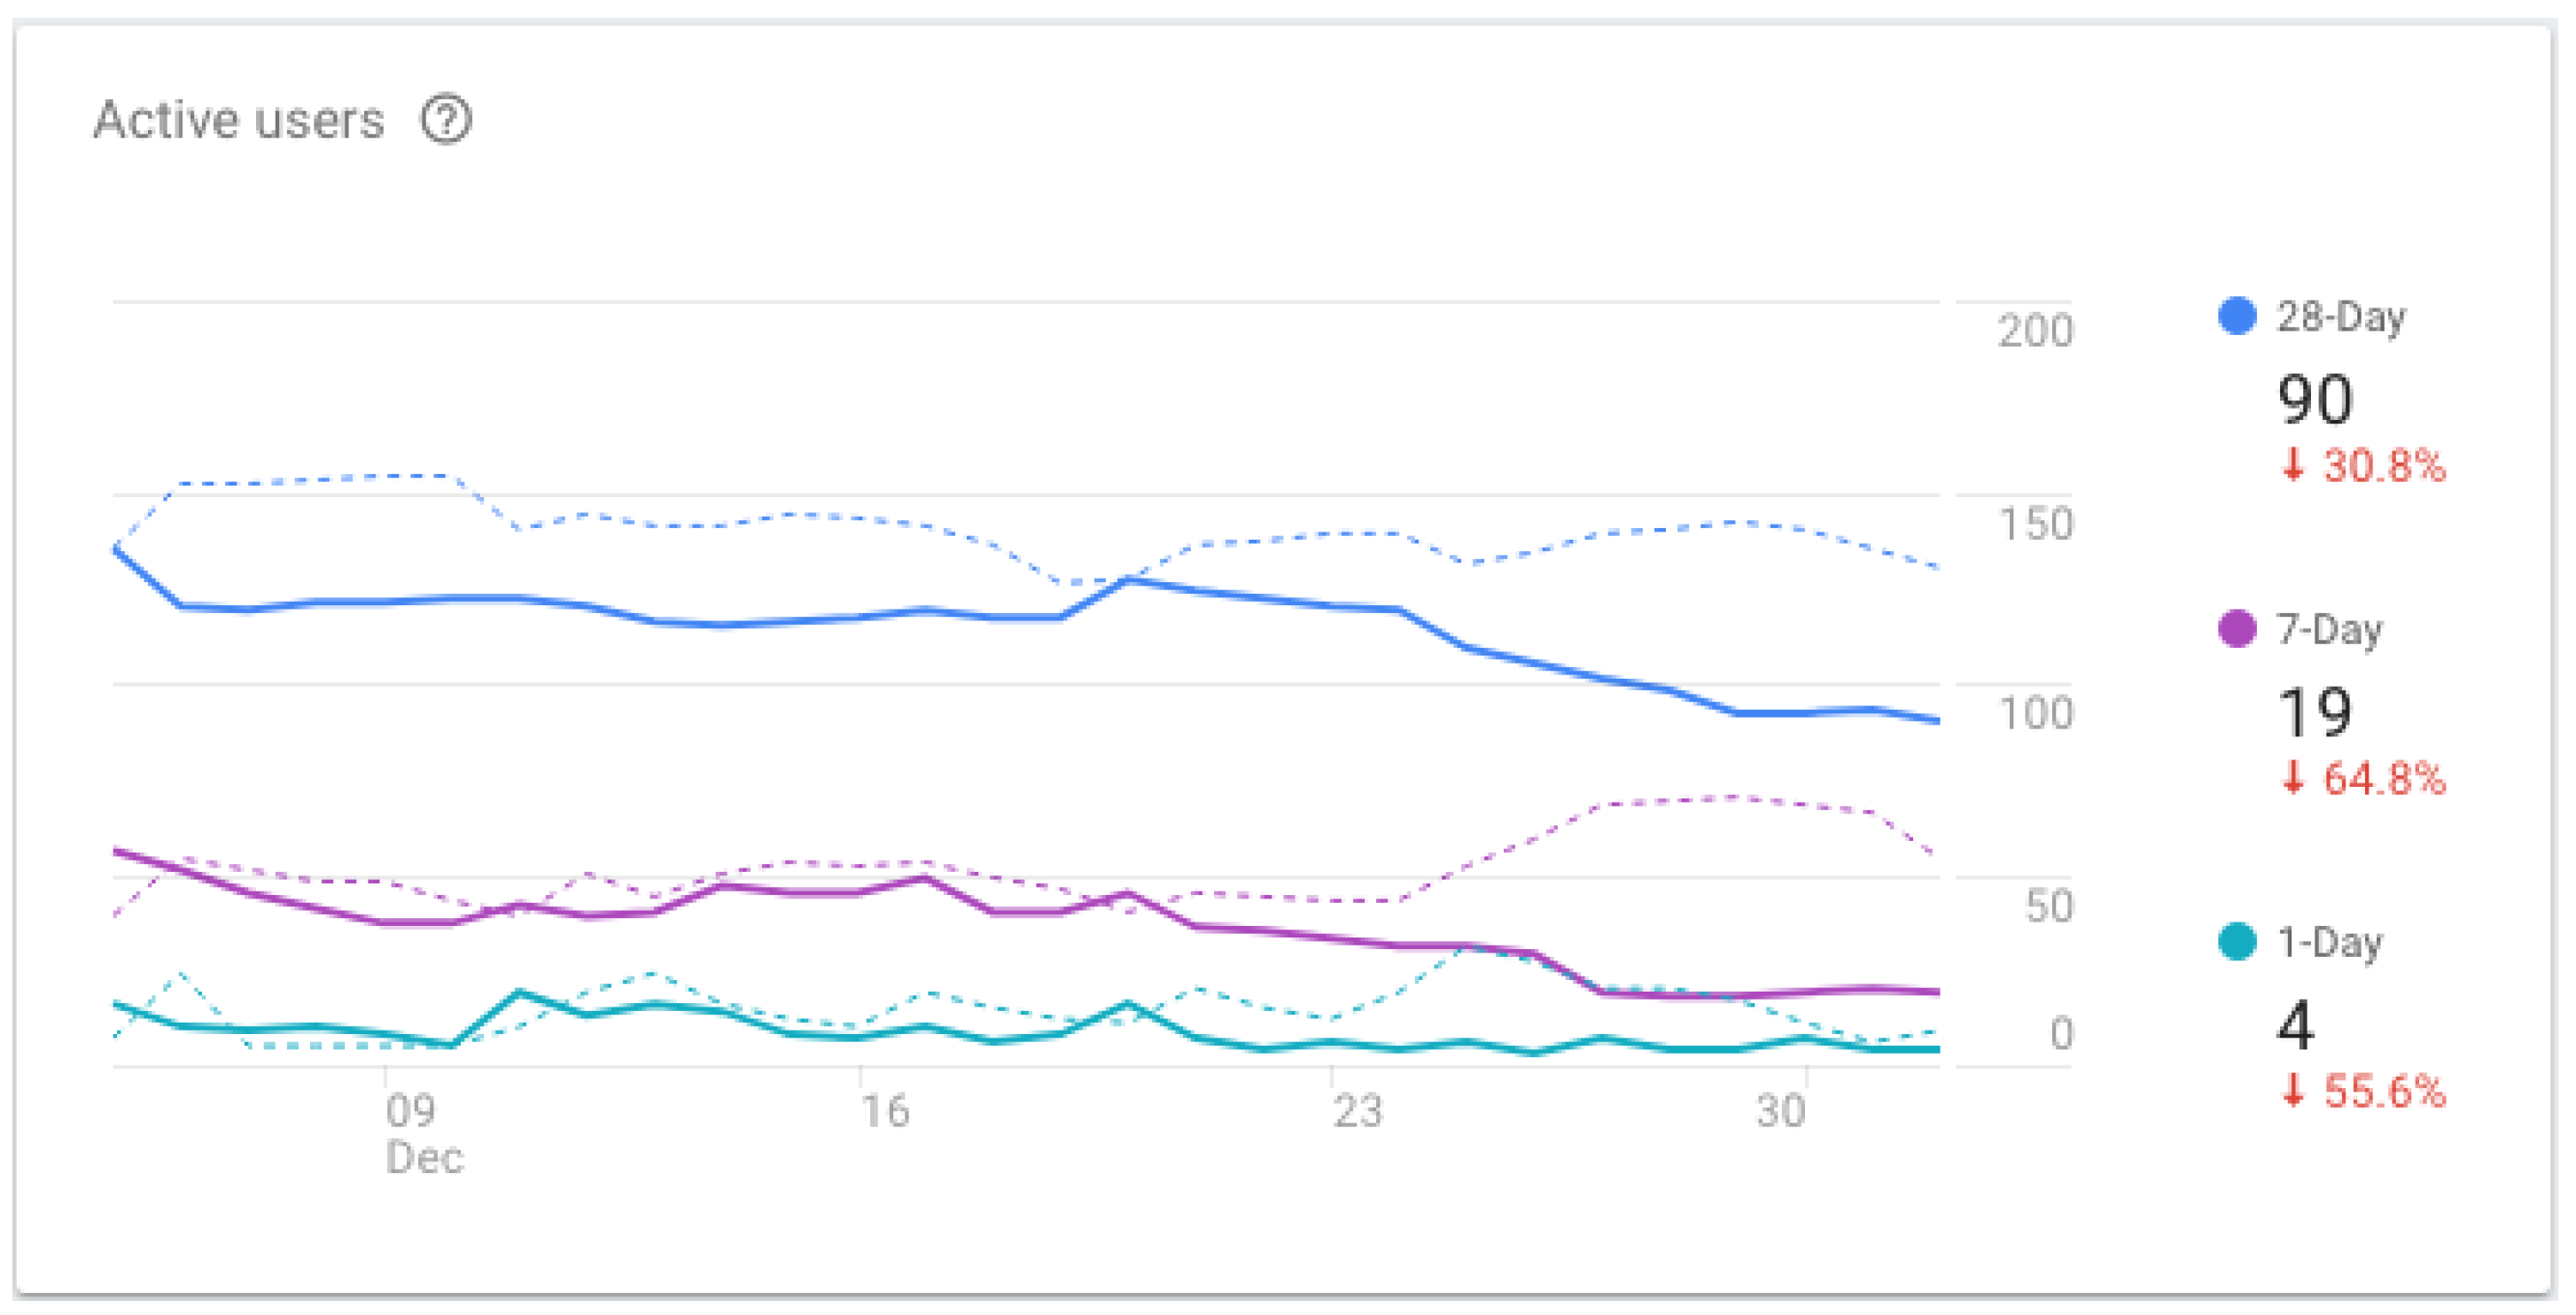
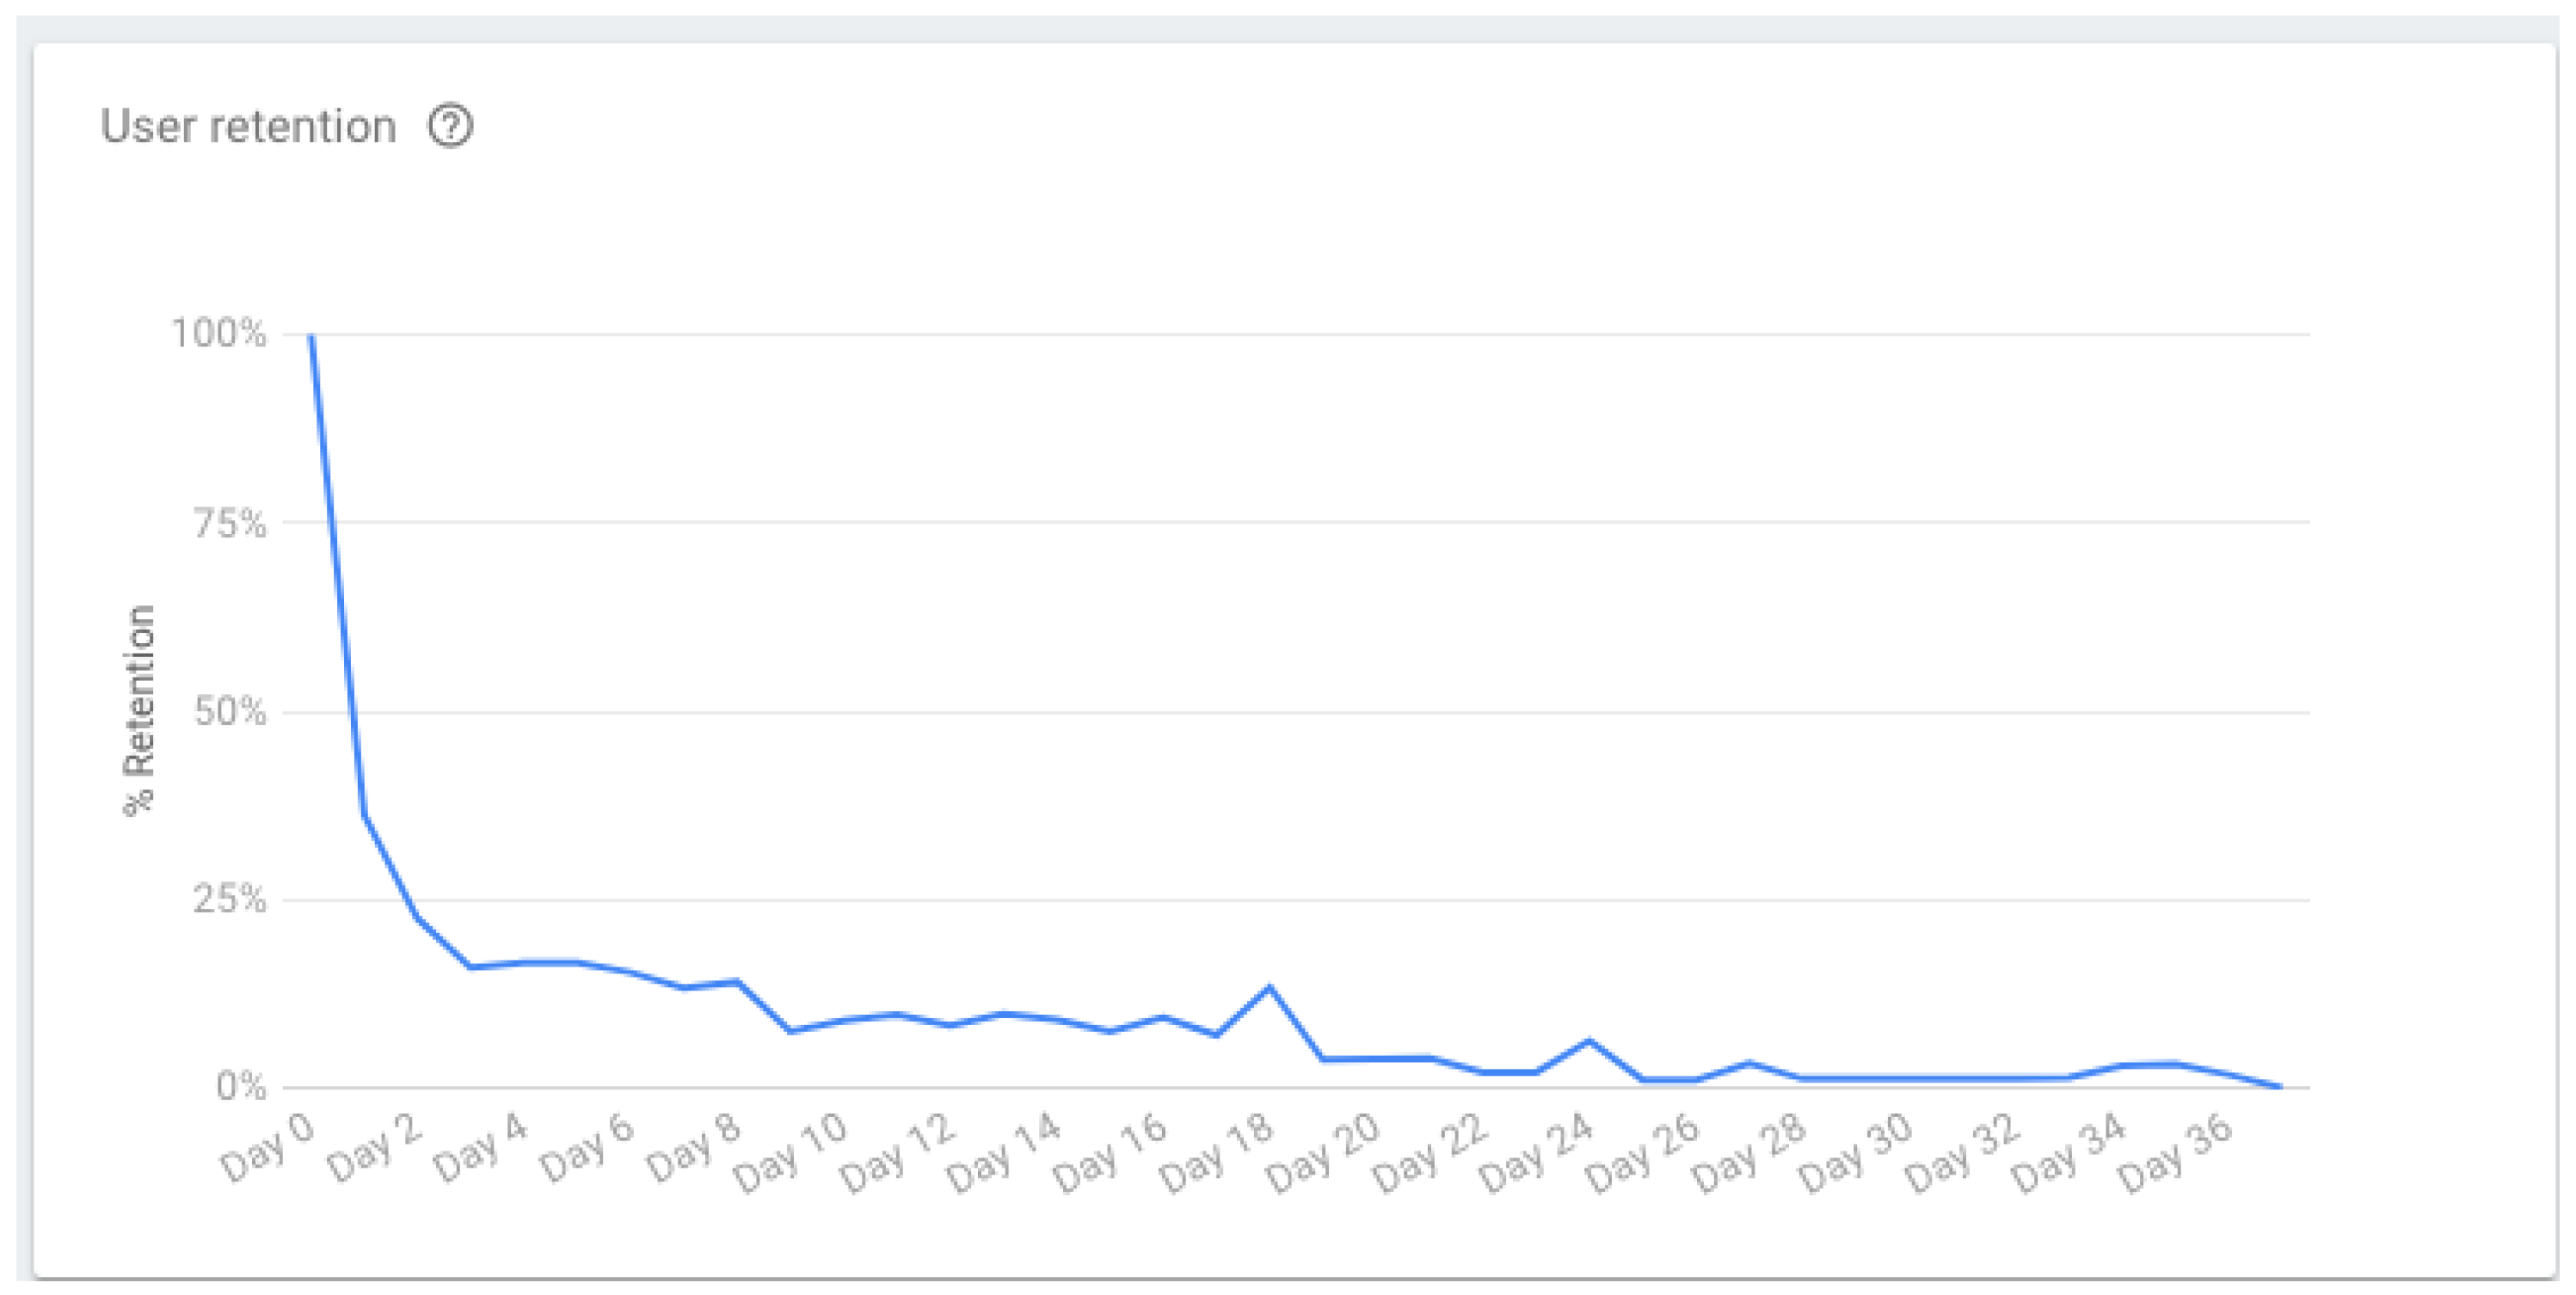
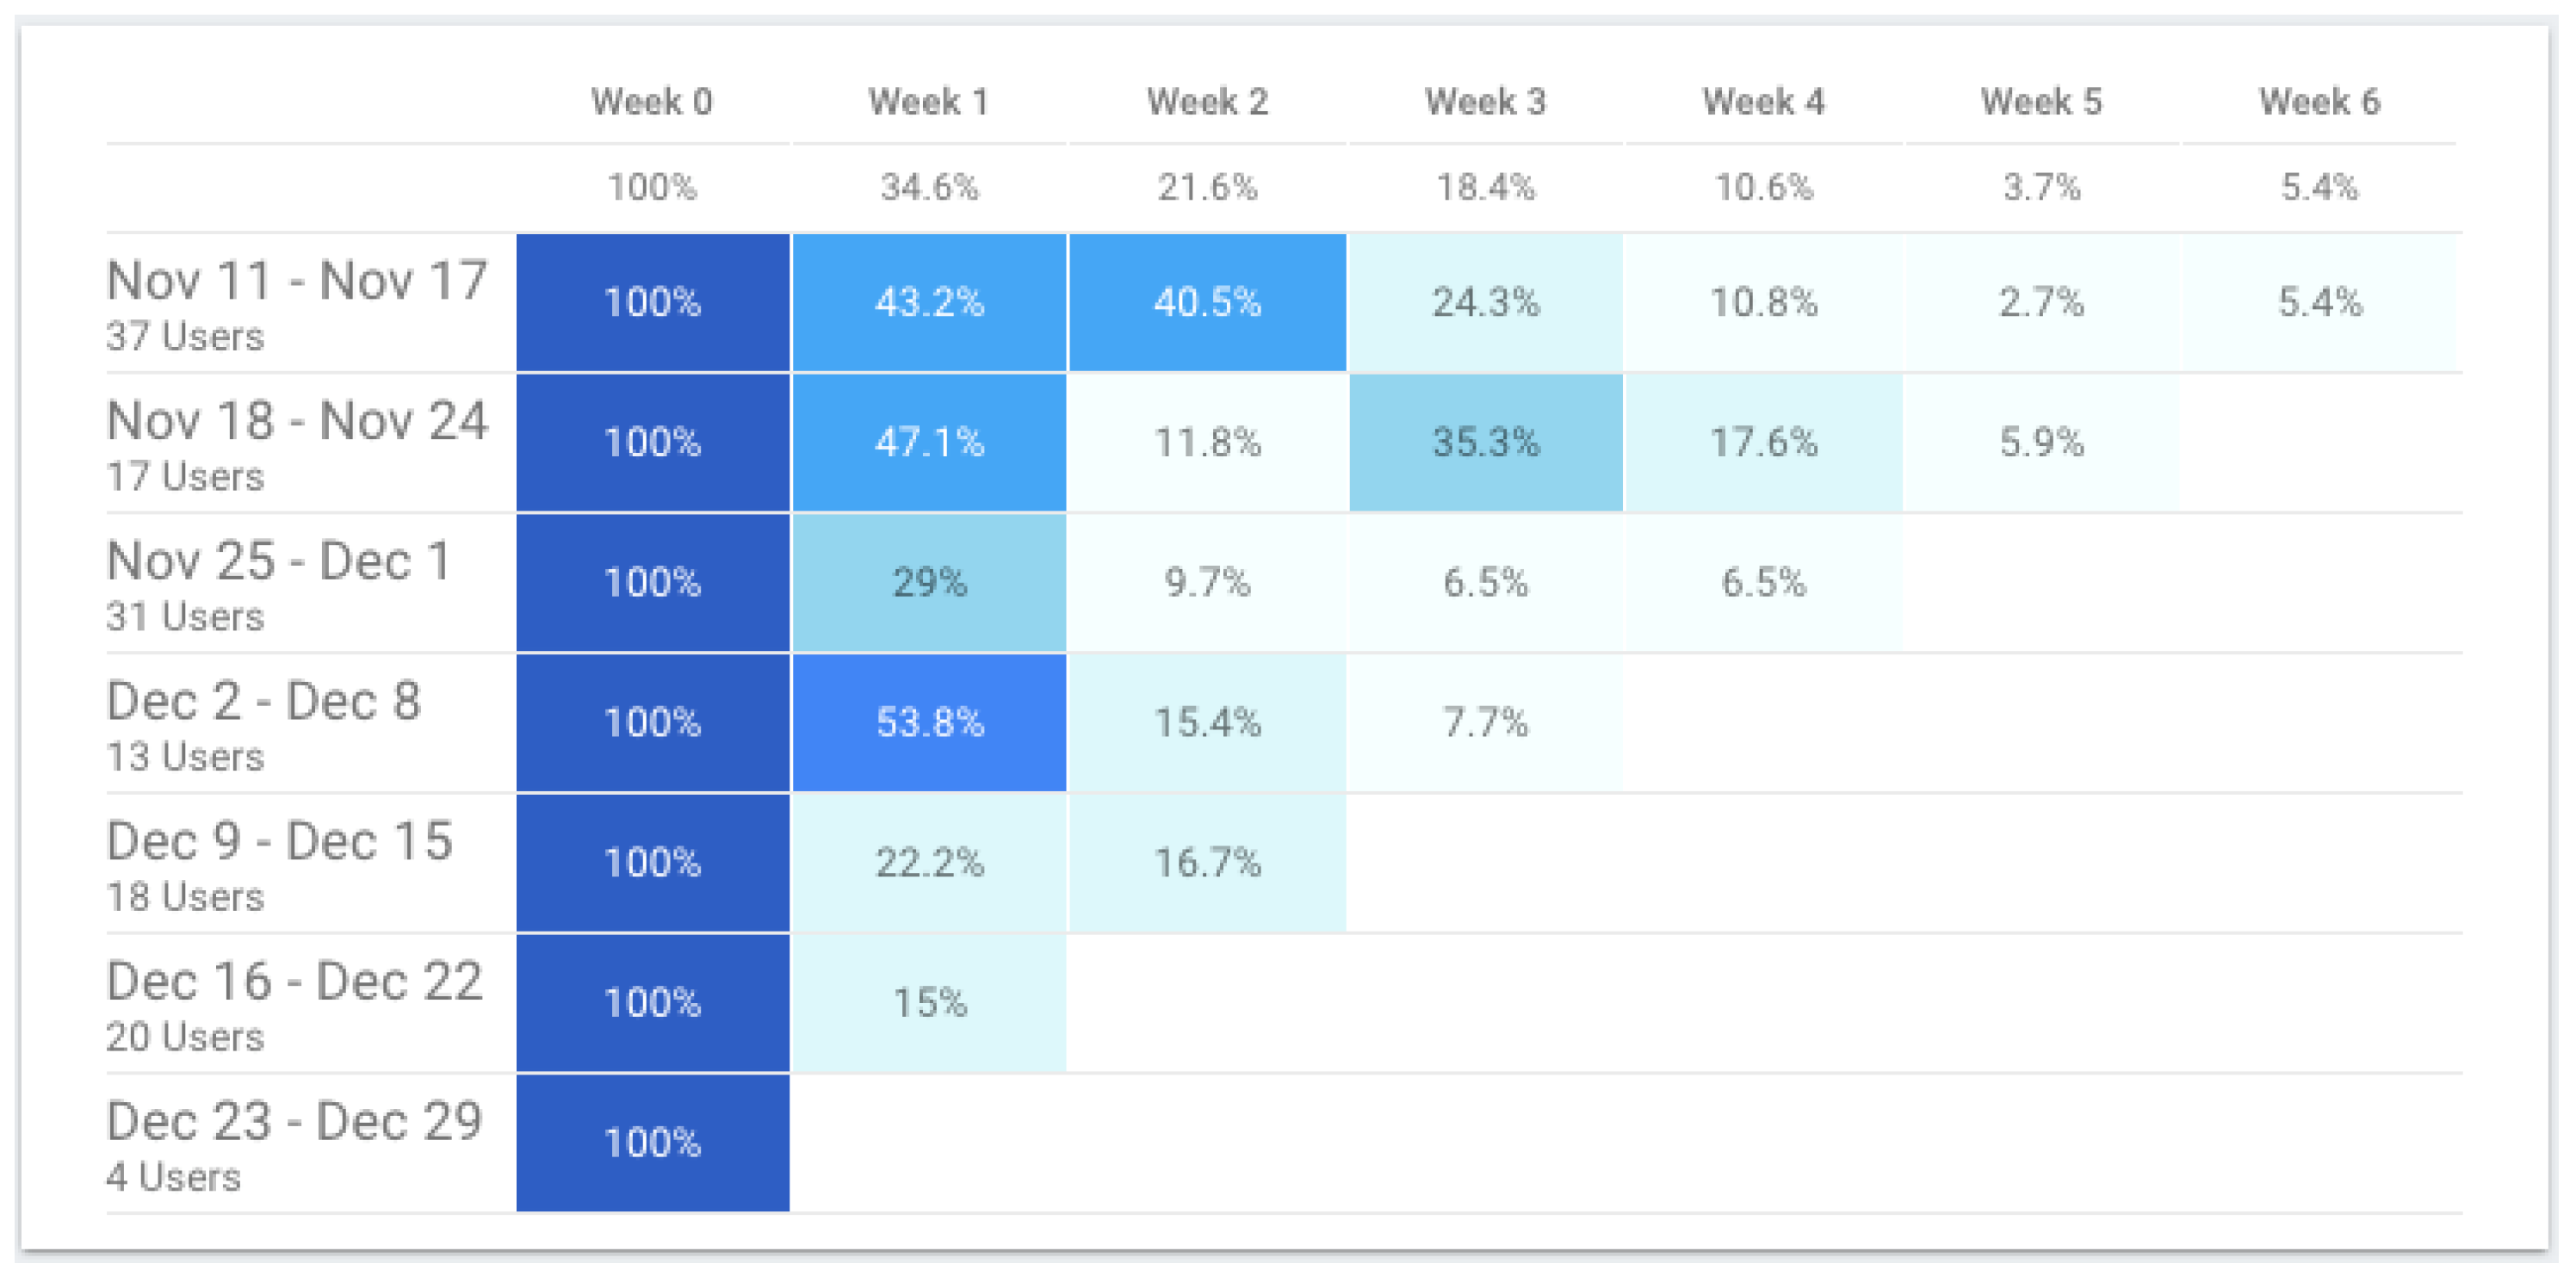
3.3. Phase 3—Post-Production Data
4. Discussion
Limitations
5. Conclusions
Author Contributions
Funding
Institutional Review Board Statement
Informed Consent Statement
Data Availability Statement
Acknowledgments
Conflicts of Interest
Appendix A. Record Sheet for the Observer
| Name: | Area of Expertise: | ||||
| Gender: | Date of Birth: | Mobile Phone Model: | |||
| start time: | end time: |
| Task #1 Record at least 2 of the meals that you made yesterday. Can you tell me what was the percentage of vegetables that you consumed in those meals? | |
| Duration How many seconds did the user take to complete? | |
| Expected Path Has the user followed the expected path? | |
| [Expected Path] Start—Big Avatar—Click on previous day arrow—Click on one meal (Breakfast or other)—Click on slices that I don’t eat (do that 2 times, 1 for each meal)—Click Back—Click on Daily Balance—See the percentage of vegetables. | |
| Reaction What were the user’s expressions and comments? | |
| Errors How many clicks in the wrong places? | |
| User is LOST What did the user expect the app would do? | |
Appendix B. Final Questionnaire (for the User)
| Name: | Area of Expertise: | ||||
| Gender: | Date of Birth: | Mobile Phone Model: | |||
| How much time did you spend in the app until finding it easy to navigate? Quanto tempo passou na aplicação até a considerar explorada? | |
| Did you find the navigation flow simple and easy to use? If not, why? Achou simples e fácil a navegação na aplicação? Se Não, Porquê? | |
| Did you find the exercise monitoring area? Steps and calories? If yes, where? Encontrou a zona de monitorização de atividade física? (Passos e calorias?) Se Sim, Onde? | |
| Did you find the forum area? If yes, where? Encontrou a zona do forúm? Sim, Onde? | |
| Observations and Comments—Observações e Comentários | |
Appendix C. Post-Study System Usability Questionnaire (PSSUQ)—List of Items
References
- Turner, R.M.; Ma, Q.; Lorig, K.; Greenberg, J.; DeVries, A.R. Evaluation of a Diabetes Self-Management Program: Claims Analysis on Comorbid Illnesses, Health Care Utilization, and Cost. J. Med. Internet Res. 2018, 20, e207. [Google Scholar] [CrossRef] [PubMed]
- Beleigoli, A.M.; Andrade, A.Q.; Cançado, A.G.; Paulo, M.N.; Diniz, M.D.F.H.; Ribeiro, A.L. Web-Based Digital Health Interventions for Weight Loss and Lifestyle Habit Changes in Overweight and Obese Adults: Systematic Review and Meta-Analysis. J. Med. Internet Res. 2019, 21, e298. [Google Scholar] [CrossRef] [PubMed] [Green Version]
- GBD 2015 Obesity Collaborators. Health Effects of Overweight and Obesity in 195 Countries over 25 Years. N. Engl. J. Med. 2017, 377, 13–27. [Google Scholar] [CrossRef]
- Buttitta, M.; Iliescu, C.; Rousseau, A.; Guerrien, A. Quality of life in overweight and obese children and adolescents: A literature review. Qual. Life Res. 2013, 23, 1117–1139. [Google Scholar] [CrossRef]
- Loche, E.; Ozanne, S.E. Non-Genetic Transmission of Obesity-It’s in Your Epigenes. Trends Endocrinol. Metab. 2016, 27, 349–350. [Google Scholar] [CrossRef] [PubMed] [Green Version]
- Currie, C.; Zanotti, C.; Morgan, A.; Currie, D.; De Looze, M.; Roberts, C.; Samdal, O.; Smith, O.R.; Barnekow, V. Social determinants of health and well-being among young people. In Health Behaviour in School-Aged Children (HBSC) Study: International Report from the 2009/2010 Survey; World Health Organization: Geneva, Switzerland, 2012; p. 27. [Google Scholar]
- Organisation for Economic Co-Operation and Development. Health at a Glance: OECD Indicators 2005; OECD Publishing: Paris, France, 2005. [Google Scholar]
- Frontini, R.; Gouveia, M.J.; Moreira, H.; Canavarro, M.C. Adaptação psicossocial na obesidade pediátrica: Um estudo com pais, crianças e adolescents. Psychol. Community Health 2016, 5, 85–101. [Google Scholar] [CrossRef] [Green Version]
- Jensen, C.D.; Steele, R.G. Longitudinal associations between teasing and health-related quality of life among treatment-seeking overweight and obese youth. J. Pediatr. Psychol. 2012, 37, 438–447. [Google Scholar] [CrossRef] [Green Version]
- Ottova, V.; Erhart, M.; Rajmil, L.; Dettenborn-Betz, L.; Ravens-Sieberer, U. Overweight and its impact on the health-related quality of life in children and adolescents: Results from the European KIDSCREEN survey. Qual. Life Res. 2012, 21, 59–69. [Google Scholar] [CrossRef]
- Jelalian, E.; Hart, C.N. Pediatric obesity. In Handbook of Pediatric Psychology; Roberts, M.C., Steele, R.G., Eds.; The Guilford Press: New York, NY, USA, 2010; pp. 446–463. [Google Scholar]
- Lobstein, T.; Baur, L.; Uauy, R. Obesity in children and young people: A crisis in public health. Obes. Rev. 2004, 5 (Suppl. 5), 4–85. [Google Scholar] [CrossRef]
- Müller-Riemenschneider, F.; Reinhold, T.; Berghöfer, A.; Willich, S.N. Health-economic burden of obesity in Europe. Eur. J. Epidemiol. 2008, 23, 499–509. [Google Scholar] [CrossRef]
- World Health Organization (WHO). Report of the Commission on Ending Childhood Obesity; World Health Organization: Geneva, Switzerland, 2016; p. 30. [Google Scholar]
- Daniels, S.R. The consequences of childhood overweight and obesity. Future Child. 2006, 16, 47–67. [Google Scholar] [CrossRef] [PubMed]
- Filipe, J.; Godinho, C.A.; Graça, P. Intervenções comportamentais de prevenção da obesidade infantil: Estado da arte em Portugal. Psychol. Community Health 2016, 5, 170–184. [Google Scholar] [CrossRef] [Green Version]
- Sancho, T.; Pinto, E.; Elisabete, P.; Mota, J.; Vale, S.; Moreira, P. Determinantes do peso corporal de crianças em idade pré-escolar. Fatores Risco 2014, 34, 26–33. [Google Scholar]
- Danaher, B.G.; Brendryen, H.; Seeley, J.R.; Tyler, M.S.; Woolley, T. From black box to toolbox: Outlining device functionality, engagement activities, and the pervasive information architecture of mHealth interventions. Internet Interv. 2015, 2, 91–101. [Google Scholar] [CrossRef] [PubMed] [Green Version]
- European Commission. Green Paper on Mobile Health (‘mHealth’); European Commission: Brussels, Belgium, 2014; pp. 1–20. [Google Scholar]
- Bashshur, R.; Shannon, G.; Krupinski, E.; Grigsby, J. The Taxonomy of Telemedicine. Telemed. E-Health 2011, 17, 484–494. [Google Scholar] [CrossRef] [PubMed] [Green Version]
- Cameron, J.D.; Ramaprasad, A.; Syn, T. An ontology of and roadmap for mHealth research. Int. J. Med. Inform. 2017, 100, 16–25. [Google Scholar] [CrossRef]
- Fiordelli, M.; Diviani, N.; Schulz, P.J. Mapping mhealth research: A decade of evolution. J. Med. Internet Res. 2013, 15, e95. [Google Scholar] [CrossRef]
- Ribeiro, N.; Moreira, L.; Almeida, A.M.; Santos-Silva, F. Happy: Cancer Prevention Using Smartphones. Procedia Comput. Sci. 2016, 100, 466–473. [Google Scholar] [CrossRef] [Green Version]
- Afshin, A.; Babalola, D.; Mclean, M.; Yu, Z.; Ma, W.; Chen, C.Y.; Arabi, M.; Mozaffarian, D. Information Technology and Lifestyle: A Systematic Evaluation of Internet and Mobile Interventions for Improving Diet, Physical Activity, Obesity, Tobacco, and Alcohol Use. J. Am. Heart Assoc. 2016, 5, e003058. [Google Scholar] [CrossRef] [Green Version]
- Sousa, P.; Fonseca, H.; Gaspar, P.; Gaspar, F. Internet-based intervention programme for obese adolescents and their families (Next.Step): Research protocol of a controlled trial. J. Adv. Nurs. 2014, 70, 904–914. [Google Scholar] [CrossRef]
- Bert, F.; Giacometti, M.; Gualano, M.R.; Siliquini, R. Smartphones and health promotion: A review of the evidence. J. Med. Syst. 2014, 38, 9995. [Google Scholar] [CrossRef] [PubMed]
- Steinhubl, S.R.; Muse, E.D.; Topol, E.J. The Emerging Field of Mobile Learning. Sci. Transl. Med. 2015, 7, 1–6. [Google Scholar] [CrossRef] [PubMed] [Green Version]
- Klasnja, P.; Pratt, W. Healthcare in the pocket: Mapping the space of mobile-phone health interventions. J. Biomed. Inform. 2012, 45, 184–198. [Google Scholar] [CrossRef] [PubMed] [Green Version]
- Patel, M.S.; Asch, D.A.; Volpp, K.G. Wearable Devices as Facilitators, Not Drivers, of Health Behavior Change. J. Am. Med. Assoc. 2015, 19104, 459–460. [Google Scholar] [CrossRef]
- Dobkin, B.H.; Dorsch, A. The promise of mHealth: Daily activity monitoring and outcome assessments by wearable sensors. Neurorehabilit. Neural Repair 2011, 25, 788–798. [Google Scholar] [CrossRef]
- Alahäivälä, T. Understanding persuasion contexts in health gamification: A systematic analysis of gamified health behavior change support systems literature. Int. J. Med. Inform. 2016, 96, 62–70. [Google Scholar] [CrossRef]
- Handel, M.J. mHealth (mobile health)-using Apps for health and wellness. Explore 2011, 7, 256–261. [Google Scholar] [CrossRef]
- Arthurs, N.; Tully, L.; O’Malley, G.; Browne, S. Usability and Engagement Testing of mHealth Apps in Paediatric Obesity: A Narrative Review of Current Literature. Int. J. Environ. Res. Public Health 2022, 19, 1453. [Google Scholar] [CrossRef]
- Norman, D.A.; Draper, S.W. User Centered System Design: New Perspectives on Human-Computer Interaction; Lawrence Erlbaum Associates: Hillside, NJ, USA, 1986. [Google Scholar]
- ISO 9241-210:2010-Ergonomics of Human-System Interaction—Part 210: Human-Centred Design for Interactive Systems. Available online: https://www.iso.org/standard/52075.html (accessed on 19 December 2018).
- Reis, C.I.; Freire, C.S.; Fernández, J.; Monguet, J.M. Patient centered design: Challenges and lessons learned from working with health professionals and schizophrenic patients in e-therapy contexts. In International Conference on ENTERprise Information Systems; CCIS, no. PART 3; Springer: Berlin/Heidelberg, Germany, 2011; Volume 221. [Google Scholar]
- Granollers, T. MPIu + a Metodología Para el Desarrollo de Sistemas Interactivos. 2004. Available online: https://core.ac.uk/download/pdf/47238773.pdf (accessed on 25 September 2022).
- “What is User Centered Design?”, The Interaction Design Foundation. 2022. Available online: https://www.interaction-design.org/literature/topics/user-centered-design (accessed on 26 August 2022).
- Cayola, L.; Macías, J.A. Systematic guidance on usability methods in user-centered software development. Inf. Softw. Technol. 2018, 97, 163–175. [Google Scholar] [CrossRef] [Green Version]
- Baulch, J.; Chester, A.; Brennan, L. Adolescent and Parent Content Preferences and Predictors of Intention to Use an Online Healthy Weight Website for Adolescents. E-J. Appl. Psychol. 2010, 6, 19–27. [Google Scholar] [CrossRef] [Green Version]
- Ritterband, L.M.; Gonder-Frederick, L.A.; Cox, D.J.; Clifton, A.D.; West, R.W.; Borowitz, S.M. Internet Interventions: In Review, in Use, and into the Future. Prof. Psychol. Res. Pract. 2003, 34, 527–534. [Google Scholar] [CrossRef] [Green Version]
- Deterding, S. How to Do Gameful Design. In Extended Abstracts Publication of the Annual Symposium on Computer-Human Interaction in Play-CHI PLAY ’17 Extended Abstracts; Association for Computing Machinery: New York, NY, USA, 2017; pp. 581–583. [Google Scholar]
- Orji, R.; Tondello, G.F.; Nacke, L.E. Personalizing Persuasive Strategies in Gameful Systems to Gamification User Types. In Proceedings of the 2018 CHI Conference on Human Factors in Computing Systems-CHI ’18, Montreal, QC, Canada, 21–26 April 2018; pp. 1–14. [Google Scholar]
- Tondello, G.F.; Kappen, D.L.; Mekler, E.D.; Ganaba, M.; Nacke, L.E. Heuristic Evaluation for Gameful Design. In Proceedings of the 2016 Annual Symposium on Computer-Human Interaction in Play Companion Extended Abstracts-CHI PLAY Companion ’16; Association for Computing Machinery: New York, NY, USA, 2016; pp. 315–323. [Google Scholar]
- Guarneri, M.R.; Perego, P. Games and Gamification for Healthy Behaviours: The Experience of PEGASO Fit 4 Future; Springer: Cham, Switzerland, 2017; pp. 100–109. [Google Scholar]
- Hallifax, S.; Serna, A.; Marty, J.-C.; Lavoué, E. A Design Space for Meaningful Structural Gamification. In Proceedings of the Extended Abstracts of the 2018 CHI Conference on Human Factors in Computing Systems, Montreal, QC, Canada, 21–26 April 2018; pp. LBW073:1–LBW073:6. [Google Scholar]
- Deterding, S.; Dixon, D.; Khaled, R.; Nacke, L. From game design elements to gamefulness. In Proceedings of the International Academic MindTrek Conference: Envisioning Future Media Environments, MindTrek, Tampere, Finland, 28–30 September 2011; p. 9. [Google Scholar]
- Zichermann, G.; Cunningham, C. Gamification by Design: Implementing Game Mechanics in Web and Mobile Apps, 1st ed.; O’Reilly Media, Inc.: Sebastopol, CA, USA, 2011. [Google Scholar]
- Sardi, L.; Idri, A.; Fernández-Alemán, J.L. A systematic review of gamification in e-Health. J. Biomed. Inform. 2017, 71, 31–48. [Google Scholar] [CrossRef] [PubMed]
- Miller, A.S.; Cafazzo, J.A.; Seto, E. A game plan: Gamification design principles in mHealth applications for chronic disease management. Health Inform. J. 2014, 22, 184–193. [Google Scholar] [CrossRef]
- Mora, A.; Riera, D.; González, C.; Arnedo-Moreno, J. Gamification: A systematic review of design frameworks. J. Comput. High. Educ. 2017, 29, 516–548. [Google Scholar] [CrossRef] [Green Version]
- Deterding, S. The lens of intrinsic skill atoms: A method for gameful design. Hum.-Comput. Interact. 2015, 30, 294–335. [Google Scholar] [CrossRef]
- Kumar, J.; Herger, M. Gamification at Work. In Designing Engaging Business Software; Springer: Berlin/Heidelberg, Germany, 2013. [Google Scholar]
- Reeves, B.; Read, J.L. Total Engagement: How Games and Virtual Worlds Are Changing the Way People Work and Businesses Compete, 1st ed.; Harvard Business Review Press: Boston, MA, USA, 2009. [Google Scholar]
- Lindwell, W.; Butler, J.; Holden, K.; Lidwell, W. The Universal Principles of Design; Rockport Publishers, Inc.: Beverly, MA, USA, 2003. [Google Scholar]
- Kelley, C.; Wilcox, L.; Ng, W.; Schiffer, J.; Hammer, J. Design Features in Games for Health: Disciplinary and Interdisciplinary Expert Perspectives. In Proceedings of the 2017 Conference on Designing Interactive Systems, Edinburgh, UK, 10–14 June 2017; pp. 69–81. [Google Scholar]
- Cano, S.; Arteaga, J.M.; Collazos, C.A.; Gonzalez, C.S.; Zapata, S. Toward a methodology for serious games design for children with auditory impairments. IEEE Lat. Am. Trans. 2016, 14, 2511–2521. [Google Scholar] [CrossRef]
- HealthApp|KickO. Available online: http://bcnhealthapp.com/kicko/ (accessed on 30 March 2019).
- Kiwee Health. KiweeFit by Kiwee Health. Available online: https://tracxn.com/d/companies/kiweehealth.com (accessed on 25 September 2022).
- King, D.; Potter, A.; Rahman, E. NoObesity App. Available online: https://www.plymouth.ac.uk/research/centre-for-health-technology/noobesity-app (accessed on 25 September 2022).
- Aitken, M.; Clancy, B.; Nass, D. The Growing Value of Digital Health. Evidence and Impact on Human Health and the Healthcare System Institute Report. Available online: https://www.iqvia.com/institute/reports/the-growing-value-of-digital-health (accessed on 25 September 2022).
- Mobile App User Retention|Statistic. 2018. Available online: https://www.statista.com/statistics/384224/monthly-app-launches-churn/ (accessed on 20 September 2018).
- Mccurdie, T.; Taneva, S.; Casselman, M.; Yeung, M.; McDaniel, C.; Ho, W.; Cafazzo, J. The Case for User-Centered Design. Biomed. Instrum. Technol. 2012, 46, 49–56. [Google Scholar] [CrossRef] [Green Version]
- Chau, M.M.; Burgermaster, M.; Mamykina, L. The use of social media in nutrition interventions for adolescents and young adults—A systematic review. Int. J. Med. Inform. 2018, 120, 77–91. [Google Scholar] [CrossRef]
- Rice, R.E.; Katz, J.E. Comparing internet and mobile phone usage: Digital divides of usage, adoption, and dropouts. Telecomm. Policy 2003, 27, 597–623. [Google Scholar] [CrossRef]
- Fedele, D.A.; Cushing, C.C.; Fritz, A.; Amaro, C.M.; Ortega, A. Mobile health interventions for improving health outcomes in youth: A meta-analysis. JAMA Pediatr. 2017, 171, 461–469. [Google Scholar] [CrossRef]
- Carvalho, M.; Alves, R.; Reis, C.; Martinho, R.; Sousa, P.; Gaspar, P. Teenpower: An integrated architecture for an mHealth platform designed for e-Empowering teenagers to prevent obesity: A showcase of the TeenPower platform. In Proceedings of the 2018 IEEE 20th International Conference on e-Health Networking, Applications and Services (Healthcom), Ostrava, Czech Republic, 17–20 September 2018; pp. 1–4. [Google Scholar]
- Trotter, F.; Uhlman, D. Meaningful Use and Beyond; O’Reilly Media: Sebastopol, CA, USA, 2011. [Google Scholar]
- Nicholson, S. A recipe for meaningful gamification. In Gamification in Education and Business; Reiners, T., Wood, L.C., Eds.; Springer International Publishing: Cham, Switzerland, 2015; pp. 1–20. [Google Scholar]
- Unger, R.; Chandler, C. A Project Guide To UX Design: For User Experience Designers in the Field or in the Making (Voices That Matter), 2nd ed.; New Riders: Berkeley, CA, USA, 2012. [Google Scholar]
- Saffer, D. Designing for Interaction: Creating Innovative Applications and Devices; New Riders Publishing: Thousand Oaks, CA, USA, 2010; p. 223. [Google Scholar]
- Buxton, B. Sketching User Experiences: Getting the Design Right and the Right Design; Morgan Kaufmann: Burlington, MA, USA, 2007. [Google Scholar]
- Anderson, J.; McRee, J.; Wilson, R. Effective UI: The Art of Building Great User Experience in Software; O’Reilly Media: Sebastopol, CA, USA, 2010. [Google Scholar]
- Luz, R.L.; Sousa, P.; Frontini, R.; Silva, A.; Manual, B.; Ramos, C.; Ruivo, M.; Abreu, R.; Pozo, T.; Sardo, A.E.; et al. Assessing digital contents for health promotion and obesity prevention in adolescence. BMC Health Serv. Res. 2018, 18, 684. [Google Scholar]
- Mcleod, A.J., Jr.; Clark, J.G. Identifying the User in Healthcare Information Systems Resear. In Proceedings of the 2007 40th Annual Hawaii International Conference on System Sciences (HICSS’07), Big Island, HI, USA, 3–6 January 2007; p. 141. [Google Scholar] [CrossRef]
- Kaplan, K. When and How to Create Customer Journey Maps. Nielsen Norman Group. 2016. Available online: https://www.nngroup.com/articles/customer-journey-mapping/ (accessed on 25 September 2022).
- Pernencar, C.; Romão, T.; Simões, G. The Design Process of an e-Health project–Applying the HSI framework for interface analysis. In Proceedings of the 2016 IEEE 4th International Conference on Serious Games and Applications for Health (SeGAH), Orlando, FL, USA, 11–13 May 2016. [Google Scholar]
- Nielsen, J. Why You Only Need to Test with 5 Users. Nielsen Norman Group. 2000. Available online: https://www.nngroup.com/articles/why-you-only-need-to-test-with-5-users/ (accessed on 25 September 2022).
- Pernencar, C.; Sousa, P.; Frontini, R.; Martinho, R.; Runte, D.; Mendes, D.; Carvalho, M. Planning a health promotion program: Mobile app gamification as a tool to engage adolescents. HCist 2018-International Conference on Health and Social Care Information Systems and Technologies. Procedia Comput. Sci. 2018, 138, 113–118. [Google Scholar] [CrossRef]
- LeRouge, C.; Ma, J.; Sneha, S.; Tolle, K. User profiles and personas in the design and development of consumer health technologies. Int. J. Med. Inform. 2013, 82, e251–e268. [Google Scholar] [CrossRef] [PubMed]
- Nielsen, J. Usability Engineering; Academic Press, Inc.: Cambridge, MA, USA, 1993. [Google Scholar]
- Battleson, B.; Booth, A.; Weintrop, J. Usability testing of an academic library Web site: A case study. J. Acad. Librariansh. 2001, 27, 188–198. [Google Scholar] [CrossRef]
- Rosa, A.F.; Martins, A.I.; Costa, V.; Queiros, A.; Silva, A.; Rocha, N.P. European Portuguese validation of the Post-Study System Usability Questionnaire (PSSUQ). In Proceedings of the 2015 10th Iberian Conference on Information Systems and Technologies (CISTI), Aveiro, Portugal, 17–20 June 2015; pp. 1–5. [Google Scholar]
- Sousa, P.; Martinho, R.; Reis, C.; Dias, S.; Gaspar, P.J.S.; Dixe, M.D.A.; Luis, L.; Ferreira, M.R. Controlled trial of an mHealth intervention to promote healthy behaviours in adolescence (TeenPower): Effectiveness analysis. J. Adv. Nurs. 2020, 76, 1057–1068. [Google Scholar] [CrossRef] [Green Version]
- Firebase. Firebase Cloud Messaging|Firebase. 2018. Available online: https://firebase.google.com/ (accessed on 25 September 2022).
- Renner, M.; Taylor-Powell, E. Analyzing Qualitative Data, no. G3658-12. 2003. Available online: https://deltastate.edu/docs/irp/Analyzing%20Qualitative%20Data.pdf (accessed on 25 September 2022).
- Lacey, A.; Luff, D. Qualitative Data Analysis. 2009. Available online: https://www.rds-yh.nihr.ac.uk/wp-content/uploads/2013/05/9_Qualitative_Data_Analysis_Revision_2009.pdf (accessed on 25 September 2022).
- Dey, I. Qualitative Data Analysis: A User Friendly Guide for Social Scientists; Routledge, Taylor & Francis: New York, NY, USA, 2003. [Google Scholar]
- Seers, K. Qualitative data analysis. Evid.-Based Nurs.-BMJ J. 2012, 15, 2. [Google Scholar] [CrossRef] [Green Version]


| Games Elements [1] | Universal Principles of Design [2] | Health Procedures | Figure Number |
|---|---|---|---|
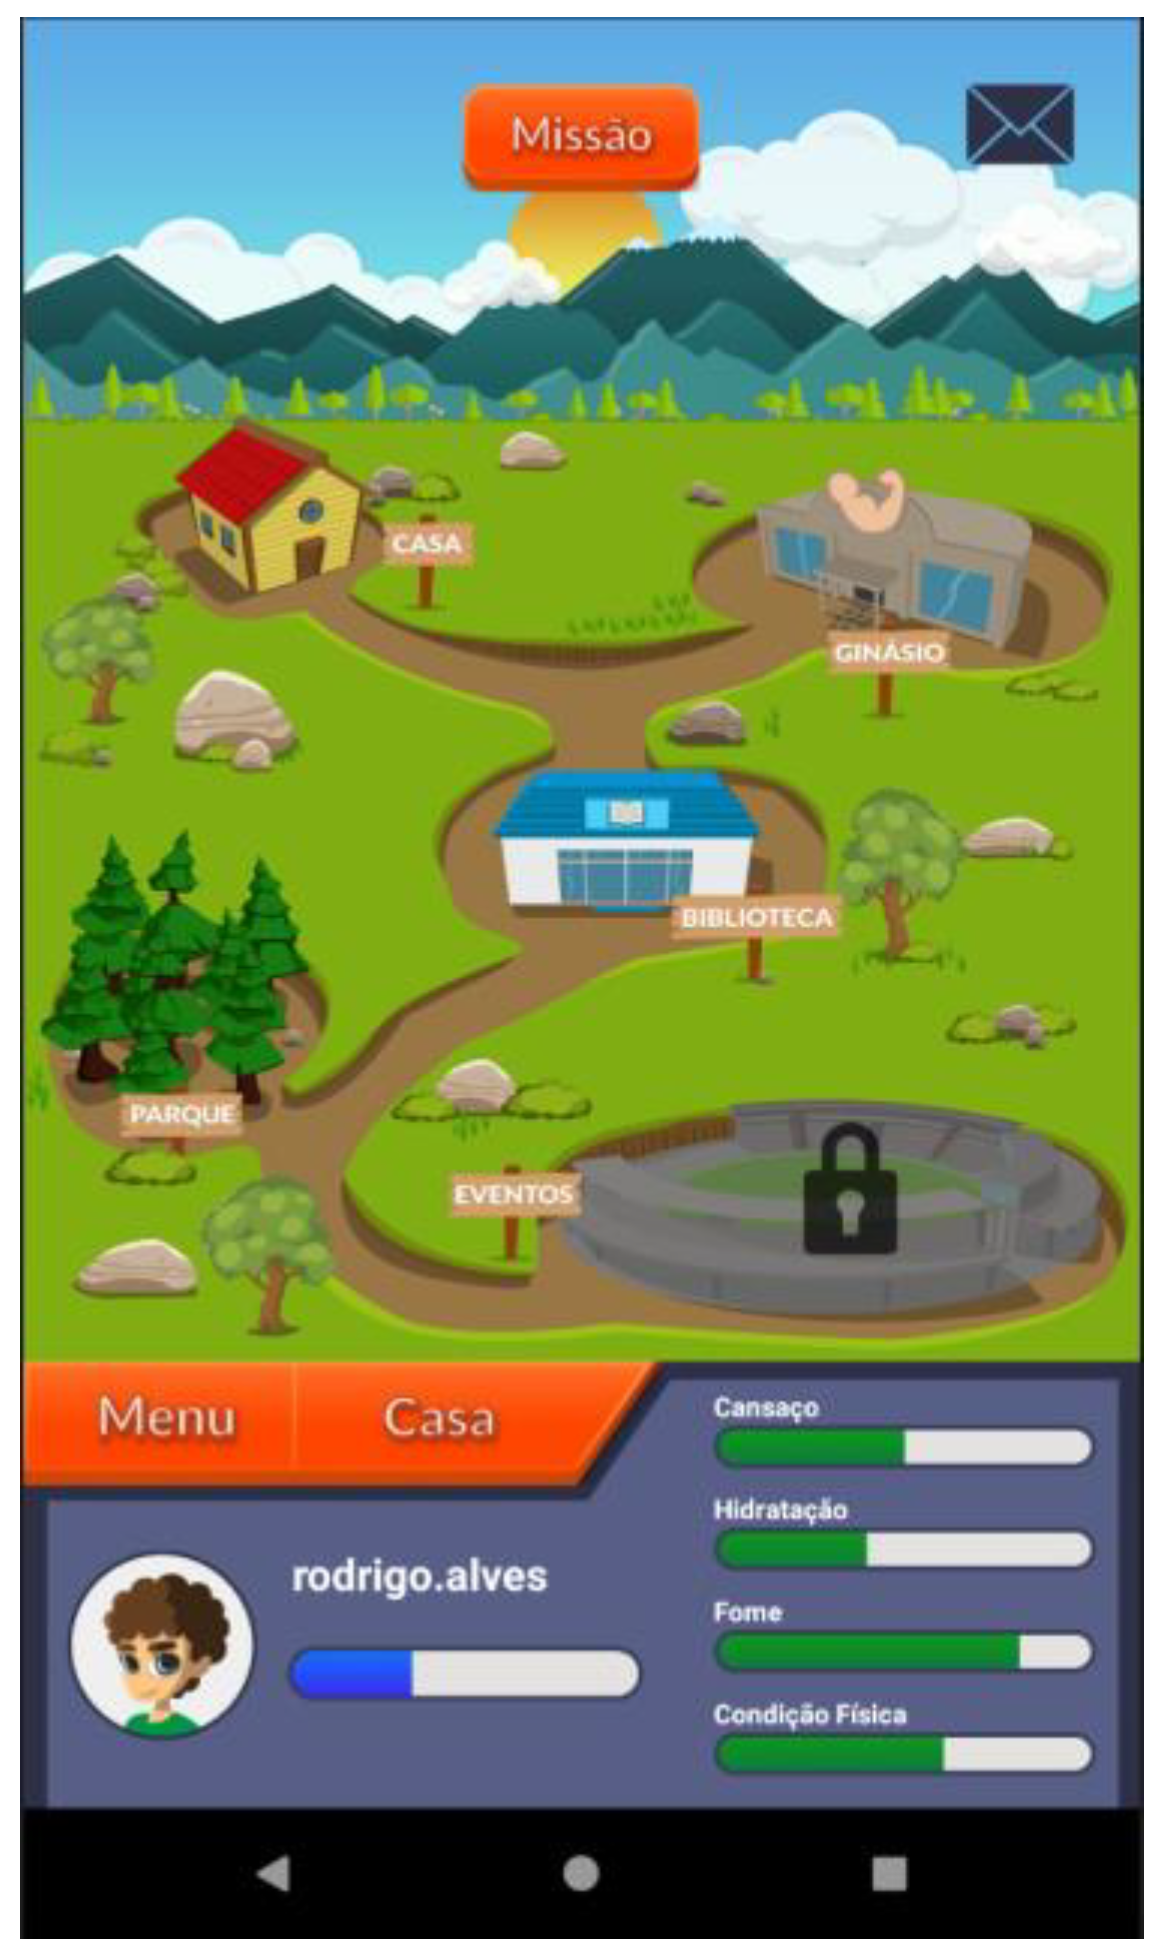
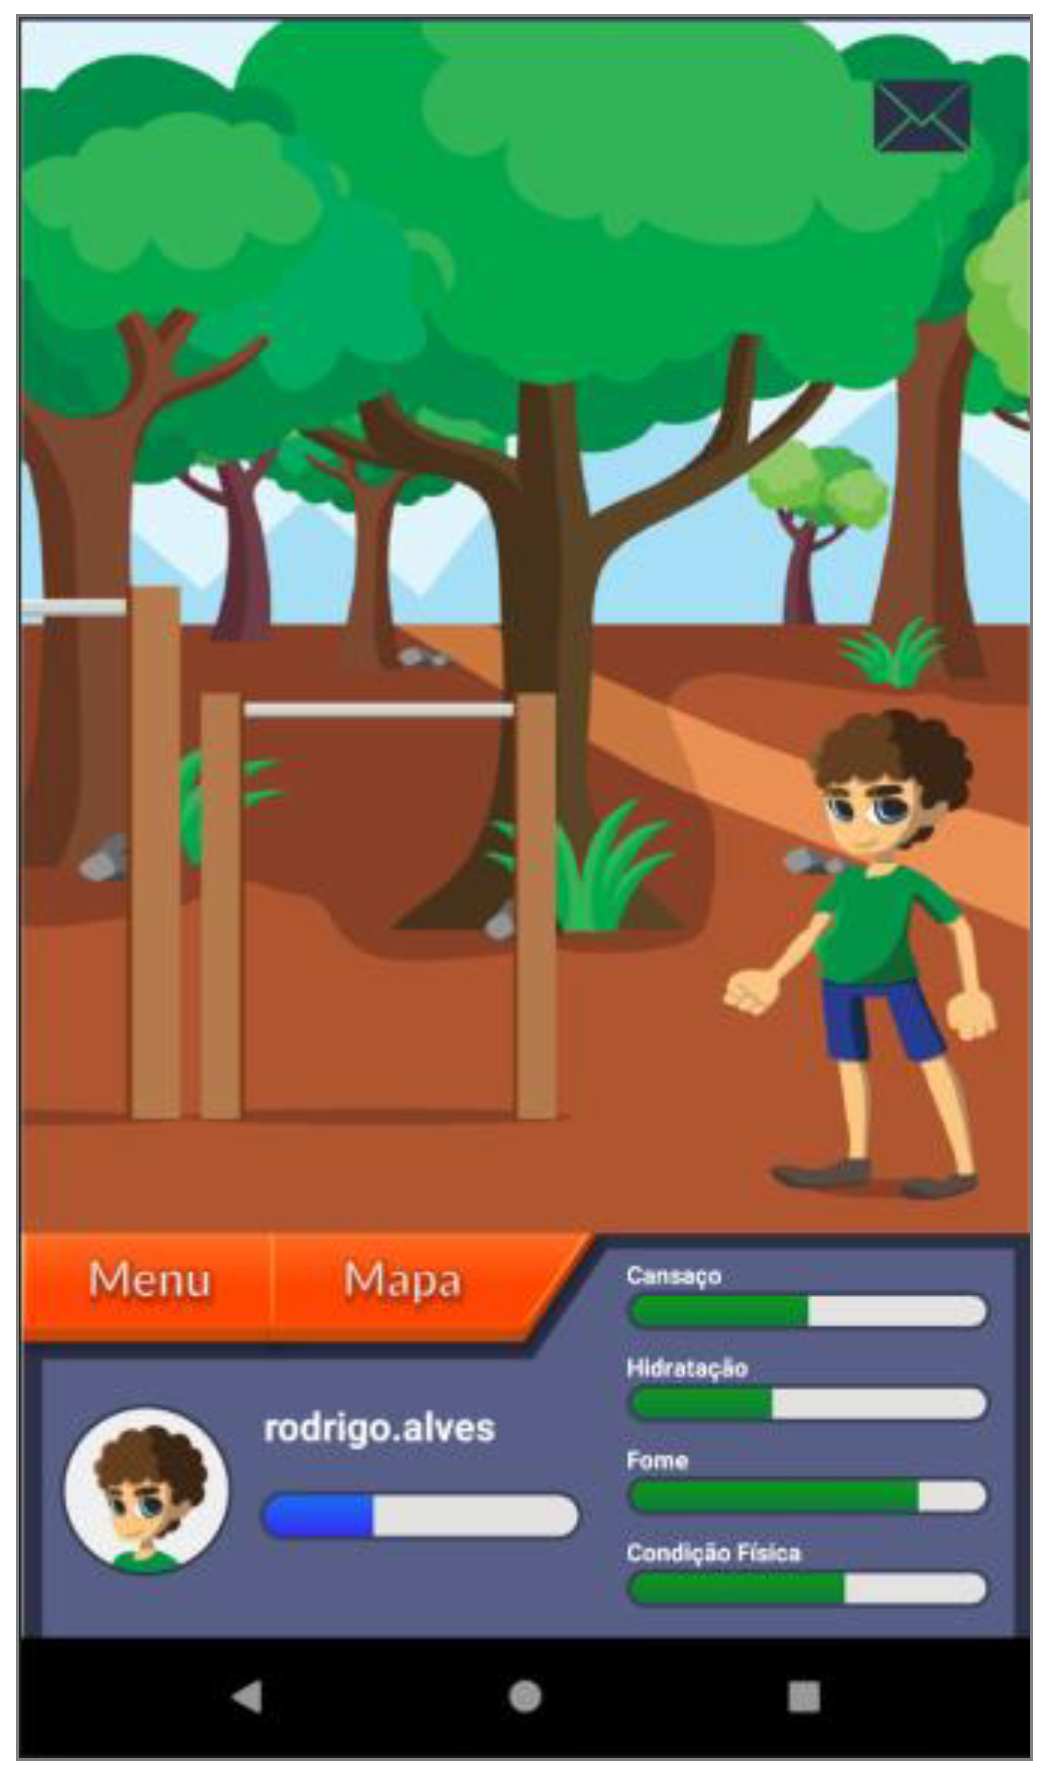
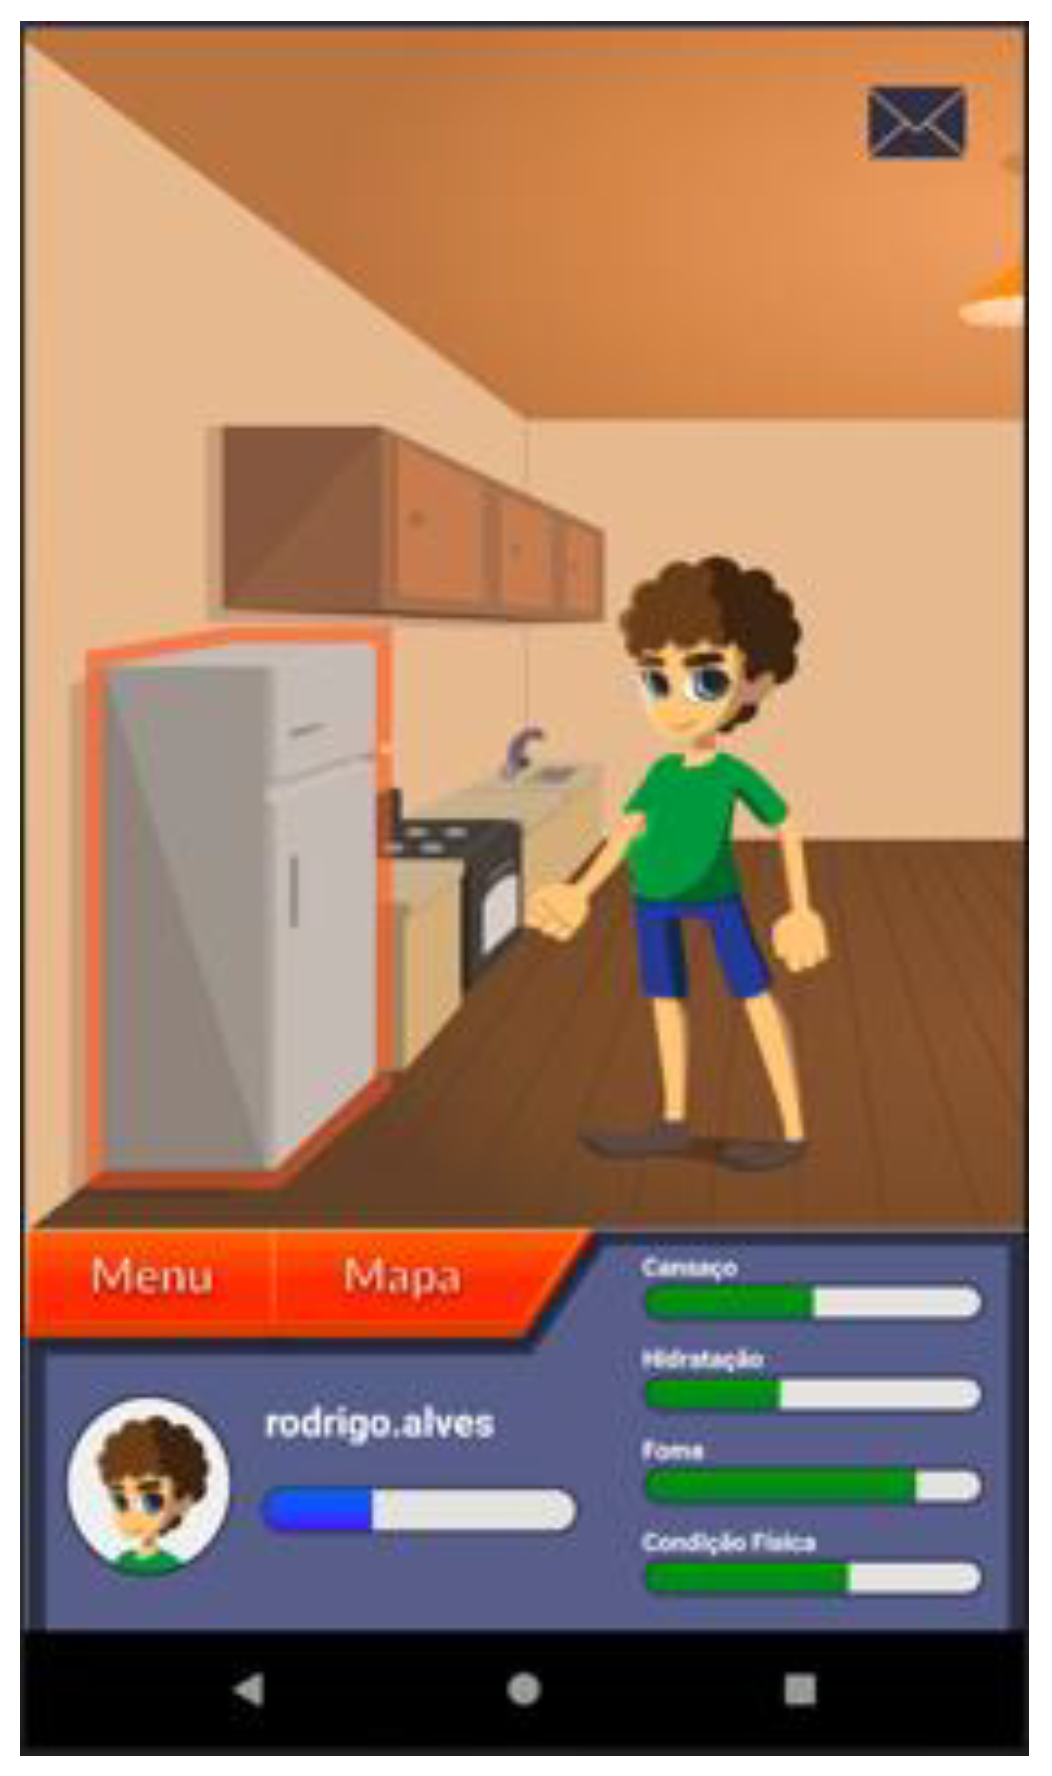
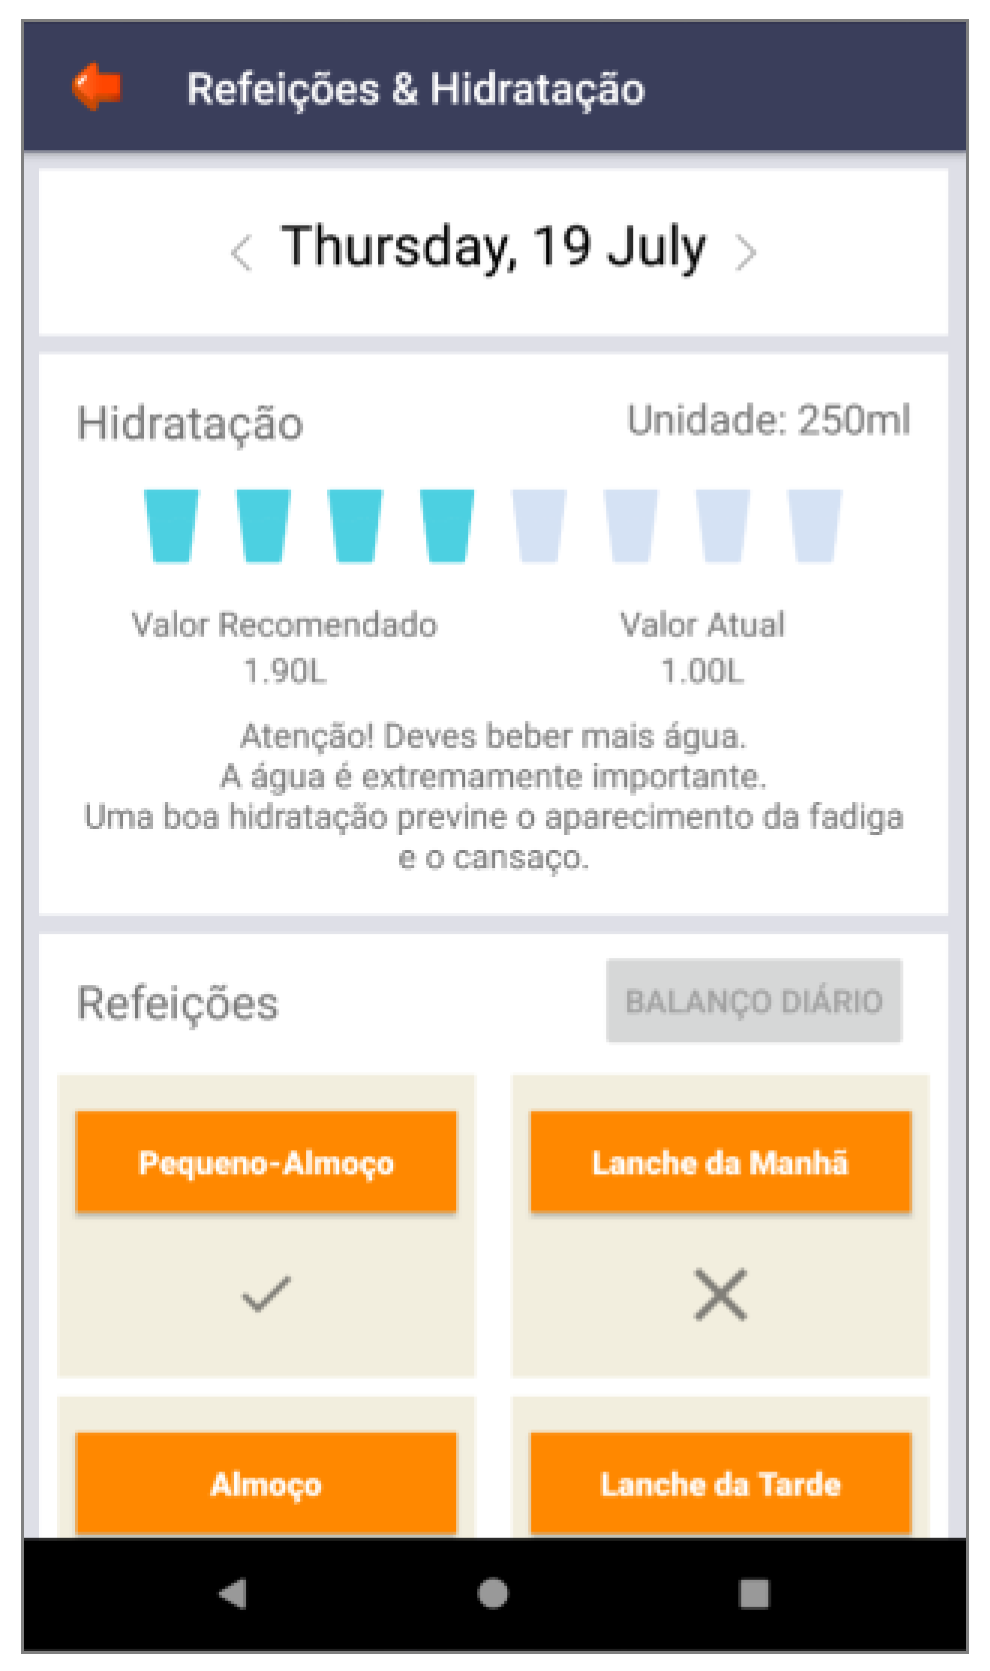
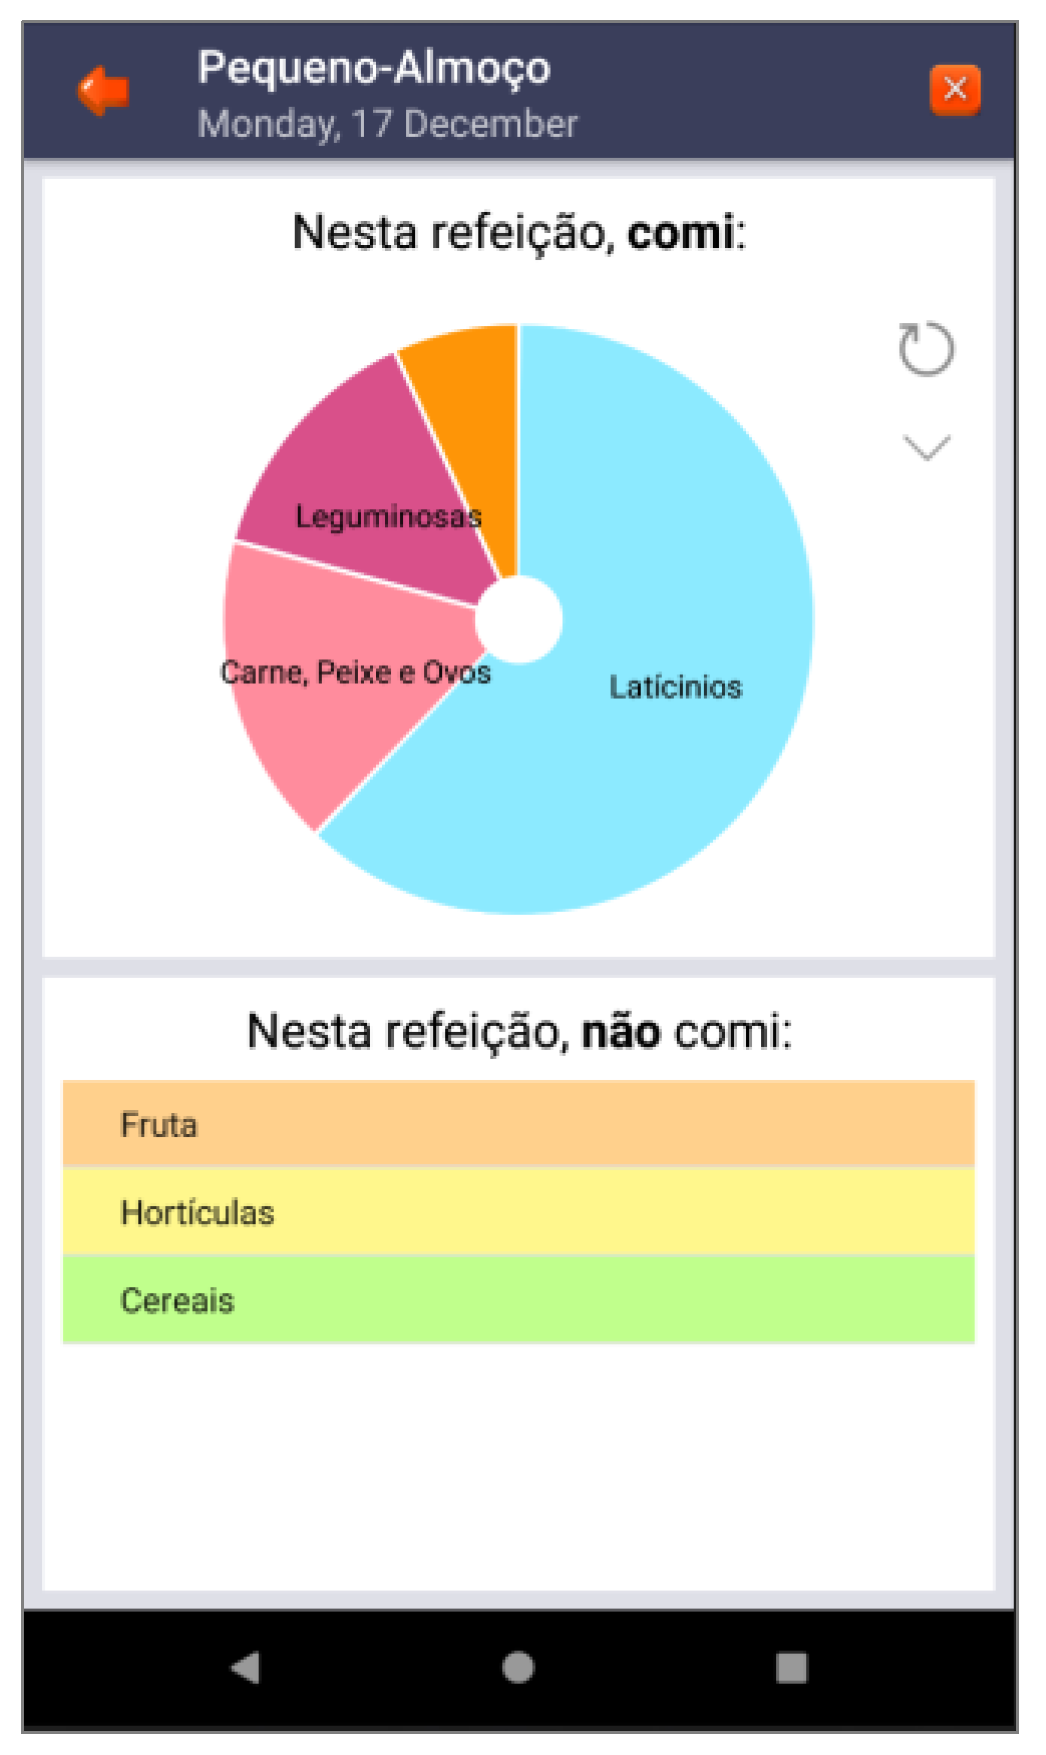
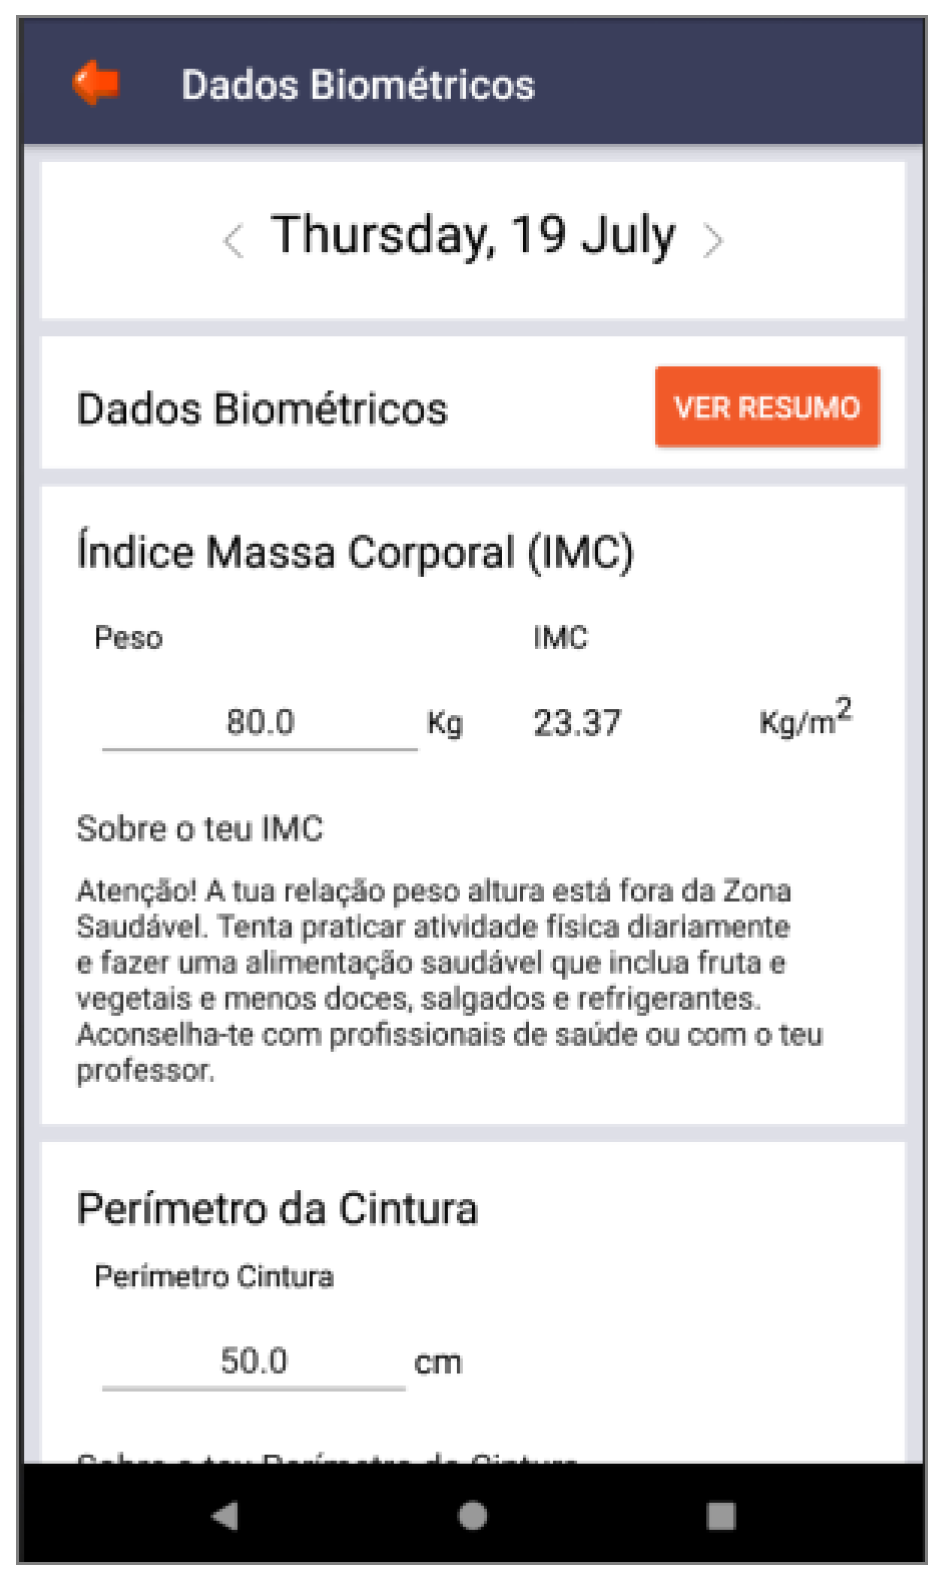
| Three-dimensional virtual environments | Affordance | Integration of clinical procedures behind virtual environments | Figure 2, Figure 3, Figure 5, Figure 6 and Figure 7 |
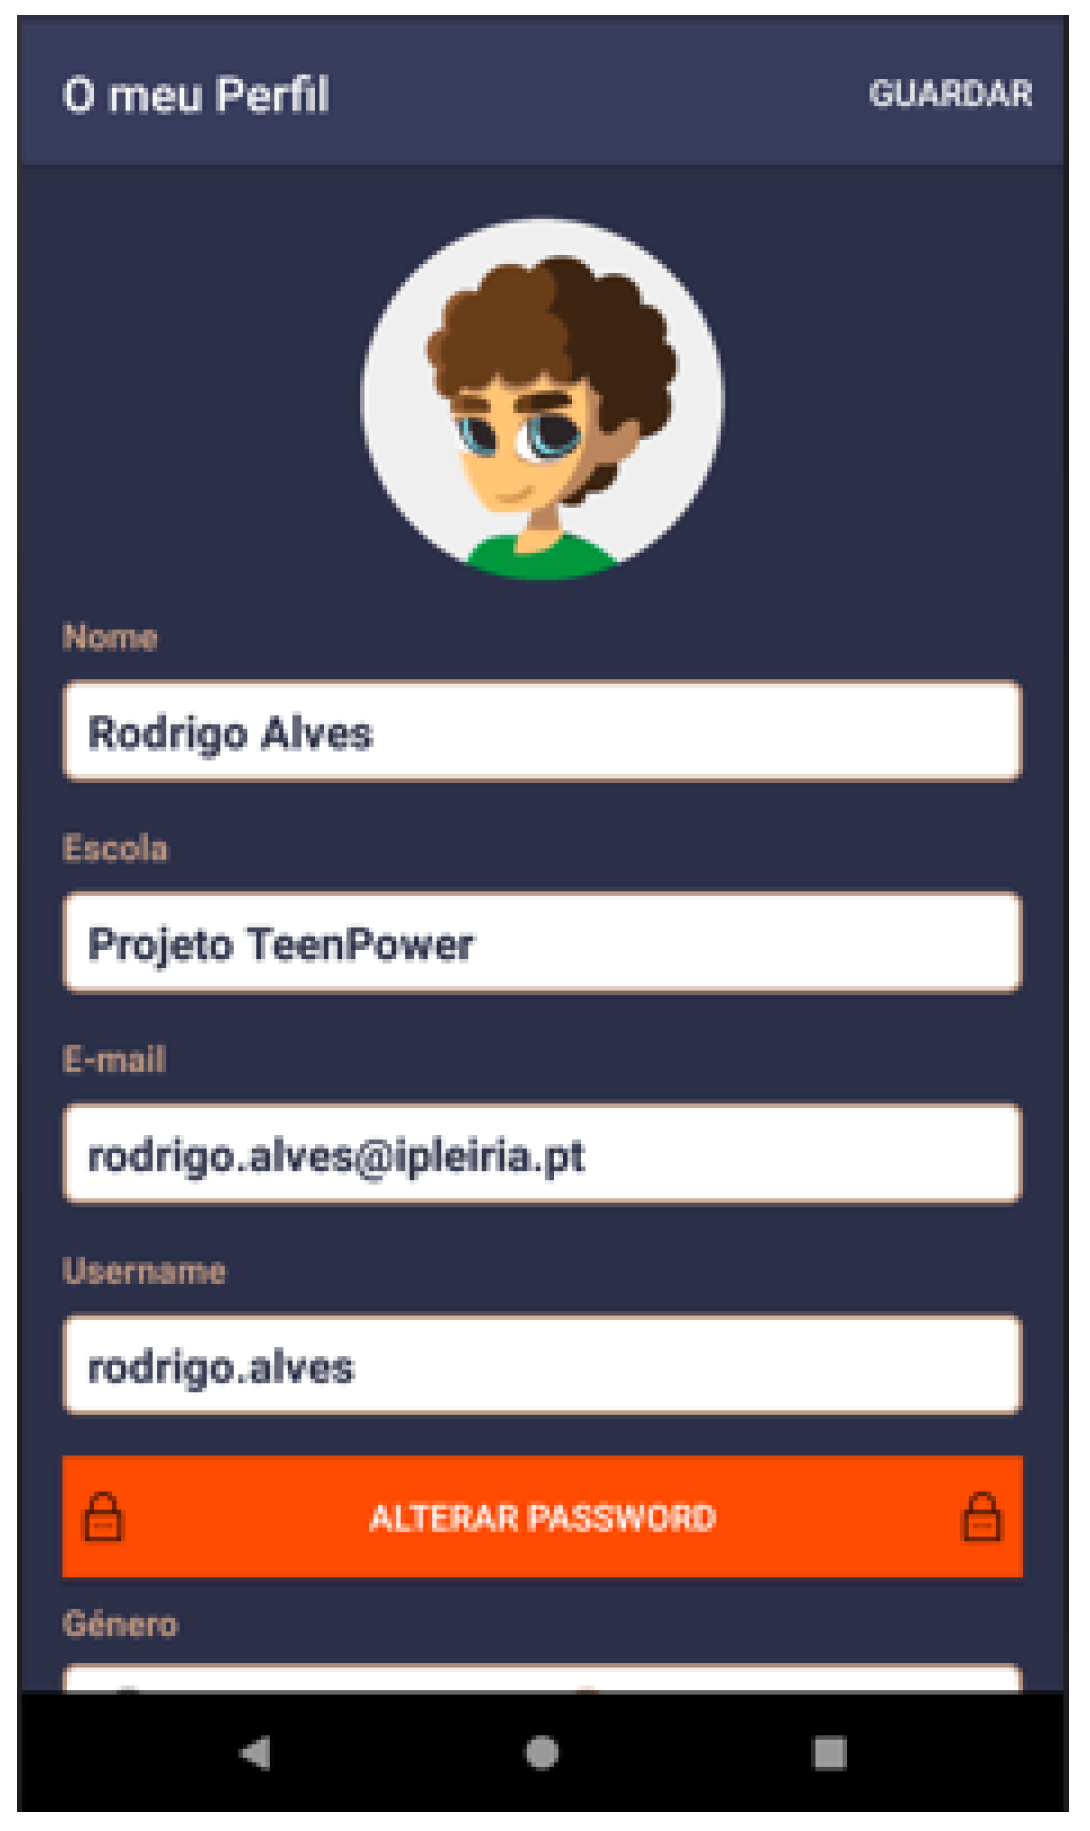
| Self-representation with avatars | Storytelling | Personal ID | Figure 4 |
| Narrative context | Immersion; consistency | Common areas easily recognized by adolescents where they should complete requested healthy tasks | Figure 3 |
| Feedback | Consistency; mental model | Back-office feedback that allows adolescents to remain committed to their health condition | Figure 3, Figure 8 and Figure 9 |
| Ranks and levels | Feedback loop | Back-office feedback that motivates adolescents to continue playing the game | Figure 10 |
| Competition under rules | Increase the motivation Fogg Behavior Model [3] | NA |
Publisher’s Note: MDPI stays neutral with regard to jurisdictional claims in published maps and institutional affiliations. |
© 2022 by the authors. Licensee MDPI, Basel, Switzerland. This article is an open access article distributed under the terms and conditions of the Creative Commons Attribution (CC BY) license (https://creativecommons.org/licenses/by/4.0/).
Share and Cite
Reis, C.I.; Pernencar, C.; Carvalho, M.; Gaspar, P.; Martinho, R.; Frontini, R.; Alves, R.; Sousa, P. Development of an mHealth Platform for Adolescent Obesity Prevention: User-Centered Design Approach. Int. J. Environ. Res. Public Health 2022, 19, 12568. https://doi.org/10.3390/ijerph191912568
Reis CI, Pernencar C, Carvalho M, Gaspar P, Martinho R, Frontini R, Alves R, Sousa P. Development of an mHealth Platform for Adolescent Obesity Prevention: User-Centered Design Approach. International Journal of Environmental Research and Public Health. 2022; 19(19):12568. https://doi.org/10.3390/ijerph191912568
Chicago/Turabian StyleReis, Catarina I., Cláudia Pernencar, Marta Carvalho, Pedro Gaspar, Ricardo Martinho, Roberta Frontini, Rodrigo Alves, and Pedro Sousa. 2022. "Development of an mHealth Platform for Adolescent Obesity Prevention: User-Centered Design Approach" International Journal of Environmental Research and Public Health 19, no. 19: 12568. https://doi.org/10.3390/ijerph191912568
APA StyleReis, C. I., Pernencar, C., Carvalho, M., Gaspar, P., Martinho, R., Frontini, R., Alves, R., & Sousa, P. (2022). Development of an mHealth Platform for Adolescent Obesity Prevention: User-Centered Design Approach. International Journal of Environmental Research and Public Health, 19(19), 12568. https://doi.org/10.3390/ijerph191912568