Article

Heart Rate Does Not Reflect the %VO2max in Recreational Runners during the Marathon

1
Department of STAPS, Université Paris-Saclay, Univ Evry, 91000 Evry-Courcouronnes, France
2
Laboratory of Neurophysiology and Movement Biomechanics, Université Libre de Bruxelles Neuroscience Institut, 1070 Bruxelles, Belgium
3
Billatraining SAS, 91840 Soisy-sur-École, France
4
Department of Integrative Medical Sciences, Northeast Ohio Medical University, Rootstown, OH 44272, USA
*
Author to whom correspondence should be addressed.
Int. J. Environ. Res. Public Health 2022, 19(19), 12451; https://doi.org/10.3390/ijerph191912451
Submission received: 5 August 2022 / Revised: 13 September 2022 / Accepted: 24 September 2022 / Published: 29 September 2022
(This article belongs to the Special Issue 2nd Edition: Sports and Health)

Abstract

:
Exercise physiologists and coaches prescribe heart rate zones (between 65 and 80% of maximal heart rate, HRmax) during a marathon because it supposedly represents specific metabolic zones and the percentage of V ˙ O2max below the lactate threshold. The present study tested the hypothesis that the heart rate does not reflect the oxygen uptake of recreational runners during a marathon and that this dissociation would be more pronounced in the lower performers’ group (>4 h). While wearing a portable gas exchange system, ten male endurance runners performed an incremental test on the road to determine V ˙ O2max, HRmax, and anaerobic threshold. Two weeks later, the same subjects ran a marathon with the same device for measuring the gas exchanges and HR continuously. The %HRmax remained stable after the 5th km (between 88% and 91%, p = 0.27), which was not significantly different from the %HRmax at the ventilatory threshold (89 ± 4% vs. 93 ± 6%, p = 0.12). However, the % V ˙ O2max and percentage of the speed associated with V ˙ O2max decreased during the marathon (81 ± 5 to 74 ± 5 % V ˙ O2max and 72 ± 9 to 58 ± 14 %v V ˙ O2max, p < 0.0001). Hence, the ratio between %HRmax and % V ˙ O2max increased significantly between the 5th and the 42nd km (from 1.01 to 1.19, p = < 0.001). In conclusion, pacing during a marathon according to heart rate zones is not recommended. Rather, learning about the relationship between running sensations during training and racing using RPE is optimal.

1. Introduction

Marathon running has increased in popularity since humans first set foot on the moon and with this popularization emerged a new category of runners, namely: “recreational marathon runners” [1,2,3]. These runners are eager [4], less well trained, and experimenters [5,6]. Hal Higdon, an experienced coach, and marathon runner (the first American 1964 Boston marathon finisher; 2:21:55) [7], purports that the key to performance in the marathon is proper pacing. However, ill-advised pacing remains the biggest problem for recreational marathoners as many runners continue to “hit the wall” late in the marathon due to their pacing strategies [8]. More than 80% of runners who “hit the wall” during a marathon report cardio-respiratory distress—increases and decreases in heart rate (HR) and feeling a general malaise and burnout after the 30th km [9]. The marathon is the ultimate exercise in both intensity and duration. It has been shown that elite [10] and recreational runners can reach 100% of their V ˙ O2max during the marathon [11,12]. The ability to sustain a high fraction of V ˙ O2max is a good indicator of marathon performance [5,13,14,15,16]. Indeed, recreational marathon runners often take over twice the time (of the winner) to finish a marathon, and thus sparing muscle glycogen becomes even more critical in order not to suffer from severe fatigue and “hit the wall” [17]. The most widely accepted theory for the association between low muscle glycogen and impaired muscle contractile function is glycogen depletion resulting in a reduction in ATP regeneration. Consequently, the muscles cannot maintain an adequate energy supply to the processes involved in excitation-contraction coupling, leading to an inability to translate muscle drive into an expected force; when this occurs, cramping and fatigue lead to “hitting the wall”. This is supported by observations of decreased phosphocreatine in addition to an increase in free adenosine diphosphate and inositol monophosphate following prolonged glycogen-depleting exercise [18,19].
Runners often pre-plan their pacing efforts using a pacing profile according to past marathon performances [20], feedback from the perceived exertion rate [12], or heart rate and speed. A small pacing error can result in feelings of a subpar performance or severe fatigue and “hitting the wall”. Studies show that previous marathon experience influences a runner’s pace and that there is an interaction between feedback (heart or respiratory rates) and the rate of perceived exertion (RPE) [12,21]. Exercise physiologists and coaches prescribe heart rate zones (between 65 and 80% of maximal heart rate, HRmax) during a marathon because it supposedly represents specific metabolic zones and the percentage of V ˙ O2max below the lactate threshold, allowing the sparing of muscle glycogen [17]. Heart rate does not serve as an indicator of environmental factors but rather provides an indication of the body’s exercise response when environmental factors change.
A prior study [22] that measured the cardiac output (CO) and the stroke volume (SV), of 14 recreational runners during a marathon which they completed in an average time of 3 h 30 min ± 45 min, showed that they elicited a higher fraction of HRmax than the one of their SV and CO (87.0 ± 1.6% vs. 77.2 ± 2.6%, and 68.7 ± 2.8%, for HR, SV and CO, respectively, p < 0.05) [23]. Furthermore, data collected during an official marathon race showed that HR was elevated throughout the marathon and increased over time, but without knowing an individual’s baseline V ˙ O2 kinetics and HRmax, there is no sufficient information concerning relative intensity [23].
Indeed, HR is ineffective for estimating the metabolic zone due to cardiovascular drift. A study of 280 recreational marathoners (2 h 30 min–3 h 40 min) showed that the relationship between heart rate increases for each meter run (cardiac cost) [24], and performance speed (m/s) was highly dependent on pacing strategy [25]. A higher increase in cardiac cost was associated with lower performance, resulting in a probable dissociation with the V ˙ O2 and HR over time. Consequently, a wrong pacing strategy may lead to an erroneous estimation of an athlete’s metabolic zones, i.e., A non-corresponding increase between HR and V ˙ O2. In the same way, performance speed (v, m/s) in running depends on the maximal metabolic power available to the athlete throughout the effort and on the economy of running (1):
v = Emax / C = F   ×   V ˙ O 2 max / Cr
where Cr (mlO2·m−1·kg−1) is the energy cost of running the fraction (F, a dimensionless number) is the percentage of V ˙ O2max that can be sustained over a race. Any increase in Cr would inevitably lead to a decrease in v [17]. In this regard, Cr increase with distance completed during simulated competitions that are shorter or identical in duration to the marathon or half marathon. For longer distances, results are equivocal: Cr did not increase after a 6-h ultramarathon, but it increased after 5 h and after 8 h of running at a pace corresponding to 55% and 40% of V ˙ O2max, respectively [26]. Despite a drop in running speed that the V ˙ O2 level will stay relatively high. We already know that runners will never attain the same percentage of V ˙ O2max as the percentage of HRmax and here, the aim of the present study is to test the hypothesis of a possible dissociation between the increases in HR and V ˙ O2 of recreational runners during the completion of an actual marathon. Therefore, this disassociation between HR and V ˙ O2, could be that most recreational runners will probably be maintaining a marathon pace above their metabolic zone if they use HR as a pacing determinant. This will especially be true in cases where their marathon time are longer than 4 hours. The estimation of the metabolic zone as a percentage of the maximal oxygen uptake (% V ˙ O2max) using HR data during the marathon is not reliable due to the different time courses of HR and V ˙ O2, which is even more pronounced in longer runs (4 h).

2. Materials and Methods

2.1. Subjects

Our subjects were ten male, recreational endurance runners (mean ± standard deviation (SD) age: 41.7 ± 7.7 years; weight: 73.2 ± 4.7 kg; and height: 180.5 ± 7.0 cm) (Table 1).
All study subjects were volunteers and were asked not to modify their habitual training. They were selected for having homogenous physiological and endurance characteristics [27,28,29], and half of the runners had previously run at least one marathon. All subjects declared to have habitually trained 3 to 4 times weekly (50–80 km/week) over more than five years. All subjects performed a high-intensity interval training session once per week of 6 × 1000 m at 90–100% of HRmax and a 15–25 km tempo session at 90–100% of their average marathon speed. The study was approved by the Institutional Review Board (IRB Sud-Est V, Grenoble, France; reference: 2018-A01496-49), and all participants were provided with study information and provided written consent.

2.2. The Incremental Maximal Test and the Marathon Race

All subjects performed an incremental test (the Université de Montréal track test, Léger and Boucher, 1980) on the road using a portable gas exchange system for determining V ˙ O2max, HRmax, and anaerobic threshold. The UM-TT has been validated as a valid field test of maximal and functional aerobic capacity and suggests that it can be additionally used for exercise prescription [30,31].
The UM-TT was conducted on a 400 m track with cones placed every 20 m. Pre-recorded sound beeps indicated when the subject needed to be near a cone to maintain the imposed speed. A longer sound marked speed increments. The first step was set to 8.5 km·h−1, with a subsequent increase of 0.5 km·h−1 every minute. When the runner was unable to maintain the imposed pace and thus failed to reach the cone in time for the beep on two consecutive occasions, the test was terminated. The speed corresponding to the last completed step was recorded as the v V ˙ O2max (km·h−1). During the UM-TT, V ˙ O2max was confirmed by a visible plateau in V ˙ O2 (O2 mL·kg−1·min−1) with a standard increase in exercise intensity, and any indicative secondary criteria (visible signs of exhaustion; HRmax ± 10 beats·min−1) around the point of volitional exhaustion and an RPE of 19–20.

2.3. The Experimental Measurements

The following gas exchange variables were measured: V ˙ O2, ventilation (VE), ventilatory equivalents for oxygen (VE/ V ˙ O2) and carbon dioxide (VE/ V ˙ CO2). Data from the last 30 seconds of each exercise stage were considered representative measurements of each stage. Maximal V ˙ O2 and HR were recorded as the highest values obtained for the last 30 secons period before exhaustion. The Respiratory Compensatory Point (RCP) was identified separately by three researchers as the point where an increase in both VE/ V ˙ O2 and VE/ V ˙ CO2 occurred [32]. All plots used in the determinations utilized raw breath-by-breath values. Respiratory gases (oxygen uptake ( V ˙ O2), ventilation (VE), and the respiratory exchange ratio (RER)) were continuously measured using a telemetric, portable, breath-by-breath sampling system (K4; Cosmed, Rome, Italy). A GPS watch (Garmin, Olathe, KS, USA) paired with the K4 system was used to measure the HR and the speed response (using 5 s data averages) throughout each trial and its validity has been reported [33]. We used the same cardiac belt for the Garmin Forerunner 645 and K4 because it was compatible with both. The subjects self-paced their run without focusing on the cardio-GPS (the display was hidden).
Two weeks later, they completed a marathon wearing the same portable gas exchange system and global positioning system watch (GPS). The incremental test and marathon race were run at the same time (morning), with a 10-day recovery period between the test and the marathon race. The data were collected during France’s 2019 Paris marathon (start times were at 9 a.m.). The temperatures ranged between 10 and 13 °C (between 9 a.m. and 1 p.m.). There was no precipitation, and the humidity averaged 60%. Blood lactate was measured (finger) (Lactate PRO2 LT-1730; Arkray, Japan) just after a warm-up (15 min at an easy pace) and then again three minutes after crossing the finish line.
During the marathon, refreshment points (water, dry and fresh fruit, and sugar) were offered every 5 km and at the finish line, and sponge stations were located every 5 km from km 7.5. At the aid stations, the runners were allowed to remove their masks so that they could drink or eat. To improve comfort, the runners used the mask version with inspiratory valves that reduce inspiratory resistance during high-intensity exercise.

2.4. The Variables Used in the Analysis of Results

In accordance with the purpose of this study we analyzed the fractional use of the maximal heart rate and V ˙ O2max and v V ˙ O2max. To show the dissociation between these two fractional uses of HR and V ˙ O2max we also analyzed their ratio and compared them at each 5 km section. We also calculated the energy cost of running (Cr in mlO2·kg−1·m−1) i.e., the ratio between the V ˙ O2 in mL·kg−1·min−1 and the speed in m·min−1 and the cardiac cost of running in beat·m−1 i.e., the ratio between the heart rate (bt·min−1) and the speed (m·min−1) for every 500 m section.
Given that the runner targets their pace according to a heart rate or speed, we wanted to check that their ratio remained stable by plotting their ratio (%HR/% V ˙ O2max and %HRmax/%v V ˙ O2max).

2.5. Statistical Analysis

All the test variables were reported as the mean ± SD. For each variable, the normality and homogeneity of the data distribution were examined using Shapiro–Wilks, Lilliefors, Anderson–Darling, and Jarque–Bera tests. For analyzing the effect of repetition (within effect) on data average for each 5 km, and the between (group of performance) effect, we applied a repeated measures ANOVA for % V ˙ O2max, %HRmax, %v V ˙ O2max and their ratio (%HR/% V ˙ O2max and %HRmax/%v V ˙ O2max).
We used Pearson’s correlation coefficient to correlate the performance of the % of HRmax and V ˙ O2max at each 5 km of the marathon race. We then determined the significance level α = 0.05 for interpreting the statistical tests. Given that we clearly had five runners who achieved the marathon in less than 4 h and five in more than 4 h. Since the slower marathoners (SM) completed their first marathon in more than 4 h, we decided to analyze the influence of the performance level on this dissociation between the heart rate and the oxygen uptake relative to their maximal respective values (%HRmax and % V ˙ O2max). We therefore checked the normality of distribution before applying the ANOVA for repeated measurement with two factors (repetition for every 5 km and the performance level).
All statistical analyses were performed using XLSTAT software (version 2019.1.1, Addinsoft, Paris, France).

3. Results

3.1. Maximal Values of V ˙ O2 and Heart Rate in the Test UM-TT

Table 2 gives the individual values of V ˙ O2max, maximal heart rate and v V ˙ O2max as well as the energy cost of running below the Respiratory Compensatory Point. We can see that the two groups of marathon performance did not have significant differences in these maximal values and in Cr and in their speed at the RCP (in %v V ˙ O2max).

3.2. VO2 and Heart Rate in the Marathon Race

Before examining the marathon data, we must underline that all subjects finished the marathon and that three of them even achieved their personal best (PB) times (Table 1 and Table 2 for comparisons of the PB). The average blood lactate value before that start of the marathon warm-up (1.8 ± 0.8 mM) was significantly lower than the one after the warm-up (2.8 ± 0.7 mM) (p < 0.05) (Table 3).
The slower marathoners (SM) completed their first marathon in more than 4 h (4 h 29–5 h 11 min), while the fastest marathoners (FM) ran it in less than 4 h (2 h 50 min–3 h 45 min). On average, the SM ran at a significantly lower fraction of v V ˙ O2max than the FM group (53.2 ± 3.7 vs. 73.2 ± 5.2 %v V ˙ O2max, t = 7.0, p < 0.0001) (Figure 1 shows the average value and the one every 5 km). The marathon speed decreased significantly in all the subjects (72 to 59% of v V ˙ O2max, p < 0.0001) but more in the SM group (65 ± 6 to 46 ± 5 %v V ˙ O2max vs. 78 ± 6 to 71 ± 5 vs. for the FM group, p < 0.0001) (Figure 1). For the slower group, the speed was stable until the 15th km and then decreased (p = 0.016 between the 15th and the 20th km) while for the fastest group, the speed was stable until the 25th km (p = 0.016 between the 25th and the 30th km (Figure 1). The 15th km was reached in the 89th min and the 25th km was reached in the 116th min for the slowest and fastest group, respectively.
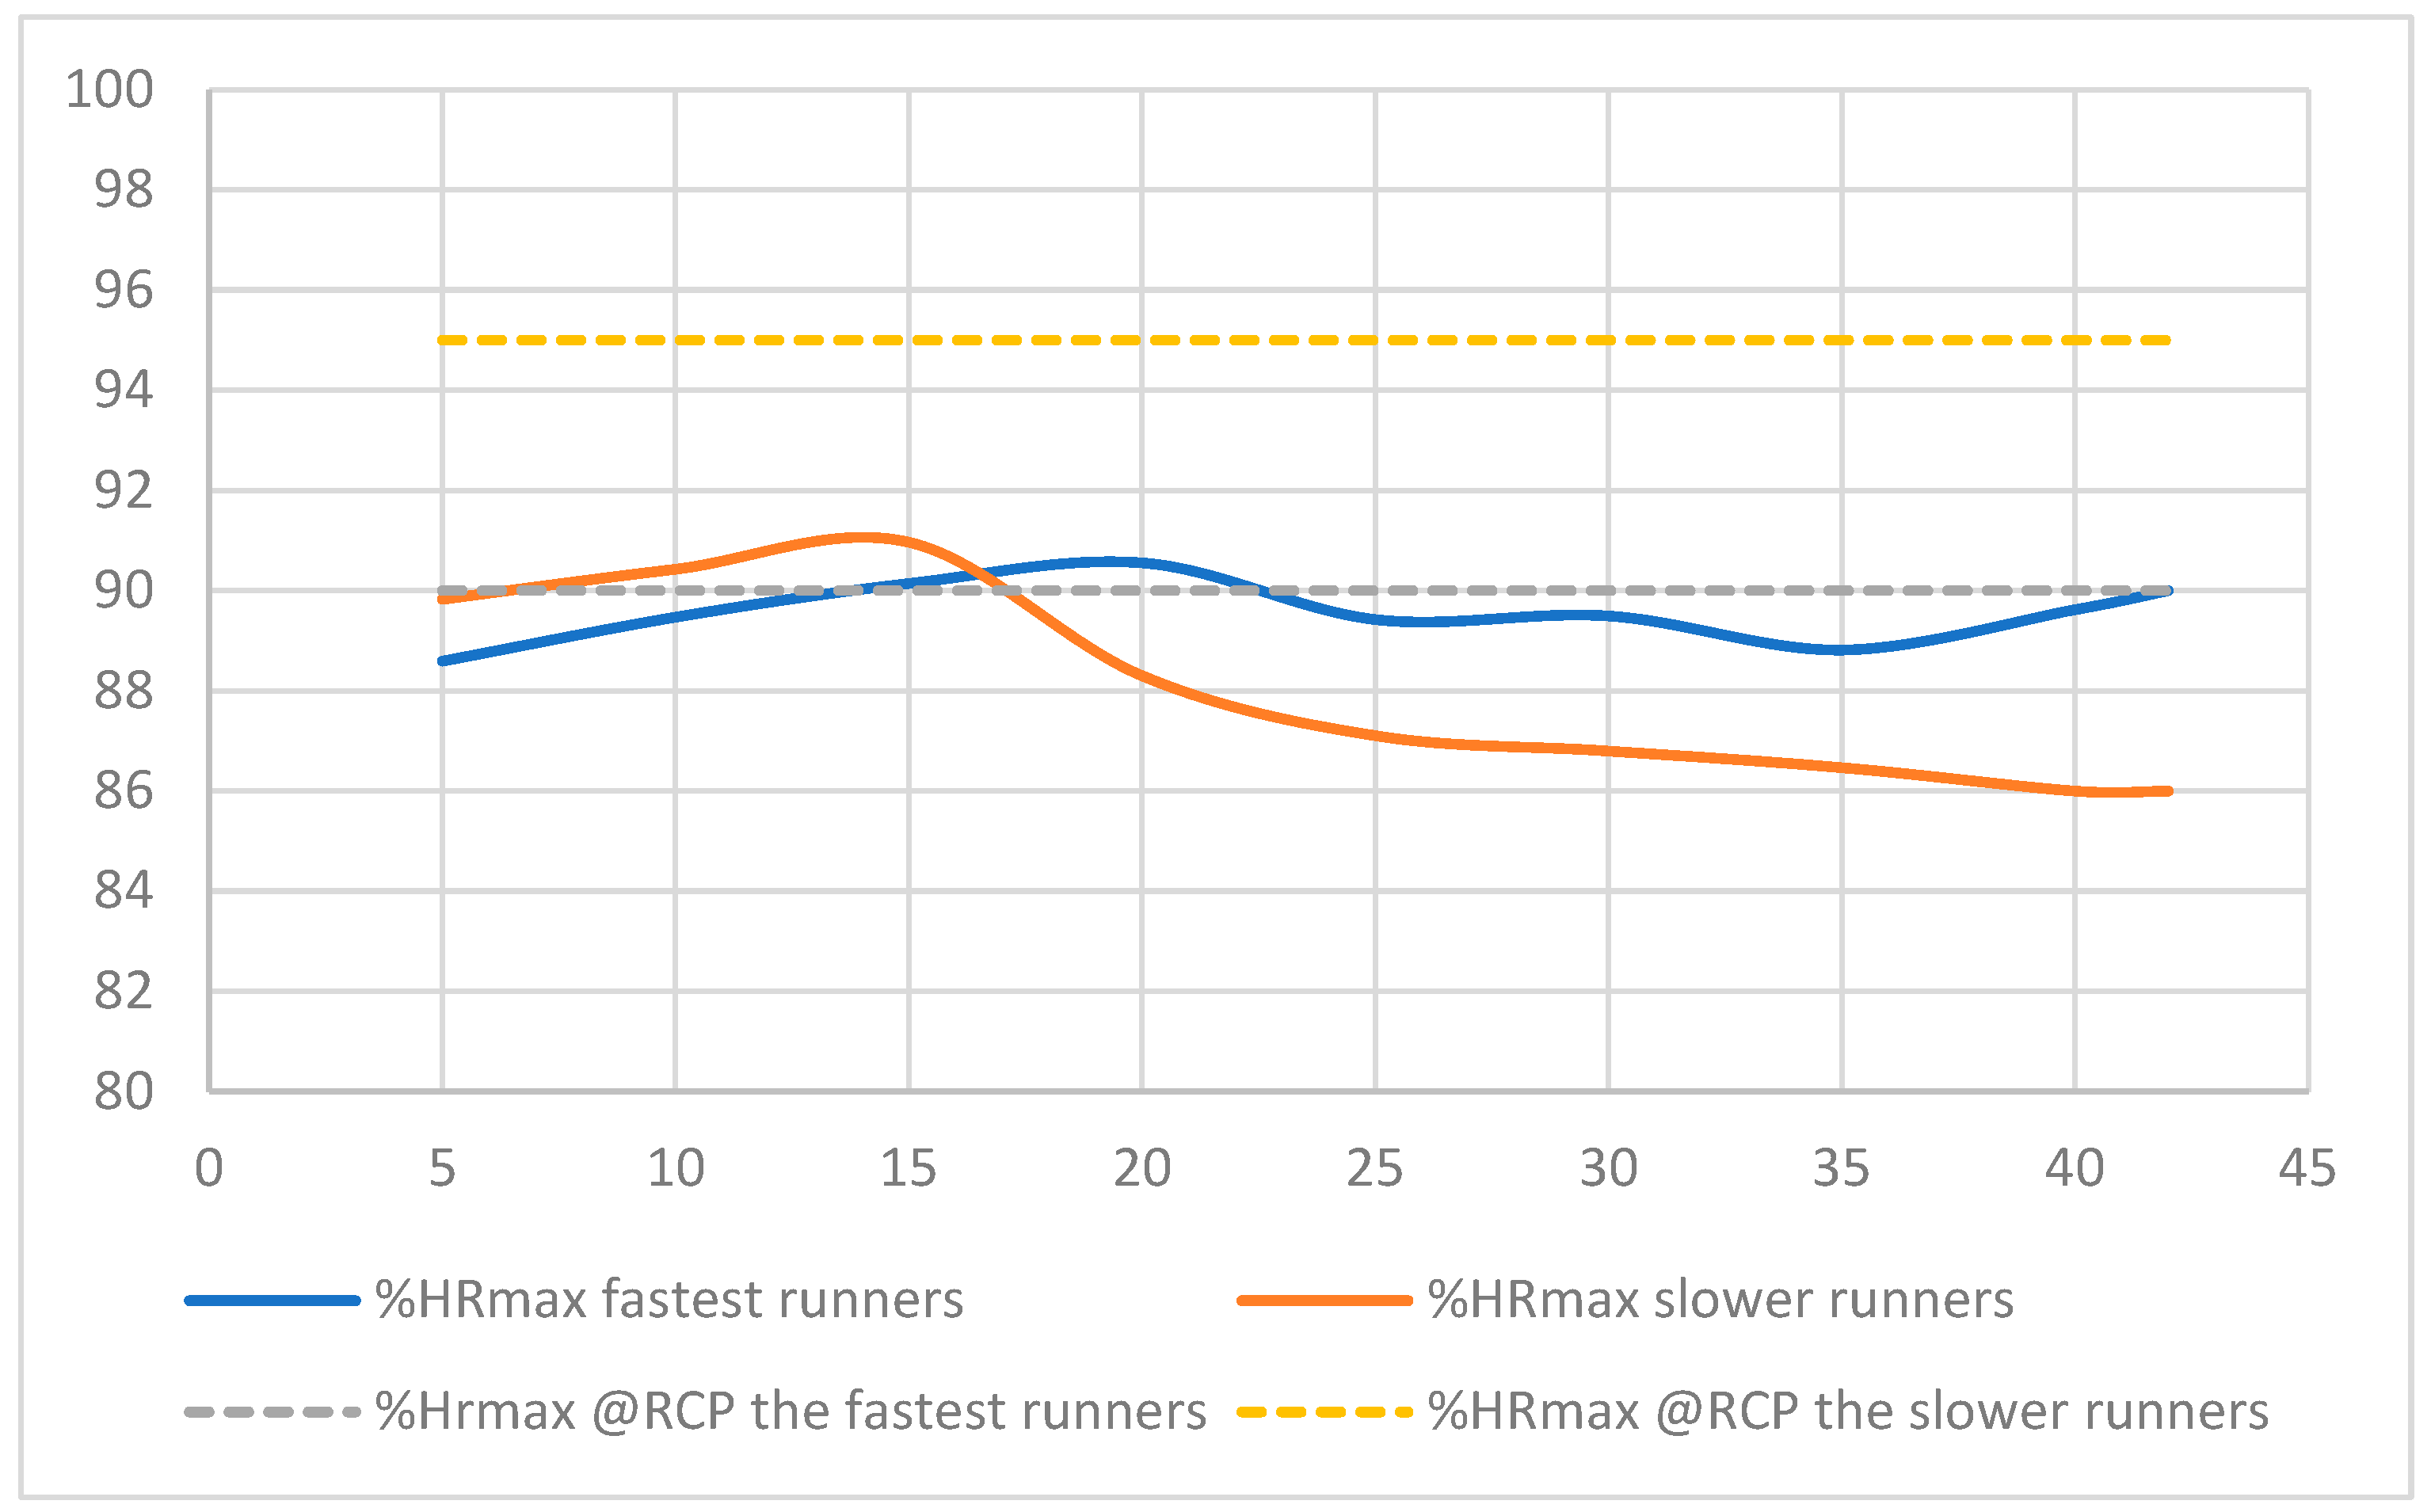
Independent of the groups, the %HRmax during the marathon was not significantly different from the %HRmax at RCP (89.0 ± 4.4 vs. 93.1 ± 6.6%), and it overlapped in three of the subjects of the FM group (Table 3; Figure 2) [34]. However, in contrast to HR, the average marathon V ˙ O2 was significantly lower than the V ˙ O2 at the anaerobic threshold (77.3 ±3.6 vs. 84.8 ± 5.1 % V ˙ O2max, p = 0.001). This relatively high value of %HRmax remained stable after the 5th km, remaining between 88 and 91% of the maximal value (p = 0.27) (Figure 2), while the % V ˙ O2max decreased from 81 ± 5 to 74 ± 5% (p < 0.001) (Figure 3).
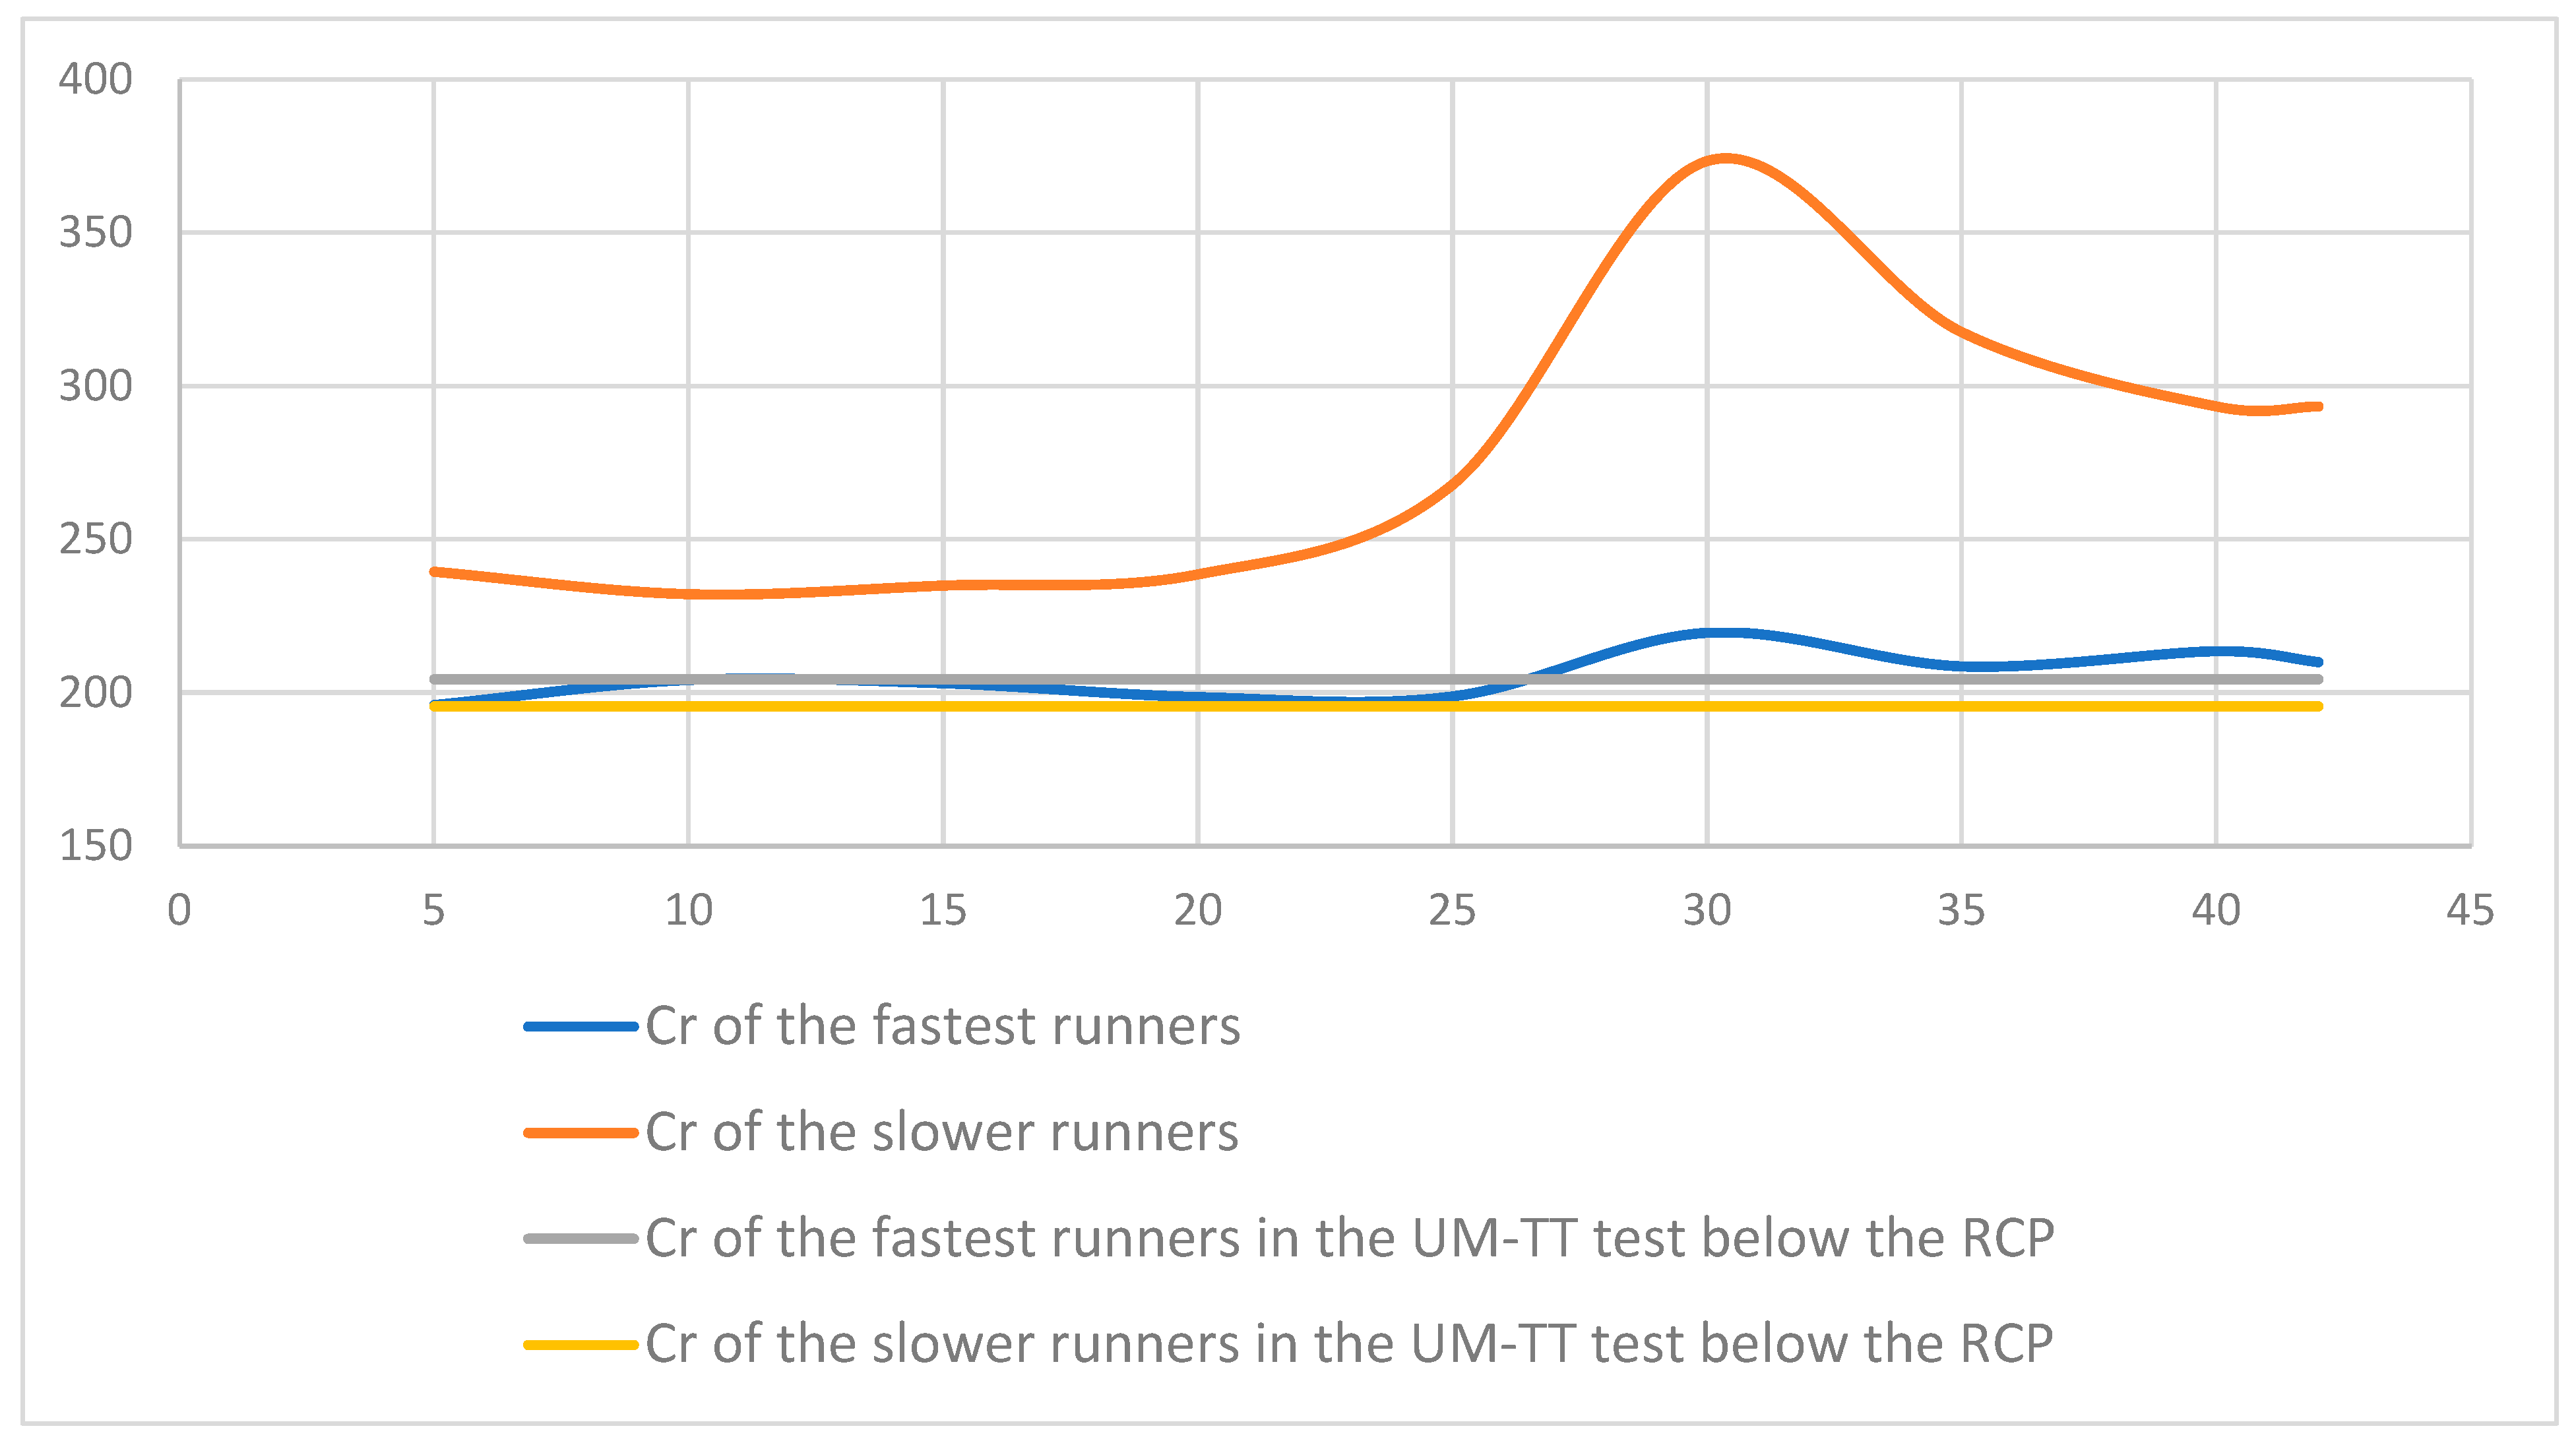
The energy cost of running in the slower runners during the marathon increased almost significantly at the 30th km (p = 0.06) (Figure 4) because some of them started to walk.

4. Discussion

Heart rate monitors are utilized primarily to determine the exercise intensity of a training session or race [34]. Compared to other indications of exercise intensity, HR is simple to monitor, is relatively inexpensive, and is used in many situations. However, our results show that HR monitors cannot be used for estimating the energy expenditure or the exercise intensity relative to % V ˙ O2max or v V ˙ O2max during an actual marathon. Indeed, our study showed a dissociation between the fractional use of HRmax and V ˙ O2max or v V ˙ O2max. Therefore, HR does not allow runners to pace themselves according to a target % V ˙ O2max or even v V ˙ O2max pacing indicator for runners. In our study, the HR remained at a steady state and at a high percentage of HRmax (%HRmax), which was not significantly different from the anaerobic threshold.
Furthermore, the average speed remained far below the speed at the RCP. A prior study [30] measured the cardiorespiratory response for one hour while running at a marathon pace on a treadmill (3 h 40 min 33 min), and it showed that regardless of the marathon finishing time, the runners maintained a marathon pace near the first ventilatory threshold (76.2 ± 6.1% of V ˙ O2max), which is well below our second ventilatory threshold value (84.1 ± 5.1 % V ˙ O2max) [35].
Our results reveal a dissociation between the % V ˙ O2max and the %HRmax due to a speed decrease while the %HR remained stable. This speed decrease was in accordance with our prior study measuring the cardiac output (but not V ˙ O2 at that time) during the marathon [22]. Similarly, to our prior study on recreational marathoners [22], we found that HR was 88% HRmax vs. 87.0 ± 1.6% in the 2011s study. However, this high value of %HRmax does not mean that runner also elicits a high fraction of his stroke volume as reported on our prior study having focused on the cardiac output during the marathon. Indeed, we showed in that cardiac study on the marathon that while the heart rate reached 87.0 ± 1.6% of HRmax, the % of SVmax, and maximal cardiac output (CO) which stayed at only 77.2 ± 2.6%, and 68.7 ± 2.8% of their maximal values, respectively [22].
Therefore, according to the present findings and past data, there is clearly a dissociation between the percentage of maximal heart rate and the one of V ˙ O2max. However, given that the HR stabilized while the speed decreased, there is an increase in cardiac cost (bt·m−1) in accordance with prior marathon race analyses [25].
The ability of runners to sustain the highest fraction of maximal oxygen uptake ( V ˙ O2max) for long periods has been emphasized as a factor in marathon performance. Indeed, literature accentuates the importance developing high RCP as an % V ˙ O2max so that runners can maintain higher speeds during running without experiencing anaerobic caused fatigue and performance decreases. However, on the marathon, by precocious it is generally recommended that marathon runners stay below the anaerobic threshold (as estimated in this study by the RCP according to the method of Beaver et al. [32]). Our goal was to primarily focus on the ratio between %HRmax and % V ˙ O2max during a marathon race. To our knowledge, this has never been reported in the literature and only approximated from laboratory treadmill tests [36] or out on the road [22]. Here we show that it was not possible to estimate with HR a metabolic zone during the marathon race and, more precisely, to associate a given %HRmax with a % V ˙ O2max since their ratios increased. Furthermore, this was more pronounced for the ratio between %HRmax/v V ˙ O2max.
Previous reports of the physiological HR- V ˙ O2 relationship and race pace characteristics of recreational marathoners were based on treadmill tests using a classical, and unrealistically strict incremental paced protocol [6]. The HR- V ˙ O2 relationship is always considered to be linear and constant, which is used to estimate energy expenditure during running conditions [37]. There appears to be consensus in the literature that this method provides a satisfactory estimate of energy expenditure at a group level but is not accurate for individual estimations [38,39]. These studies reported the fractional use of V ˙ O2max, HRmax, using the paradigm of running a marathon at a constant average pace. Significant in our study, we showed that the HR- V ˙ O2 relationship does not hold up in actual racing conditions.
Coaches and physiologists continue to define a constant marathon pace as ideal in real-world conditions. However, this paradigm has recently been challenged [25]. A computational study has demonstrated that it was possible to predict the distance at which runners will exhaust their glycogen stores as a function of running intensity [17]. They integrated several physiological variables including the muscle mass distribution, liver, and muscle glycogen densities, and running speed as a fraction of aerobic capacity, i.e., the % of V ˙ O2max [17]. Indeed, the measurement of % V ˙ O2max in actual conditions could improve these predictions. Any increase in Cr would inevitably lead to a decrease in v. Schena et al. [26] showed the effect of a prolonged running trial on the energy cost of running (Cr) in men and women during a 60 km ultramarathon simulation that consisted of three consecutive 20 km laps at a 100 km competition pace. The net increase in serum creatine phosphokinase was linearly related to the percentage increase in Cr observed during the trial. They concluded that, despite increased S-CPK, the running effort was not able to elicit any peripheral or central fatigue or biomechanical adaptation leading to any modification of Cr. They showed that, Cr did not significantly increase after a 60 km trial run at a pace corresponding to best individual performance in the 100 km competition. Therefore, they concluded that human locomotion is a highly stereotyped motor task, and redundant safety factors may operate to preserve a more economical pattern, even in the presence of significant perturbations of a different source. However, in our study, we showed that, once the slowest runner starts to walk at the 30th km, the Cr increased. Indeed, the walk, that is habitually more economical that running [40], is more expensive with fatigue [41]. However, Cr was restored when the runner started to run again at the 35th km mark.
The practical application here is that the degree of metabolic effort varies considerably between individual athletes who run at similar percentages of V ˙ O2max. In addition, with higher percentages of a given V ˙ O2max, more variability exists between athletes. Learning how to pace oneself by feeling or sensation, which is RPE, combined with running experience may be more advantageous and realistic [21,42]. Variable-paced running has also been demonstrated to be optimal in 280 sub-elite (2 h 30 min–3 h 40 min) marathoners [25]. Indeed, a marathon was recently run in less than 2 h by a man who ran the three fastest marathons ever recorded in a span of three years—Eliud Kipchoge—in the Tokyo Olympic games. We have demonstrated in a prior paper [43] that the best marathons were run according to a pace distribution that is statistically not constant and with negative asymmetry. The utilization of extreme values and oscillations allows for recovery and optimization of the complementary aerobic and anaerobic metabolisms. This suggest new ways to approach the pacing for optimizing endurance performance, and it has recently shown that speed variation can be controlled to maintain a certain RPE in recreational marathoners [12]. Our study showed that it is not accurate to use heart rates to access the aerobic zones for marathon pace, particularly for the slower recreational marathoners. It is essential to highlight that 4 of the 5 runners in the slower group ran their first marathon, in addition to wearing the K4 portable gas-exchange device. Moreover, 3 of 5 runners in the faster marathon group ran their personal best, and all 10 said they were comfortable wearing the K4 device.
Therefore, the goal of self-pacing and staying in a specific zone using HR may be impossible. Heart rates during the marathon were not significantly different from those at the ventilatory threshold determined in an incremental test. The recommendations by many authors for self-pacing using speed or heart rate zones cannot be used for pacing during a competitive event [44,45,46]. We recommend using RPE during the marathon [12], which is clearly a self-paced exercise for which the constant load or speed model cannot be applied [44]. We recommend that the marathoners must maintain their effort at a certain RPE (13–14 on the Borg Scale).

5. Conclusions

The most fruitful discoveries are usually made through laboratory and field-based research [47]. By studying recreational runners in an actual marathon race, we discovered that metabolic zones could not be estimated using the heart rate during the marathon. During the marathon, there is a clear dissociation between the observed increase in heart rate and the metabolic responses as V ˙ O2 decreases following the decrease in speed. Consequently, the heart rate is unreliable for estimating the metabolic zone (% V ˙ O2max) during the marathon. Pacing using heart rate zones during the marathon cannot be recommended, particularly in slower recreational marathoners. These results suggest that the fraction of HRmax during the marathon is not stable and increasingly dissociates from F V ˙ O2max. We showed that marathon performance over a period between 3 and 5 h did not depend on the factors of performance measured in an incremental test. Rather, it depended more on the running pace early in the first 5th km of the race [12,43]. Big data has shown the consistency of pacing profiles according to performance level. However, it cannot help the individual with race planning, as suggested by the classification of the big data process [20]. The marathon is a special event and open to everyone. It is long and intense and fascinates scientists because the outcome is unpredictable, even for experienced runners. The factors besides exercise intensity which affect exercising heart rates and confound users of HR monitors are the temperature increase during the race (that was not the case since the temperature on that day was maintained between 10 °C at 9 a.m. and 13 °C at 14 h a.m. as recorded in the method section). Furthermore, prior study has shown that the difference between Garmin® and electrocardiography HR values showed that the Garmin Forerunner (we used here) can be used at rest, as well as with walking and running activities of light, moderate, and vigorous intensities such as the marathon race [48].
Pacing during a marathon according to heart rate zones is not recommended. Rather, learning about the relationship between running sensations during training and racing using RPE is optimal.

6. Limits of this Study

The limitation of the present study is that we have a small group of runners, but with homogeneous factor of marathon performance according to their V ˙ O2max, Cr and RCP in the incremental UM-TT test. However, three of them did not have the marathon experience since it was their first. Furthermore, we neither control the ingesta nor the glycemia in the race and the fact that the slower runners walk at the 30th km could be due to a refueling error during the race. However, it has been demonstrated that the different responses of RPE are explained by the difference in glycogen concentration in muscle, because glucose infusion had no effect on RPE when muscle glycogen content was presumed to be at a normal level and was effective when glycogen in the exercising muscles was presumed to be depleted [49].

Author Contributions

Conceptualization, V.B. and M.M.; V.B. and L.P., software, Addinsoft; validation, F.P., L.P. and V.B.; formal analysis, J.E.; investigation, V.B.; resources, V.B.; data curation, L.P.; writing—original draft preparation, V.B.; writing—review and editing, J.E.; visualization, F.P.; supervision, V.B.; project administration, V.B.; funding acquisition, V.B. All authors have read and agreed to the published version of the manuscript.

Funding

This research received no external funding.

Institutional Review Board Statement

The study was conducted according to the guidelines of the Declaration of Helsinki, and approved by the Institutional Review Board of CPP Sud-Est V, Grenoble, France (protocol code: 2018-A01496-49 and date of approval: 2018).

Informed Consent Statement

Not applicable.

Data Availability Statement

The data presented in this study are avaible on request from the corresponding author. The data are not publicly avaible due to privacy.

Conflicts of Interest

The authors declare no conflict of interest.

References

  1. Costill, D.L.; Fox, E.L. Energetics of marathon running. Med. Sci. Sports 1969, 1, 81–86. [Google Scholar] [CrossRef]
  2. Maron, M.B.; Horvath, S.M. The Marathon: A History and Review of the Literature. Med. Sci. Sports 1978, 10, 137–150. [Google Scholar] [PubMed]
  3. Vitti, A.; Nikolaidis, P.T.; Villiger, E.; Onywera, V.; Knechtle, B. The “New York City Marathon”: Participation and performance trends of 1.2M runners during half-century. Res. Sports Med. 2020, 28, 121–137. [Google Scholar] [CrossRef] [PubMed]
  4. Breen, D.; Norris, M.; Healy, R.; Anderson, R. Marathon Pace Control in Masters Athletes. Int. J. Sports Physiol. Perform. 2018, 13, 332–338. [Google Scholar] [CrossRef]
  5. Gordon, D.; Wightman, S.; Basevitch, I.; Johnstone, J.; Espejo-Sanchez, C.; Beckford, C.; Boal, M.; Scruton, A.; Ferrandino, M.; Merzbach, V. Physiological and training characteristics of recreational marathon runners. Open Access J. Sports Med. 2017, 8, 231–241. [Google Scholar]
  6. Myrkos, A.; Smilios, I.; Kokkinou, E.M.; Rousopoulos, E.; Douda, H. Physiological and Race Pace Characteristics of Medium and Low-Level Athens Marathon Runners. Sports 2020, 9, 116. [Google Scholar]
  7. Ashley, M. Everything You Need to Know About the 10 Most Popular Marathon Training Plans. Available online: https://www.shape.com/fitness/training-plans/marathon-training-for-beginners (accessed on 15 April 2022).
  8. Smyth, B. Fast Starters and Slow Finishers: A Large-Scale Data Analysis of Pacing at the Beginning and End of the Marathon for Recreational Runners. J. Sports Anal. 2018, 4, 229–242. [Google Scholar] [CrossRef]
  9. Buman, M.P.; Brewer, B.W.; Cornelius, A.E.; Van Raalte, J.L.; Petitpas, A.J. Hitting the wall in the marathon: Phenomenological characteristics and associations with expectancy, gender, and running history. Psychol. Sport Exerc. 2008, 9, 177–190. [Google Scholar]
  10. Maron, M.; Horvath, S.M.; Wilkerson, J.E.; Gliner, J.A. Oxygen Uptake Measurements During Competitive Marathon Running. J. Appl. Physiol. 1976, 40, 836–838. [Google Scholar] [CrossRef]
  11. Molinari, C.A.; Edwards, J.; Billat, V. Maximal Time Spent at VO2max from Sprint to the Marathon. Int. J. Environ. Res. Public Health 2020, 17, 9250. [Google Scholar] [CrossRef]
  12. Billat, V.; Poinsard, L.; Palacin, F.; Pycke, R.J.; Maron, M. Oxygen Uptake Measurements and Rate of Perceived Exertion During a Marathon. Int. J. Environ. Res. Public Health 2022, 19, 5760. [Google Scholar] [CrossRef] [PubMed]
  13. Sjödin, B.; Svedenhag, J. Applied Physiology of Marathon Running. Sports Med. 1985, 2, 83–99. [Google Scholar] [CrossRef] [PubMed]
  14. Coyle, E.F. Physiological Regulation of Marathon Performance. Sports Med. 2007, 37, 306–311. [Google Scholar] [CrossRef] [PubMed]
  15. Hagan, R.D.; Upton, S.J.; Duncan, J.J.; Gettman, L.R. Marathon performance in relation to maximal aerobic power and training indices in female distance runners. Br. J. Sports Med. 1987, 21, 3–7. [Google Scholar] [CrossRef] [PubMed]
  16. di Prampero, P.E.; Atchou, G.; Brückner, J.C.; Moia, C. The energetics of endurance running. Eur. J. Appl. Physiol. Occup. Physiol. 1986, 55, 259–266. [Google Scholar] [CrossRef] [PubMed]
  17. Rapoport, B.I. Metabolic factors limiting performance in marathon runners. PLoS Comput. Biol. 2010, 6, e1000960. [Google Scholar] [CrossRef]
  18. Norman, B.; Sollevi, A.; Jansson, E. Increased IMP content in glycogen-depleted muscle fibres during submaximal exercise in man. Acta Physiol. Scand. 1988, 133, 97–100. [Google Scholar] [CrossRef]
  19. Sahlin, K.; Tonkonogi, M.; Söderlund, K. Energy supply and muscle fatigue in humans. Acta Physiol. Scand. 1997, 162, 261–266. [Google Scholar] [CrossRef]
  20. Oficial-Casado, F.; Uriel, J.; Jimenez-Perez, I.; Goethel, M.F.; Pérez-Soriano, P.; Priego-Quesada, J.I. Consistency of pacing profile according to performance level in three different editions of the Chicago, London, and Tokyo marathons. Sci. Rep. 2022, 12, 10780. [Google Scholar] [CrossRef]
  21. Micklewright, D.; Papadopoulou, E.; Swart, J.; Noakes, T. Previous experience influences pacing during 20 km time trial cycling. Br. J. Sports Med. 2010, 44, 952–960. [Google Scholar] [CrossRef]
  22. Billat, V.; Petot, H.; Landrain, M.; Meilland, R.; Koralsztein, J.P.; Hamard, L. Cardiac Output and Performance during a Marathon Race in Middle-Aged Recreational Runners. Sci. World J. 2012, 2012, 810859. [Google Scholar] [CrossRef] [PubMed]
  23. Rogers, B.; Giles, D.; Draper, N.; Hoos, O.; Gronwald, T. A new detection method defining the aerobic threshold for endurance exercise and training prescription based on fractal correlation properties of heart rate variability. Front. Physiol. 2021, 11, 596567. [Google Scholar] [CrossRef] [PubMed]
  24. Coyle, E.F.; González-Alonso, J. Cardiovascular Drift During Prolonged Exercise: New Perspectives. Exerc. Sport Sci. Rev. 2001, 29, 88–92. [Google Scholar] [PubMed]
  25. Billat, V.L.; Palacin, F.; Correa, M.; Pycke, J.R. Pacing Strategy Affects the Sub-Elite Marathoner’s Cardiac Drift and Performance. Front. Psychol. 2020, 10, 3026. [Google Scholar] [CrossRef] [PubMed]
  26. Schena, F.; Pellegrini, B.; Tarperi, C.; Calabria, E.; Salvagno, G.L.; Capelli, C. Running Economy During a Simulated 60-km Trial. Int. J. Sports Physiol. Perform. 2014, 9, 604–609. [Google Scholar] [CrossRef]
  27. David, L.; Costill, D.L. A Comparison of Two Middle-Aged Ultramarathon Runners, Research Quarterly. Am. Assoc. Health Phys. Educ. Recreat. 1970, 41, 135–139. [Google Scholar]
  28. Jones, A.M.; Kirby, B.S.; Clark, I.E.; Rice, H.M.; Fulkerson, E.; Wylie, L.J.; Wilkerson, D.P.; Vanhatalo, A.; Wilkins, B.W. Physiological demands of running at 2-hour marathon race pace. J. Appl. Physiol. 2021, 130, 369–379. [Google Scholar] [CrossRef]
  29. Joyner, M.J.; Hunter, S.K.; Lucia, A.; Jones, A.M. Physiology and fast marathons. J. Appl. Physiol. 2020, 128, 1065–1068. [Google Scholar] [CrossRef]
  30. Ahmaidi, S.; Collomp, K.; Caillaud, C.; Prefaut, C. Maximal and Functional Aerobic Capacity as Assessed by Two Graduated Field Methods in Comparison to Laboratory Exercise Testing in Moderately Trained Subject. Int. J. Sports Med. 1992, 13, 243–248. [Google Scholar] [CrossRef]
  31. Léger, L.; Boucher, R. An indirect continuous running multistage field test: The Université de Montréal track test. Can. J. Appl. Sport Sci. 1980, 5, 77–84. [Google Scholar]
  32. Beaver, W.L.; Wasserman, K.; Whipp, B.J. A new method for detecting anaerobic threshold by gas exchange. J. Appl. Physiol. 1986, 60, 2020–2027. [Google Scholar] [CrossRef] [PubMed]
  33. Kraft, G.L.; Roberts, R.A. Validation of the garmin forerunner 920XT fitness watch VO2peak test. Ijier 2017, 5, 63–69. [Google Scholar] [CrossRef]
  34. Karvonen, J.; Vuorimaa, T. Heart rate and exercise intensity during sports activities. Practical application. Sports Med. 1988, 5, 303–311. [Google Scholar] [CrossRef] [PubMed]
  35. Loftin, M.; Sothern, M.; Koss, C.; Tuuri, G.; Vanvrancken, C.; Kontos, A.; Bonis, M. Energy expenditure and influence of physiologic factors during marathon running. J. Strength Cond. Res. 2007, 21, 1188–1191. [Google Scholar] [PubMed]
  36. Costill, D.L.; Thomason, H.; Roberts, E. Fractional utilization of the aerobic capacity during distance running. Med. Sci. Sports 1973, 5, 248–252. [Google Scholar] [CrossRef]
  37. Achten, J.; Jeukendrup, A.E. Heart rate monitoring: Applications and limitations. Sports Med. 2003, 33, 517–538. [Google Scholar] [CrossRef]
  38. Lounana, J.; Campion, F.; Noakes, T.D.; Medelli, J. Relationship between %HRmax, %HR reserve, %VO2max, and %VO2 reserve in elite cyclists. Med. Sci. Sports Exerc. 2007, 39, 350–357. [Google Scholar] [CrossRef]
  39. Mann, T.; Lamberts, R.P.; Lambert, M.I. Methods of prescribing relative exercise intensity: Physiological and practical considerations. Sports Med. 2013, 43, 613–625. [Google Scholar] [CrossRef]
  40. Hall, C.; Figueroa, A.; Fernhall, B.; Kanaley, J.A. Energy expenditure of walking and running comparison with prediction equations. Med. Sci. Sports Exerc. 2004, 36, 2128–2134. [Google Scholar] [CrossRef]
  41. Minetti, A.E.; Ardigò, L.P.; Saibene, F. The transition between walking and running in humans: Metabolic and mechanical aspects at different gradients. Acta Physiol. Scand. 1994, 150, 315–323. [Google Scholar] [CrossRef]
  42. Scharhag-Rosenberger, F.; Meyer, T.; Gässler, N.; Faude, O.; Kindermann, W. Exercise at given percentages of VO2max: Heterogeneous metabolic responses between individuals. J. Sci. Med. Sports 2010, 13, 74–79. [Google Scholar] [CrossRef] [PubMed]
  43. Pycke, J.R.; Billat, V. Marathon Performance Depends on Pacing Oscillations between Non Symmetric Extreme Values. Int. J. Environ. Res. Public Health 2022, 19, 2463. [Google Scholar] [CrossRef] [PubMed]
  44. Marino, F. The limitations of the constant load and self-paced exercise models of exercise physiology. Comp. Exerc. Physiol. 2012, 8, 3–9. [Google Scholar] [CrossRef]
  45. de Koning, J.; Foster, C.; Bakkum, A.; Kloppenburg, S.; Thiel, C.; Joseph, T.; Cohen, J.; Porcari, J. Regulation of Pacing Strategy during Athletic Competition. PLoS ONE 2011, 6, e15863. [Google Scholar] [CrossRef]
  46. Binkley, S.; Foster, C.; Cortis, C.; de Koning, J.J.; Dodge, C.; Doberstein, S.T.; Fusco, A.; Jaime, S.J.; Porcari, J.P. Summated Hazard Score as a Powerful Predictor of Fatigue in Relation to Pacing Strategy. Int. J. Environ. Res. Public Health 2021, 18, 1984. [Google Scholar] [CrossRef] [PubMed]
  47. Aziz, H.A. Comparison between field research and controlled laboratory research. Arch. Clin. Biomed. Res. 2017, 1, 101–104. [Google Scholar] [CrossRef]
  48. De Oliveira Damasceno, V.; Costa, A.D.S.; Campello, M.C.A.; Souza, D.E.; Gonçalves, R.; Campos, E.Z.; Santos, T.M. Criterion validity and accuracy of a heart rate monitor. Hum. Mov. 2022, 23, 60–68. [Google Scholar]
  49. Tabata, I.; Kawakami, A. Effects of blood glucose concentration on ratings of perceived exertion during prolonged low-intensity physical exercise. JPN J. Physiol. 1991, 41, 203–215. [Google Scholar] [CrossRef]
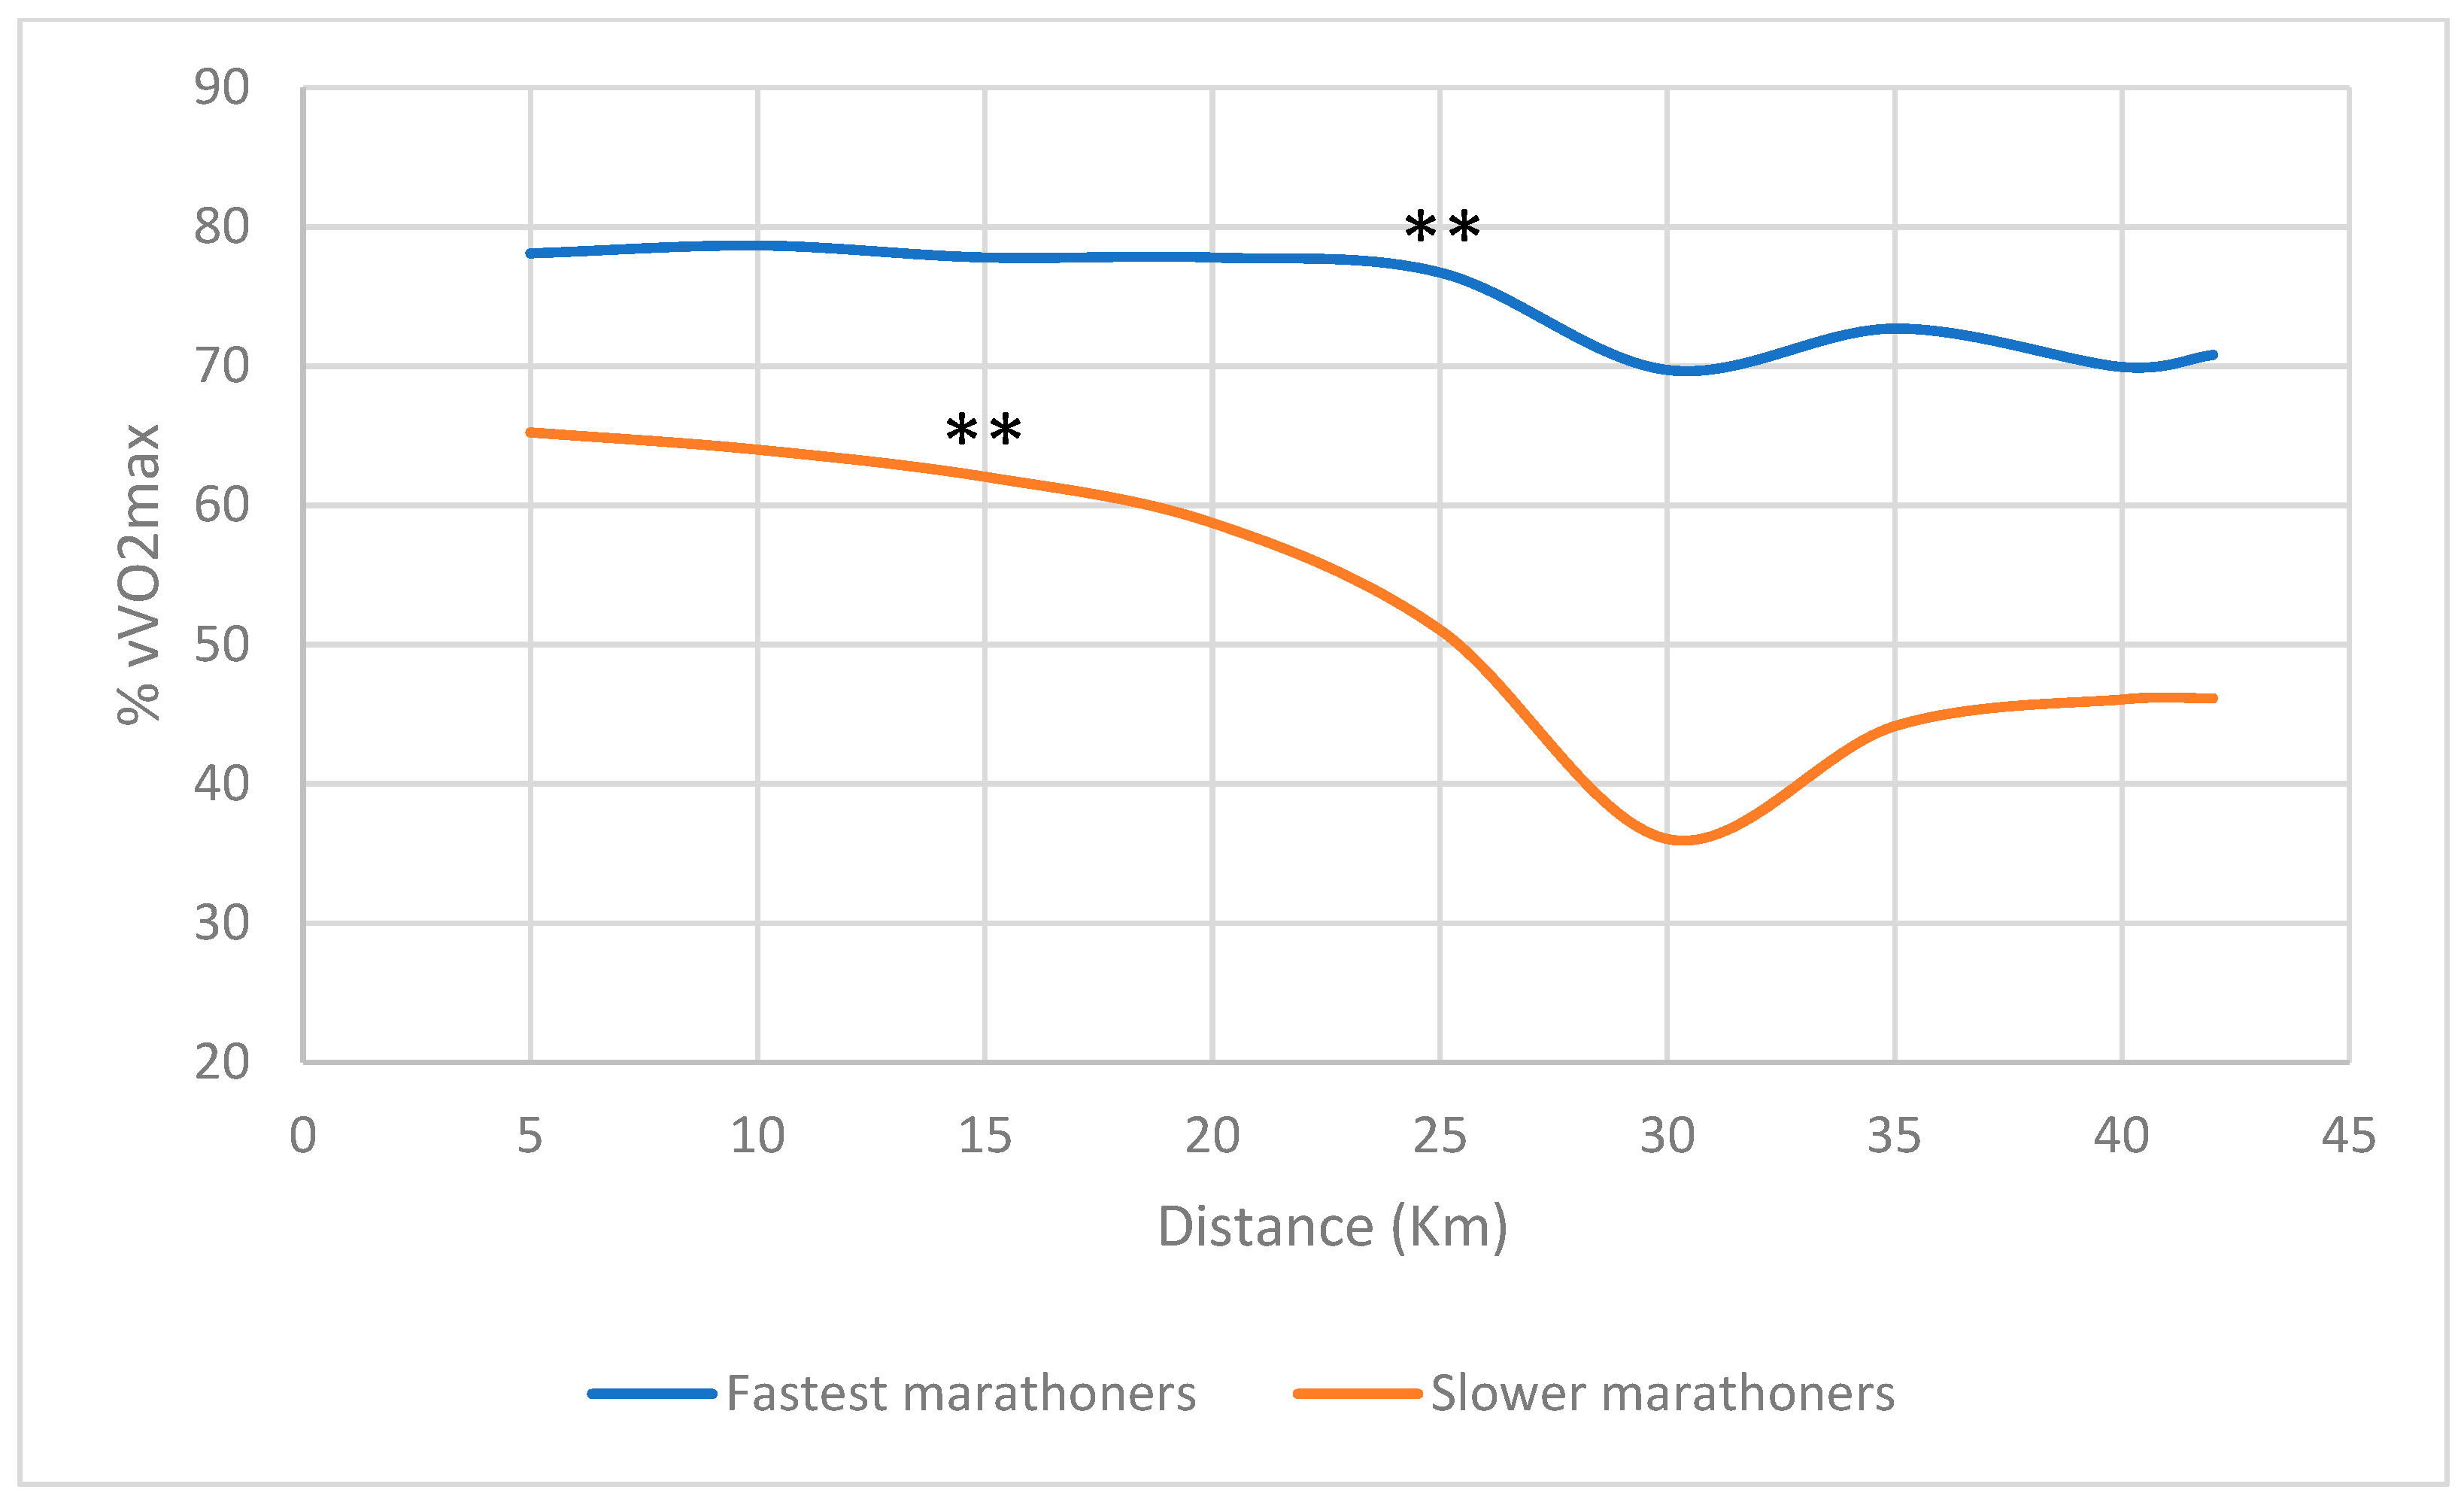
Figure 1. Averages speeds during the marathon of the faster and slower marathoners’ groups expressed in % of v V ˙ O2max. For the slower group, the speed was stable until the 15th km and then decreased significantly in between, while for the fastest group, the speed decreased significantly at the 25th km. ** p < 0.02).
Ijerph 19 12451 g001
Figure 2. Averages % of HRmax during the marathon of the faster and slower marathoners’ groups expressed in % of HRmax. The % of HRmax at the Respiratory Compensatory Point (RCP) was indicated as a reference for each group.
Ijerph 19 12451 g002
Figure 3. Averages % of V ˙ O2max during the marathon of the faster and slower marathoners’ groups expressed in % of V ˙ O2max. The % of V ˙ O2max at the Respiratory Compensatory Point (RCP) was indicated as a reference for each group.
Ijerph 19 12451 g003
Figure 4. The energy cost of running (Cr) during the marathon of the fastest and slower marathoners’ groups expressed in mL·kg−1·km−1. The energy cost of running during the below the Respiratory Compensatory Point (RCP) measured in the UM-TT was indicated as a reference for each group.
Ijerph 19 12451 g004
Table 1. Anthropometric characteristics of the subjects and their personal best in the marathon.
SubjectsLevelAge (years)Weight (kg)Height (cm)BMI
1High477117523.1
2High448218324.5
3High337117722.7
4High346818120.8
5High377419319.9
6Low507117024.6
7Low376617322.1
8Low337718023.8
9Low537518621.7
10Low497718722.0
Mean 41.773.2180.522.5
SD 7.74.87.01.5
Table 2. The maximal oxygen uptake ( V ˙ O2max in mL·kg−1·min−1); the speed associated with VO2max (v V ˙ O2max (km·h−1)); the maximal heart rate HRmax (bpm) measured in the UM-TT test.
Levelv V ˙ O2max
(km·h−1)
HRmax
(bpm)
V ˙ O2max
(mL·kg−1·min−1)
v@RCP%v V ˙ O2maxCR (mL·kg−1·km−1) %v@RCP
High15.91765396%214
High16.51795292%204
High16.81745786%203
High18.51696387%212
High17.01704891%189
Low16.51834992%180
Low16.51785381%191
Low16.01885291%217
Low16.01754594%187
Low16.01845383%203
Mean High
Level
16.91745590%204
SD Group 11.0464%10
Mean Level Low16.21825089%196
SD Level
Low
0.3546%15
p value0.20.060.220.8400.333
Mean All the runners16.61785289%200
SD All the runners0.8655%13
Table 3. The marathon time, speeds, oxygen uptake ( V ˙ O2max in mL·kg−1·min−1); the speed associated with V ˙ O2max (v V ˙ O2max (km·h−1)) and heart rate in % of the HRmax (bpm) measured in the UM-TT test. Vmarathon is the average speed on the marathon; Vmarathon % v V ˙ O2max is the Vmarathon expressed in % of v V ˙ O2max; HRmarathon is the average heart rate on the marathon; HRmarathon %HRmax is the heart rate in % of HRmax.
Level Marathon
Times (s)
Vmarathon (km·h−1) Vmarathon %v V ˙ O2max HRmarathon
(bpm)
HRmarathon
%HRmax
HRmarathon %HR RCP Vmarathon
%v V ˙ O2max
V ˙ O2 Marathon
% V ˙ O2max
High1269412.075%16996%105%75%83%
High1289711.871%16290%98%71%77%
High1216012.574%16092%110%74%78%
High1020014.980%14888%104%80%80%
High1344911.366%13982%84%66%77%
Low187008.149%15585%89%49%82%
Low177958.552%16190%92%52%72%
Low161619.459%15985%91%59%74%
Low176508.654%14885%89%54%73%
Low183828.352%17394%99%52%76%
Mean
High Level
1228012.574%15690%100%74%79%
SD Group 112501.45%125%10%5%3%
Mean
Level Low
177378.653%15988%92%53%76%
SD Level Low9790.54%94%4%7%4%
p value0.0080.0080.0080.9990.5480.2220.8410.1000
Mean
All therunners
1500810.563%15789%96%63%77%
SD All the runners30652.312%105%8%12%4%
Publisher’s Note: MDPI stays neutral with regard to jurisdictional claims in published maps and institutional affiliations.