1. Introduction
The massive emission of greenhouse gases has led to an increase in global temperature and an accelerated frequency of extreme hot weather, which has seriously damaged ecological health [
1], and has also affected the productive life of human beings [
2]. The problem of climate warming is no longer just a problem for individual countries, but a problem for all mankind [
3]. The impact of warming caused by carbon emissions is stronger in China, where the average temperature has risen by 0.26 degrees per decade from 1961–2020 in China, which is higher than the global average. China’s environmental problems, such as glacier melting, permafrost degradation and natural disasters, have intensified in recent years. The largest mountain glaciers in the northeast of the Qinghai-Tibet Plateau have dropped 450 m in the last 70 years, and the perennial permafrost in northeast China has degraded significantly, with the southern boundary of permafrost degradation exhibiting phenomena such as northward shift and expansion of the ablation zone. The maximum seasonal freezing depth reduction rate in Heilongjiang Province, China, was about 9.9 cm per decade from 1961–2016. Permafrost degradation can lead to significant impacts on regional ecology, hydrological processes, carbon cycle, and cold zone engineering construction and operation. In addition, extreme and severe weather in China, such as heavy rainfall, floods and mountain fires, seriously affect human activities and endanger human life and health. To address the global climate change issue, the United Nations Intergovernmental Panel on Climate Change (IPCC) stated that measures should be taken to limit the global temperature increase to 1.5 degrees [
4]. In its sixth climate report, the IPCC stated that in order to control global warming, greenhouse gas emissions need to peak in 2025 and be reduced by 43% from 2010 levels by 2030, so deep cuts in emissions are needed across all sectors. In response to global climate change, China has committed to achieve carbon peaking by 2030 and carbon neutrality by 2060 [
5], which means that China needs to ensure sustainable economic and social development and energy security, while developing technologies and implementing policies to quickly and effectively curb carbon emissions and achieve carbon peaking in a short period of time. According to the carbon emission data of the World Bank, China’s carbon emissions increased at an average annual rate of 5.98% from 1996 to 2018 [
6]. As the world’s largest developing country and carbon emitter [
7], the task of achieving carbon peaking and carbon neutrality in China is still very difficult. Currently, the global energy sector produces about 25% of global carbon emissions, and China’s energy use is still dominated by fossil energy sources such as coal, which accounts for nearly 56.8% of the energy mix and produces a high amount of carbon emissions and is highly polluting to the atmosphere [
8]. China has begun to actively pursue low-carbon development, optimize its energy consumption structure, and promote high-quality economic and social development [
9,
10].
2. Literature Review
As a region where human activities are concentrated, China has seen a significant increase in carbon emissions due to the production of various industries in the process of urbanization and industrialization, and the contradiction between economic development and resource consumption and environmental pollution problems has become more and more prominent [
11,
12,
13,
14,
15]. Some provinces in China have air pollution levels that are among the highest in the world [
16], due to rapid economic growth, a large increase in the number of motor vehicles and a large population leading to increasingly serious air pollution [
17,
18]. Therefore, in recent years, China has made great efforts to develop a clean coal power system in terms of energy consumption and introduced several policies to promote the clean and efficient use of coal [
19], but China’s energy sources, such as oil and natural gas, are scarce, and the dependence on coal in various industries remains high [
20]. The current per capita energy consumption of China is relatively low compared with the international level, and there are also imbalances in development between provinces within China. Imbalanced per capita energy consumption levels often lead to imbalanced economic development, and this also means inefficient use of energy, which poses a major challenge to China’s energy security and carbon emission reduction goals [
21,
22]. In order to seek a better path for reducing carbon emissions on the basis of energy security, while ensuring smooth economic operation, scholars have conducted a lot of research on energy and carbon emission related areas [
23,
24,
25].
There are many factors affecting carbon emissions, mainly in economic development, energy use, population structure, urban development, etc. Relevant studies show that China’s carbon emissions have a strong correlation with the level of economic development, and China’s industrial carbon emissions show an inverted U-shaped non-linear relationship with the level of economic development [
26]. Measuring the relationship between economic growth rate and carbon emission from the perspective of economic growth rate, it is found that the development of economic growth rate and carbon emission growth rate is consistent, and has the characteristics of stages [
27]. Carbon emissions are also usually lower than normal at economically backward stages, and the level of urbanization shows an inverted U-shaped correlation with carbon emissions when energy resources are not fully exploited [
28]. Xu et al. (2016) argue that the combined effects of economic output and energy efficiency play an important role in carbon emissions at different stages, while energy structure has a smaller effect on carbon emissions [
29]. Li et al. (2018) found that economic development has a relatively limited effect on carbon emissions, and that energy consumption structure is an important cause of higher carbon emission levels. Meanwhile, the effects of industrial structure and energy efficiency on carbon emissions in different regions are heterogeneous [
30]. The analysis of carbon emission driving factors at different stages in Beijing found that different factors have different degrees of influence on carbon emissions at different stages of urban development. Economic output has always been the most important contributor to carbon emissions in Beijing at different stages, and population size and energy structure also have a promoting effect on carbon emissions [
31]. Urbanization effect, resident consumption effect and population size effect have significant promoting effects on carbon emissions, and population urbanization is the most important population influencing factor in increasing carbon emissions [
32].
The influence of different indicators on carbon emissions shows the diversity of carbon emission pathways, and in the process of economic and social development, large consumption of energy is one of the important sources of carbon emissions. Existing study shows that energy consumption and carbon emissions show a certain spatial correlation [
33], and the different industrial structures and economic growth modes have heterogeneous dependence on energy, which leads to a diversity of carbon related emissions [
34]. The energy intensity of production sectors is the main driving factor of carbon emission intensity [
35], and has a positive impact on carbon emission intensity [
36]. The production activities of each industry are closely linked to carbon emissions, and the carbon emissions of China’s construction industry show the characteristics of network structure, and the geographical proximity and energy intensity are all significantly correlated with the carbon emissions of the construction industry [
37]. China’s manufacturing carbon emissions are influenced by industrial value added, energy consumption and energy structure, and it is found that the decoupling of manufacturing carbon emissions from economic development is mainly dominated by the decoupling of energy consumption from industrial value added [
38], which further shows the importance of energy consumption on carbon emissions. A survey of carbon emissions in China’s internal regions and different provinces and cities found that carbon emissions from urban energy consumption in 26 prefecture-level cities in the Yangtze River Delta will be stable by 2020, and carbon emission intensity will decline, with carbon emissions from energy consumption and economic development showing a negative decoupling trend [
39]. Zhang et al. (2021) used the input–output model to measure the difference of carbon emissions due to production-based and consumption-based activities in Tianjin, China, and found that basic building construction was the main reason for the difference, and found that population, income and urbanization had an important impact on urban carbon emissions [
40]. Ma et al. (2022) explored the influencing factors of carbon emissions from the energy consumption of rural residents in China and found that quality of life, energy conservation awareness and household characteristics would affect the carbon emission level of rural residents [
41].
In addition, scholars have conducted a lot of research on the regional nature of carbon emissions. Chen et al. (2022) used the Theil index and the Moran index to conduct spatial analysis of China’s carbon emission intensity and found that the spatial differences of carbon emission intensity from 2000 to 2019 were obvious, mainly intra-regional, with significant spatial correlation and local agglomeration characteristics [
42]. Yang et al. (2022) analyzed the spatial and temporal patterns of carbon emission quantities in China’s prefecture-level cities through spatial autocorrelation models and found that China’s prefecture-level carbon emission quantities expanded in time, decreased from north to south, and increased from southeast to northwest, with significant spatial aggregation [
43]. Liu et al. (2022) found that the carbon emission reduction effect is significant in northeast, east and southwest China, while the carbon emission reduction effect is poor in northwest China, and investment activities, energy use and economic activities promote carbon emissions in China [
44]. Wang and Zhao (2021) established an industrial carbon emission performance (ICEP) evaluation system to study the regional industrial carbon emission levels and found that industrial carbon emission performance has significant inter-provincial differences, and, by region, the ICEP was highest in the eastern region and lowest in the western region [
45]. Zhang and Li (2022) measured and analyzed the carbon emissions from energy consumption of rural residents and agricultural production in China and found that rural carbon emissions in China’s provinces have spatial agglomeration, and carbon emissions in the eight economic regions have large inter-regional differences and small intra-regional differences [
46]. Xiao et al. (2022) analyzed the level and spatio-temporal characteristics of county carbon emissions in Hubei Province from 2000 to 2020 and found that carbon emissions in central and eastern areas were higher than those in western. Moreover, carbon emissions in Hubei Province were significantly decoupled from agricultural economic growth, and the number of counties with strong decoupling has increased [
47].
In general, the existing studies on carbon emissions are rich, but there are still certain shortcomings. Firstly, existing studies have deeply analyzed the relevant influencing factors of carbon emissions, which can clearly sort out the theoretical relationship between carbon emissions and related influencing factors. However, carbon emissions have a spatial nature, and current studies lack discussion on the spatial relationship between carbon emissions and their influencing factors. Secondly, carbon emissions in China come from a wide range of sources, and carbon emissions from energy consumption are a key source in the process of industrialization and urbanization in China, so research on carbon emissions from energy consumption is necessary, and most existing studies have been conducted on carbon emissions from energy consumption. Energy consumption can be divided into rural energy consumption and urban energy consumption, and the corresponding urban energy consumption is divided into production energy consumption and domestic energy consumption. A more detailed division of energy consumption sources and the study of its carbon emission nature and influencing factors can propose more targeted energy saving and emission reduction policies. Thirdly, carbon emissions are spatially imbalanced, but the degree of imbalance and how it evolves still need to be measured and analyzed further in order to clarify the regional differences and spatial distribution characteristics of carbon emissions. Based on the above three analyses, this paper decided to measure the carbon emission quantity and carbon emission intensity of urban production energy consumption, and analyze the spatial and temporal distribution of carbon emissions and the driving factors. The carbon emissions of urban production energy consumption refer to the carbon emissions generated by the energy consumption of production activities in industries, raw materials and materials, construction, transportation, storage, postal services, wholesale and retail trade, and accommodation and catering, in addition to agriculture. After measuring carbon emission quantity and carbon emission intensity, the national and regional imbalance and spatial distribution characteristics of carbon emissions from urban production energy consumption were further measured and analyzed using the Dagum Gini coefficient and its decomposition and kernel density estimation, and, finally, the driving factors of carbon emissions and the regional heterogeneity of the driving factors were investigated using spatial econometric models. The results of this paper aim to provide quantitative support for the formulation of national and regional carbon emission reduction policies, so as to achieve China’s “double carbon” target quickly and effectively.
3. Materials and Methods
3.1. Carbon Emission Calculation
In this paper, the carbon emission quantity and carbon emission intensity of urban production energy consumption were used to measure the regional carbon emission level, and the carbon emission quantity of urban production energy consumption was calculated using energy in industry, raw materials and materials, construction, transportation, storage, postal industry, wholesale, retail trade, accommodation, catering production and other end consumption.
3.1.1. Carbon Emission Quantity Calculation
At present, there are many accounting methods for carbon emissions from energy consumption, including the IPCC measurement method, field measurement method and model estimation method [
48]. In this paper, based on the urban production energy consumption and the method of calculating the carbon emission quantity of energy consumption according to IPCC [
49], a total of 16 energy sources, including raw coal, washed coal, other washed coal, coal, coke, coking coal furnace gas, other coking products, crude oil, kerosene, diesel, fuel oil, liquefied petroleum gas, other petroleum products, natural gas, electricity and heat, were selected to calculate the carbon emissions from urban production energy consumption of 30 provinces in China from 2005 to 2019. The energy data were derived from the terminal consumption of the energy balance table in the China Energy Statistical Yearbook [
50]. The calculation formula of carbon emission quantity is as follows:
In Formula (1), Ei is the energy consumption, NCVi is the average low level calorific value of the fuel, EFi is the carbon content per unit calorific value of the fuel, Oi is the oxygen content, and 44/12 is the conversion factor for converting C to CO2.
3.1.2. Carbon Emission Intensity Calculation
The carbon emission intensity of urban production energy consumption is the carbon emission of urban production energy consumption per unit of GDP. The calculation formula of carbon emission intensity is as follows:
In Formula (2), secondary industry refers to the mining industry (excluding mining auxiliary activities), manufacturing (including metal products, machinery and equipment repair), electric power, heat, gas and water production and supply industry, and construction industry. The third industry, or tertiary industry, refers to the service industry, including wholesale and retail, transportation, warehousing and postal services, accommodation and catering industries, etc.
3.2. Dagum Gini Coefficient
The Gini coefficient and its decomposition are important methods to study regional differences, and the sample is divided into three parts: between-group differences, within-group differences and hyper-variance density to explore regional differences and their sources in depth [
51,
52]. In this paper, the Gini coefficient and its decomposition were used to measure the regional differences in carbon emission levels of urban production energy consumption. The overall Gini coefficient reflected the overall differences in carbon emission levels of inter-provincial urban production energy consumption in China, and the specific formula is as follows:
The value k is the number of research subjects grouped. In this paper, it was divided into three regions: eastern, central and western China, containing a total of n research subjects. The values yij and ymr are the carbon emission levels of the j(r)th province in the i(m)th research region, and μ is the average value of carbon emissions of all provinces.
The intra-regional Gini coefficient measures the difference in carbon emission levels within each region, and the inter-regional Gini coefficient measures the difference in carbon emission levels between regions. The specific formulae are as follows:
Gii is the intra-regional Gini coefficient, Gim is the inter-regional Gini coefficient, ni (m) and μi (m) are the number of research objects in region i (m) and the mean carbon emission level of provinces in region i (m).
The overall Gini coefficient is decomposed to further measure the contribution of intra-regional differences, inter-regional differences and supervariable density to the overall differences. The formulae are as follows:
Gw, Gnb and Gl are the intra-regional, inter-regional and hypervariable density difference contributions, respectively. Dim is the relative impact of carbon emission levels between regions i and m, dim is the difference in carbon emission levels between regions i and m, i.e., the mathematical expectation of the sum of all sample values of yij − ymr > 0 in regions i and m, and pim is the hypervariable first-order matrix, i.e., the mathematical expectation of the sum of all sample values of yij − ymr > 0 in regions i and m.
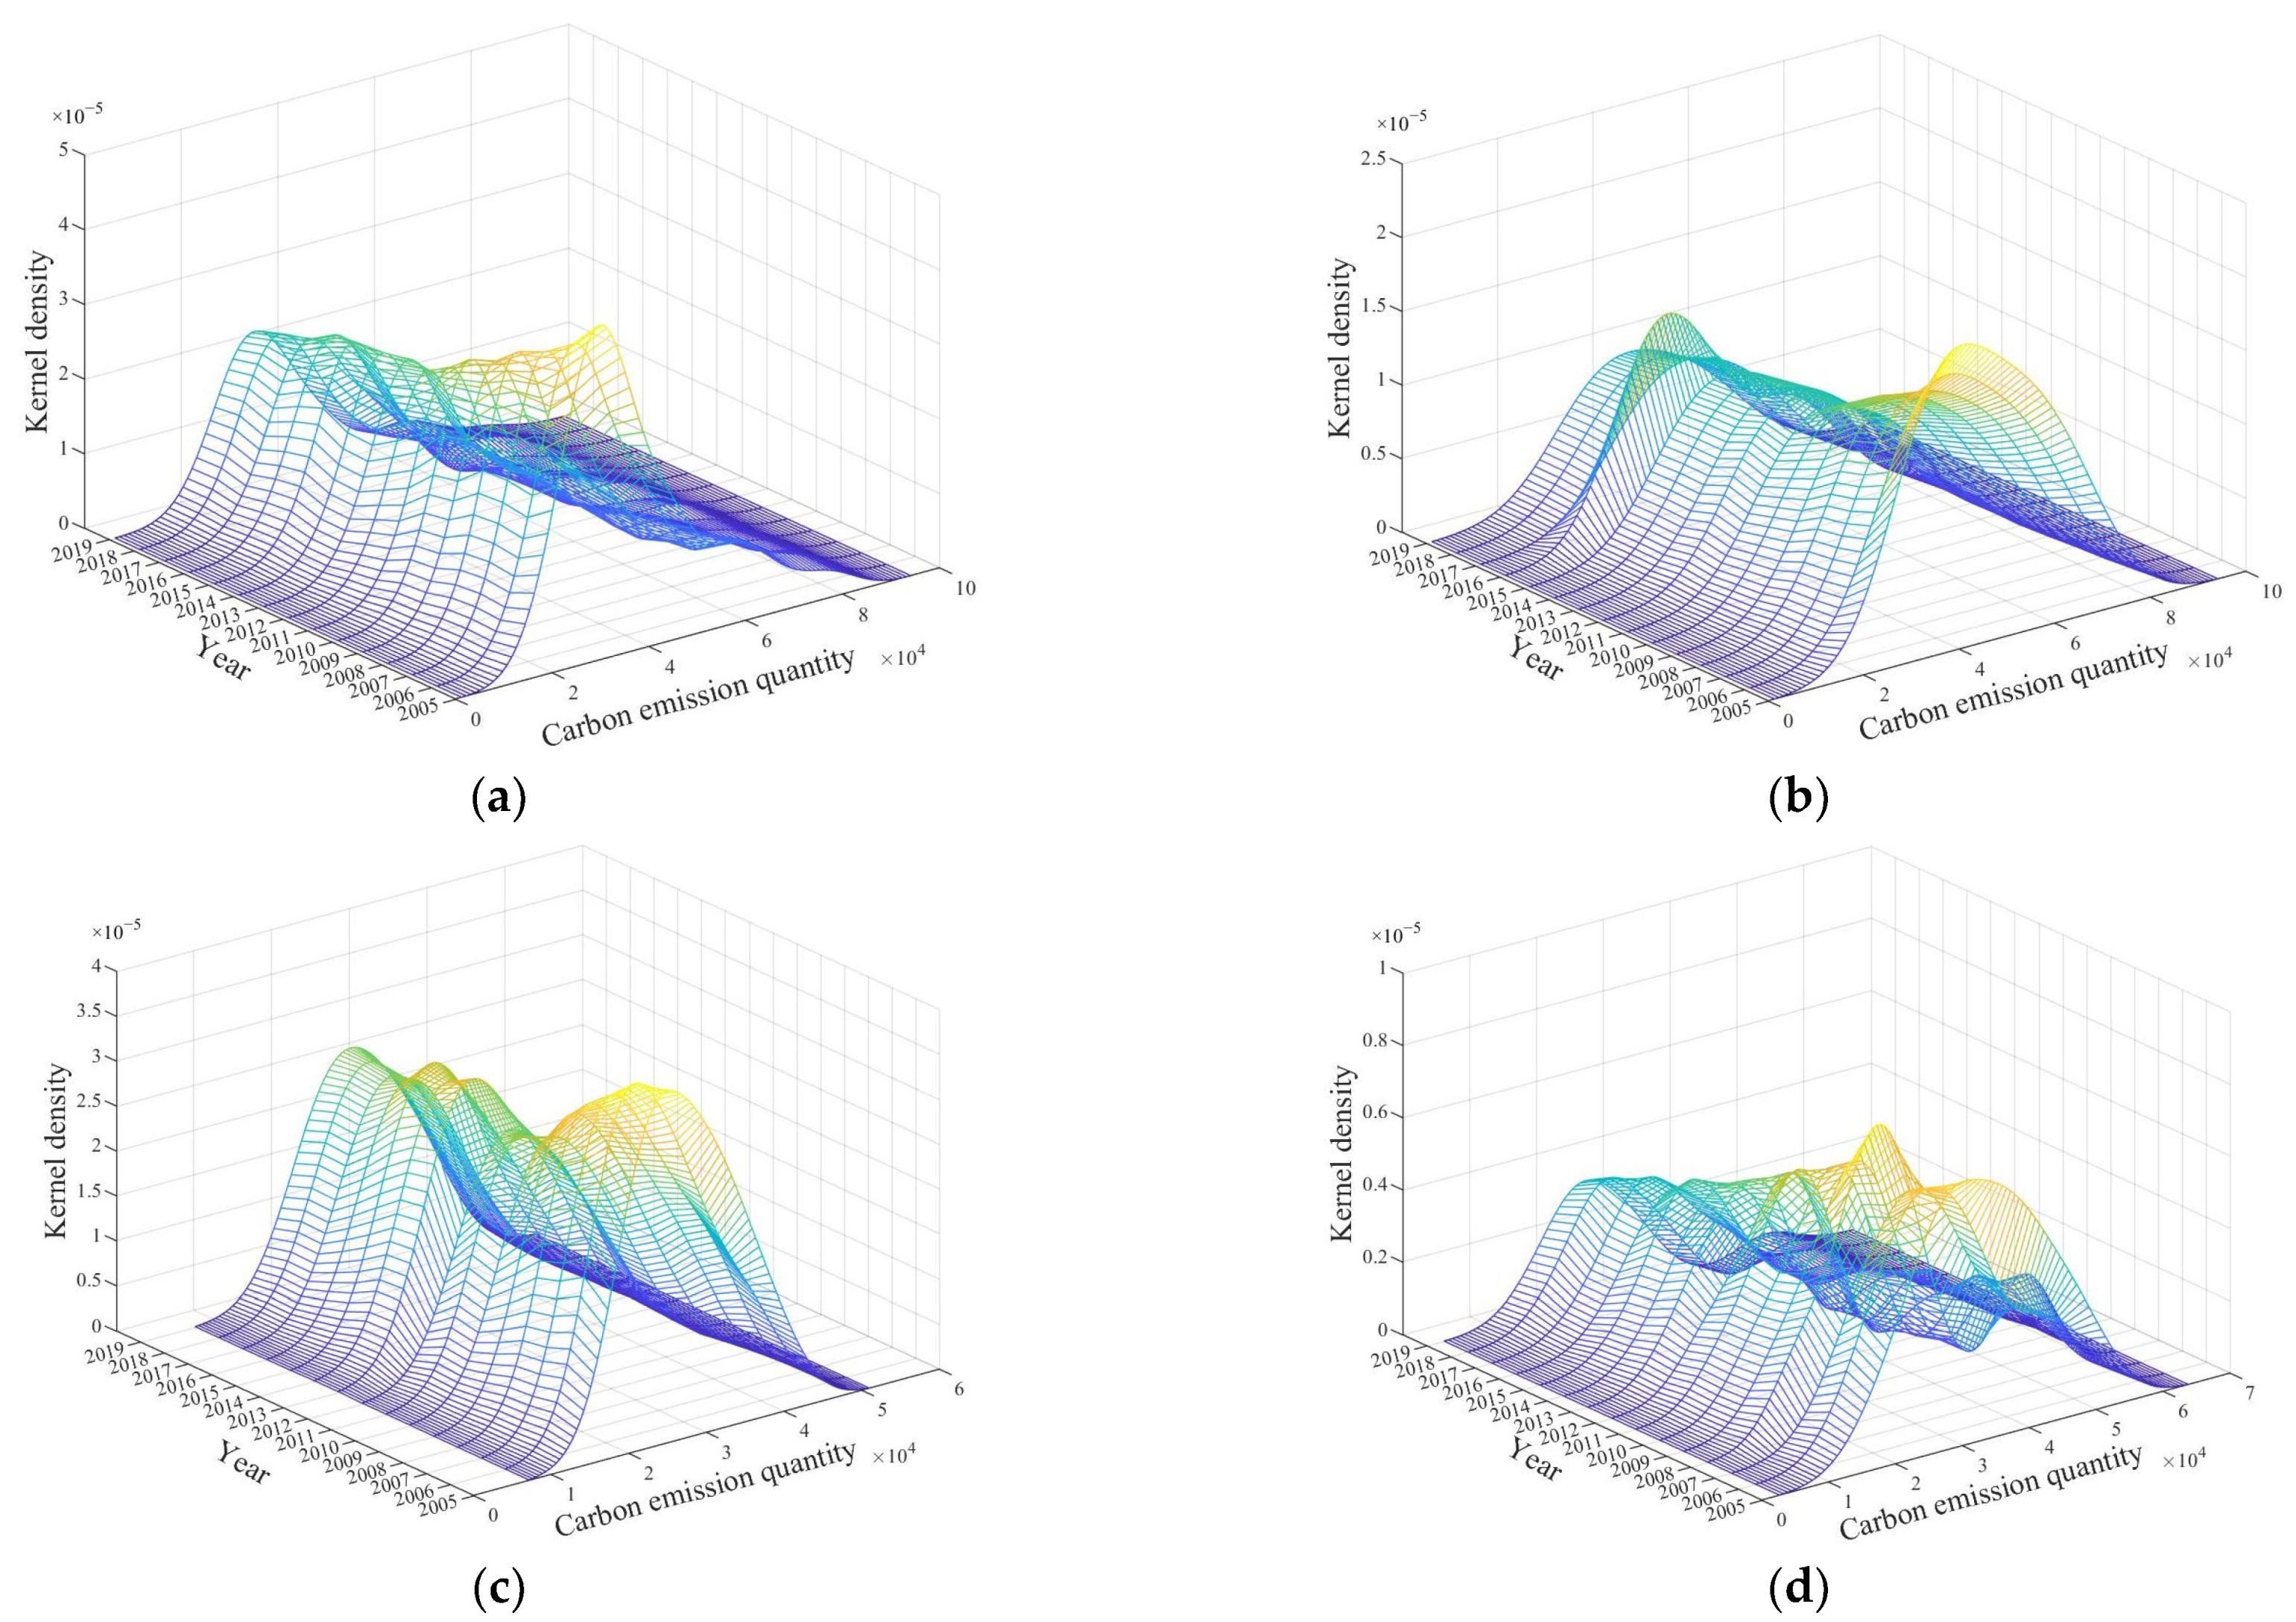
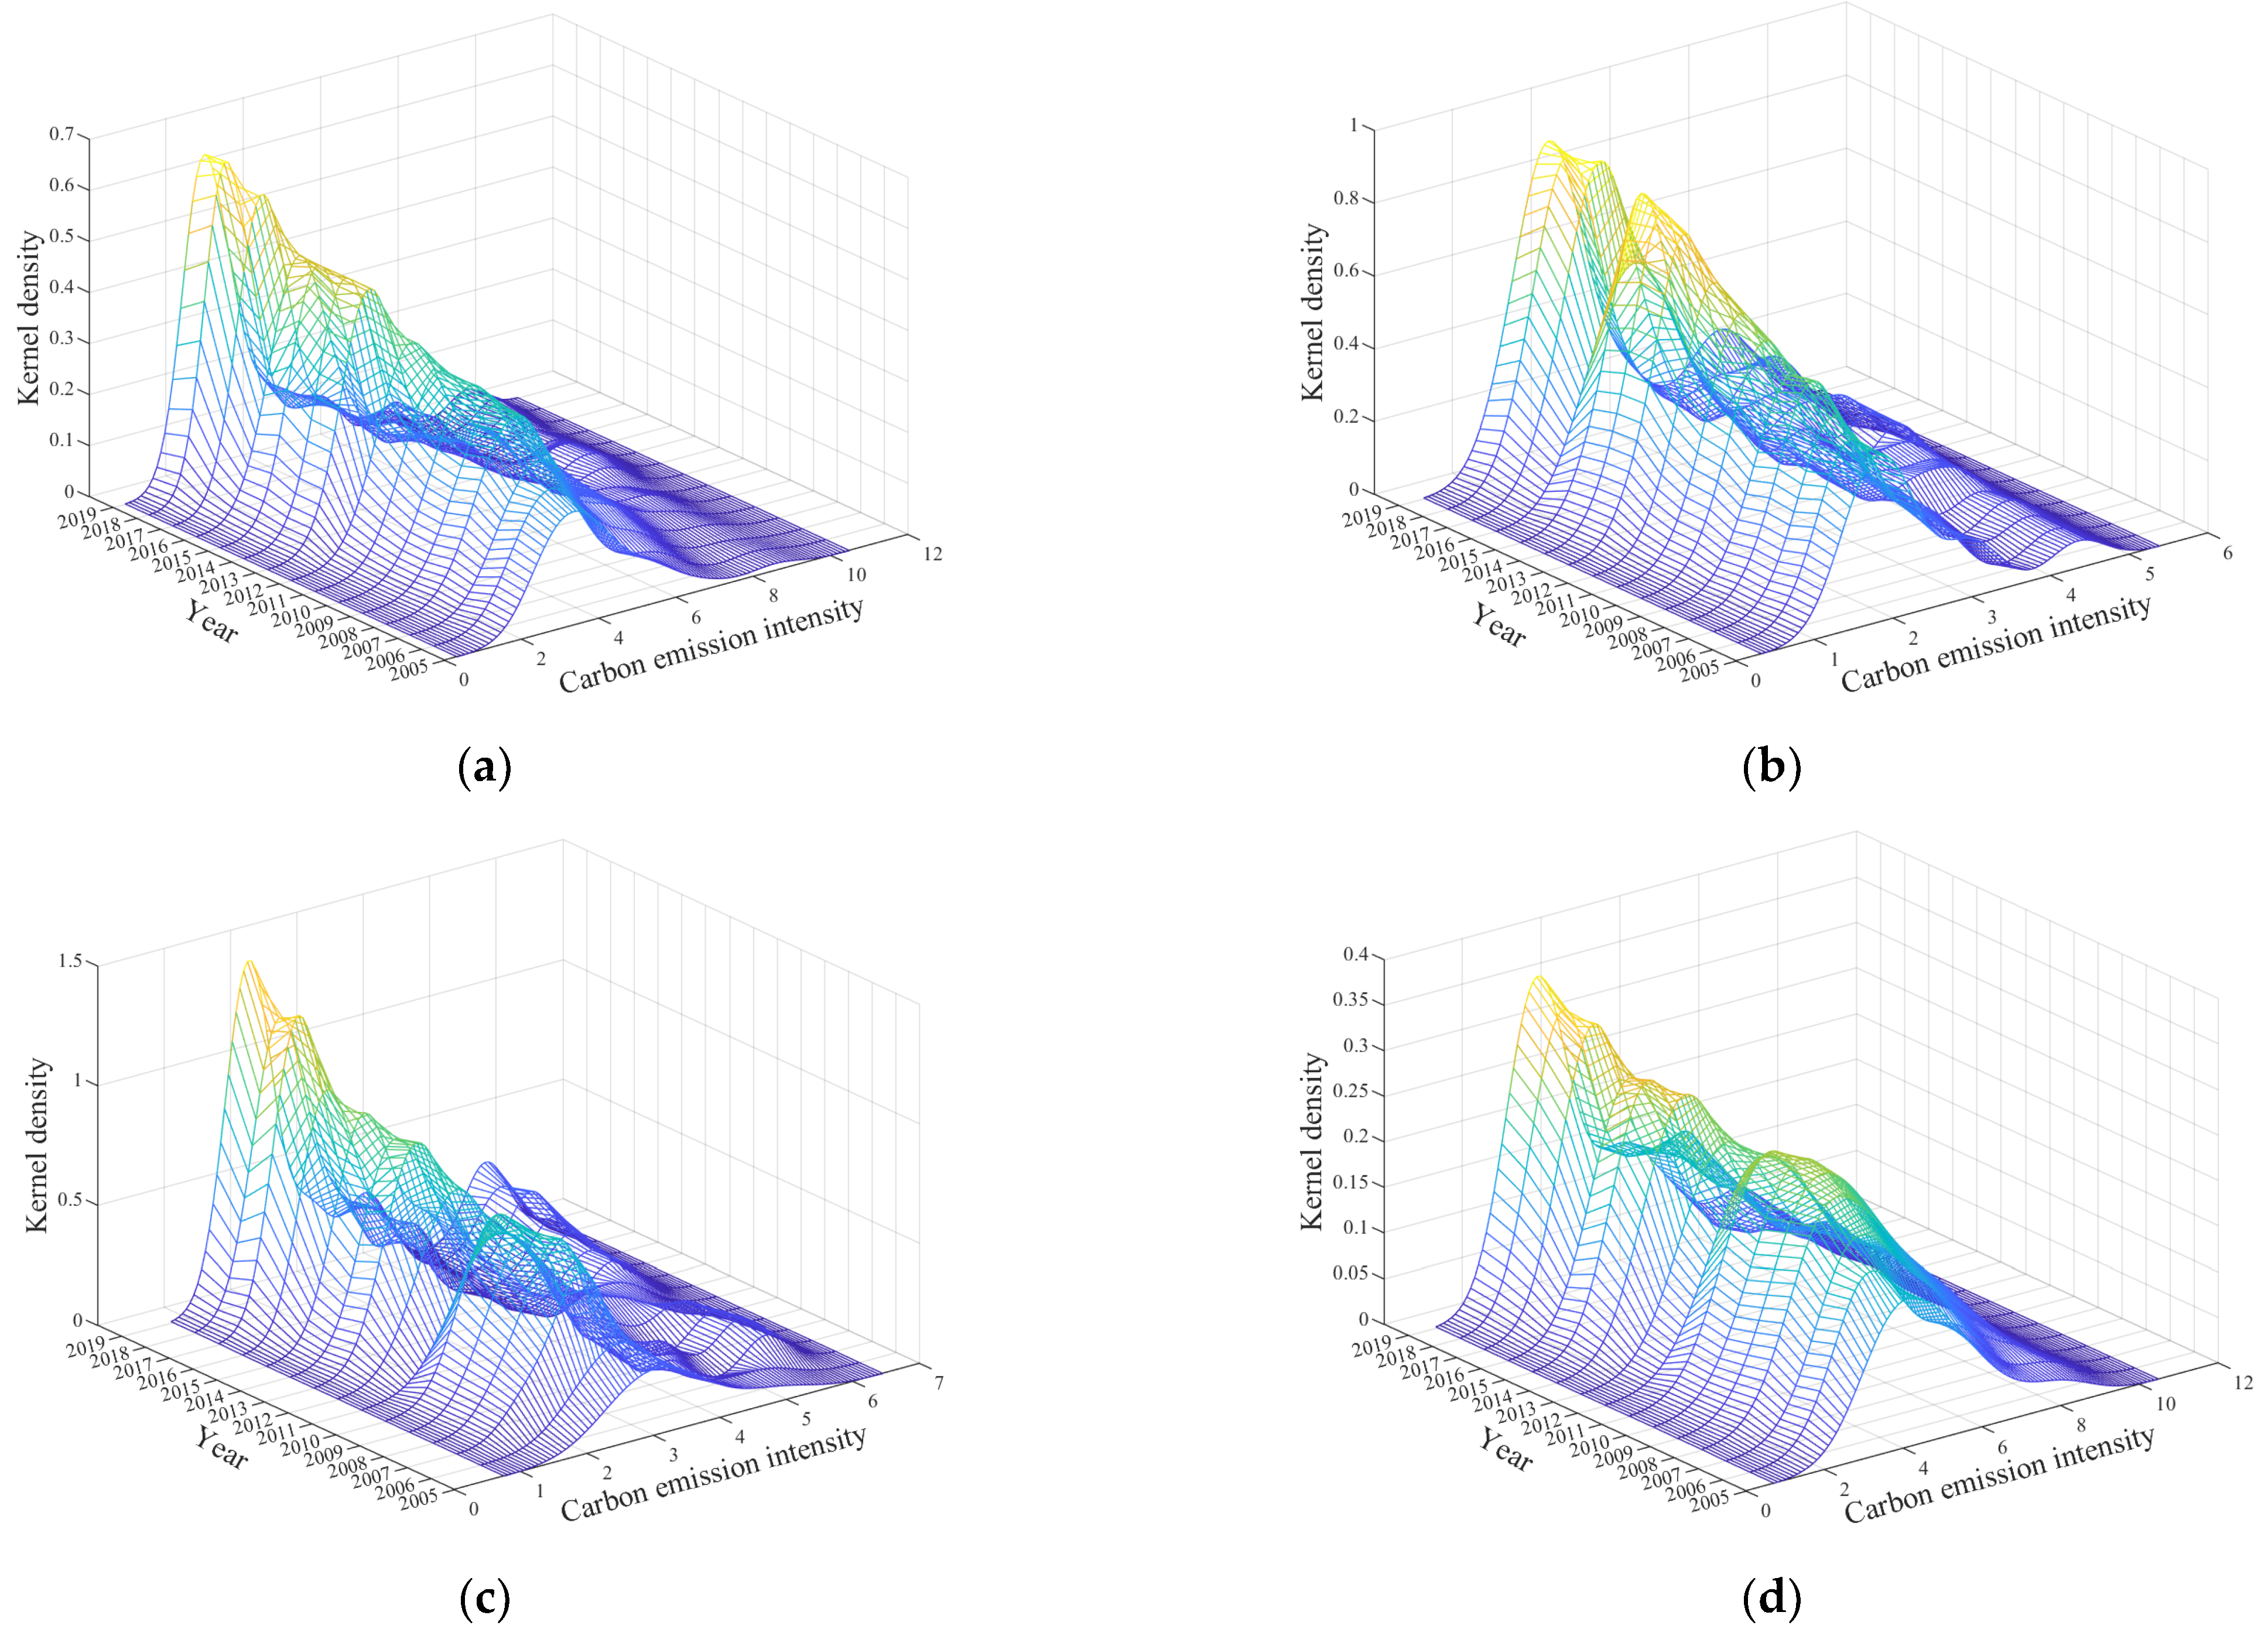
3.3. Kernel Density Estimation
Kernel density estimation is an important nonparametric estimation method, which can further explore the absolute differences and dynamic evolution of regional carbon emissions [
53,
54]. In this paper, we used the Gaussian kernel function for kernel density estimation to study the dynamic distribution and evolution of carbon emission levels of production energy consumption in inter-provincial cities in China from 2005 to 2019, and to analyze the agglomeration and dispersion of carbon emissions through the height and width of the wave. The formula is as follows:
yi is the carbon emission level of province i, is the mean of carbon emission level of all provinces, p is the sample size, h is the bandwidth, and K is the Gaussian kernel function.
3.4. Carbon Emission Classification
To explore the changes of carbon emission levels of urban production energy consumption and their carbon emission types from 2005 to 2019, the carbon emissions of urban production energy consumption were divided into four categories, namely high-high (high carbon emission quantity-high carbon emission intensity), high-low (high carbon emission quantity-low carbon emission intensity), low-high (low carbon emission quantity-high carbon emission intensity) and low-low (low carbon emission quantity-low carbon emission intensity), using the average value of carbon emission quantity and carbon emission intensity as the measure. Those above the average value were high carbon emissions, and those below the average value of carbon emissions were low carbon emissions.
3.5. Model Setting
It is considered that the carbon emission level of urban energy production consumption in provincial in China may have the characteristics of spatial correlation. This paper proposed to test the drivers of carbon emission levels of production energy consumption in towns using the spatial error model (SEM), spatial lag model (SLM) and spatial Durbin model (SDM). The spatial correlation of carbon emission levels of urban production energy consumption in China was tested using the global Moran index (Global Moran’s I) [
55]. If the test was passed, a spatial panel model was required, and then LM, Wald and LR tests [
56] were conducted to select the three spatial models SEM, SLM and SDM, and the fixed and random effects were selected by the Huasman test.
- (1)
Spatial error model (SEM)
- (2)
Spatial lag model (SLM)
- (3)
Spatial Durbin Model (SDM)
In the formulae, i, j represents a province, t represents the year, CEit is the carbon emission level of the ith province in year t, β is the coefficient of the explanatory variable, μi is the individual fixed effect, ηt is the time fixed effect, w is the spatial weight matrix, λ is the spatial error term coefficient, ρ is the spatial autocorrelation coefficient, x is the explanatory variable, and γ is the coefficient of the explanatory variable of the neighboring province affecting the home province.
In this paper, the spatial weight matrix used the adjacency space weight matrix, and the neighborhood under the spatial structure was represented by 0 and 1. If the spatial units had a non-zero common boundary, they were considered to be spatially adjacent and represented by 1; otherwise, they were considered to be non-spatially adjacent and represented by 0.
3.6. Explanatory Variables Selection and Description
The driving factors of carbon emissions from urban production energy consumption are complex. In this paper, 11 explanatory variables were selected for analysis from five dimensions as the driving factors of carbon emissions from urban production energy consumption: urban economic level, living standard of urban residents, urban energy consumption level, urban population size and urban development level.
- (1)
Urban economic level. The transformation of industrial structure can be realized through the upgrading of industrial structure and the rationalization of industrial structure to reduce carbon emissions, so industrial structure is an important influencing factor of carbon emissions [
57,
58]. Foreign direct investment (FDI) has a significant spatial correlation with carbon emissions, and FDI has a significant impact on the carbon emission intensity of local and surrounding areas [
59]. Therefore, the industrial structure (IS) and foreign direct investment (FDI) were selected to reflect the urban economic level. The proportion of value added in the secondary industry to GDP was used to measure the industrial structure.
- (2)
Living standard of urban residents. Wen and Zhang found that per capita disposable income has a significant impact on carbon emissions [
60]. Therefore, the per capita disposable income (PCDI) and per capita consumption expenditure (PCCE) in urban areas were chosen to reflect the living standard of urban residents, and, among them, per capita consumption expenditure replaced per capita disposable income for test robustness.
- (3)
Urban energy consumption level. Studies have shown that the high proportion of coal consumption in China directly determines the energy consumption structure, which, in turn, is the driving factor of carbon emissions [
61]. Therefore, the energy consumption structure (ECS) was chosen to reflect the urban energy consumption level. Coal is the main source of CO
2 emissions, and the proportion of coal consumption to total energy consumption was used to measure the energy consumption structure.
- (4)
Urban population size. As the main body of economic development, the population structure has a profound impact on carbon emissions. Labor force and dependency ratio are important demographic indicators, and have significant space differences in the impact of carbon emissions [
62]. In addition, studies have shown that the population density of contribution to carbon emissions is high in the short-term and long-term, and population density is a non-negligible factor affecting carbon emission [
63,
64]. Therefore, the dependency ratio of elderly population (DREP) and population density (PD) were selected to reflect urban population size.
- (5)
Urban development level. Studies have shown that the green coverage of built-up areas has a significant impact on provincial carbon emissions in China [
65]. The spatial imbalance of per capita carbon dioxide level in China is obvious, and the urbanization rate is an important driving factor of carbon emissions [
66]. Through the study of BRICS countries (Brazil, India, China, etc.), it was found that education level has a significant effect on carbon emissions, which can play a role in environmental quality [
67], and scientific and technological innovation can affect carbon emissions by improving the energy intensity of high-tech industries [
68]. Therefore, the green coverage rate of built-up area (GCR), urbanization rate (UR), cultural level (CL) and scientific and technological innovation (STI) were selected to reflect urban development level.
The urbanization rate was measured by the proportion of urban population in the total population, and the education level was measured by the average years of education: number of primary school students *6+ number of junior middle school students *3+ number of senior high school students *3+ number of junior college students and above *16/number of people aged 6 and above. Technological innovation was measured by the turnover of the technology market. The original data of all the explanatory variables were obtained from China Statistical Yearbook and China Energy Statistical Yearbook from 2005–2019, and individual missing data were completed using the trend prediction method and interpolation method. The abbreviations, definitions, and data sources for variables are shown in
Table 1 and descriptive statistics are shown in
Table 2.
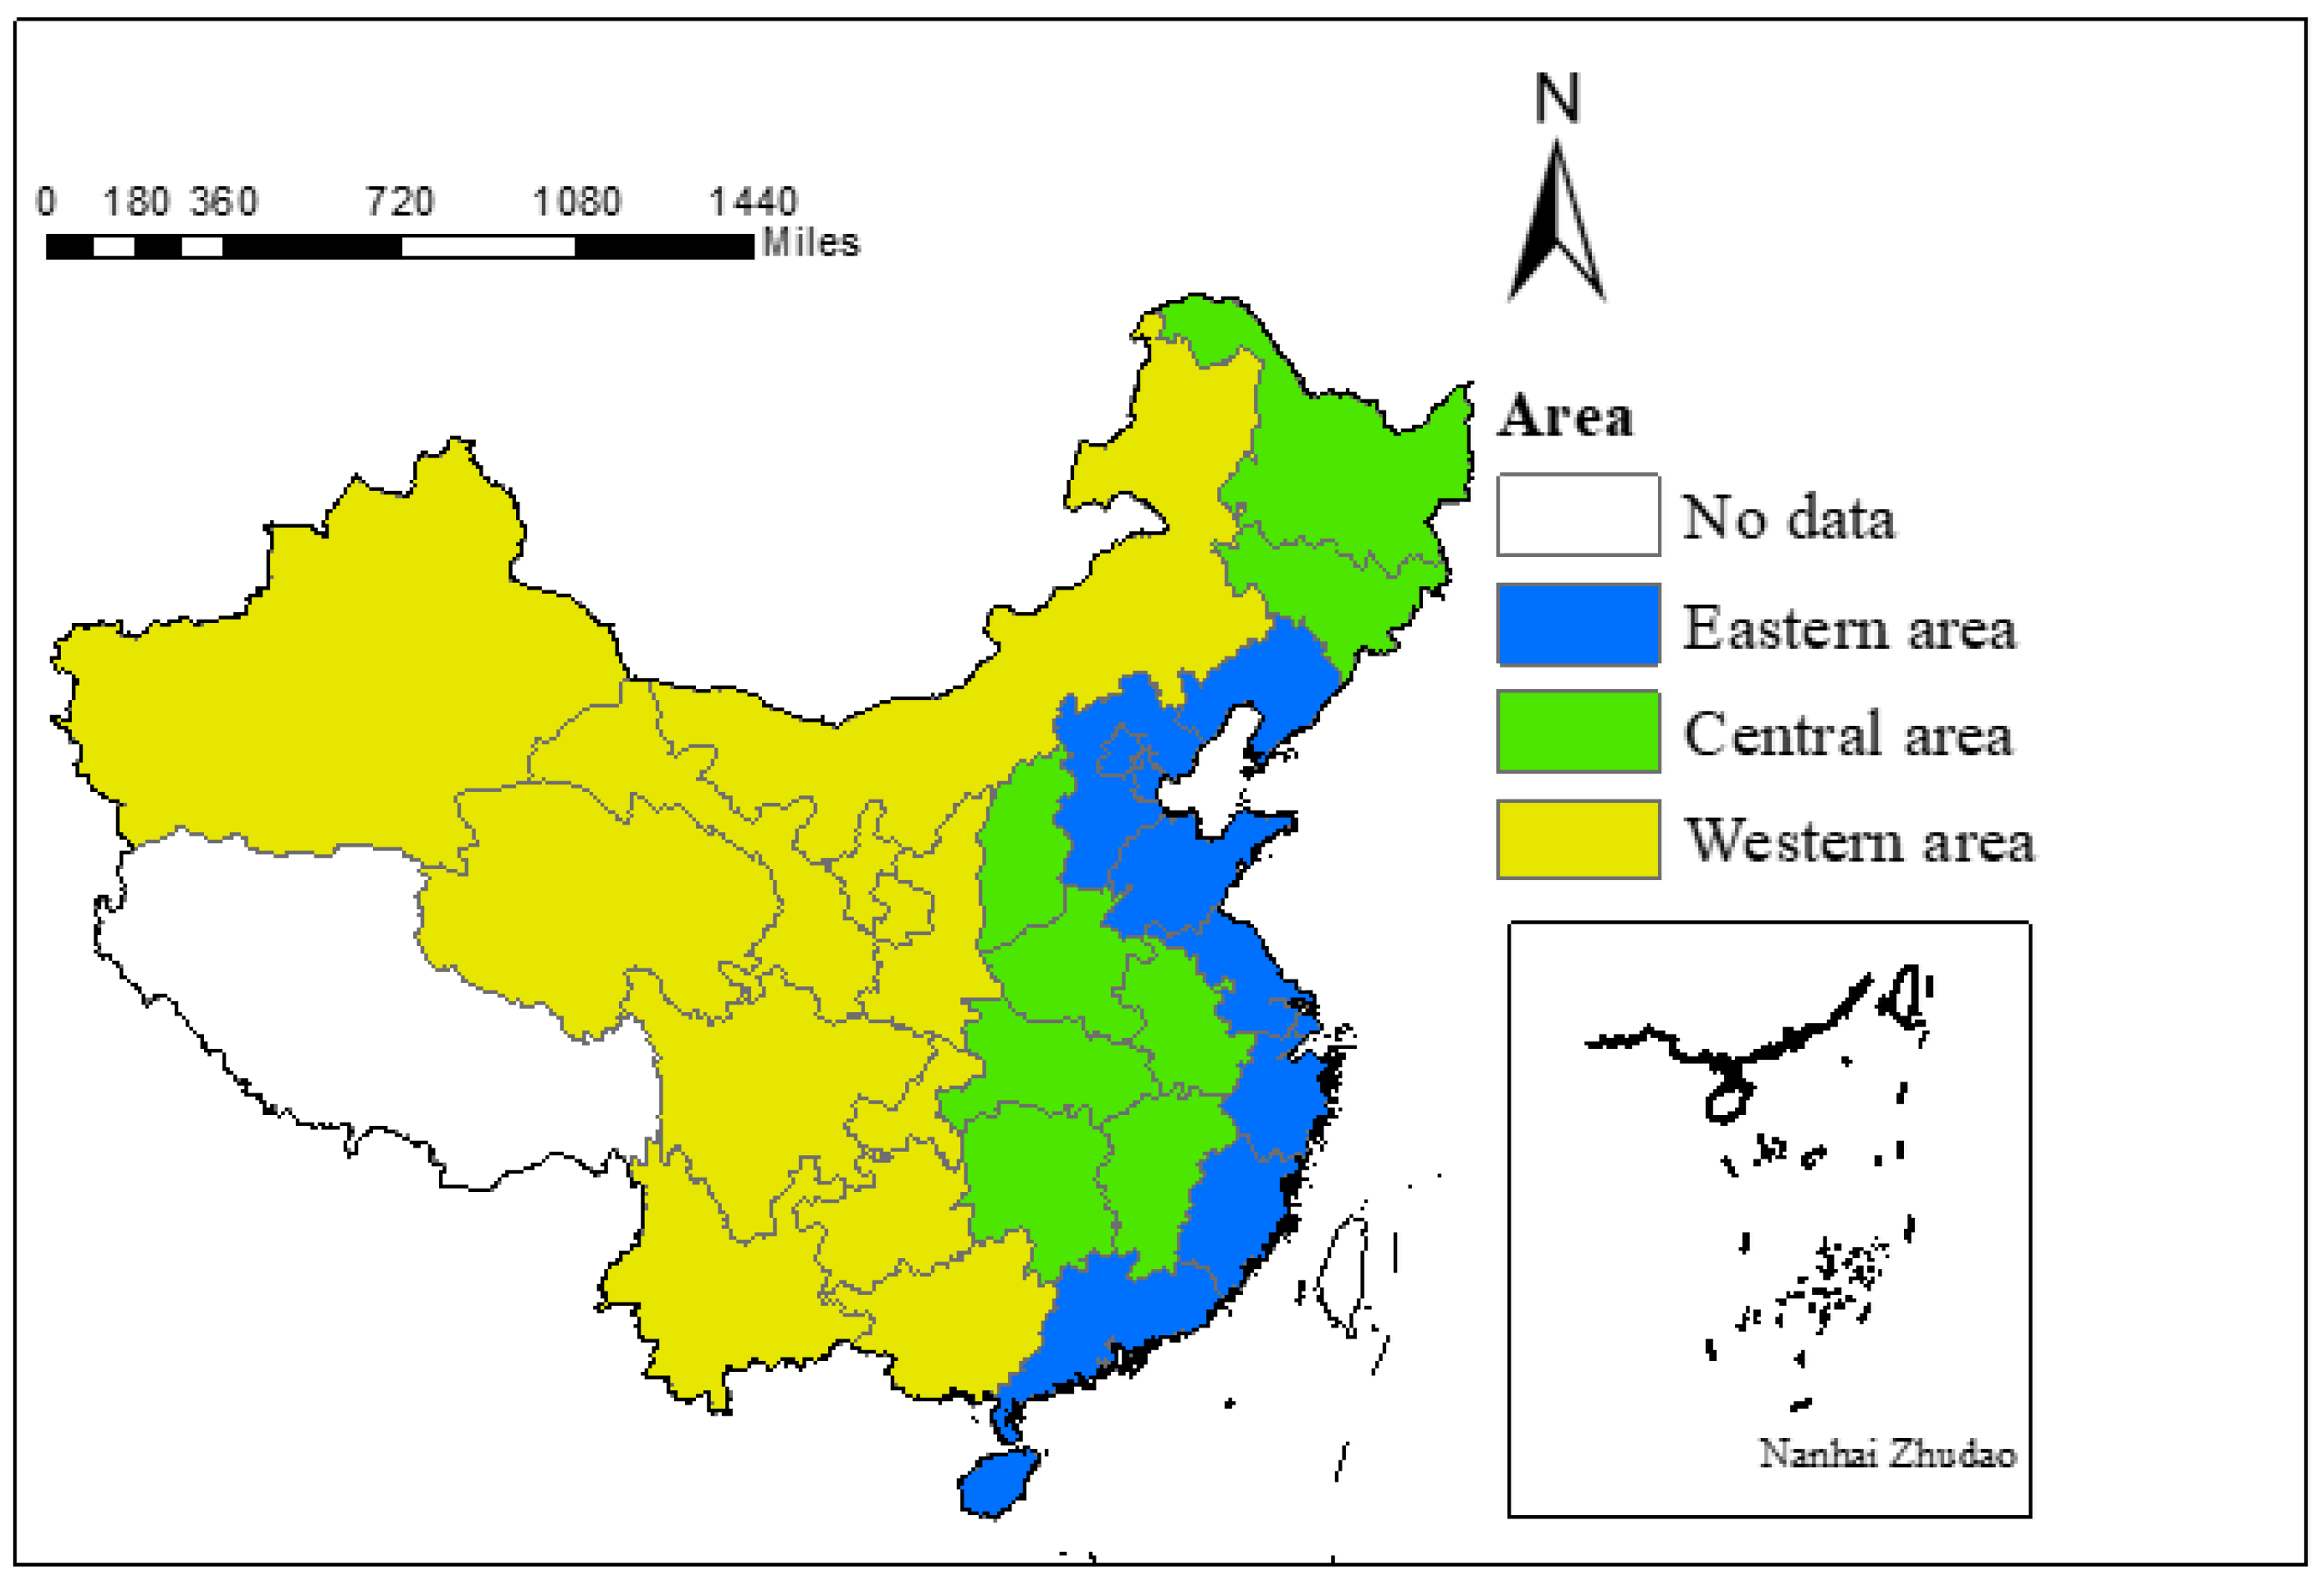
3.7. Research Area
The carbon emission level of production energy consumption varies widely among different regions, and this paper divided China into three study regions: the eastern region, including Beijing, Tianjin, Hebei, Liaoning, Shanghai, Jiangsu, Zhejiang, Fujian, Shandong, Guangdong, and Hainan; the central region, including Shanxi, Jilin, Heilongjiang, Anhui, Jiangxi, Henan, Hubei, and Hunan; the western region, including Inner Mongolia, Guangxi, Chongqing, Sichuan, Guizhou, Yunnan, Shaanxi, Gansu, Qinghai, Ningxia, Xinjiang. The study area is shown in
Figure 1.
5. Conclusions
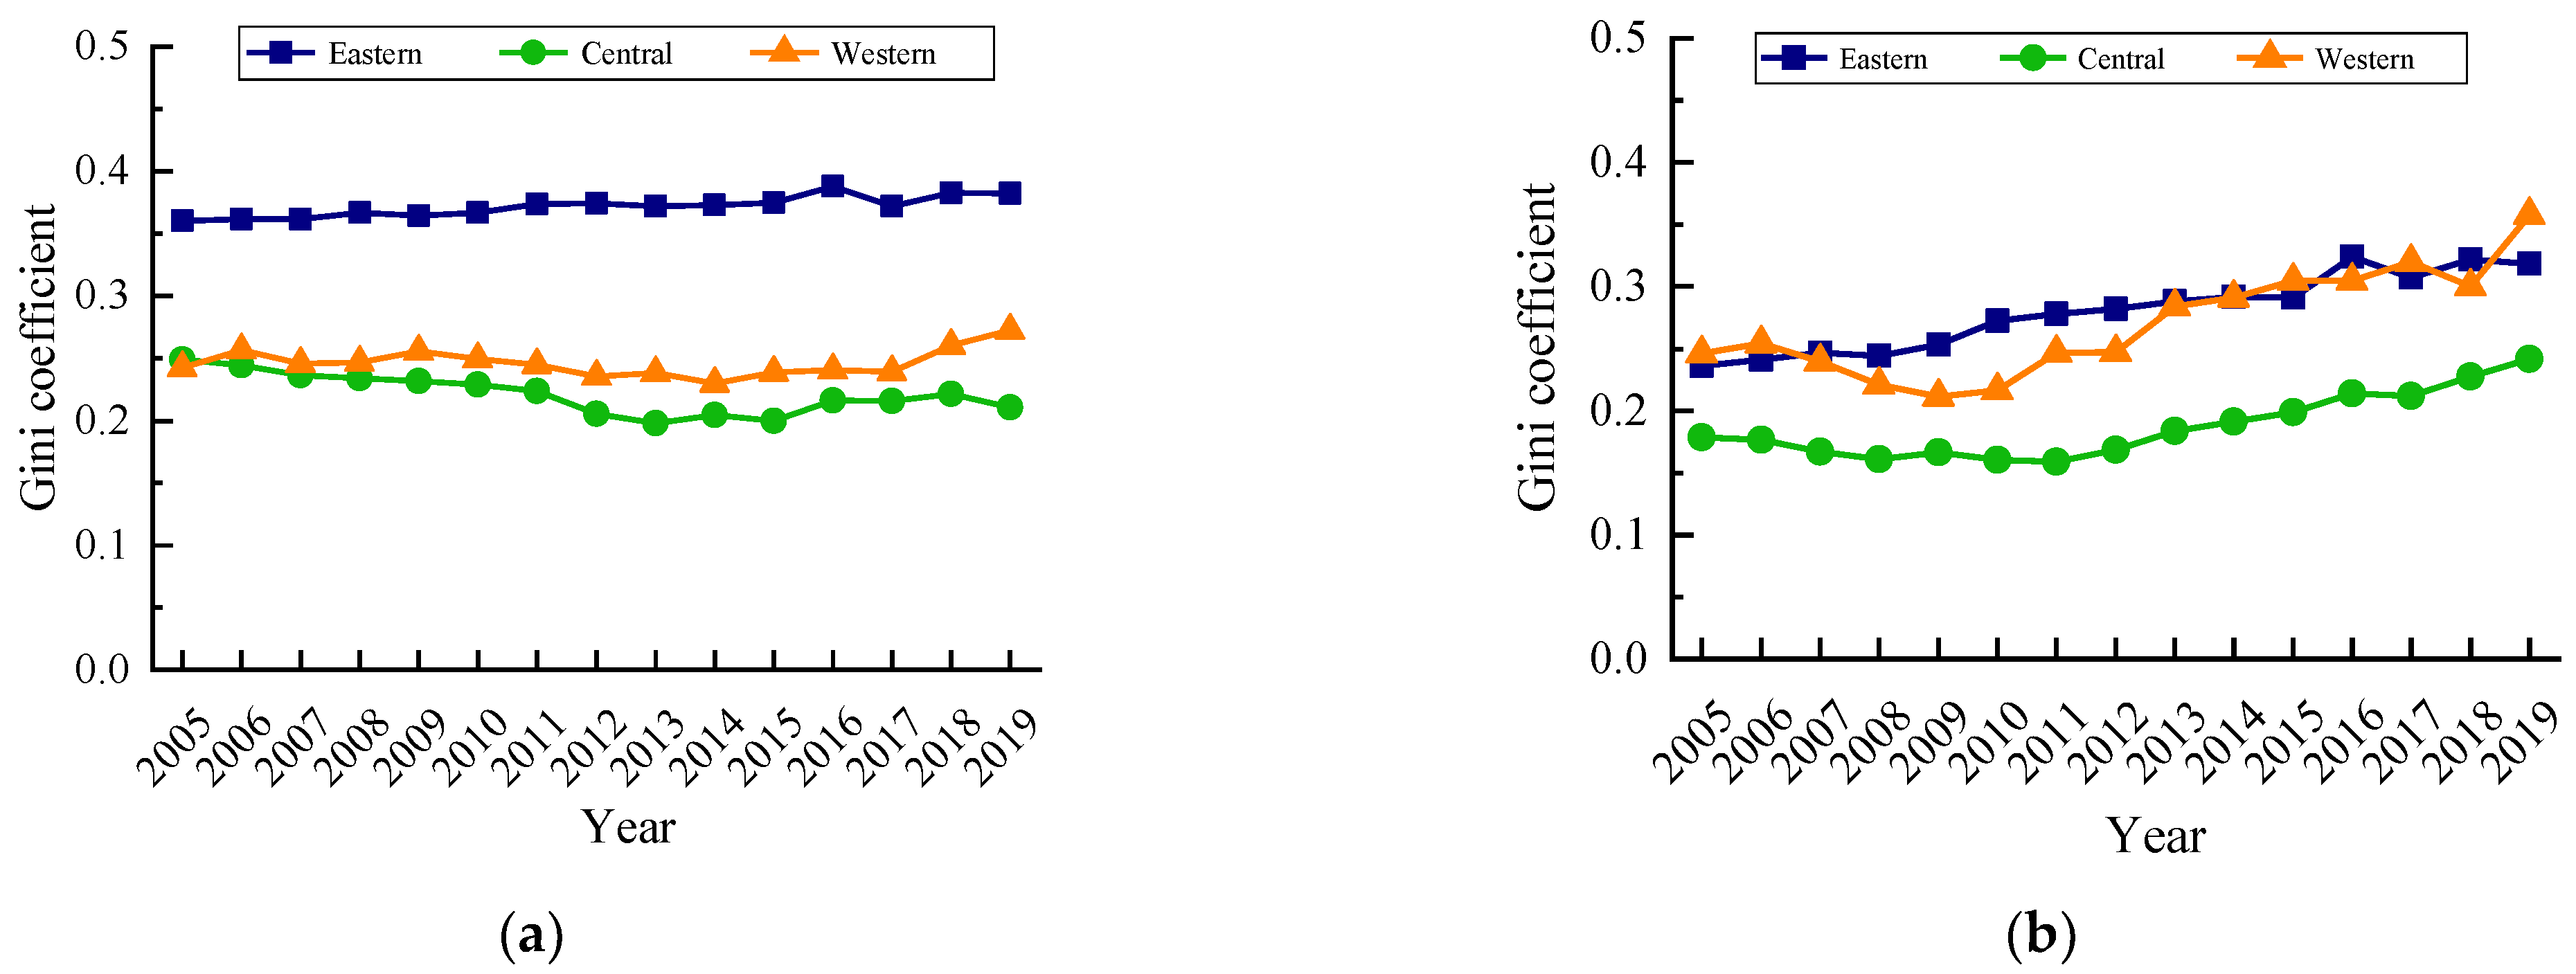
This study measured the carbon emission levels (carbon emission quantity and carbon emission intensity) of urban production energy consumption in inter-provincial areas in China based on data from 2005–2019. The study measured and decomposed the overall regional differences in carbon emission levels using the Dagum Gini coefficient, analyzed the dynamic characteristics of the distribution of carbon emission levels and absolute regional differences using the Kernel density estimation method, and used a spatial econometric model to analyze the driving factors of carbon emission levels in the whole region and three regions (eastern region, central region and western region). The main research findings are as follows.
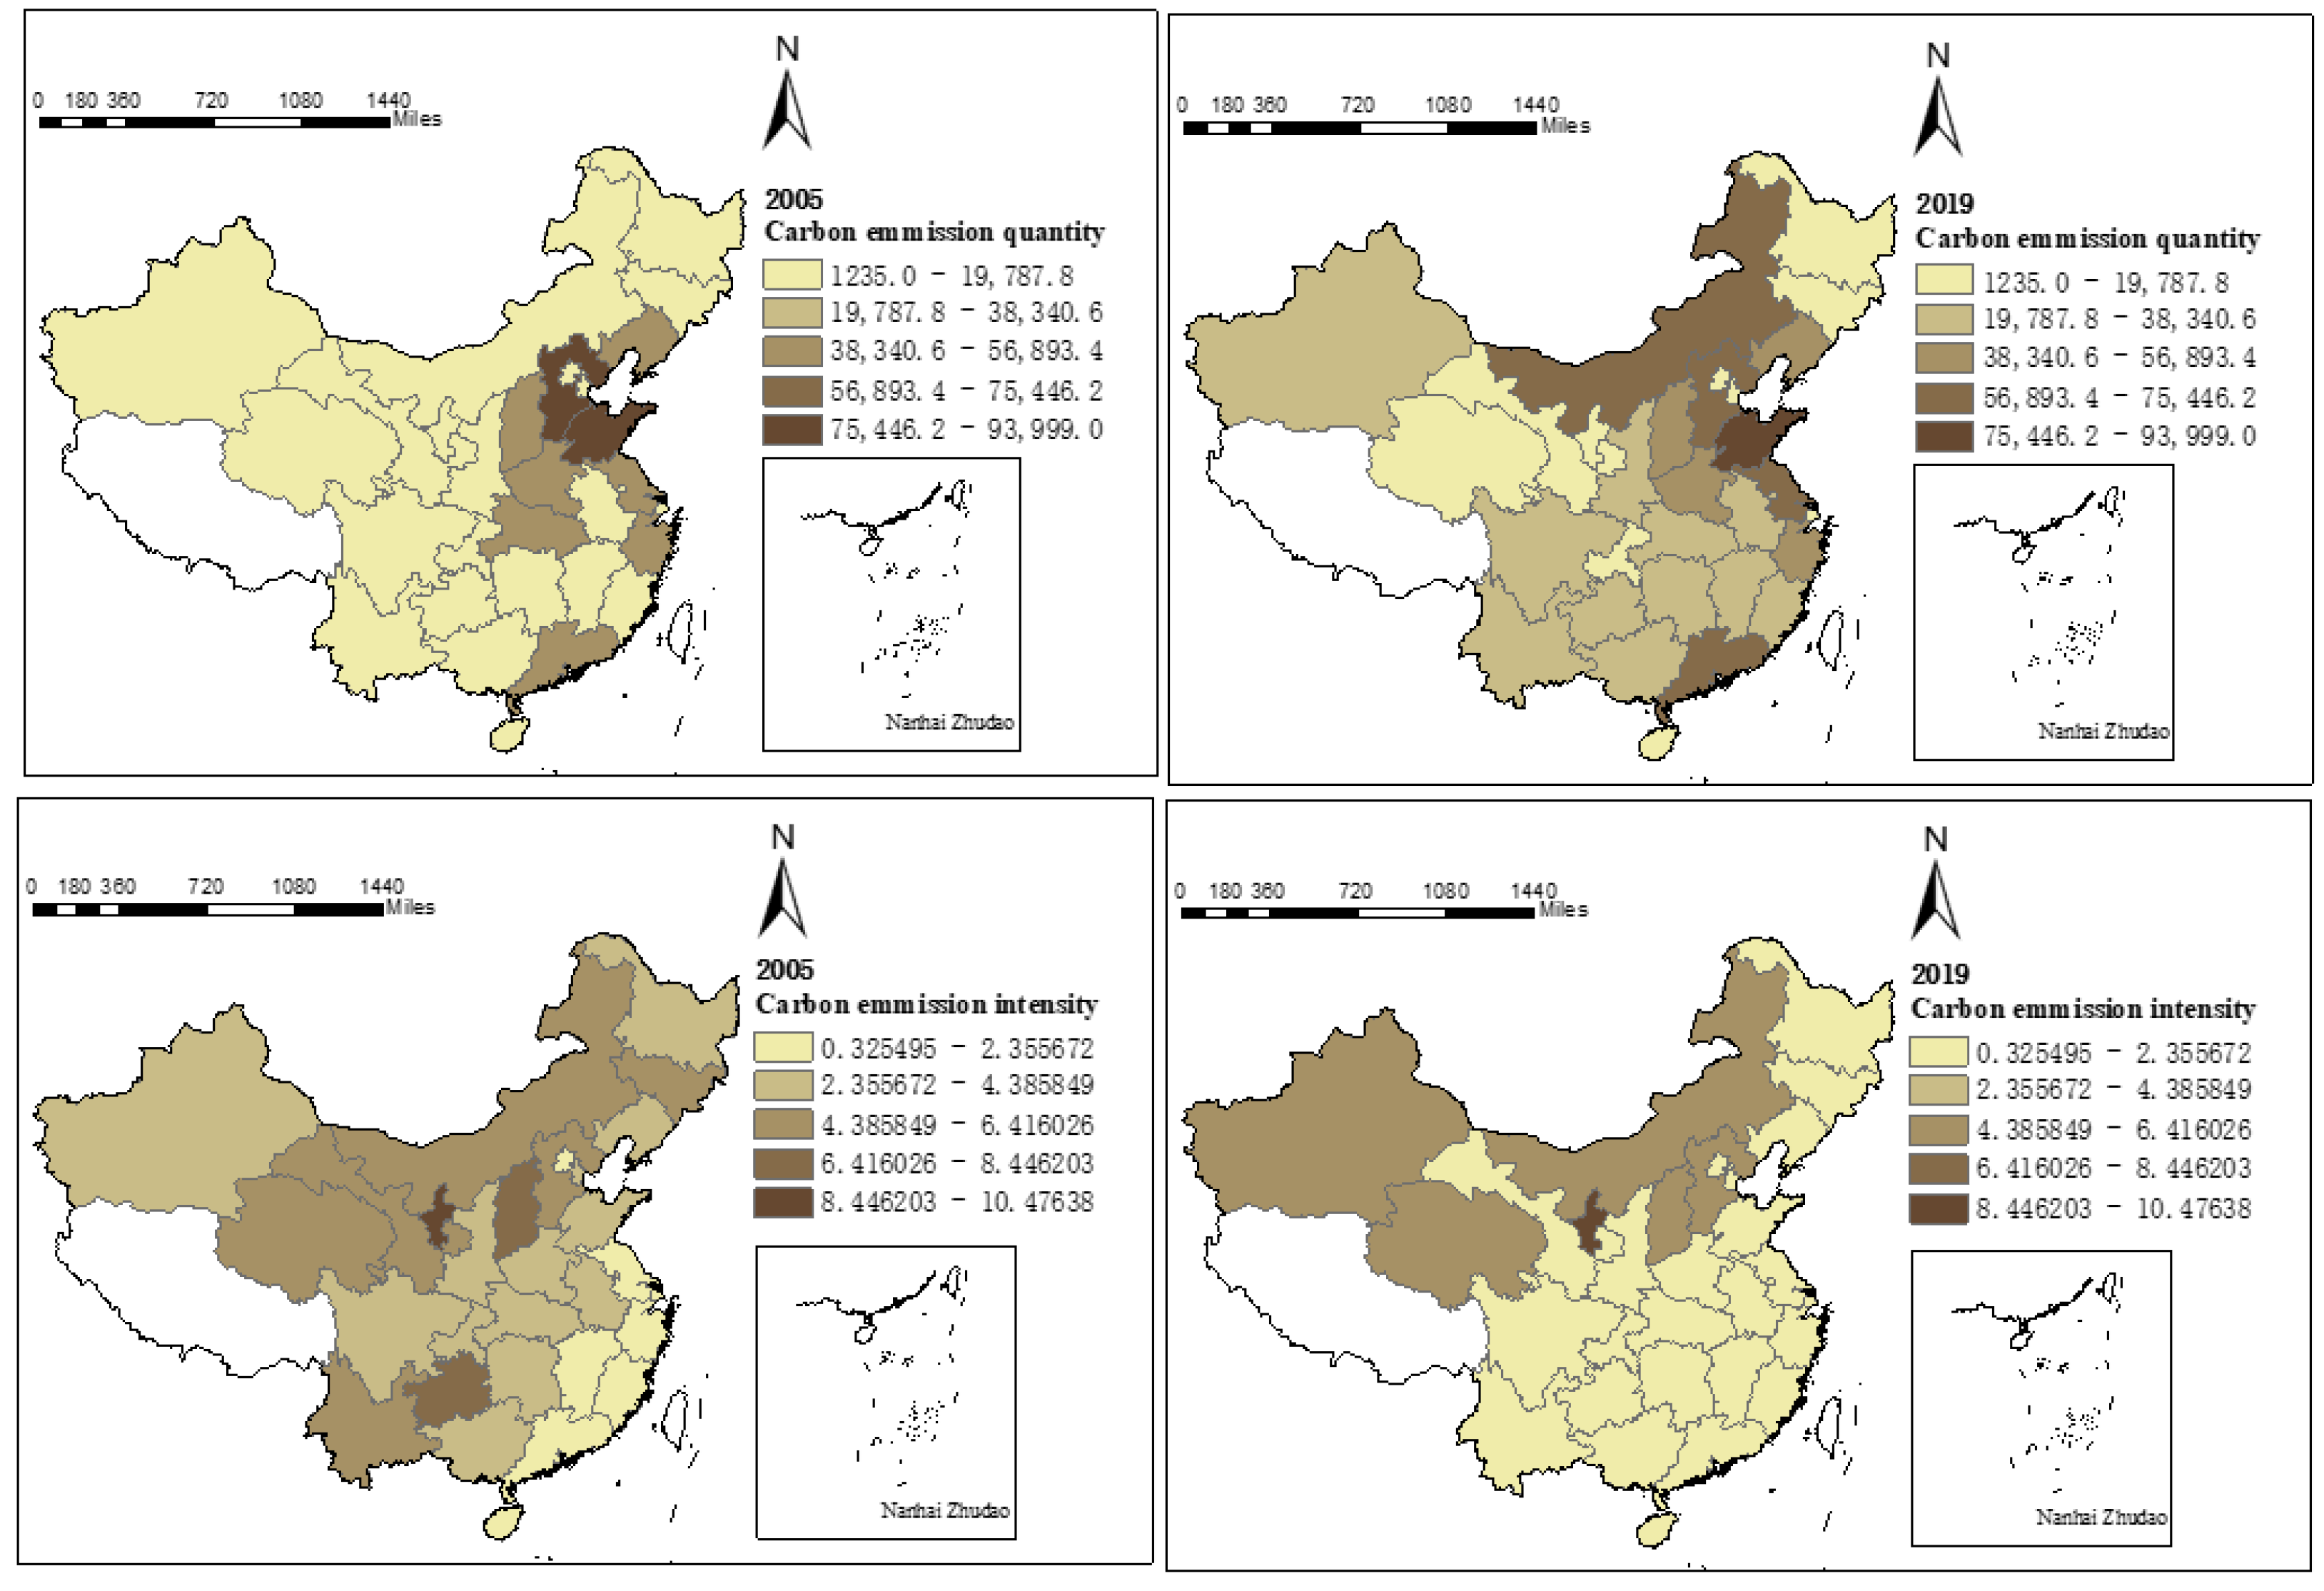
First, the carbon emission quantity increased year by year during the study period, but the growth rate decreased, and the carbon emission intensity had an obvious decreasing trend. Besides this, the carbon emission quantity and carbon emission intensity showed obvious spatial differences, i.e., the carbon emission quantity showed the characteristic of eastern region > central region > western region, while the carbon emission intensity, on the contrary, showed the characteristic of western region > central region > eastern region, and the spatial characteristics were more obvious as time went on.
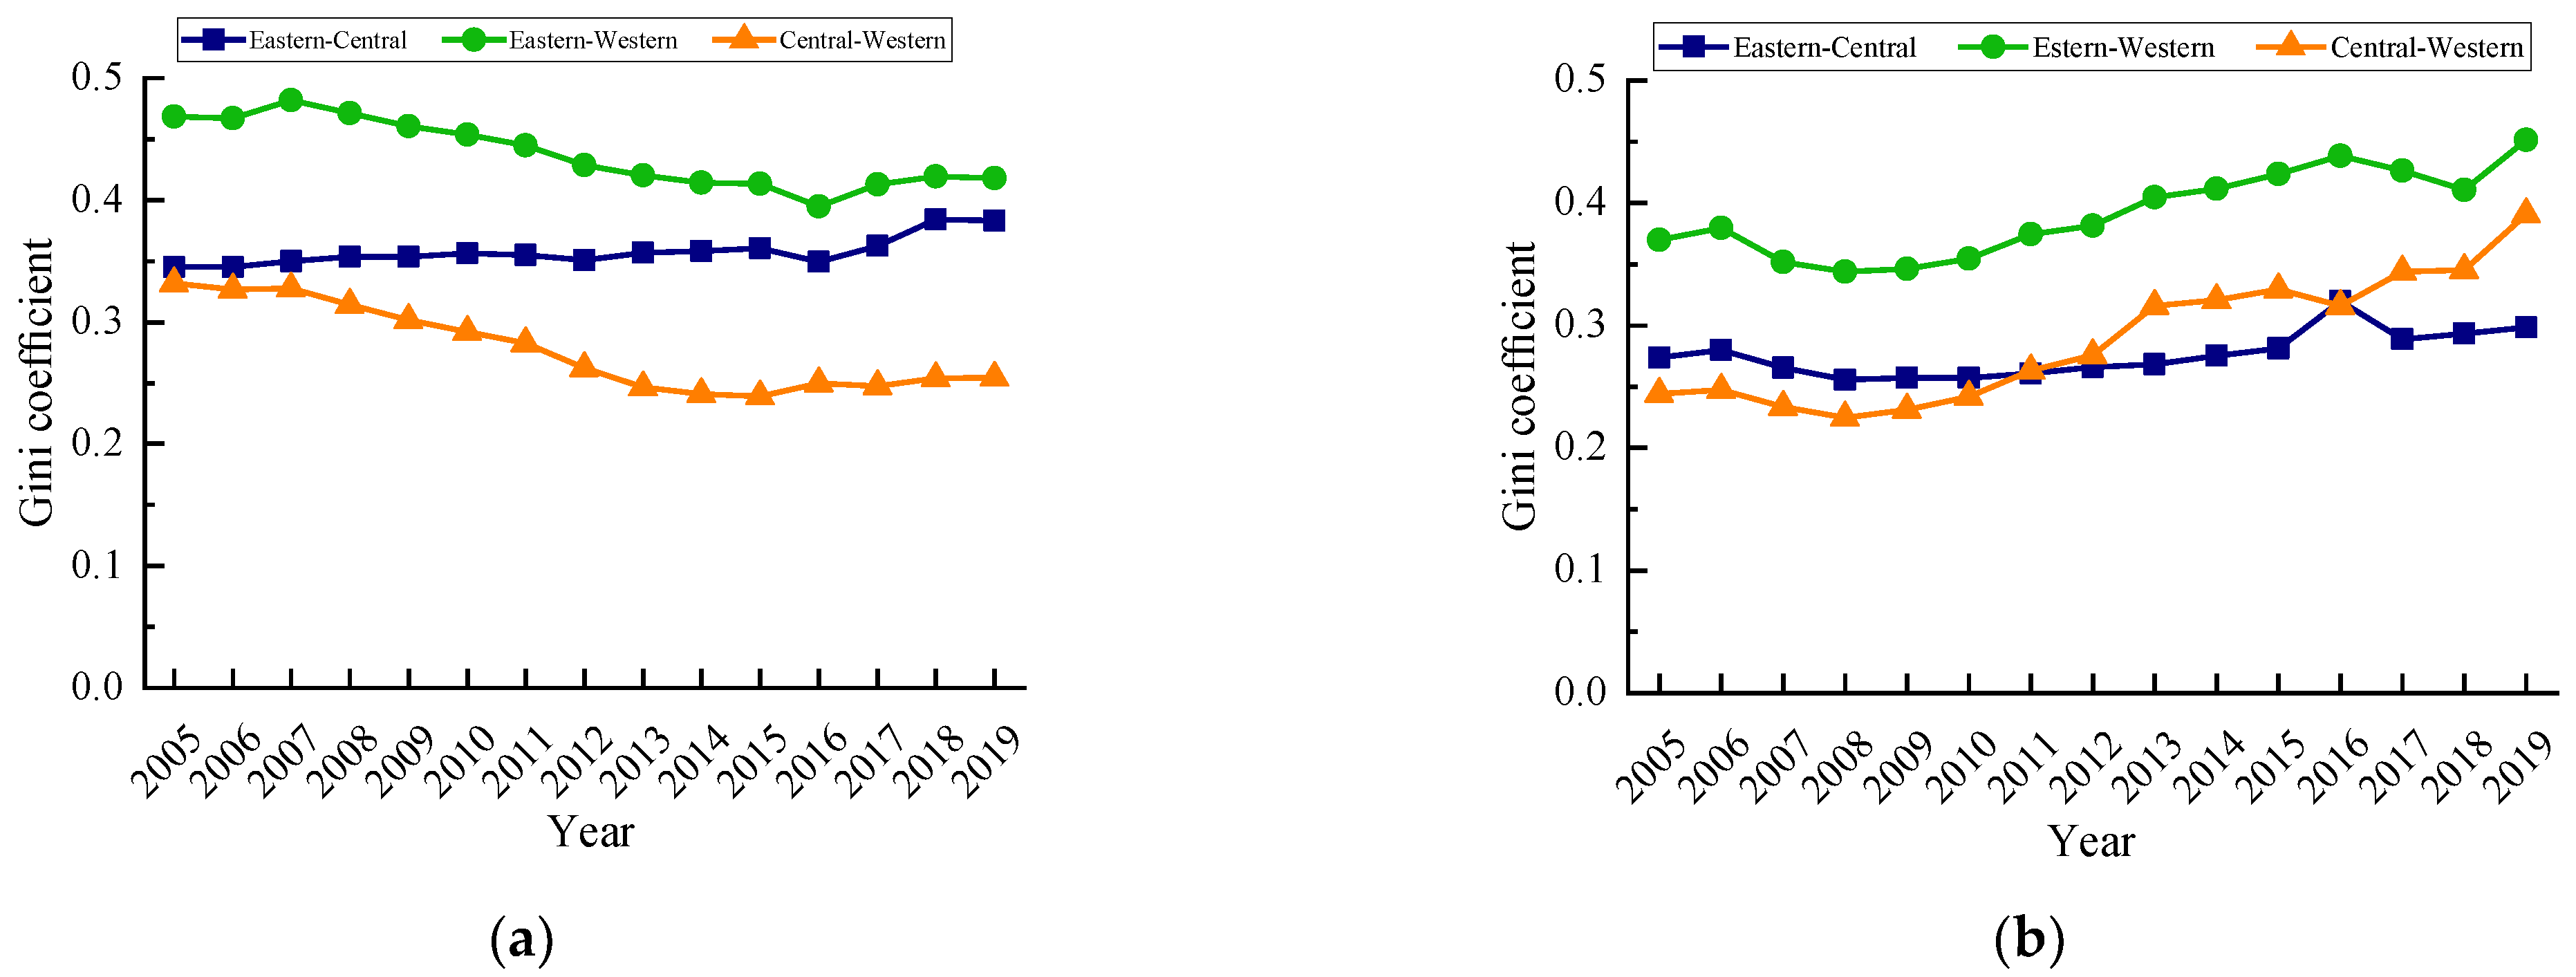
Second, the overall difference of carbon emission quantity showed a decreasing trend. The intra-regional difference of carbon emission quantity evolved from eastern region > central region > western region to eastern region > western region > central region, and the overall difference of carbon emission intensity showed an increasing trend, and the intra-regional difference of carbon emission intensity was always western region > eastern region > central region. The imbalance of carbon emission quantity increased in the country, and the imbalance of carbon emission quantity increased in different degrees in the eastern region, central region and western region. There was a significant gradient effect in the carbon emission intensity, and there was also a trend of multi -level differentiation in the provinces in various regions. From the perspective of carbon emission classification, the inter-provincial carbon emission classification had some changes from 2005 to 2019, but most of the carbon emission provinces were in the low-low category.
Third, carbon emission level was influenced by multiple factors, among which carbon emission quantity was mainly influenced by industrial structure, per capita disposable income, energy consumption structure, urbanization rate, cultural level, scientific and technological innovation. Carbon emission intensity was mainly influenced by industrial structure, foreign direct investment, energy consumption structure, the dependency ratio of elderly population and scientific and technological innovation. Different regions had heterogeneity, and the level of driving factors was different. Industrial structure, per capita disposable income, energy consumption structure, urbanization rate were the important driving factors of regional carbon emissions.
6. Policy Suggestions
Based on the above findings, this paper proposes the following recommendations to reduce carbon emissions from urban production energy consumption in China, to promote the achievement of carbon peaking and carbon neutral goals, and to realize green and sustainable economic and social development.
First, on a national scale, the energy consumption structure has more room for transformation. On the one hand, China’s natural resource profile of “coal-rich and oil-poor” has influenced the energy consumption structure, so China’s current production energy consumption is still coal-based fossil energy, which leads to a large amount of CO
2 emissions [
75]. On the other hand, the energy consumption structure also depends on the industrial structure, and as a large industrial country, China’s industrial sector consumes relatively more energy. Therefore, we should optimize the energy consumption structure and industrial structure. Industrial structure is the core driving force for the development of low-carbon cities [
76]. Adjusting the industrial structure, accelerating the transformation and upgrading of high-energy-consuming industries, and then adjusting the energy consumption structure could effectively reduce urban carbon emissions. In addition, strengthening scientific and technological innovations, especially the development and utilization of clean energy, improving the construction of new energy systems with clean power as the main body, strengthening the development of wind power and nuclear power, reducing the energy consumption of industrial products, and reducing the dependence on fossil fuels, such as coal, and realizing a low-carbon economy would all be beneficial. From a regional perspective, the energy consumption structure has a heterogeneous impact on the region, and more attention should be paid to the transformation of the energy consumption structure in the central region and western region. The change of industrial structure also has an important impact on economic development, and “low carbon” can be used to force traditional industries to upgrade and promote the development of new industries, but it should also be considered that industrial restructuring should go hand in hand with economic development, and excessive pursuit of economic growth or excessive emphasis on low carbon is not conducive to the long-term development of the country. Balance of the low carbon economy must be sought.
Secondly, the regional differences should be balanced to achieve dual balance between carbon emission quantity and carbon emission intensity. The regional differences in carbon emission quantity and carbon emission intensity of urban production energy consumption reflect imbalance in intra- and inter-regional economic development and energy utilization. The eastern region as a whole has a relatively developed economy and higher technology level, but its internal imbalance is also stronger. Therefore, important provinces in the eastern region, such as Shanghai and Zhejiang, should actively play the role of central cities to strengthen the economic and technological radiation to the surrounding areas, improving the economic levels of the surrounding provinces while reducing the differences in the level of carbon emissions of production energy within the region. The eastern region should give full play to its advantages in high and new technology, and transport technical talents to the central region and western region, so as to provide important support for the industrial development and upgrading of the central region and western region. The difference of carbon emission level and economic development within the central region is smaller, therefore, as an important hub between the eastern region and western region, the central provinces should play a good role as a mediator, while maintaining a stable and positive development. The western region should pay more attention to economic construction and low-carbon development of secondary and tertiary industries, while industrial structure transformation is crucial to strengthen the upgrading of low-end manufacturing industries to high-end manufacturing industries, accelerate the transfer from labor and capital-intensive industries to high-tech-intensive ones, and narrow the economic differences with the eastern region and central region, so as to reduce the carbon emission intensity of production.
Finally, the construction of new urbanization should be strengthened. The increase of urbanization rate has significant heterogeneity for regions, and the urbanization rate is higher in the eastern region and central region at the present stage. Further increasing the level of urbanization rate will raise the level of production of carbon emissions, so the transformation of new urbanization should be accelerated, and new urbanization should play an important role in revitalizing the economy, while being a key step in the coordinated development of economic and ecological environments [
77]. Therefore, new-type urbanization should be strengthened, especially in the eastern region and central region, to eliminate the high pollution and carbon emissions brought by traditional urbanization construction. Specifically, the new urbanization should, on the one hand, strengthen the urbanization of population, not only the migration of population from rural to urban areas, but more importantly, the overall improvement in production and living consumption levels, and, on the other hand, strengthen the rationalization of planning so that development is not at the expense of environment Development of special industries according to local conditions, etc. should be encouraged.


