
Spatial and Temporal Distribution and the Driving Factors of Carbon Emissions from Urban Production Energy Consumption

Abstract
:1. Introduction
2. Literature Review
3. Materials and Methods
3.1. Carbon Emission Calculation
3.1.1. Carbon Emission Quantity Calculation
3.1.2. Carbon Emission Intensity Calculation
3.2. Dagum Gini Coefficient
3.3. Kernel Density Estimation
3.4. Carbon Emission Classification
3.5. Model Setting
- (1)
- Spatial error model (SEM)
- (2)
- Spatial lag model (SLM)
- (3)
- Spatial Durbin Model (SDM)
3.6. Explanatory Variables Selection and Description
- (1)
- Urban economic level. The transformation of industrial structure can be realized through the upgrading of industrial structure and the rationalization of industrial structure to reduce carbon emissions, so industrial structure is an important influencing factor of carbon emissions [57,58]. Foreign direct investment (FDI) has a significant spatial correlation with carbon emissions, and FDI has a significant impact on the carbon emission intensity of local and surrounding areas [59]. Therefore, the industrial structure (IS) and foreign direct investment (FDI) were selected to reflect the urban economic level. The proportion of value added in the secondary industry to GDP was used to measure the industrial structure.
- (2)
- Living standard of urban residents. Wen and Zhang found that per capita disposable income has a significant impact on carbon emissions [60]. Therefore, the per capita disposable income (PCDI) and per capita consumption expenditure (PCCE) in urban areas were chosen to reflect the living standard of urban residents, and, among them, per capita consumption expenditure replaced per capita disposable income for test robustness.
- (3)
- Urban energy consumption level. Studies have shown that the high proportion of coal consumption in China directly determines the energy consumption structure, which, in turn, is the driving factor of carbon emissions [61]. Therefore, the energy consumption structure (ECS) was chosen to reflect the urban energy consumption level. Coal is the main source of CO2 emissions, and the proportion of coal consumption to total energy consumption was used to measure the energy consumption structure.
- (4)
- Urban population size. As the main body of economic development, the population structure has a profound impact on carbon emissions. Labor force and dependency ratio are important demographic indicators, and have significant space differences in the impact of carbon emissions [62]. In addition, studies have shown that the population density of contribution to carbon emissions is high in the short-term and long-term, and population density is a non-negligible factor affecting carbon emission [63,64]. Therefore, the dependency ratio of elderly population (DREP) and population density (PD) were selected to reflect urban population size.
- (5)
- Urban development level. Studies have shown that the green coverage of built-up areas has a significant impact on provincial carbon emissions in China [65]. The spatial imbalance of per capita carbon dioxide level in China is obvious, and the urbanization rate is an important driving factor of carbon emissions [66]. Through the study of BRICS countries (Brazil, India, China, etc.), it was found that education level has a significant effect on carbon emissions, which can play a role in environmental quality [67], and scientific and technological innovation can affect carbon emissions by improving the energy intensity of high-tech industries [68]. Therefore, the green coverage rate of built-up area (GCR), urbanization rate (UR), cultural level (CL) and scientific and technological innovation (STI) were selected to reflect urban development level.
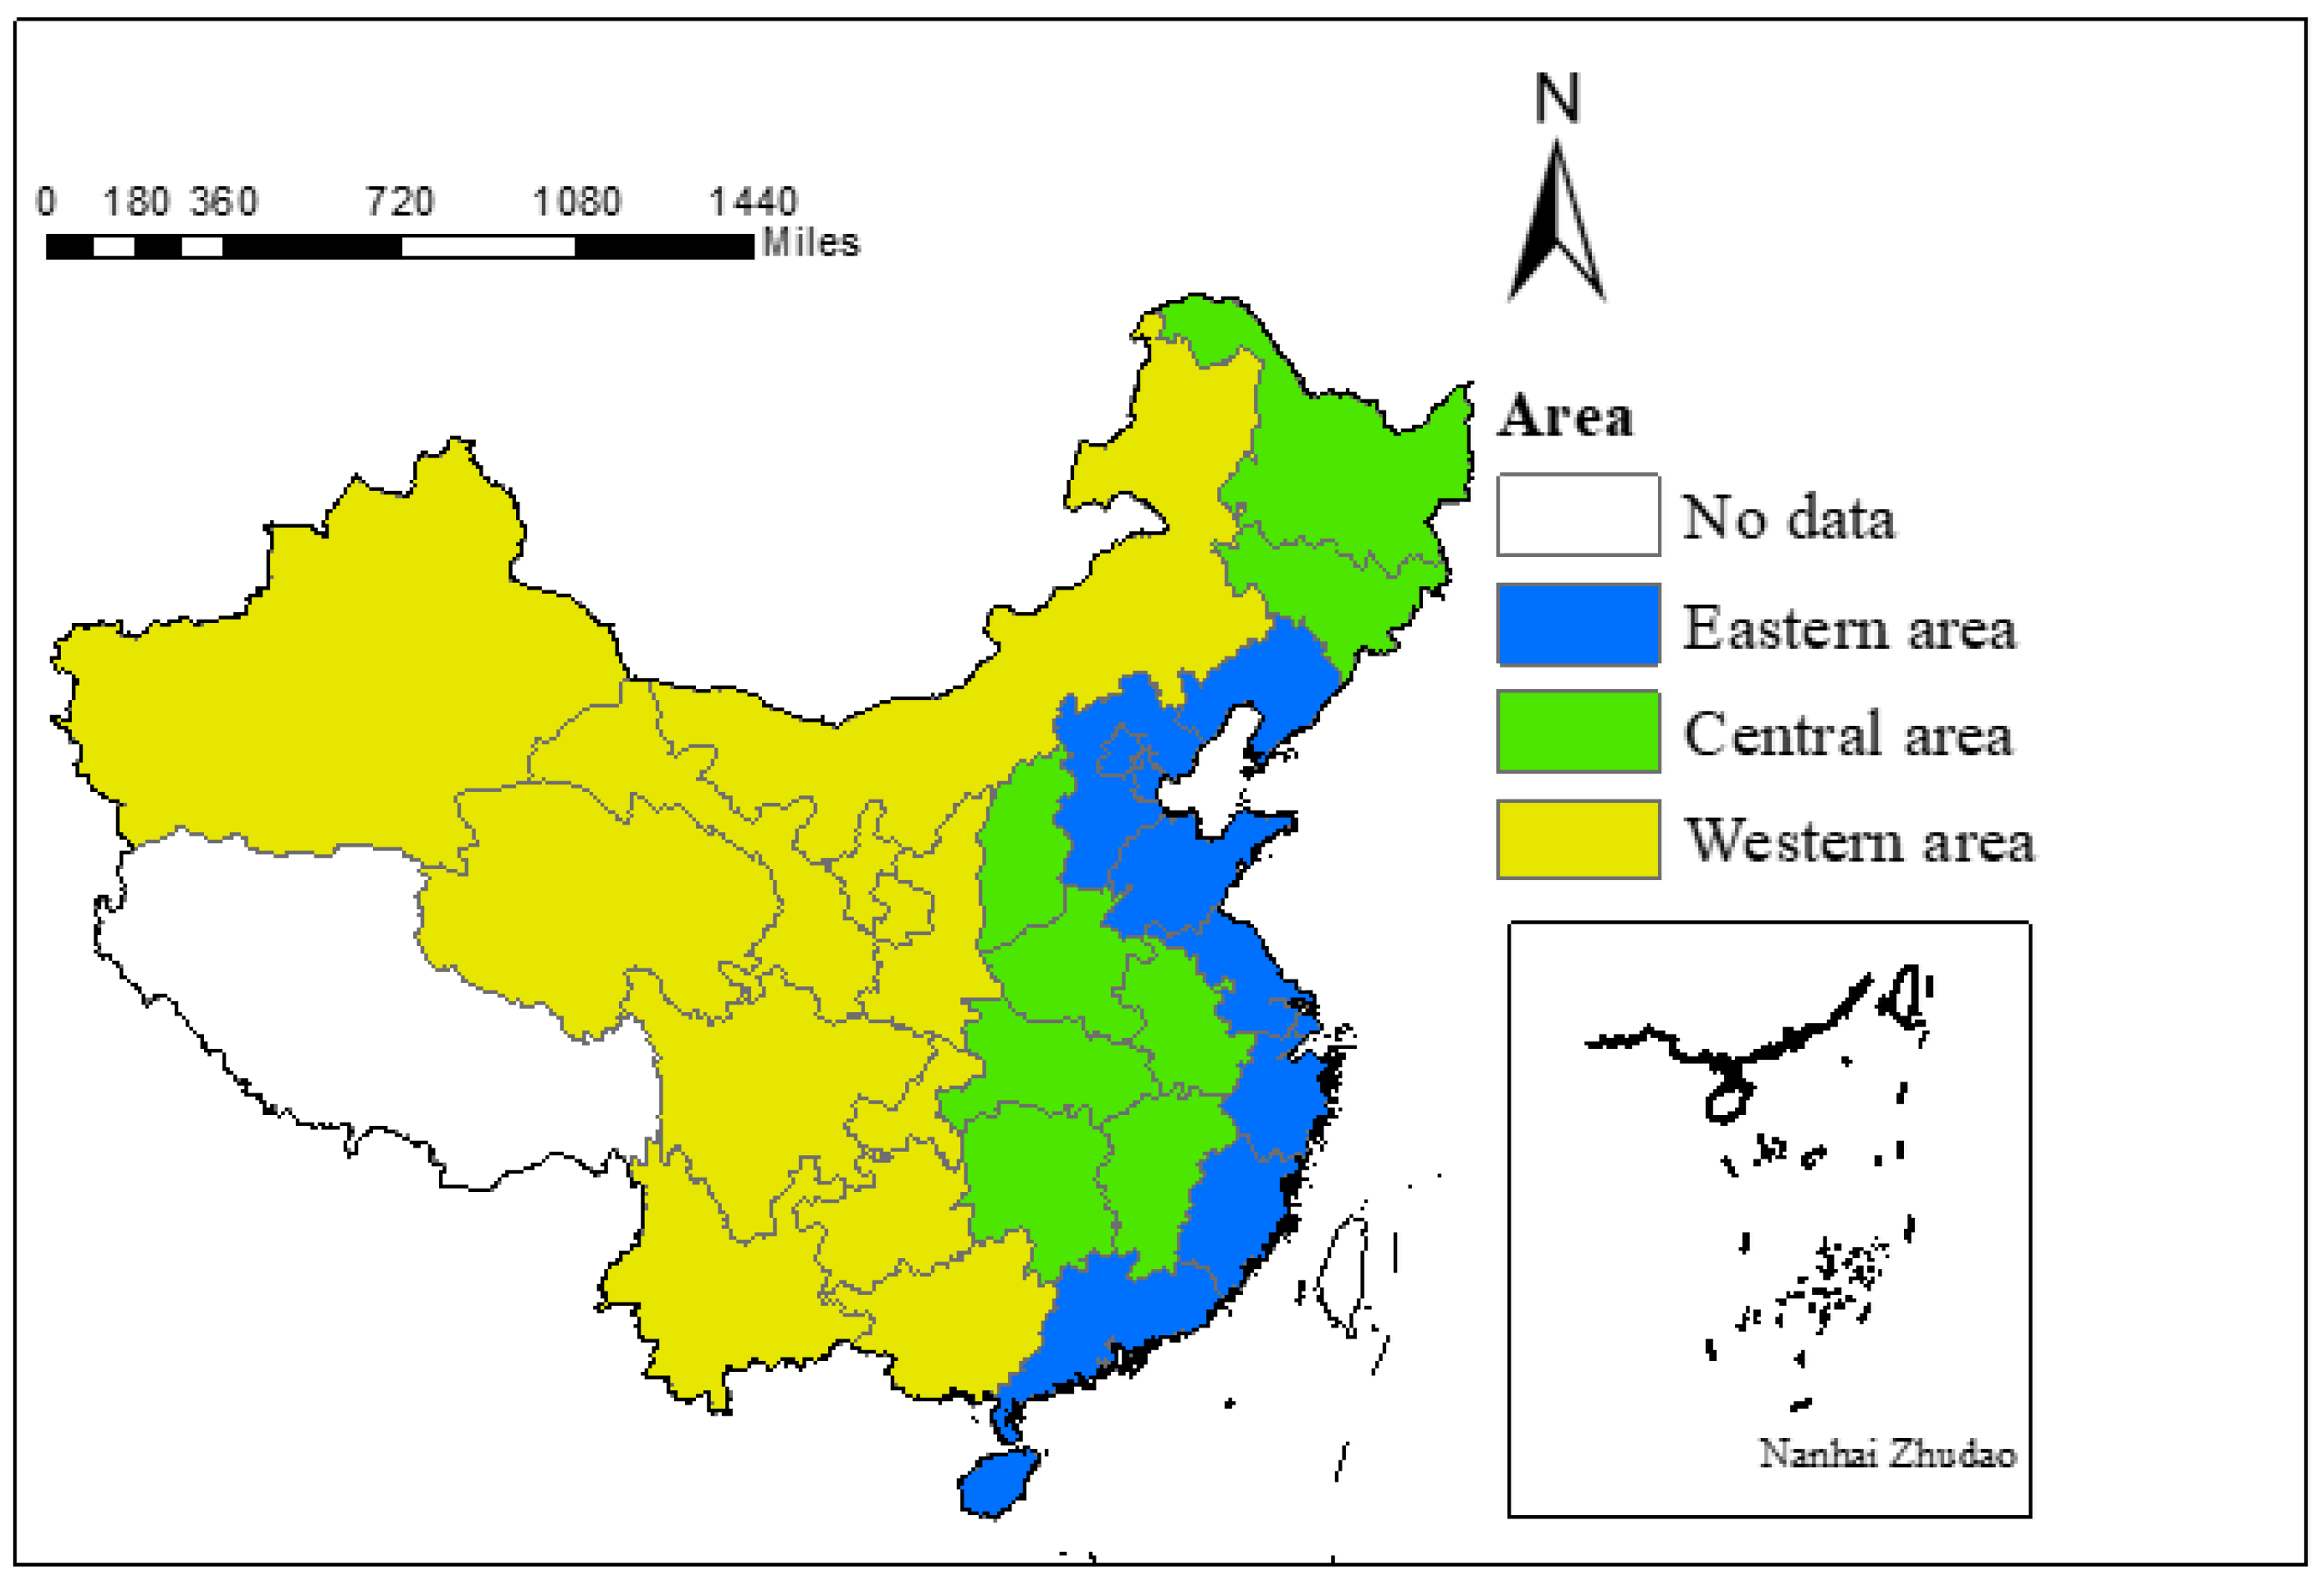
3.7. Research Area
4. Results and Discussion
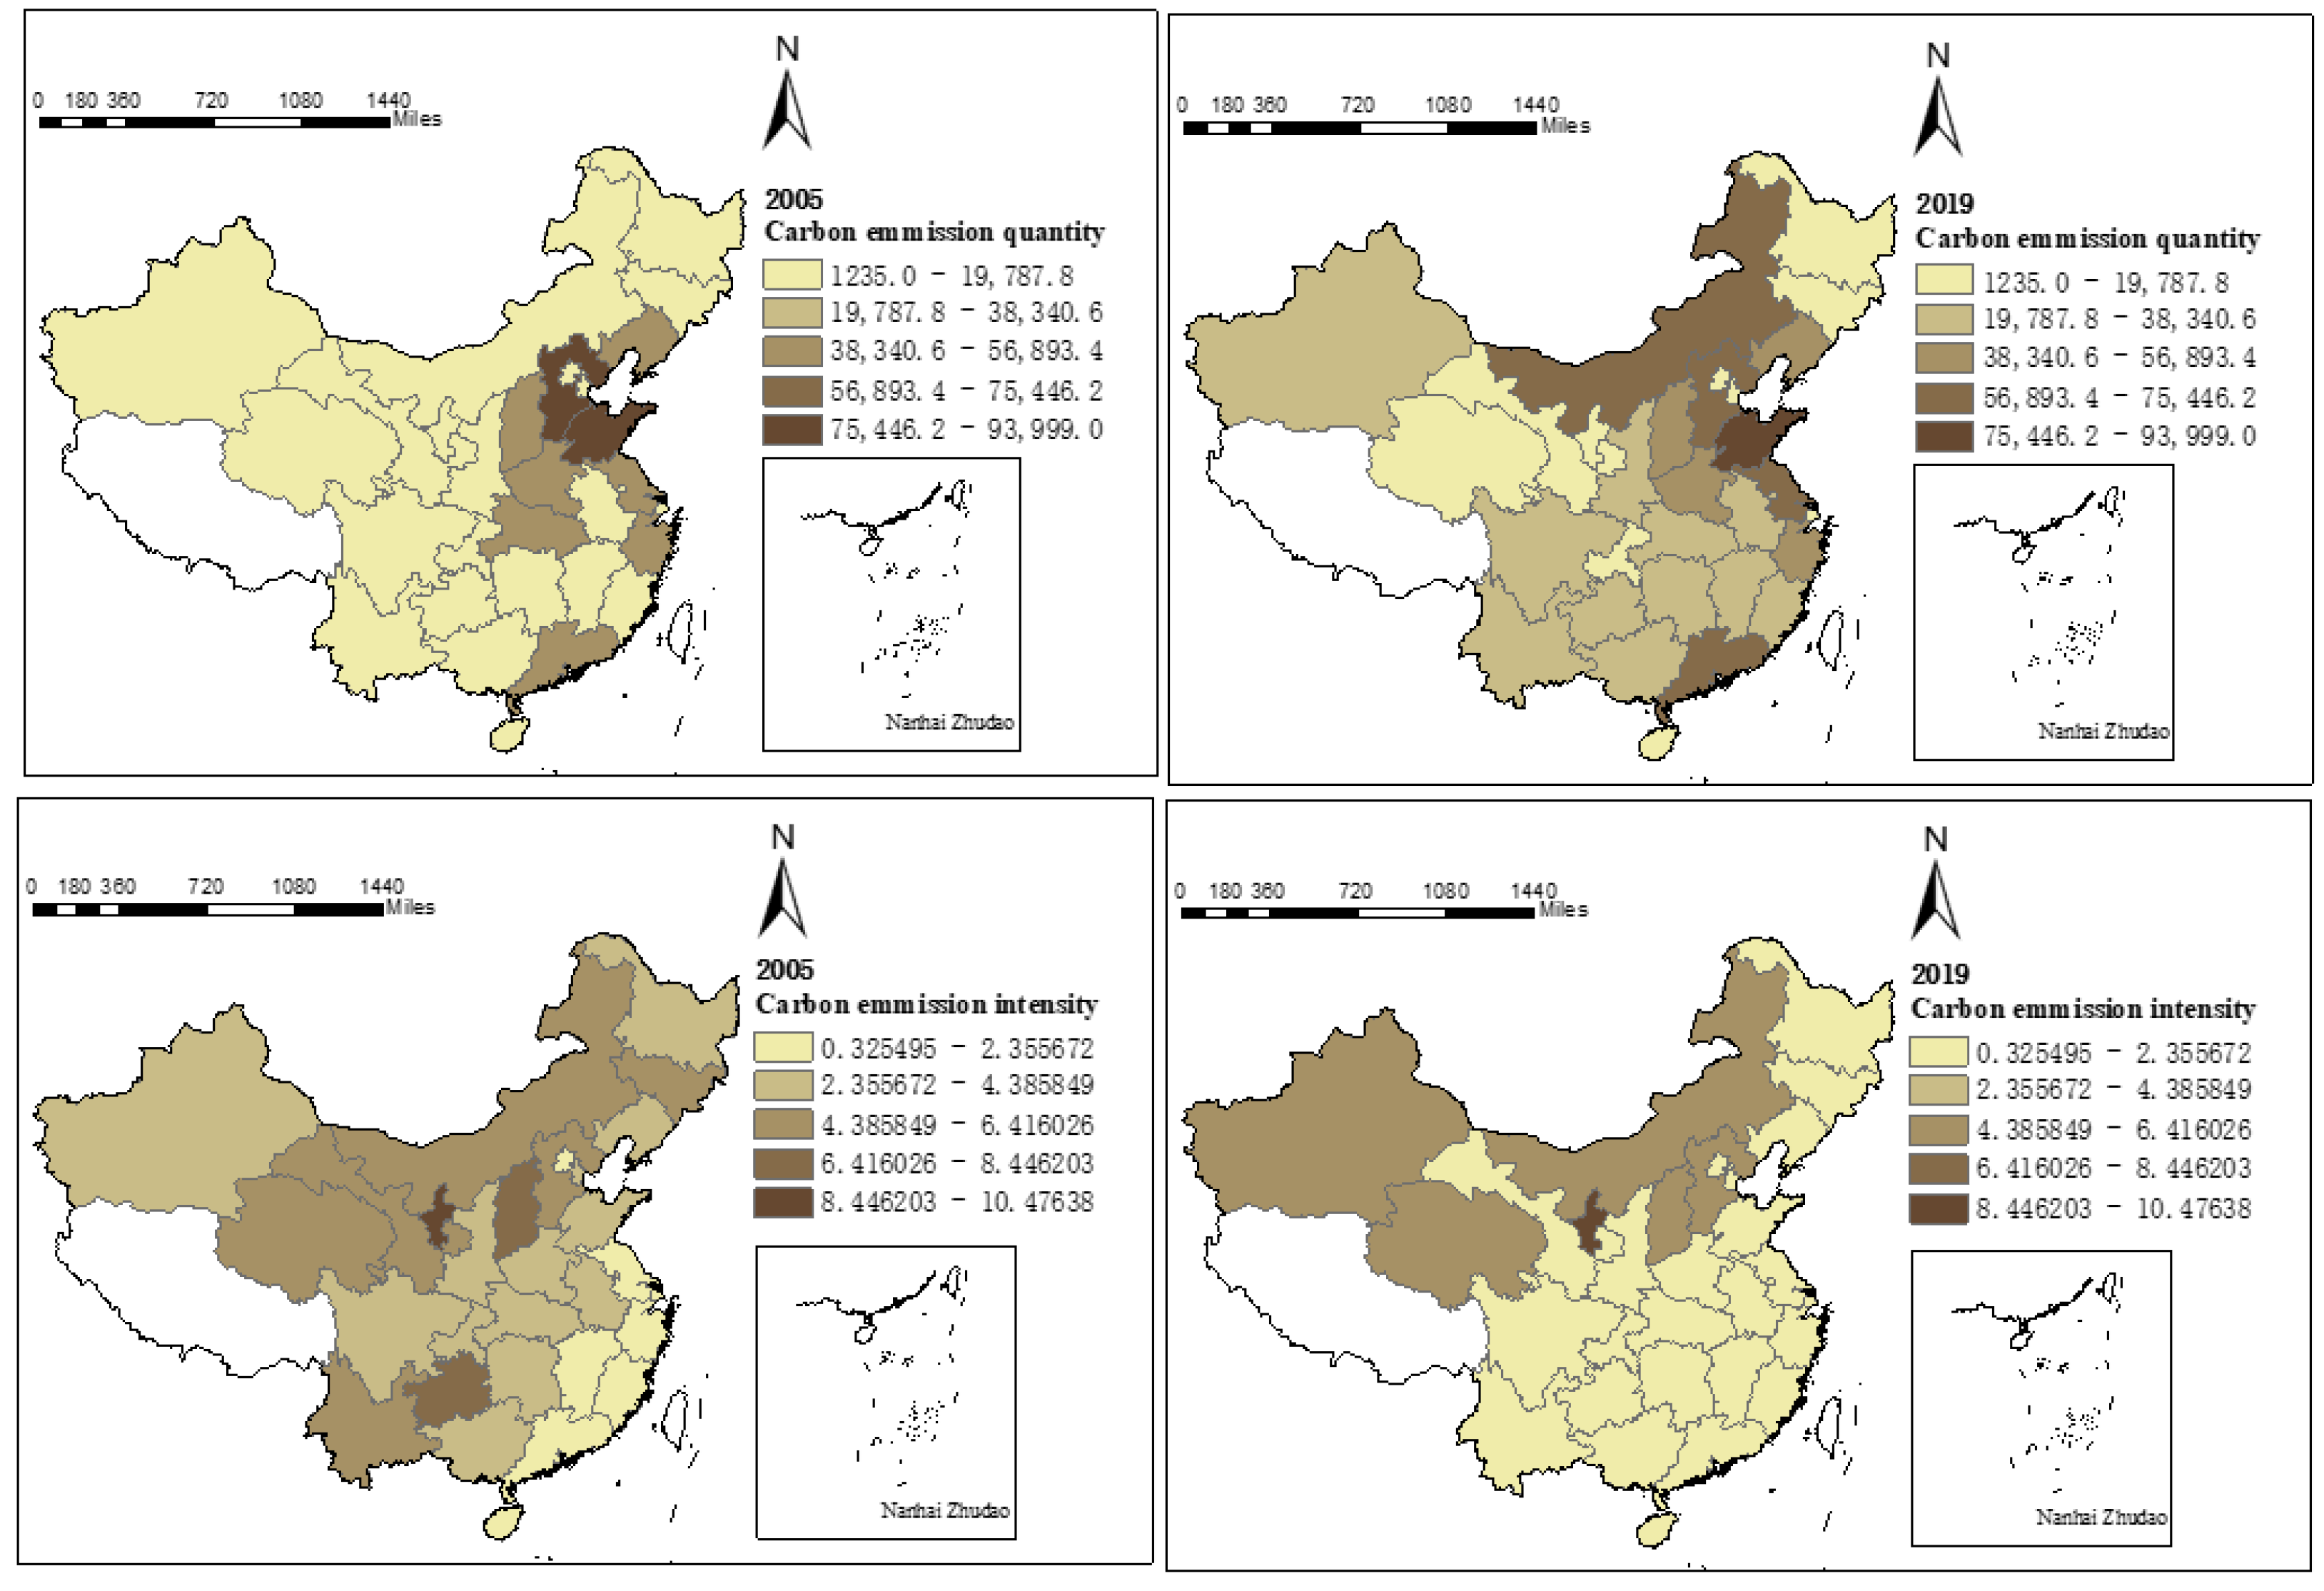
4.1. Spatial and Temporal Distribution of Carbon Emissions from Urban Production Energy Consumption
4.1.1. Spatial Distribution of Carbon Emissions
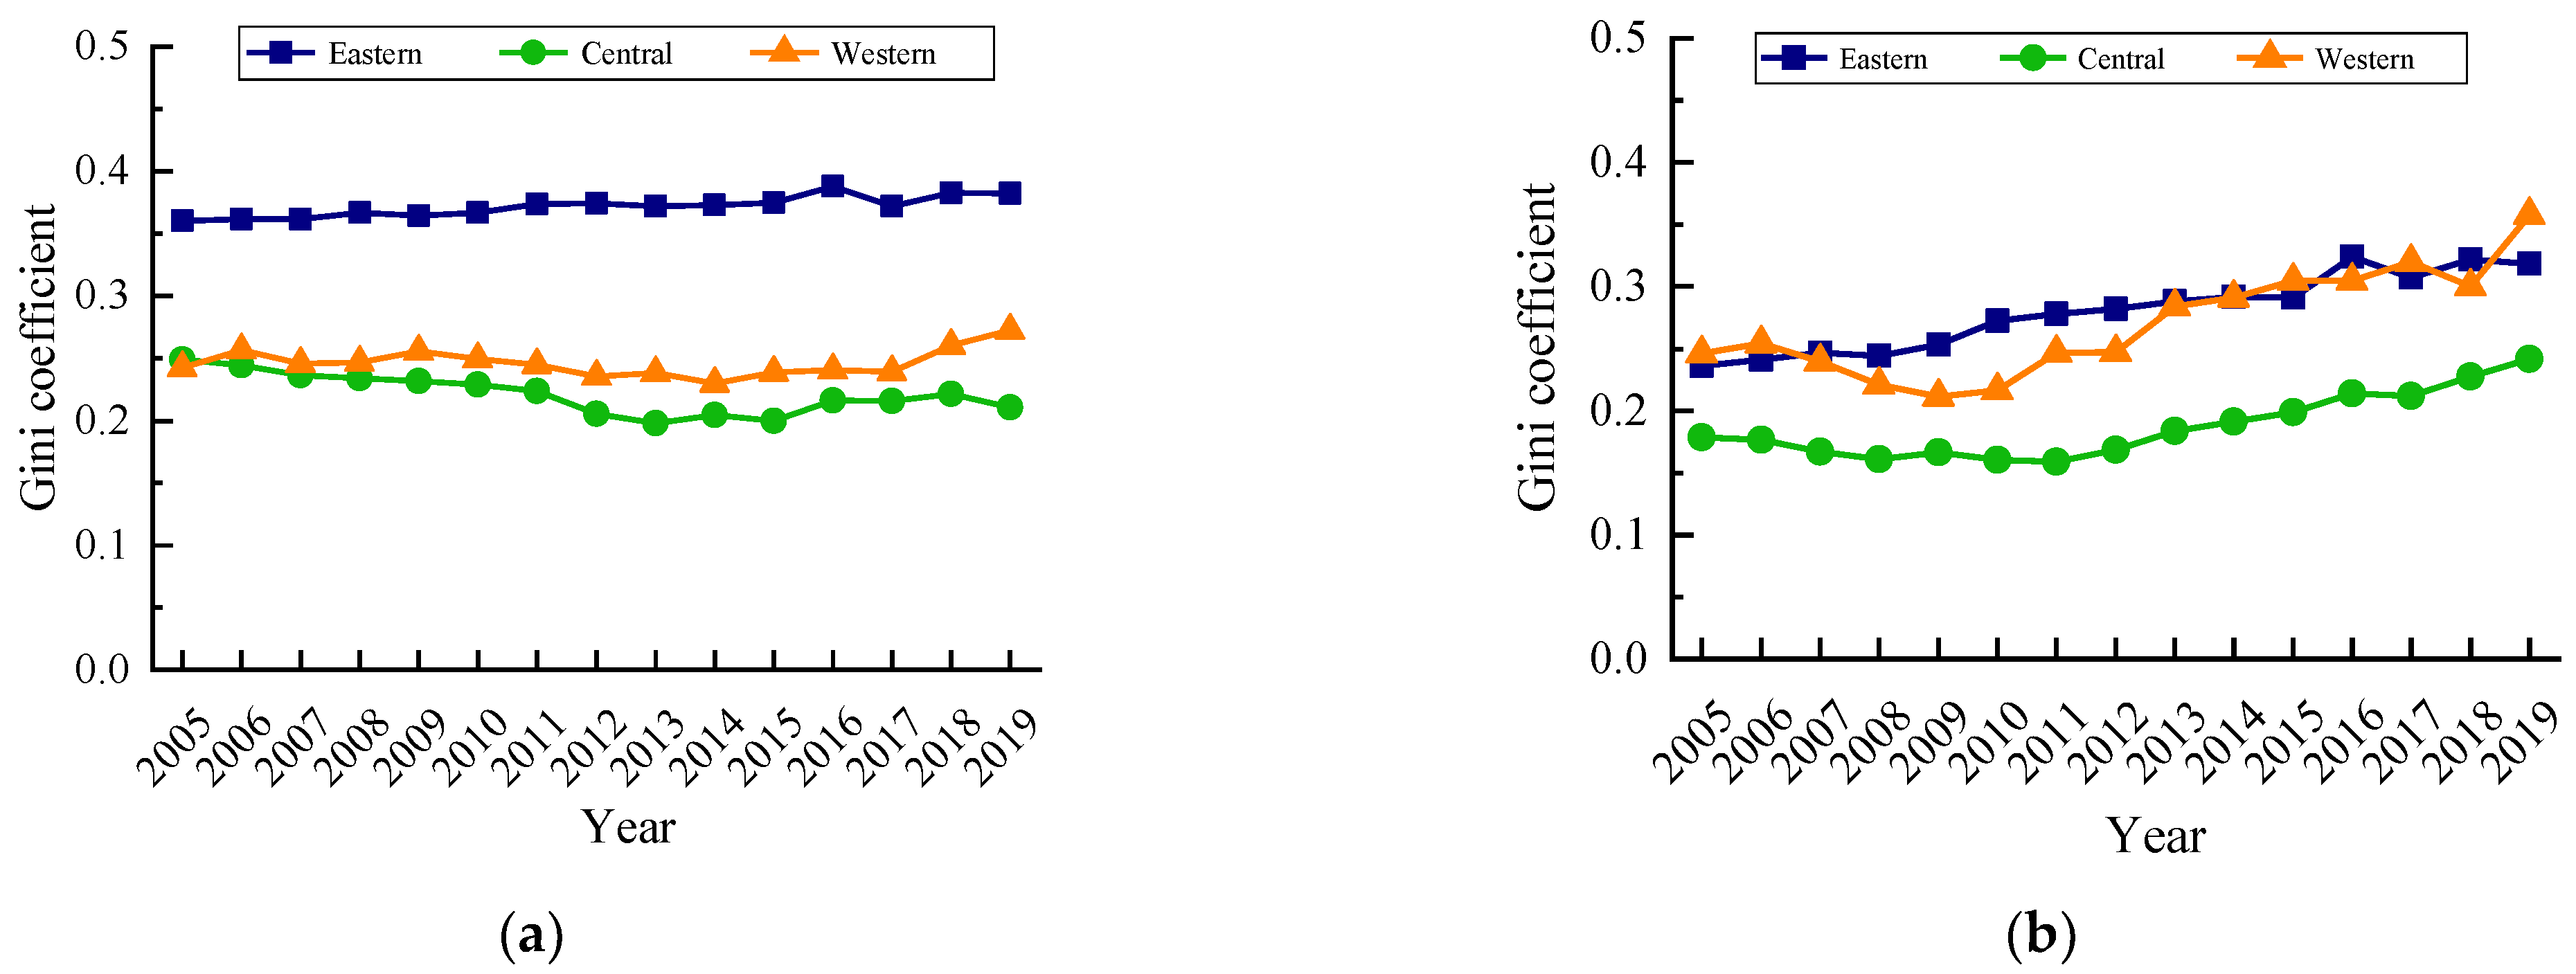
4.1.2. Analysis of Regional Differences in Carbon Emissions
- (1)
- Overall differences
- (2)
- Intra-regional differences
- (3)
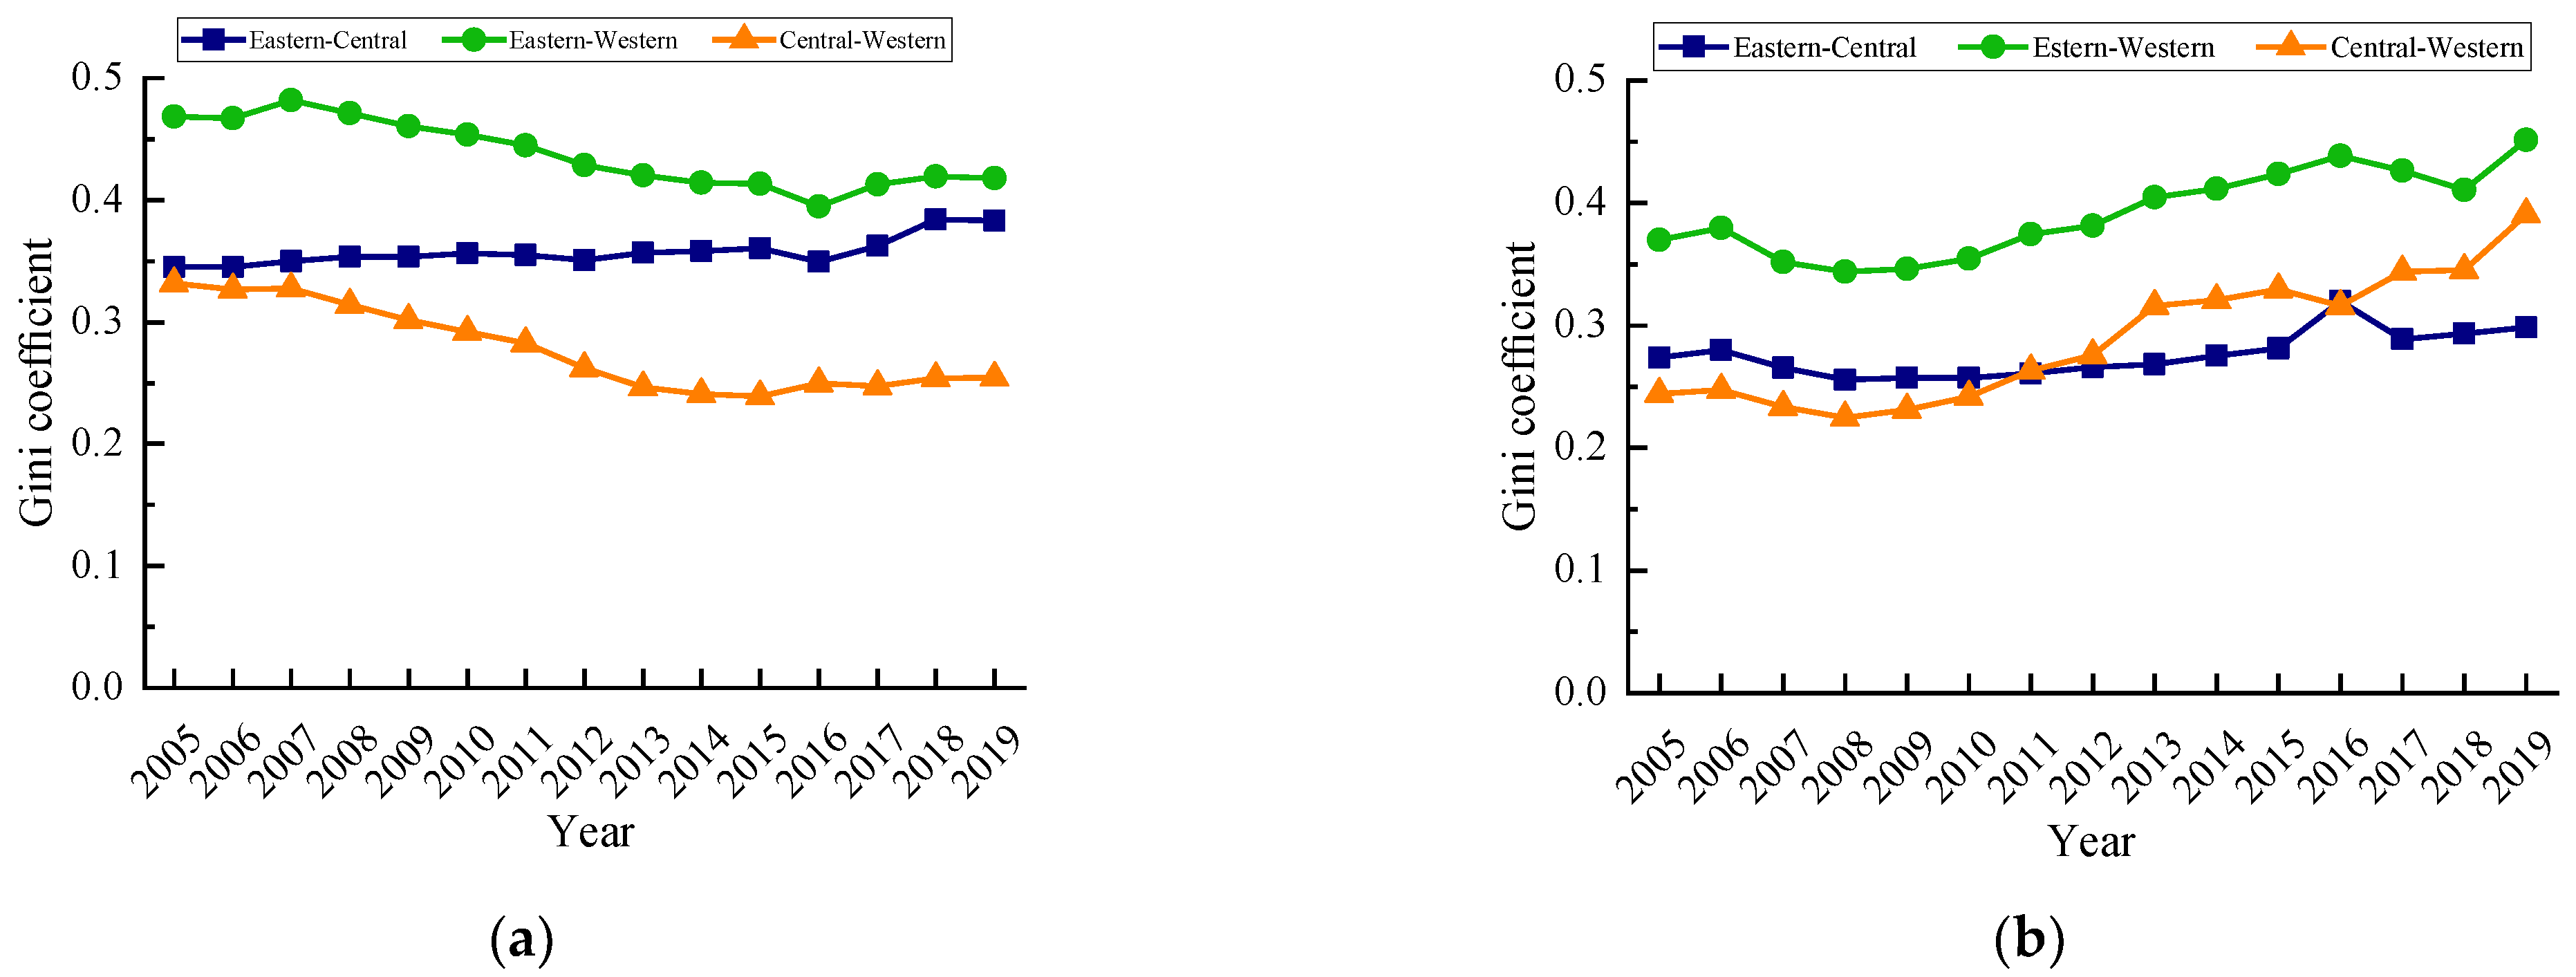
- Inter-regional differences
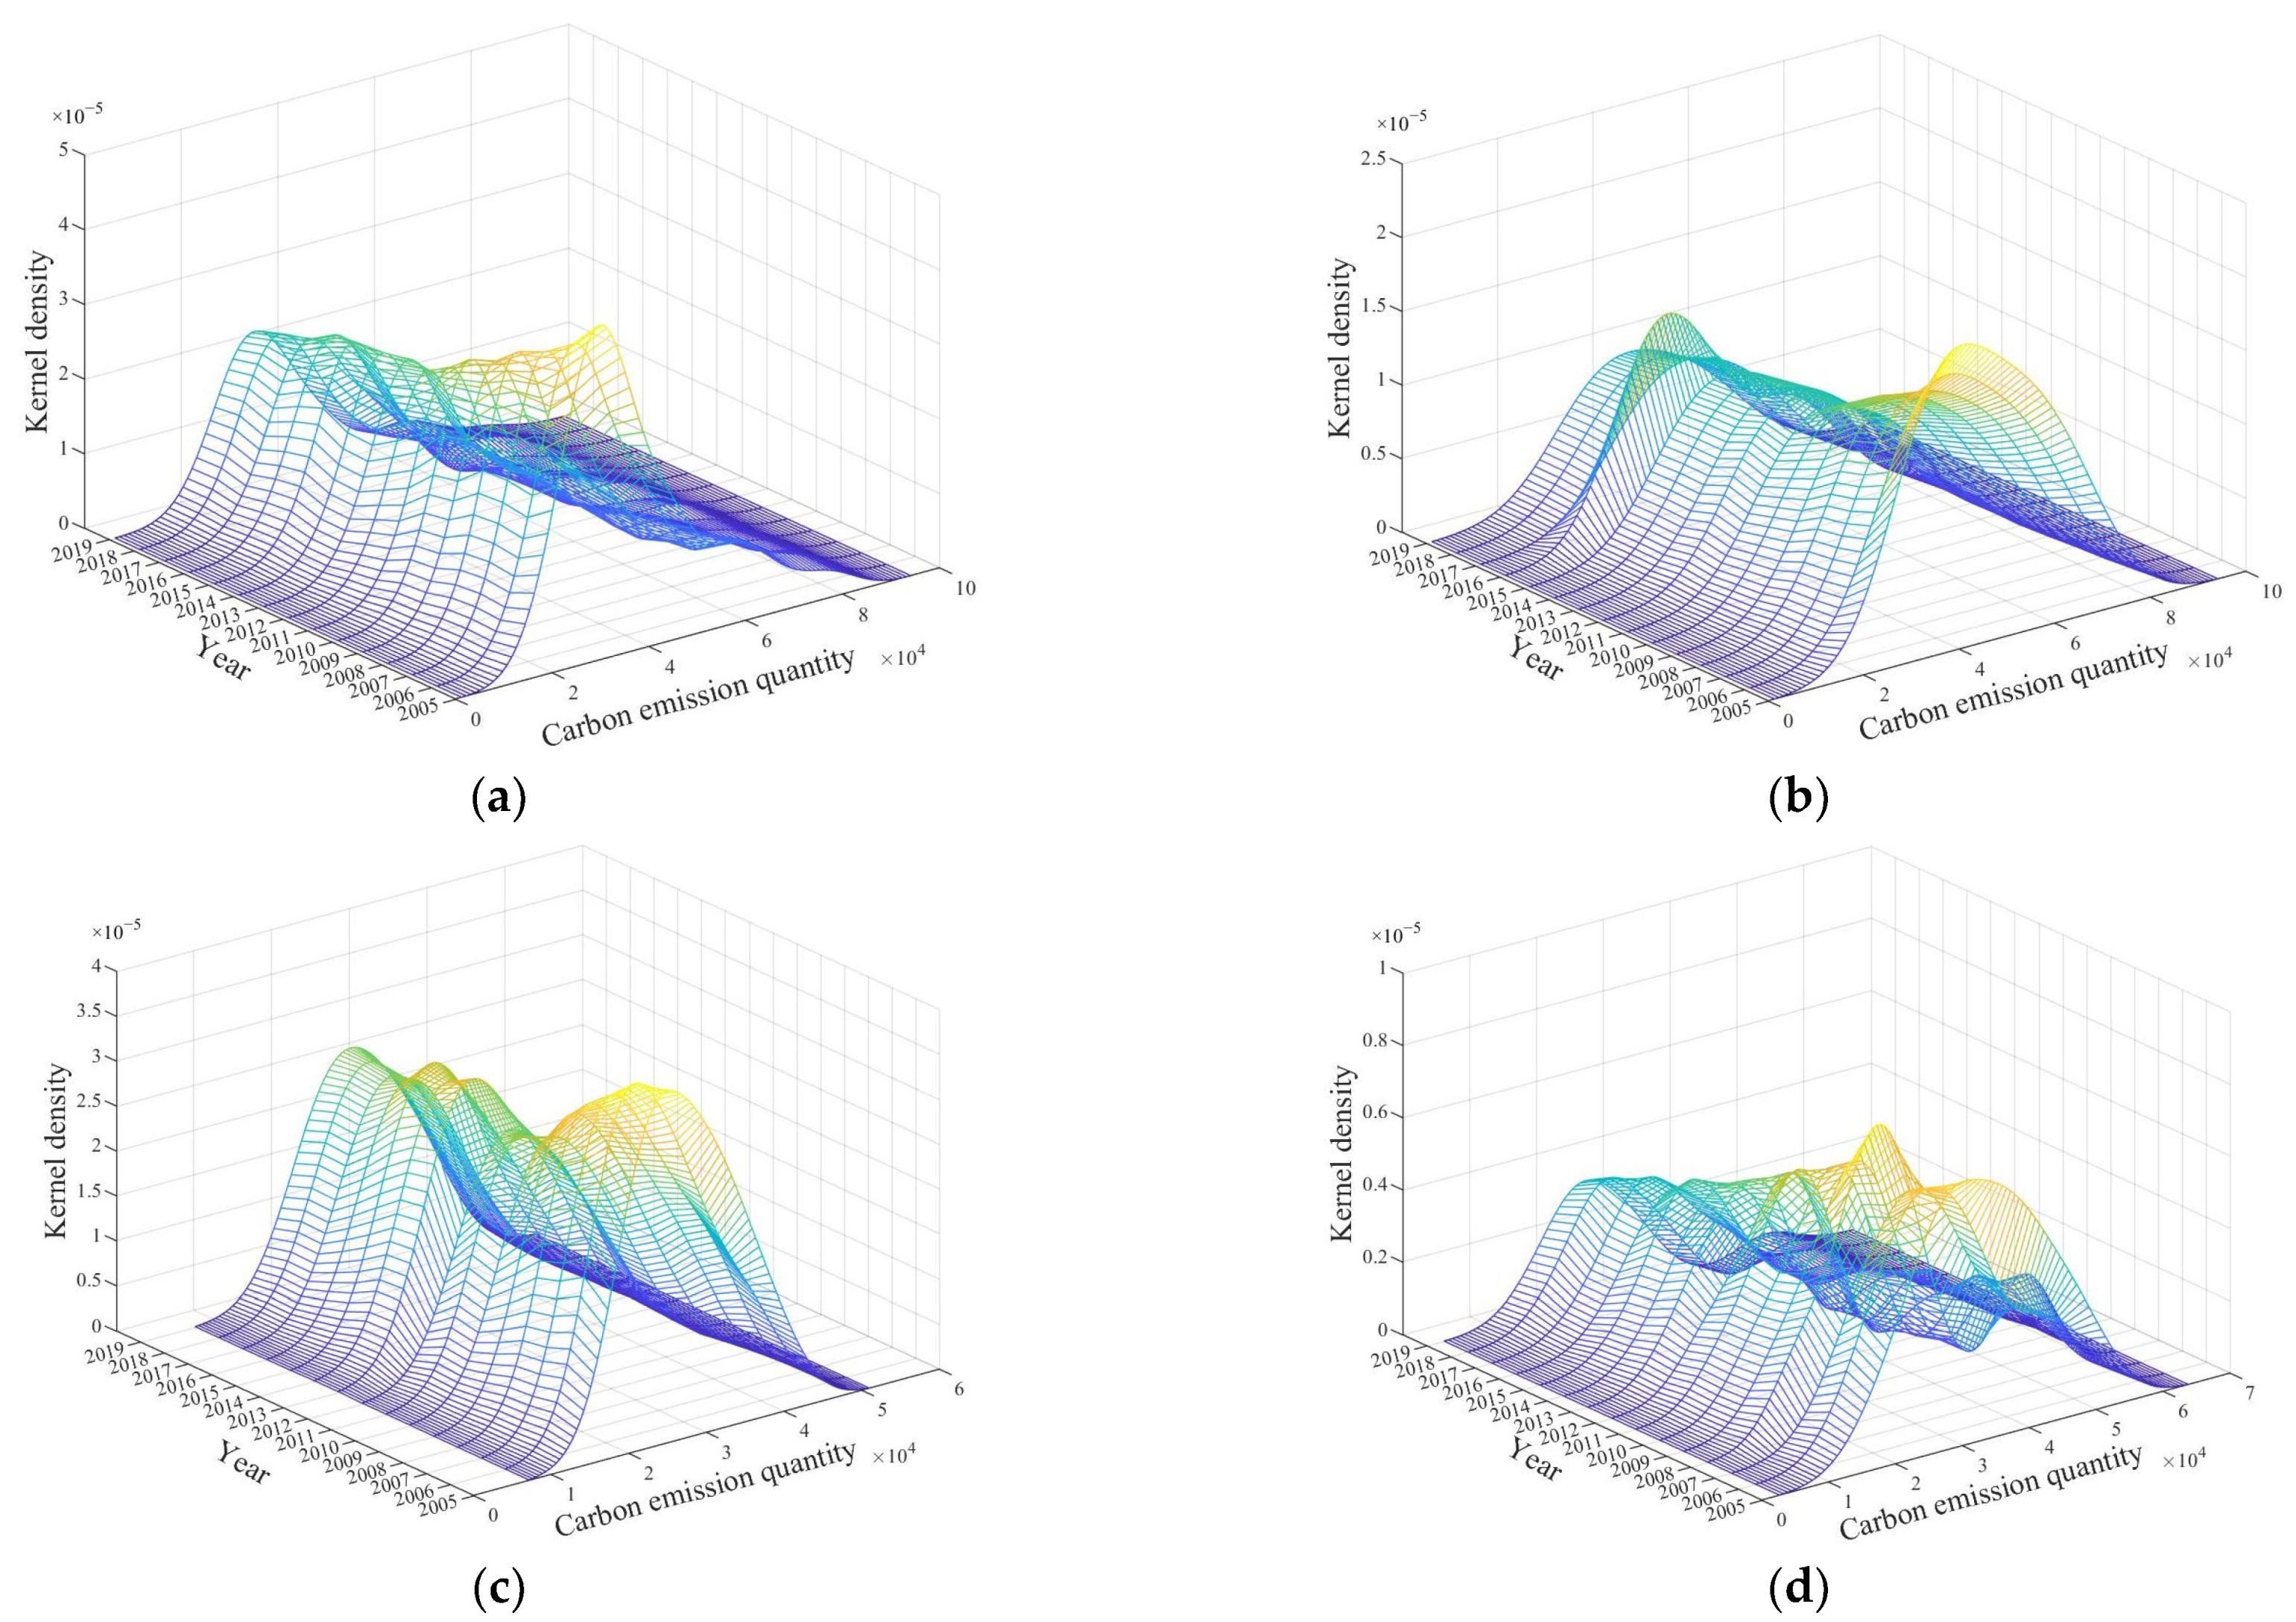
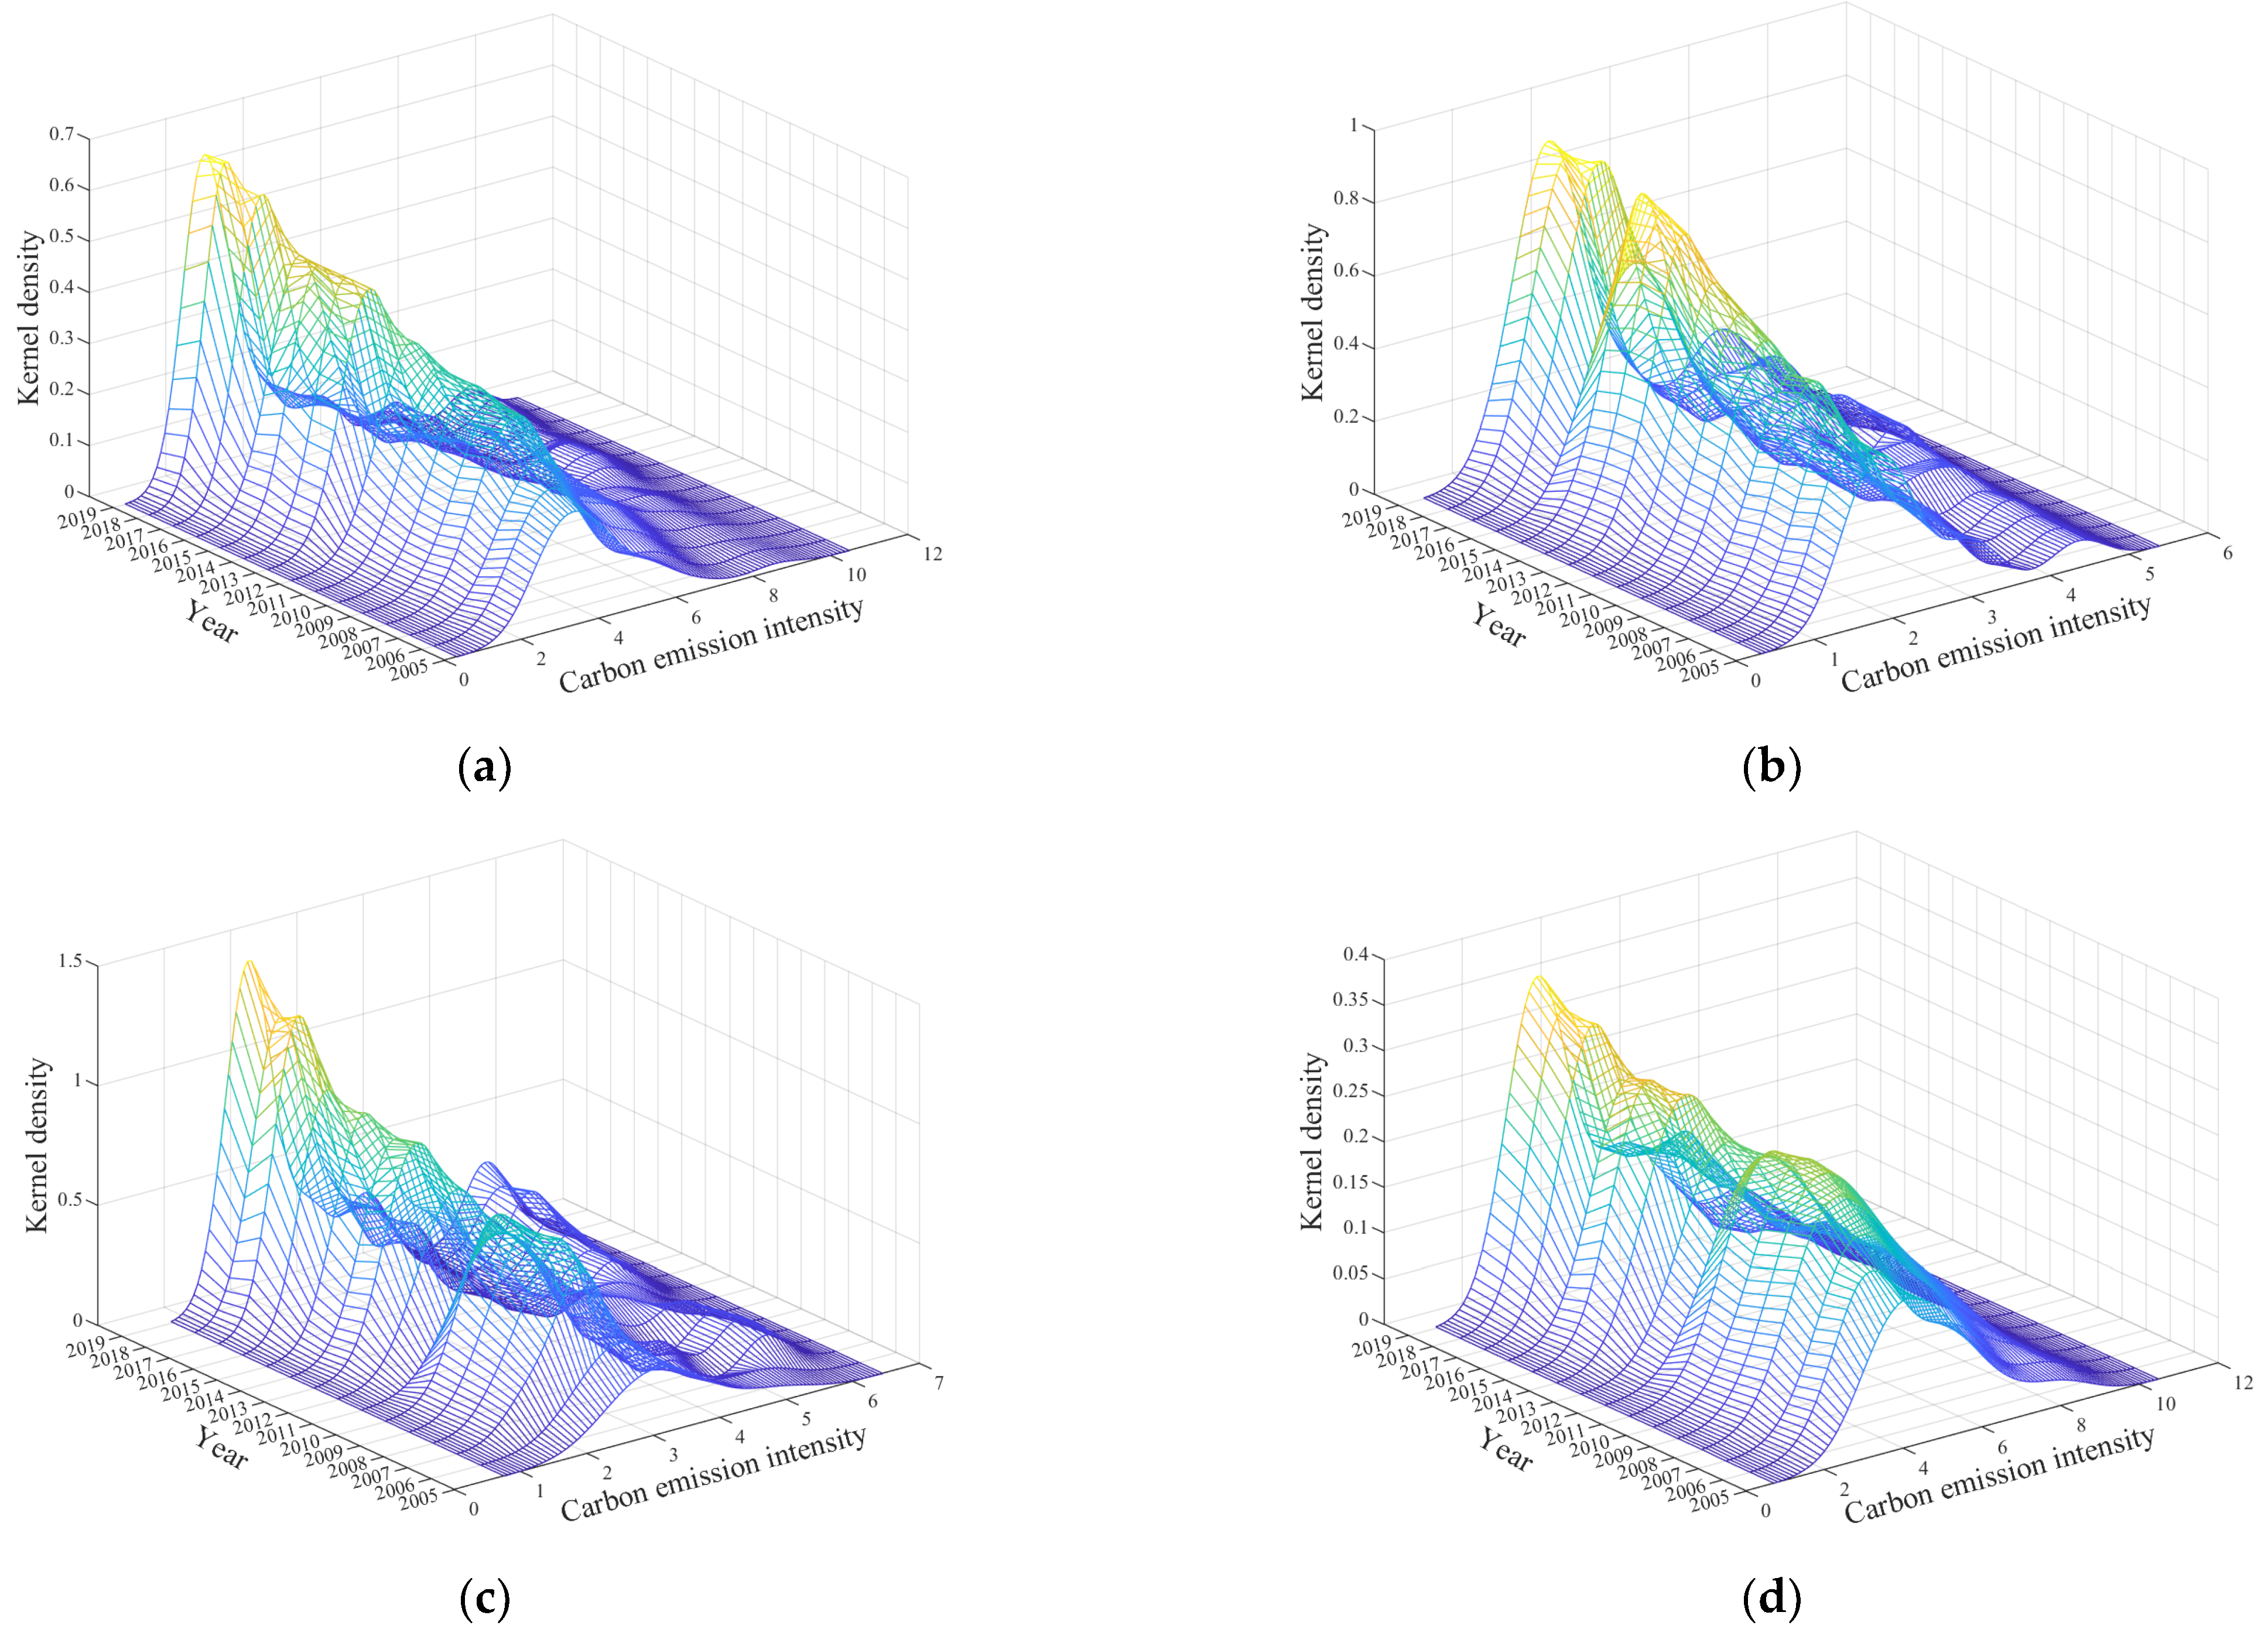
4.1.3. The Evolution of Carbon Emission Dynamics of Urban Production Energy Consumption
- (1)
- The evolution of carbon emission quantity dynamics
- (2)
- The evolution of carbon emission intensity dynamics
4.2. Carbon Emission Classification of Urban Production Energy Consumption
4.3. Analysis of Driving Factors of Carbon Emission from Production Energy Consumption
4.3.1. Analysis of the Driving Factors of Carbon Emissions from Urban Production Energy Consumption from a National Perspective
4.3.2. Analysis of the Driving Factors of Carbon Emissions from Urban Production Energy Consumption in a Regional Perspective
4.3.3. Test for Robustness
5. Conclusions
6. Policy Suggestions
Author Contributions
Funding
Institutional Review Board Statement
Informed Consent Statement
Data Availability Statement
Conflicts of Interest
References
- Sun, B.; Jiang, M.; Han, G.; Zhang, L.; Zhou, J.; Bian, C.; Du, Y.; Yan, L.; Xia, J. Experimental warming reduces ecosystem resistance and resilience to severe flooding in a wetland. Sci. Adv. 2022, 8, eabl9526. [Google Scholar] [CrossRef] [PubMed]
- Shahar, D. Harm, Responsibility, and the Far-off Impacts of Climate Change. Environ. Ethics 2021, 43, 3–20. [Google Scholar] [CrossRef]
- Nuccitelli, D. How we know the Earth is warming and humans are responsible. Bull. At. Sci. 2020, 76, 140–144. [Google Scholar] [CrossRef]
- Cordroch, L.; Hilpert, S.; Wiese, F. Why renewables and energy efficiency are not enough-the relevance of sufficiency in the heating sector for limiting global warming to 1.5 °C. Technol. Forecast. Soc. Chang. 2022, 175, 121313. [Google Scholar] [CrossRef]
- Sun, L.; Cui, H.; Ge, Q. Will China achieve its 2060 carbon neutral commitment from the provincial perspective? Adv. Clim. Change Res. 2022, 13, 169–178. [Google Scholar] [CrossRef]
- Dingbang, C.; Cang, C.; Qing, C.; Lili, S.; Caiyun, C. Does new energy consumption conducive to controlling fossil energy consumption and carbon emissions?—Evidence from China. Resour. Policy 2021, 74, 102427. [Google Scholar] [CrossRef]
- Huang, J.; Wen, C. The impact of private sector energy investment, innovation and energy consumption on China’s carbon emissions. Renew. Energ. 2022, 195, 1291–1299. [Google Scholar]
- Tang, X.; Snowden, S.; McLellan, B.C.; Höök, M. Clean coal use in China: Challenges and policy implications. Energy Policy 2015, 87, 517–523. [Google Scholar] [CrossRef]
- Wang, Z.; Zhu, Y.; Zhu, Y.; Shi, Y. Energy structure change and carbon emission trends in China. Energy 2016, 115, 369–377. [Google Scholar] [CrossRef]
- Xu, G.; Schwarz, P.; Yang, H. Adjusting energy consumption structure to achieve China’s CO2 emissions peak. Renew. Sustain. Energy Rev. 2020, 122, 109737. [Google Scholar] [CrossRef]
- Wang, S.; Zhou, C.; Li, G.; Feng, K. CO2, economic growth, and energy consumption in China’s provinces: Investigating the spatiotemporal and econometric characteristics of China’s CO2 emissions. Ecol. Indic. 2016, 69, 184–195. [Google Scholar] [CrossRef]
- Liu, H.; Han, B.; Wang, L. Modeling the spatial relationship between urban ecological resources and the economy. J. Clean. Prod. 2018, 173, 207–216. [Google Scholar] [CrossRef]
- Wang, Y.; Yang, G.; Dong, Y.; Cheng, Y.; Shang, P. The scale, structure and influencing factors of total carbon emissions from households in 30 provinces of China—Based on the extended STIRPAT model. Energies 2018, 11, 1125. [Google Scholar] [CrossRef]
- Li, X.; Chalvatzis, K.J.; Pappas, D. China’s electricity emission intensity in 2020–an analysis at provincial level. Energy Procedia 2017, 142, 2779–2785. [Google Scholar] [CrossRef]
- Xu, B.; Lin, B. How industrialization and urbanization process impacts on CO2 emissions in China: Evidence from nonparametric additive regression models. Energy Econ. 2015, 48, 188–202. [Google Scholar] [CrossRef]
- Lowsen, D.H.; Conway, G.A. Air pollution in major Chinese cities: Some Progress, but much more to do. J. Environ. Prot. 2016, 7, 2081–2094. [Google Scholar] [CrossRef]
- Tan, Z.; Koondhar, M.A.; Nawaz, K.; Malik, M.N.; Khan, Z.A.; Koondhar, M.A. Foreign direct investment, financial development, energy consumption, and air quality: A way for carbon neutrality in China. J. Environ. Manag. 2021, 299, 113572. [Google Scholar] [CrossRef]
- Yuan, X.; Mu, R.; Zuo, J.; Wang, Q. Economic development, energy consumption, and air pollution: A critical assessment in China. Hum. Ecol. Risk Assess. 2015, 21, 781–798. [Google Scholar] [CrossRef]
- Zhang, B.; Wang, S.; Wang, D.; Wang, Q.; Yang, X.; Tong, R. Air quality changes in China 2013–2020: Effectiveness of clean coal technology policies. J. Clean. Prod. 2022, 366, 132961. [Google Scholar] [CrossRef]
- Tang, B.; Li, R.; Li, X.; Chen, H. An optimal production planning model of coal-fired power industry in China: Considering the process of closing down inefficient units and developing CCS technologies. Appl. Energy 2017, 206, 519–530. [Google Scholar] [CrossRef]
- He, W.; Chen, H. Will China’s provincial per capita energy consumption converge to a common level over 1990–2017? Evidence from a club convergence approach. Energy 2022, 249, 123624. [Google Scholar] [CrossRef]
- Shi, H.; Chai, J.; Lu, Q.; Zheng, J.; Wang, S. The impact of China’s low-carbon transition on economy, society and energy in 2030 based on CO2 emissions drivers. Energy 2022, 239, 122336. [Google Scholar] [CrossRef]
- Ma, C.; Liu, J.; Ren, Y.; Jiang, Y. The Impact of economic growth, FDI and energy intensity on China’s manufacturing industry’s CO2 emissions: An empirical study based on the fixed-effect panel quantile regression model. Energies 2019, 12, 4800. [Google Scholar] [CrossRef]
- Wang, Q.; Zeng, Y.; Wu, B. Exploring the relationship between urbanization, energy consumption, and CO2 emissions in different provinces of China. Renew. Sustain. Energy Rev. 2016, 54, 1563–1579. [Google Scholar] [CrossRef]
- Wu, H.; Xu, L.; Ren, S.; Hao, Y.; Yan, G. How do energy consumption and environmental regulation affect carbon emissions in China? New evidence from a dynamic threshold panel model. Resour. Policy 2020, 67, 101678. [Google Scholar] [CrossRef]
- Chen, L.; Chen, S. The estimation of environmental Kuznets curve in China: Nonparametric panel approach. Comput. Econ. 2015, 46, 405–420. [Google Scholar] [CrossRef]
- Zhao, X.; Jiang, M.; Zhang, W. Decoupling between Economic Development and Carbon Emissions and Its Driving Factors: Evidence from China. Int. J. Environ. Res. Public Health 2022, 19, 2893. [Google Scholar] [CrossRef]
- Tang, Y.; Zhu, H.; Yang, J. The asymmetric effects of economic growth, urbanization and deindustrialization on carbon emissions: Evidence from China. Energy Rep. 2022, 8, 513–521. [Google Scholar] [CrossRef]
- Xu, S.; He, Z.; Long, R.; Chen, H. Factors that influence carbon emissions due to energy consumption based on different stages and sectors in China. J. Clean. Prod. 2016, 115, 139–148. [Google Scholar] [CrossRef]
- Li, W.; Sun, W.; Li, G.; Jin, B.; Wu, W.; Cui, P.; Zhao, G. Transmission mechanism between energy prices and carbon emissions using geographically weighted regression. Energy Policy 2018, 115, 434–442. [Google Scholar] [CrossRef]
- Shen, L.; Wu, Y.; Lou, Y.; Zeng, D.; Shuai, C.; Song, X. What drives the carbon emission in the Chinese cities?—A case of pilot low carbon city of Beijing. J. Clean. Prod. 2018, 174, 343–354. [Google Scholar] [CrossRef]
- Guo, W.; Sun, T.; Dai, H. Effect of population structure change on carbon emission in China. Sustainability 2016, 8, 225. [Google Scholar] [CrossRef]
- Duan, H.; Chen, S.; Song, J. Characterizing regional building energy consumption under joint climatic and socioeconomic impacts. Energy 2022, 245, 123290. [Google Scholar] [CrossRef]
- Mi, Z.; Zheng, J.; Meng, J.; Ou, J.; Hubacek, K.; Liu, Z.; Coffman, D.; Stern, N.; Liang, S.; Wei, Y.M. Economic development and converging household carbon footprints in China. Nat. Sustain. 2020, 3, 529–537. [Google Scholar] [CrossRef]
- Dong, F.; Li, J.; Zhang, S.; Wang, Y.; Sun, Z. Sensitivity analysis and spatial-temporal heterogeneity of CO2 emission intensity: Evidence from China. Resour. Conserv. Recycl. 2019, 150, 104398. [Google Scholar] [CrossRef]
- Dong, F.; Yu, B.; Hadachin, T.; Dai, Y.; Wang, Y.; Zhang, S.; Long, R. Drivers of carbon emission intensity change in China. Resour. Conserv. Recycl. 2018, 129, 187–201. [Google Scholar] [CrossRef]
- Huo, T.; Cao, R.; Xia, N.; Hu, X.; Cai, W.; Liu, B. Spatial correlation network structure of China’s building carbon emissions and its driving factors: A social network analysis method. J. Environ. Manag. 2022, 320, 115808. [Google Scholar] [CrossRef]
- Jin, B.; Han, Y. Influencing factors and decoupling analysis of carbon emissions in China’s manufacturing industry. Environ. Sci. Pollut. Res. 2021, 28, 64719–64738. [Google Scholar] [CrossRef]
- Wang, W.; Chen, H.; Wang, L.; Li, X.; Mao, D.; Wang, S. Exploration of Spatio-Temporal Characteristics of Carbon Emissions from Energy Consumption and Their Driving Factors: A Case Analysis of the Yangtze River Delta, China. Int. J. Environ. Res. Public Health. 2022, 19, 9483. [Google Scholar] [CrossRef]
- Zhang, Y.; Bai, H.; Hou, H.; Zhang, Y.; Xu, H.; Ji, Y.; He, G.; Zhang, Y. Exploring the consumption-based carbon emissions of industrial cities in China: A case study of Tianjin. Environ. Sci. Pollut. Res. 2021, 28, 26948–26960. [Google Scholar] [CrossRef]
- Ma, X.; Wang, M.; Lan, J.; Li, C.; Zou, L. Influencing factors and paths of direct carbon emissions from the energy consumption of rural residents in central China determined using a questionnaire survey. Adv. Clim. Chang. Res. 2022, in press. [Google Scholar] [CrossRef]
- Chen, L.; Yi, L.; Cai, R.; Yang, H. Spatiotemporal Characteristics of the Correlation among Tourism, CO2 Emissions, and Economic Growth in China. Sustainability 2022, 14, 8373. [Google Scholar] [CrossRef]
- Yang, Z.; Sun, H.; Yuan, W.; Xia, X. The Spatial Pattern of the Prefecture-Level Carbon Emissions and Its Spatial Mismatch in China with the Level of Economic Development. Sustainability 2022, 14, 10209. [Google Scholar] [CrossRef]
- Liu, Y.; Yang, M.; Cheng, F.; Tian, J.; Du, Z.; Song, P. Analysis of regional differences and decomposition of carbon emissions in China based on generalized divisia index method. Energy 2022, 256, 124666. [Google Scholar] [CrossRef]
- Wang, Q.; Zhao, C. Regional difference and driving factors of industrial carbon emissions performance in China. Alex. Eng. J. 2021, 60, 301–309. [Google Scholar] [CrossRef]
- Zhang, H.; Li, S. Carbon emissions’ spatial-temporal heterogeneity and identification from rural energy consumption in China. J. Environ. Manag. 2022, 304, 114286. [Google Scholar] [CrossRef] [PubMed]
- Xiao, P.; Zhang, Y.; Qian, P.; Lu, M.; Yu, Z.; Xu, J.; Zhao, C.; Qian, H. Spatiotemporal Characteristics, Decoupling Effect and Driving Factors of Carbon Emission from Cultivated Land Utilization in Hubei Province. Int. J. Environ. Res. Public Health 2022, 19, 9326. [Google Scholar] [CrossRef]
- Zhu, Z.; Yu, J.; Luo, J.; Zhang, H.; Wu, Q.; Chen, Y. A GDM-GTWR-Coupled Model for Spatiotemporal Heterogeneity Quantification of CO2 Emissions: A Case of the Yangtze River Delta Urban Agglomeration from 2000 to 2017. Atmosphere 2022, 13, 1195. [Google Scholar] [CrossRef]
- Qin, J.; Gao, L.; Tu, W.; He, J.; Tang, J.; Ma, S.; Zhao, X.; Zhu, X.; Brindha, K.; Tao, H. Decomposition and Decoupling Analysis of Carbon Emissions in Xinjiang Energy Base, China. Energies 2022, 15, 5526. [Google Scholar] [CrossRef]
- Department of Energy Statistics, National Bureau of Statistics of the People’s Republic of China. China Energy Statistical Yearbook; China Statistics Press: Beijing, China, 2006–2020. [Google Scholar]
- Zheng, R.; Cheng, Y.; Liu, H.; Chen, W.; Chen, X.; Wang, Y. The Spatiotemporal Distribution and Drivers of Urban Carbon Emission Efficiency: The Role of Technological Innovation. Int. J. Environ. Res. Public Health 2022, 19, 9111. [Google Scholar] [CrossRef]
- Ma, T.; Liu, Y.; Yang, M. Spatial-Temporal Heterogeneity for Commercial Building Carbon Emissions in China: Based the Dagum Gini Coefficient. Sustainability 2022, 14, 5243. [Google Scholar] [CrossRef]
- Yuan, T.; Zhang, J.; Xiang, Y.; Lu, L. Exploring the Temporal and Spatial Evolution Laws of County Green Land-Use Efficiency: Evidence from 11 Counties in Sichuan Province. Buildings 2022, 12, 816. [Google Scholar] [CrossRef]
- Yin, R.; Wang, Z.; Chai, J.; Gao, Y.; Xu, F. The Evolution and Response of Space Utilization Efficiency and Carbon Emissions: A Comparative Analysis of Spaces and Regions. Land 2022, 11, 438. [Google Scholar] [CrossRef]
- Zeng, L.; Li, C.; Liang, Z.; Zhao, X.; Hu, H.; Wang, X.; Yuan, D.; Yu, Z.; Yang, T.; Lu, J.; et al. The Carbon Emission Intensity of Industrial Land in China: Spatiotemporal Characteristics and Driving Factors. Land 2022, 11, 1156. [Google Scholar] [CrossRef]
- Tang, Q.; Ren, Z.A.; Zhu, K.F.; Xu, N.R. Research on the Impact of Chinese Total Factor Productivity on the Modern Economic System Based on the Spatial Dubin Model. Complexity 2021, 2021, 1–14. [Google Scholar] [CrossRef]
- Huang, J.; Xiang, S.; Wang, Y.; Chen, X. Energy-saving R&D and carbon intensity in China. Energy Econ. 2021, 98, 105240. [Google Scholar]
- Cheng, Z.; Li, L.; Liu, J. Industrial structure, technical progress and carbon intensity in China’s provinces. Renew. Sustain. Energy Rev. 2018, 81, 2935–2946. [Google Scholar] [CrossRef]
- Pan, X.; Yang, Y.; Zhang, W. Spatial effect analysis of foreign direct investment (FDI) on carbon intensity in China. Environ. Eng. Manag. J. 2014, 13, 1251–1255. [Google Scholar]
- Wen, L.; Zhang, Z. Probing Energy-Related CO2 Emissions in the Beijing-Tianjin-Hebei Region Based on Ridge Regression Considering Population Factors. Pol. J. Environ. Stud. 2020, 29, 2413–2427. [Google Scholar] [CrossRef]
- Xu, S.; He, Z.; Long, R. Factors that influence carbon emissions due to energy consumption in China: Decomposition analysis using LMDI. Appl. Energy 2014, 127, 182–193. [Google Scholar] [CrossRef]
- Wei, L.; Liu, Z. Spatial heterogeneity of demographic structure effects on urban carbon emissions. Environ. Impact. Assess. Rev. 2022, 95, 106790. [Google Scholar] [CrossRef]
- Dong, L.; De, Q.; Peng, Z. Driving forces of residential CO2 emissions in urban and rural China: An index decomposition analysis. Energy Policy 2010, 38, 3377–3383. [Google Scholar] [CrossRef]
- Ohlan, R. The impact of population density, energy consumption, economic growth and trade openness on CO2 emissions in India. Nat. Hazards 2015, 79, 1409–1428. [Google Scholar] [CrossRef]
- Tan, S.; Zhang, M.; Wang, A.; Zhang, X.; Chen, T. How do varying socio-economic driving forces affect China’s carbon emissions? New evidence from a multiscale geographically weighted regression model. Environ. Sci. Pollut. Res. 2021, 28, 41242–41254. [Google Scholar] [CrossRef] [PubMed]
- Wang, S.; Fang, C.; Wang, Y. Spatiotemporal variations of energy-related CO2 emissions in China and its influencing factors: An empirical analysis based on provincial panel data. Renew. Sustain. Energy Rev. 2016, 55, 505–515. [Google Scholar] [CrossRef]
- Mahalik, M.; Mallick, H.; Padhan, H. Do educational levels influence the environmental quality? The role of renewable and non-renewable energy demand in selected BRICS countries with a new policy perspective. Renew. Energy 2021, 164, 419–432. [Google Scholar] [CrossRef]
- Wang, Z.; Gao, L.; Wei, Z.; Majeed, A.; Alam, I. How FDI and technology innovation mitigate CO2 emissions in high-tech industries: Evidence from province-level data of China. Environ. Sci. Pollut. Res. 2022, 29, 4641–4653. [Google Scholar] [CrossRef]
- National Bureau of Statistics of the People’s Republic of China. China Statistical Yearbook; China Statistics Press: Beijing, China, 2006–2020. [Google Scholar]
- Ma, D.; Zhao, N.; Zhang, F.; Xiao, Y.; Guo, Z.; Liu, C. Green Total-Factor Energy Efficiency of Construction Industry and Its Driving Factors: Spatial-Temporal Heterogeneity of Yangtze River Economic Belt in China. Int. J. Environ. Res. Public Health 2022, 19, 9972. [Google Scholar] [CrossRef]
- Zhu, X. Have carbon emissions been reduced due to the upgrading of industrial structure? Analysis of the mediating effect based on technological innovation. Environ. Sci. Pollut. Res. 2022, 29, 54890–54901. [Google Scholar] [CrossRef]
- Tan, F.; Yang, S.; Niu, Z. The impact of urbanization on carbon emissions: Both from heterogeneity and mechanism test. Environ. Dev. Sustain. 2022, 1–17. [Google Scholar] [CrossRef]
- Han, X.; Cao, T.; Sun, T. Analysis on the variation rule and influencing factors of energy consumption carbon emission intensity in China’s urbanization construction. J. Clean. Prod. 2019, 238, 117958. [Google Scholar] [CrossRef]
- Zhang, Y.; Liu, Z.; Zhang, H.; Tan, T. The impact of economic growth, industrial structure and urbanization on carbon emission intensity in China. Nat. Hazards 2014, 73, 579–595. [Google Scholar] [CrossRef]
- Zou, C.; Zhao, Q.; Zhang, G.; Xiong, B. Energy revolution: From a fossil energy era to a new energy era. Nat. Gas Ind. 2016, 3, 1–11. [Google Scholar] [CrossRef] [Green Version]
- Yang, H.; Chen, L.; Huang, H.; Tang, P. Measurement and Spatial-Temporal Evolution Characteristics of Low-Carbon Cities with High-Quality Development: The Case Study of the Yangtze River Economic Belt, China. Sustainability 2022, 14, 9686. [Google Scholar] [CrossRef]
- Zhang, F.; Yang, X.; Wu, J.; Ma, D.; Xiao, Y.; Gong, G.; Zhang, J. How New Urbanization Affects Tourism Eco-Efficiency in China: An Analysis Considering the Undesired Outputs. Sustainability 2022, 14, 10820. [Google Scholar] [CrossRef]


| Variable Name | Abbreviation | Definition | Source | |
|---|---|---|---|---|
| Carbon emissions from urban production energy consumption | Carbon emission quantity | CEQ (million tons) | Carbon emission quantity from energy consumption in the production process of industry, raw materials and materials, construction, transportation, warehousing, postal services, wholesale, retail, accommodation and catering. | China Energy Statistical Yearbook |
| Carbon emission intensity | CEI (million tons/billion yuan) | Carbon emission quantity per unit of value added in secondary and third industries. | China Energy Statistical Yearbook, China Statistical Yearbook [69] | |
| Urban economic level | Industrial structure | IS (%) | The proportion of agriculture, industry and services in a country’s economic structure. | China Statistical Yearbook |
| Foreign direct investment | FDI (billion yuan) | The act of direct investment in China by foreign enterprises, economic organizations or individuals using cash, material goods and technology in accordance with relevant Chinese policies and regulations. | China Statistical Yearbook | |
| Living standard of urban residents | Per capita disposable income | PCDI (yuan) | The sum of final consumption expenditure and savings available to residents, that is, the income available to residents for discretionary use. | China Statistical Yearbook |
| Per capita consumption expenditure | PCCE (yuan) | The total expenditure of residents to meet the daily consumption of the family, including the purchase of goods and service consumption expenditure. | China Statistical Yearbook | |
| Urban energy consumption level | Energy consumption structure | ECS (%) | The quantity of each type of energy consumed by each sector of the national economy in a certain period and its proportion in the total energy consumption, or the energy consumption and its proportion according to the consumption sector. | China Energy Statistical Yearbook |
| Urban Population Size | Dependency ratio of elderly population | DREP (%) | The ratio of the middle and old part of the population to the number of working-age people. | China Statistical Yearbook |
| Population density | PD (persons/km2) | The number of people per unit of land area. | China Statistical Yearbook | |
| Urban development level | Green coverage rate of built-up area | GCR (%) | The percentage of the green coverage area in the urban built-up area. | China Statistical Yearbook |
| Urbanization rate | UR (%) | Central urban area, county (city, district) and administrative town, where included in the urban construction planning and urban construction, have been extended to the township, neighborhood committee and village committee and have realized water, electricity, road; “three links”. | China Statistical Yearbook | |
| Cultural level | CL (years) | An important indicator of the population quality of a country. It marks the popularization and development degree of a country’s culture and education. | China Statistical Yearbook | |
| Scientific and technological innovation | STI (million yuan) | Industrial enterprises are used for specific activities in scientific and technological innovation and development. | China Statistical Yearbook | |
| Variable Name | Mean | Std. D. | Min | Max |
|---|---|---|---|---|
| CEQ (million tons) | 26,048.74 | 17,899.20 | 1235.00 | 93,999.00 |
| CEI (million tons/billion yuan) | 2.36 | 1.54 | 0.33 | 10.48 |
| IS (%) | 0.43 | 0.08 | 0.16 | 0.62 |
| FDI (billion yuan) | 464.32 | 503.71 | 0.31 | 2467.27 |
| PCDI (yuan) | 23,790.70 | 11,698.71 | 8013.00 | 73,849.00 |
| PCCE (yuan) | 16,788.26 | 7642.61 | 5960.00 | 48,272.00 |
| ECS (%) | 0.43 | 0.16 | 0.01 | 0.76 |
| DREP (%) | 13.47 | 2.98 | 7.40 | 23.80 |
| PD (persons/km2) | 2734.90 | 1266.09 | 189.00 | 6307.00 |
| GCR (%) | 37.72 | 4.59 | 23.50 | 49.10 |
| UR (%) | 54.08 | 13.83 | 26.87 | 89.60 |
| CL (years) | 8.81 | 1.01 | 6.38 | 12.78 |
| STI (million yuan) | 2,489,551.00 | 5,946,871.00 | 5349.37 | 57,000,000.00 |
| Year | Overall | Intra-Regional | Inter-Regional | Supervariable Density | |||
|---|---|---|---|---|---|---|---|
| Source | Contribution Rate (%) | Source | Contribution Rate (%) | Source | Contribution Rate (%) | ||
| 2005 | 0.3628 | 0.1041 | 28.70 | 0.1744 | 48.07 | 0.0843 | 23.23 |
| 2006 | 0.3625 | 0.1050 | 28.97 | 0.1707 | 47.07 | 0.0868 | 23.95 |
| 2007 | 0.3668 | 0.1041 | 28.38 | 0.1818 | 49.57 | 0.0809 | 22.05 |
| 2008 | 0.3636 | 0.1049 | 28.85 | 0.1742 | 47.90 | 0.0845 | 23.25 |
| 2009 | 0.3588 | 0.1050 | 29.27 | 0.1666 | 46.42 | 0.0872 | 24.31 |
| 2010 | 0.3556 | 0.1047 | 29.43 | 0.1605 | 45.12 | 0.0905 | 25.44 |
| 2011 | 0.3513 | 0.1047 | 29.80 | 0.1506 | 42.88 | 0.0960 | 27.32 |
| 2012 | 0.3403 | 0.1024 | 30.10 | 0.1406 | 41.32 | 0.0973 | 28.58 |
| 2013 | 0.3365 | 0.1022 | 30.37 | 0.1348 | 40.07 | 0.0995 | 29.56 |
| 2014 | 0.3336 | 0.1017 | 30.49 | 0.1297 | 38.86 | 0.1023 | 30.65 |
| 2015 | 0.3345 | 0.1026 | 30.68 | 0.1267 | 37.87 | 0.1052 | 31.45 |
| 2016 | 0.3304 | 0.1048 | 31.71 | 0.1082 | 32.74 | 0.1175 | 35.55 |
| 2017 | 0.3364 | 0.1030 | 30.62 | 0.1230 | 36.57 | 0.1104 | 32.81 |
| 2018 | 0.3495 | 0.1084 | 31.03 | 0.1227 | 35.09 | 0.1184 | 33.88 |
| 2019 | 0.3494 | 0.1089 | 31.17 | 0.1187 | 33.99 | 0.1217 | 34.85 |
| Year | Overall | Intra-Region | Inter-Regional | Supervariable Density | |||
|---|---|---|---|---|---|---|---|
| Source | Contribution Rate (%) | Source | Contribution Rate (%) | Source | Contribution Rate (%) | ||
| 2005 | 0.2777 | 0.0779 | 28.07 | 0.1539 | 55.43 | 0.0458 | 16.51 |
| 2006 | 0.2838 | 0.0797 | 28.07 | 0.1565 | 55.13 | 0.0477 | 16.79 |
| 2007 | 0.2681 | 0.0768 | 28.66 | 0.1396 | 52.06 | 0.0517 | 19.28 |
| 2008 | 0.2587 | 0.0731 | 28.27 | 0.1388 | 53.67 | 0.0467 | 18.06 |
| 2009 | 0.2608 | 0.0730 | 27.97 | 0.1411 | 54.10 | 0.0468 | 17.93 |
| 2010 | 0.2683 | 0.0757 | 28.20 | 0.1433 | 53.41 | 0.0493 | 18.39 |
| 2011 | 0.2853 | 0.0817 | 28.63 | 0.1515 | 53.11 | 0.0521 | 18.27 |
| 2012 | 0.2920 | 0.0829 | 28.39 | 0.1562 | 53.49 | 0.0529 | 18.12 |
| 2013 | 0.3170 | 0.0919 | 28.98 | 0.1665 | 52.51 | 0.0587 | 18.51 |
| 2014 | 0.3232 | 0.0940 | 29.08 | 0.1703 | 52.69 | 0.0589 | 18.23 |
| 2015 | 0.3325 | 0.0969 | 29.16 | 0.1765 | 53.07 | 0.0591 | 17.78 |
| 2016 | 0.3456 | 0.1030 | 29.81 | 0.1805 | 52.23 | 0.0621 | 17.96 |
| 2017 | 0.3420 | 0.1029 | 30.10 | 0.1695 | 49.56 | 0.0695 | 20.34 |
| 2018 | 0.3380 | 0.1010 | 29.89 | 0.1555 | 46.00 | 0.0815 | 24.11 |
| 2019 | 0.3729 | 0.1131 | 30.34 | 0.1812 | 48.58 | 0.0786 | 21.08 |
| Classification | High-High | High-Low | Low-High | Low-Low | |
|---|---|---|---|---|---|
| Carbon emissions of urban production energy consumption | 2005 | Hebei, Shanxi, Inner Mongolia, Hubei | Liaoning, Jiangsu, Zhejiang, Shandong, Henan, Hunan, Guangdong | Jilin, Guizhou, Yunnan, Gansu, Qinghai, Ningxia | Beijing, Tianjin, Heilongjiang, Shanghai, Anhui, Fujian, Jiangxi, Guangxi, Hainan, Chongqing, Sichuan, Shaanxi, Xinjiang |
| 2019 | Hebei, Shanxi, Inner Mongolia, Hubei, Liaoning, Xinjiang | Jiangsu, Zhejiang, Shandong, Henan, Hubei, Guangdong | Heilongjiang, Gansu, Qinghai, Ningxia | Beijing, Tianjin, Jilin, Shanghai, Anhui, Fujian, Jiangxi, Hunan, Guangxi, Hainan, Chongqing, Sichuan, Guizhou, Yunnan, Shaanxi | |
| Year | I | E(I) | SD(I) | Z-Value | p-Value | |||||
|---|---|---|---|---|---|---|---|---|---|---|
| CEQ | CEI | CEQ | CEI | CEQ | CEI | CEQ | CEI | CEQ | CEI | |
| 2005 | 0.266 | 0.230 | −0.034 | −0.034 | 0.119 | 0.115 | 2.515 | 2.294 | 0.006 | 0.011 |
| 2006 | 0.264 | 0.211 | −0.034 | −0.034 | 0.120 | 0.117 | 2.490 | 2.101 | 0.006 | 0.018 |
| 2007 | 0.263 | 0.231 | −0.034 | −0.034 | 0.120 | 0.118 | 2.491 | 2.250 | 0.006 | 0.012 |
| 2008 | 0.244 | 0.276 | −0.034 | −0.034 | 0.119 | 0.119 | 2.339 | 2.609 | 0.010 | 0.005 |
| 2009 | 0.236 | 0.321 | −0.034 | −0.034 | 0.119 | 0.120 | 2.262 | 2.969 | 0.012 | 0.001 |
| 2010 | 0.225 | 0.315 | −0.034 | −0.034 | 0.120 | 0.120 | 2.171 | 2.916 | 0.015 | 0.002 |
| 2011 | 0.217 | 0.314 | −0.034 | −0.034 | 0.120 | 0.118 | 2.098 | 2.943 | 0.018 | 0.002 |
| 2012 | 0.194 | 0.349 | −0.034 | −0.034 | 0.119 | 0.119 | 1.916 | 3.229 | 0.028 | 0.001 |
| 2013 | 0.191 | 0.358 | −0.034 | −0.034 | 0.119 | 0.117 | 1.891 | 3.354 | 0.029 | 0.000 |
| 2014 | 0.189 | 0.361 | −0.034 | −0.034 | 0.119 | 0.116 | 1.873 | 3.392 | 0.031 | 0.000 |
| 2015 | 0.181 | 0.394 | −0.034 | −0.034 | 0.119 | 0.115 | 1.811 | 3.727 | 0.035 | 0.000 |
| 2016 | 0.251 | 0.404 | −0.034 | −0.034 | 0.118 | 0.116 | 2.423 | 3.777 | 0.008 | 0.000 |
| 2017 | 0.164 | 0.400 | −0.034 | −0.034 | 0.120 | 0.114 | 1.653 | 3.805 | 0.049 | 0.000 |
| 2018 | 0.155 | 0.381 | −0.034 | −0.034 | 0.119 | 0.112 | 1.591 | 3.705 | 0.056 | 0.000 |
| 2019 | 0.144 | 0.396 | −0.034 | −0.034 | 0.119 | 0.113 | 1.499 | 3.825 | 0.067 | 0.000 |
| LM Test | ||
|---|---|---|
| Statistics | ||
| CEQ | CEI | |
| Lagrange multiplier | 14.276 (0.000) | 63.825 (0.000) |
| Robust Lagrange multiplier | 8.043 (0.005) | 10.713 (0.000) |
| Lagrange multiplier | 19.666 (0.000) | 72.954 (0.000) |
| Robust Lagrange multiplier | 13.433 (0.000) | 19.842 (0.000) |
| Explained Variables | National | Eastern Region | Central Region | Western Region |
|---|---|---|---|---|
| Carbon emission quantity | Time, individual double fixed effects spatial Durbin model | Time, individual double fixed effects spatial Durbin model | Time, individual double fixed effects spatial Durbin model | Time, individual double fixed effects spatial Durbin model |
| Carbon emission intensity | Individual fixed effects spatial Durbin model | Individual fixed effects spatial Durbin model | Time, individual double fixed effects spatial Durbin model | Time, individual double fixed effects spatial Durbin model |
| Variable | lnCEQ | lnCEI |
|---|---|---|
| lnIS | 0.1406 | −0.2389 *** |
| lnFDI | −0.0435 *** | −0.0378 *** |
| lnPCDI | 1.6895 *** | −0.4153 *** |
| lnECS | 0.1216 *** | 0.1575 *** |
| lnDREP | 0.0293 | −0.0018 |
| lnPD | 0.0134 | 0.0012 |
| lnGCR | 0.2361 ** | 0.1935 ** |
| lnUR | 0.2419 | 0.1908 |
| lnCL | −0.1314 | −0.5789 ** |
| lnSTI | −0.0401 *** | −0.0634 *** |
| Spatial | ||
| ρ | 0.1233 * | 0.3134 *** |
| Variance | ||
| σ2 _e | 0.0090 *** | 0.0107 *** |
| Time effect | Yes | No |
| Individual effect | Yes | Yes |
| R2 | 0.7793 | 0.8990 |
| AIC | −799.0385 | −709.7291 |
| BIC | −708.635 | −619.3257 |
| N | 450 | 450 |
| Variable | CEQ | CEI | ||||
|---|---|---|---|---|---|---|
| Direct Effect | Indirect Effect | Total Effect | Direct Effect | Indirect Effect | Total Effect | |
| lnIS | 0.1458 * | 0.3569 * | 0.5027 * | −0.1944 ** | 0.7738 *** | 0.5794 * |
| lnFDI | −0.0457 *** | −0.1224 *** | −0.1681 *** | −0.0468 *** | −0.1658 *** | −0.2126 *** |
| lnPCDI | 1.6967 *** | −0.0970 | 1.5997 *** | −0.4014 *** | 0.1865 | −0.2150 |
| lnECS | 0.1199 *** | −0.0762 | 0.0437 | 0.1578 *** | −0.0011 | 0.1567 * |
| lnDREP | 0.0301 | 0.0538 | 0.0839 | 0.0168 | 0.3042 ** | 0.3210 ** |
| lnPD | 0.0150 | 0.0205 | 0.0356 | −0.0004 | −0.0403 | −0.0407 |
| lnGCR | 0.2289 ** | −0.2675 | −0.0386 | 0.1944 * | 0.0096 | 0.2040 |
| lnUR | 0.2431 | 0.2733 | 0.5165 * | 0.1528 | −0.5059 | −0.3531 |
| lnCL | −0.0559 | 1.9291 *** | 1.8732 *** | −0.4873 * | 1.2247 *** | 0.7374 |
| lnSTI | −0.0402 *** | −0.0182 | −0.0583 * | −0.0675 *** | −0.0760 ** | −0.1435 *** |
| Variable | Eastern Region | Central Region | Western Region | Eastern Region | Central Region | Western Region |
|---|---|---|---|---|---|---|
| lnCEQ | lnCEQ | lnCEQ | lnCEI | lnCEI | lnCEI | |
| lnIS | 0.2926 * | 0.2638 | −0.3257 ** | 0.4619 *** | −0.7836 *** | −0.7022 *** |
| lnFDI | −0.0136 | −0.0547 ** | 0.0221 * | 0.0167 | −0.0349 | 0.0015 |
| lnPCDI | 1.1254 *** | 1.2471 ** | 0.0318 | −0.4945 *** | −0.0839 | −0.5072 * |
| lnECS | 0.0658 ** | 0.2046 *** | 0.4426 *** | 0.0817 ** | 0.3085 *** | 0.4751 *** |
| lnDREP | 0.1096 | −0.2584 ** | −0.1035 | 0.2065 *** | −0.1471 | −0.0281 |
| lnPD | 0.0222 | 0.0351 | −0.0260 | −0.0671 | −0.0122 | −0.0261 |
| lnGCR | 0.1067 | 0.6304 *** | 0.1140 | −0.1242 | 0.9837 *** | 0.0339 |
| lnUR | 0.3179 | 0.0128 | −2.2996 *** | 0.1686 | 0.1097 | −2.3494 *** |
| lnCL | 0.1700 | −0.2085 | −0.6438 ** | −0.2728 | 0.0423 | −0.8921 *** |
| lnSTI | 0.0208 | 0.0118 | 0.0059 | 0.0008 | 0.0103 | −0.0155 |
| Spatial | ||||||
| ρ | −0.1490 | −0.3893 *** | −0.1325 | −0.1576 | −0.3500 *** | 0.3228 *** |
| Variance | ||||||
| σ2 _e | 0.0038 *** | 0.0034 *** | 0.0035 *** | 0.0059 *** | 0.0036 *** | 0.0038 *** |
| Time effects | Yes | Yes | Yes | No | Yes | Yes |
| Individual effects | Yes | Yes | Yes | Yes | Yes | Yes |
| R2 | 0.8438 | 0.8037 | 0.7723 | 0.9431 | 0.9557 | 0.8183 |
| AIC | −403.8642 | −289.4422 | −412.9957 | −333.3009 | −284.2851 | −407.0186 |
| BIC | −335.5334 | −228.1174 | −344.6649 | −264.9701 | −222.9603 | −338.6878 |
| N | 165 | 120 | 165 | 165 | 120 | 165 |
| Variable | Eastern Region | Central Region | Western Region | ||||||
|---|---|---|---|---|---|---|---|---|---|
| Direct | Indirect | Total | Direct | Indirect | Total | Direct | Indirect | Total | |
| lnIS | 0.3009 * | −0.2644 | 0.0365 | 0.1678 | 0.3572 ** | 0.5251 * | −0.2950 ** | −1.0332 *** | −1.3283 *** |
| lnFDI | −0.0123 | 0.0061 | −0.0062 | −0.0610 ** | 0.0329 | −0.0281 | 0.0270 ** | −0.0987 *** | −0.0717 *** |
| lnPCDI | 1.1831 *** | −0.5774 *** | 0.6057 * | 1.4165 ** | −0.5817 | 0.8348 | 0.0847 | −1.1614 ** | −1.0767 |
| lnECS | 0.0650 ** | 0.0221 | 0.0871 | 0.2040 *** | −0.0047 | 0.1993 | 0.4545 *** | −0.3217 * | 0.1328 |
| lnDREP | 0.1187 | −0.1478 | −0.0290 | −0.2641 * | 0.0266 | −0.2375 | −0.1109 | 0.1399 | 0.0290 |
| lnPD | 0.0208 | 0.0825 | 0.1034 | 0.0119 | 0.1040 *** | 0.1159 *** | −0.0247 | −0.0064 | −0.0311 |
| lnGCR | 0.1122 | 0.0145 | 0.1267 | 0.6026 *** | 0.1598 | 0.7625* | 0.1190 | −0.1442 | −0.0252 |
| lnUR | 0.3220 | 0.0129 | 0.3349 | −0.1428 | 0.5972 | 0.4544 | −2.3118 *** | −0.3062 | −2.6180 *** |
| lnCL | 0.1779 | 0.4766 | 0.6544 | −0.4169 | 1.0451 * | 0.6282 | −0.5925 ** | −0.6775 | −1.2700 * |
| lnSTI | 0.0189 | 0.0307 | 0.0496 | 0.0042 | 0.0365 | 0.0408 | 0.0081 | −0.0366* | −0.0286 |
| Variable | Eastern Region | Central Region | Western Region | ||||||
|---|---|---|---|---|---|---|---|---|---|
| Direct | Indirect | Total | Direct | Indirect | Total | Direct | Indirect | Total | |
| lnIS | 0.4460 *** | −0.5545 * | −0.1085 | −0.8449 *** | 0.2351 | −0.6098 ** | −0.6809 *** | −1.8207 *** | −2.5016 *** |
| lnFDI | 0.0203 | 0.0694 ** | 0.0896 ** | −0.0382 | 0.0240 | −0.0142 | 0.0049 | −0.1382 *** | −0.1333 *** |
| lnPCDI | −0.5068 *** | −0.5983 *** | −1.1051 *** | 0.4190 | −2.1953 ** | −1.7763 ** | −0.4827 | -0.9098 | −1.3925 * |
| lnECS | 0.0808 ** | -0.0713 | 0.0095 | 0.2943 *** | 0.0636 | 0.3579 *** | 0.4692 *** | 0.3759 ** | 0.8451 *** |
| lnDREP | 0.2041 *** | -0.1237 | 0.0804 | −0.1749 | 0.1281 | −0.0468 | −0.0403 | 0.5940 ** | 0.5537 ** |
| lnPD | -0.0640 | 0.0172 | −0.0468 | −0.0177 | 0.0342 | 0.0165 | −0.0248 | −0.0138 | −0.0386 |
| lnGCR | -0.1184 | −0.0068 | −0.1251 | 0.9422 *** | 0.2390 | 1.1812 *** | 0.0394 | −0.3587 | −0.3194 |
| lnUR | 0.2040 | 1.5869 *** | 1.7909 *** | 0.0191 | 0.3844 | 0.4035 | −2.3682 *** | −0.1752 | −2.5434 *** |
| lnCL | -0.2411 | 0.4186 | 0.1775 | −0.2053 | 1.3660 ** | 1.1607 * | −0.8434 *** | −1.3590 * | −2.2025 ** |
| lnSTI | 0.0004 | −0.0110 | −0.0105 | 0.0069 | 0.0207 | 0.0275 | −0.0136 | −0.0628 *** | −0.0764 ** |
| Variable | lnCEQ | Direct Effect | Indirect Effect | Total Effect | lnCEI | Direct Effect | Indirect Effect | Total Effect |
|---|---|---|---|---|---|---|---|---|
| lnIS | 0.2913 *** | 0.2943 *** | 0.4847 ** | 0.7790 *** | −0.2409 *** | −0.1775 ** | 1.0079 *** | 0.8303 *** |
| lnFDI | −0.0363 *** | −0.0372 *** | −0.1390 *** | −0.1762 *** | −0.0405 *** | −0.0520 *** | −0.1921 *** | −0.2441 *** |
| lnPCCE | 0.4643 *** | 0.4685 *** | −0.0916 | 0.3769 * | −0.4942 *** | −0.4629 *** | 0.4417 *** | −0.0212 |
| lnECS | 0.1015 *** | 0.1009 *** | −0.0518 | 0.0491 | 0.1587 *** | 0.1576 *** | −0.0200 | 0.1376 |
| lnDREP | −0.0166 | −0.0149 | 0.1772 | 0.1623 | −0.0034 | 0.0167 | 0.3074 ** | 0.3240 ** |
| lnPD | −0.0007 | −0.0001 | −0.0260 | −0.0261 | 0.0073 | 0.0038 | −0.0675 | −0.0637 |
| lnGCR | 0.1540 | 0.1495 | −0.2871 | −0.1376 | 0.1893 ** | 0.1764 * | −0.2016 | −0.0253 |
| lnUR | 0.4843 *** | 0.4796 *** | 0.0834 | 0.5630 * | 0.3152 ** | 0.2570 * | −0.7837 ** | −0.5267 |
| lnCL | 0.1050 | 0.1469 | 1.0464 * | 1.1932 * | −0.6132 ** | −0.5274 ** | 1.0432 ** | 0.5158 |
| lnSTI | −0.0487 *** | −0.0487 *** | −0.0295 | −0.0782 ** | −0.0609 *** | −0.0663 *** | −0.0894 *** | −0.1557 *** |
| Spatial | ||||||||
| ρ | 0.0639 | 0.3438 *** | ||||||
| Variance | ||||||||
| σ2 _e | 0.0101 *** | 0.0104 *** | ||||||
| Time effects | Yes | No | ||||||
| Individual effects | Yes | Yes | ||||||
| R2 | 0.7793 | 0.8990 | ||||||
| N | 450 | 450 |
Publisher’s Note: MDPI stays neutral with regard to jurisdictional claims in published maps and institutional affiliations. |
© 2022 by the authors. Licensee MDPI, Basel, Switzerland. This article is an open access article distributed under the terms and conditions of the Creative Commons Attribution (CC BY) license (https://creativecommons.org/licenses/by/4.0/).
Share and Cite
Fu, L.; Wang, Q. Spatial and Temporal Distribution and the Driving Factors of Carbon Emissions from Urban Production Energy Consumption. Int. J. Environ. Res. Public Health 2022, 19, 12441. https://doi.org/10.3390/ijerph191912441
Fu L, Wang Q. Spatial and Temporal Distribution and the Driving Factors of Carbon Emissions from Urban Production Energy Consumption. International Journal of Environmental Research and Public Health. 2022; 19(19):12441. https://doi.org/10.3390/ijerph191912441
Chicago/Turabian StyleFu, Liyuan, and Qing Wang. 2022. "Spatial and Temporal Distribution and the Driving Factors of Carbon Emissions from Urban Production Energy Consumption" International Journal of Environmental Research and Public Health 19, no. 19: 12441. https://doi.org/10.3390/ijerph191912441
APA StyleFu, L., & Wang, Q. (2022). Spatial and Temporal Distribution and the Driving Factors of Carbon Emissions from Urban Production Energy Consumption. International Journal of Environmental Research and Public Health, 19(19), 12441. https://doi.org/10.3390/ijerph191912441