
Research on the Optimal Allocation of Ecological Land from the Perspective of Human Needs—Taking Hechi City, Guangxi as an Example

Abstract
:1. Introduction
2. Materials and Methods
2.1. Data Sources and Study Area Overview
2.1.1. Data Source
2.1.2. Study Area Overview
2.2. Research Methodology
2.2.1. Multi-Objective Planning Model
2.2.2. The Patch-Generating Land Use Simulation (PLUS)
3. Results
3.1. Multi-Scenario Simulation of Ecological Land Quantity Optimization
3.2. Multi-Scenario Simulation for Spatial Optimization of Ecological Land
3.2.1. Analysis of LEAS Results
3.2.2. Results of Spatial Optimization of Ecological Land in Hechi
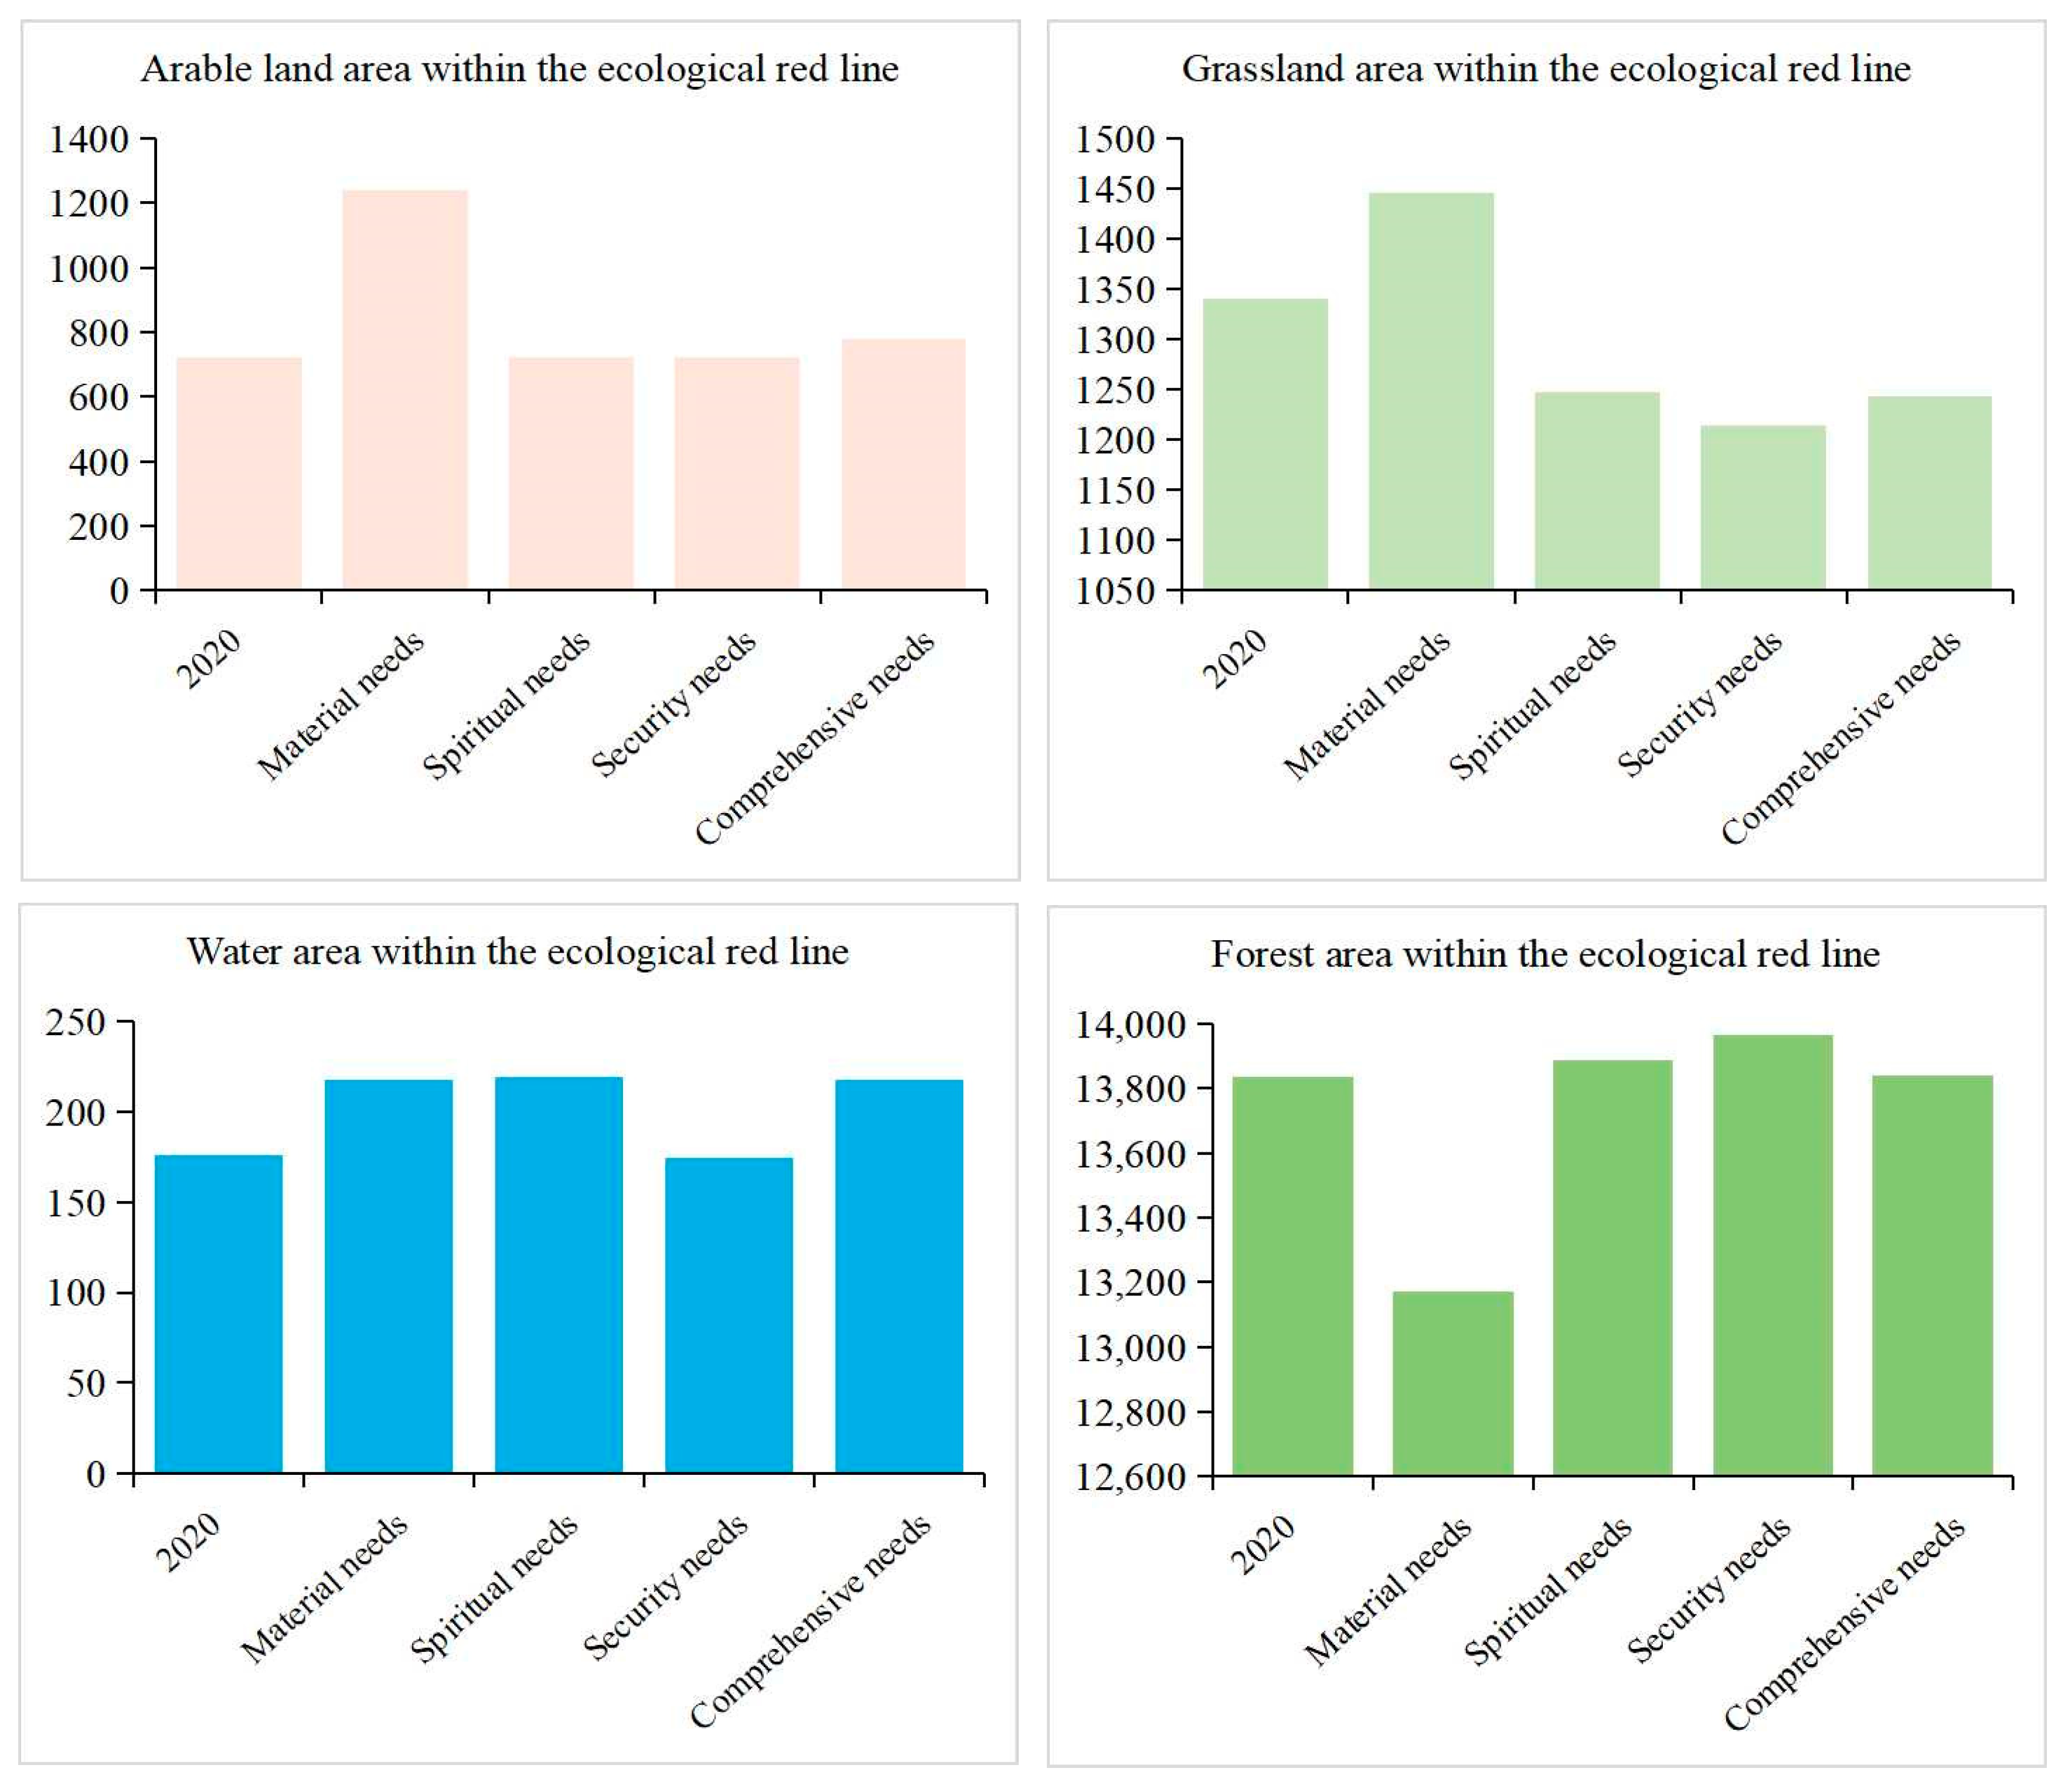
3.3. Results of Internal Optimization of Ecological Red Lines
4. Discussion
4.1. It Is Scientifically Significant to Combine the MOP-PLUS Model from the Perspective of Human Needs
4.2. The Reduction of Forest Land in the Study Results Needs to Be Considered with Caution
4.3. The Land Can Be Used More Efficiently after Considering Human Needs
4.4. The Study Area Should Adjust the Ecological Land Structure and Enhance the Ecological Land Aggregation According to the Research Results
5. Conclusions
Author Contributions
Funding
Institutional Review Board Statement
Informed Consent Statement
Data Availability Statement
Conflicts of Interest
References
- Peng, J.; Wang, A.; Liu, Y.X.; Ma, J.; Wu, J.S. Research progress and prospect on measuring urban ecological land demand. Acta Geogr. Sin. 2015, 70, 333–346. [Google Scholar]
- Lin, Y.; Fan, J.; Wen, Q.; Liu, S.; Li, B. Primary exploration of ecological theories and technologies for delineation of ecological redline zones. Acta Ecol. Sin. 2016, 36, 1244–1252. [Google Scholar]
- Gu, Y.Y.; Xu, M.J.; Yang, Y.; Huang, X.F.; Zou, C.X.; Ye, X. Delineation of ecological conservation redline in karst rocky desertification areas:A case study of Weining County, Guizhou Province. Acta Ecol. Sin. 2021, 41, 3462–3474. [Google Scholar]
- Liu, Y.G.; Li, J.J.; Lu, Y.F.; Zou, Q.; Wang, Y.; Zhou, W.Z.; Luo, Z.Y.; Li, Y.F. Optimization method of ecological redline delineation in Southwest China from the view of eco-geo environment vulnerability assessment. Acta Ecol. Sin. 2021, 41, 5825–5836. [Google Scholar]
- Gao, J.X.; Ju, C.H.; Zou, C.X. Construction of Management and Control System for Ecol-Redline. Chin. J. Environ. Manag. 2017, 9, 14–17. [Google Scholar]
- Han, X.; Pu, L.; Zhu, M.J.C.A.S.B. Calculation of the area of effective ecological land in the region around Taihu Lake. Chin. Agric. Sci. Bull. 2010, 26, 301–305. [Google Scholar]
- Deng, H.B.; Chen, C.D.; Liu, X.; Wu, G. Conception and function classification of regional ecological land. Acta Ecol. Sin. 2009, 29, 1519–1524. [Google Scholar]
- Gao, C.; Feng, Y.; Tong, X.; Jin, Y.; Liu, S.; Wu, P.; Ye, Z.; Gu, C. Modeling urban encroachment on ecological land using cellular automata and cross-entropy optimization rules. Sci. Total Environ. 2020, 744, 140996. [Google Scholar] [CrossRef]
- Li, G.; Jiang, C.; Du, J.; Jia, Y.; Bai, J. Spatial differentiation characteristics of internal ecological land structure in rural settlements and its response to natural and socio-economic conditions in the Central Plains, China. Sci. Total Environ. 2020, 709, 135932. [Google Scholar] [CrossRef]
- Wei, H.; Liu, H.; Xu, Z.; Ren, J.; Lu, N.; Fan, W.; Zhang, P.; Dong, X. Linking ecosystem services supply, social demand and human well-being in a typical mountain–oasis–desert area, Xinjiang, China. Ecosyst. Serv. 2018, 31, 44–57. [Google Scholar] [CrossRef]
- Mengist, W.; Soromessa, T.; Legese, G. Ecosystem services research in mountainous regions: A systematic literature review on current knowledge and research gaps. Sci. Total Environ. 2020, 702, 134581. [Google Scholar] [CrossRef] [PubMed]
- Uriel, A. Introduction: Why We Need Maslow in the Twenty-First Century. Society 2017, 54, 508–509. [Google Scholar]
- Yan, G.H.; Li, J.W. Research on “Attention Economy” from the Angle of Theory of Human Needs. Study Financ. Econ. 2000, 9, 16–21. [Google Scholar]
- Maslow, A.H. A theory of human motivation. Psychol. Rev. 1943, 50, 370–396. [Google Scholar] [CrossRef]
- Clayton, P.A. An empirical test of a new theory of human needs. Organ. Behav. Hum. Perform. 1969, 4, 142–175. [Google Scholar]
- Sun, G.; Sheng, L.X.; Zhou, D.W. Ecosystem services and corresponding protective strategies. Chin. J. Appl. Ecol. 1999, 10, 365–368. [Google Scholar]
- Borucke, M.; Moore, D.; Cranston, G.; Gracey, K.; Iha, K.; Larson, J.; Lazarus, E.; Morales, J.C.; Wackernagel, M.; Galli, A. Accounting for demand and supply of the biosphere’s regenerative capacity: The National Footprint Accounts’ underlying methodology and framework. Ecol. Indic. 2013, 24, 518–533. [Google Scholar] [CrossRef]
- Safitri, S.; Sumarto, I.; Riqqi, A.; Deliar, A.; Norvyani, D.A.; Taradini, J. Suitability model using support vector machine for land use planning scenarios in Java Island, Indonesia. In IOP Conference Series Earth and Environmental Science; IOP Publishing Inst. Teknologi: Nasl Bandung, West Java, Indonesia, 2020; Volume 500, p. 012051. [Google Scholar]
- Deden, D.; Rina, O.; Sri, H.; Hariyatno, D. Modelling of Land Allocation Behavior in Indonesia. Procedia Environ. Sci. 2016, 33, 78–86. [Google Scholar]
- Steven, A.G.; José, A.F.; Glenn, E.M. A multiobjective optimization approach to smart growth in land development. Socio-Econ. Plan. Sci. 2005, 40, 212–248. [Google Scholar]
- Sadeghi, S.H.R.; Jalili, K.; Nikkami, D. Land use optimization in watershed scale. Land Use Policy 2009, 26, 186–193. [Google Scholar] [CrossRef]
- Wang, G.; Han, Q.; de Vries, B. The multi-objective spatial optimization of urban land use based on low-carbon city planning. Ecol. Indic. 2021, 125, 107540. [Google Scholar] [CrossRef]
- Termansen, M.; Chapman, D.S.; Quinn, C.H.; Fraser, E.D.G.; Jin, N.; Beharry, B.N.; Hubacek, K. Modelling land use dynamics in socio-ecological systems: A case study in the UK uplands. Resil. Complex Socio-Ecol. Syst. 2019, 60, 125–152. [Google Scholar]
- Zhang, M.M.; Zhang, R.Q.; Hao, J.M.; Ai, D. The Scenarios Simulation Analysis of Driving Forces of Wetland Landscape Evolution Using ANN-CA in Yinchuan Plain. J. Geo-Inf. Sci. 2014, 16, 418–425. [Google Scholar]
- Shao, J.A.; Dong, Y.F.; Wang, W.; Zhang, S.Z. Simulation of future land-use scenarios in the Three Gorges Reservoir Region under the effects of multiple factors. J. Geogr. Sci. 2018, 28, 1907–1932. [Google Scholar]
- Liu, X.P.; Liang, X.; Li, X.; Xu, X.C.; Ou, J.P.; Chen, Y.M.; Li, S.Y.; Wang, S.J.; Pei, F.S. A future land use simulation model (FLUS) for simulating multiple land use scenarios by coupling human and natural effects. Landsc. Urban Plan. 2017, 168, 94–116. [Google Scholar]
- Zhang, X.; Gu, R.X. Spatio-temporal pattern and multi-scenario simulation of land use conflict: A case study of the Yangtze River Delta urban agglomeration. Geogr. Res. 2022, 41, 1311–1326. [Google Scholar]
- Xu, L.; Liu, X.; Tong, D.; Liu, Z.; Yin, L.; Zheng, W. Forecasting Urban Land Use Change Based on Cellular Automata and the PLUS Model. Land 2022, 11, 652. [Google Scholar] [CrossRef]
- Liu, D.F.; Tang, W.W.; Liu, Y.L.; Zhao, X.; He, J.H. Optimal rural land use allocation in central China: Linking the effect of spatiotemporal patterns and policy interventions. Appl. Geogr. 2017, 86, 165–182. [Google Scholar]
- Wu, M.; Ren, X.; Che, Y.; Yang, K. A Coupled SD and CLUE-S Model for Exploring the Impact of Land Use Change on Ecosystem Service Value: A Case Study in Baoshan District, Shanghai, China. Environ. Manag. 2015, 56, 402–419. [Google Scholar] [CrossRef]
- Wang, H.H.; Liu, Y.F. Optimal Allocation of Land Resources Based on MOP-CA. Geomat. Inf. Sci. Wuhan Univ. 2009, 34, 174–177, 247. [Google Scholar]
- Liang, X.; Guan, Q.; Clarke, K.C.; Liu, S.; Wang, B.; Yao, Y. Understanding the drivers of sustainable land expansion using a patch-generating land use simulation (PLUS) model: A case study in Wuhan, China. Comput. Environ. Urban Syst. 2021, 85, 101569. [Google Scholar] [CrossRef]
- Sarkodie, S.A. Environmental performance, biocapacity, carbon & ecological footprint of nations: Drivers, trends and mitigation options. Sci. Total Environ. 2021, 751, 141912. [Google Scholar] [PubMed]
- Ao, Y.; Zhang, M.N.; Zhao, Y.H.; Wang, X.F.; Bai, Z.D.; Jiang, L.F. Relationship between economy and ecology of Pearl River Delta Urban Agglomeration based on ecological footprint of net primary productivity. Chin. J. Appl. Ecol. 2022, 33, 2001–2008. [Google Scholar]
- Liu, M.C.; Li, W.H.; Xie, G.D. Estimation of China ecological footprint production coefficient based on net primary productivity. Chin. J. Ecol. 2010, 29, 592–597. [Google Scholar]
- Liu, M.C.; Li, M.H. The Calculation of China’s Equivalence Factorunder Ecological Footprint Mode Based on Net Primary Production. J. Nat. Resour. 2009, 24, 1550–1559. [Google Scholar]
- Xu, J.; Gong, P.; Jin, L. Optimization Evaluation and Analysis on Land Use Structure City Based on Ecological Green Equivalent in Hohhot. Ecol. Econ. 2019, 35, 196–201. [Google Scholar]
- Tang, W.S. Research on Land Use Structure Optimization in Yancheng City Based on Multi-objective Programming. J. Anhui Agric. Sci. 2017, 45, 209–212, 225 . [Google Scholar]
- Wang, Y.; Li, X.; Zhang, Q.; Li, J.; Zhou, X. Projections of future land use changes: Multiple scenarios-based impacts analysis on ecosystem services for Wuhan city, China. Ecol. Indic. 2018, 94, 430–445. [Google Scholar] [CrossRef]
- Zhang, D.; Liu, X.; Wu, X.; Yao, Y.; Wu, X.; Chen, Y. Multiple intra-urban land use simulations and driving factors analysis: A case study in Huicheng, China. GIScience Remote Sens. 2019, 56, 282–308. [Google Scholar] [CrossRef]
- Anne, A.G.; Abdulrazzaq, H.S.; Mansoor, H.A. Multi-Criteria Evaluation for Sustainable Urban Growth in An-Nuayyimah, Jordan; Post War Study. Procedia Manuf. 2020, 44, 156–163. [Google Scholar]
- Meng, P.; Wang, Q.R.; Lang, H.O.; Jiang, R.K. Analysis of the Challenges and Reform Orientation of Territorial Spatial Planning System in China Under the Background of Spatial Governance System Modernization: Reviews from the Serial Research of Territorial Spatial Governance. China Land Sci. 2019, 33, 8–14. [Google Scholar]
- Ge, D.Z.; Lu, Y.Q. Rural spatial governance for territorial spatial planning in China: Mechanisms and path. Acta Geogr. Sin. 2021, 76, 1422–1437. [Google Scholar]
- Johan, O.; Siegwart, L.; Nardi, S.; Lois, M.V. Subjective Well-Being and Social Production Functions. Soc. Indic. Res. 1999, 46, 61–90. [Google Scholar]
- Greenberg, J.; Koole, S.L.; Pyszczynski, T.A. Handbook of Experimental Existential Psychology; Guilford Press: New York, NY, USA, 2004. [Google Scholar]
- Vogel, J.; Steinberg, J.K.; O’Neill, D.W.; Lamb, W.F.; Krishnakumar, J. Socio-economic conditions for satisfying human needs at low energy use: An international analysis of social provisioning. Glob. Environ. Change-Hum. Policy Dimens. 2021, 69, 102287. [Google Scholar] [CrossRef]
- Kong, X.; Fu, M.; Zhao, X.; Wang, J.; Jiang, P. Ecological effects of land-use change on two sides of the Hu Huanyong Line in China. Land Use Policy 2022, 113, 105895. [Google Scholar] [CrossRef]
- Duan, Y.C.; Tang, J.; Li, Z.Y.; Yang, Y.; Dai, C.; Qu, Y.K.; Lv, H. Optimal Planning and Management of Land Use in River Source Region: A Case Study of Songhua River Basin, China. Int. J. Environ. Res. Public Health 2022, 19, 6610. [Google Scholar] [CrossRef]


| Name | Source |
|---|---|
| DEM | Geospatial Data Cloud (https://www.gscloud.cn/, accessed on 29 May 2022) 30 × 30 m raster data |
| Slope | Calculated using DEM data |
| Land Use Data | Resource and Environmental Science and Data Center, Chinese Academy of Sciences (http://www.resdc.cn/, accessed on 27 May 2022) 30 × 30 m Raster Data |
| Population, land constraints | «Hechi City Territorial Spatial Master Plan (2021–2035)» |
| Population density | https://www.worldpop.org, accessed on 29 May 2022, 1 km × 1 km Raster Data |
| GDP | Resource and Environmental Science and Data Center, Chinese Academy of Sciences (https://www.resdc.cn, accessed on 29 May 2022) 1 km × 1 km Raster Data |
| Economic Data | «Hechi City Statistical Yearbook» (2000–2020) |
| Vector data of Ecological red line, rivers, roads, etc. | «Hechi City Territorial Spatial Master Plan (2021–2035)» Database |
| Type of Product Consumption | Land Use Type | Consumption Items | Ecological Footprint Balance Factor |
|---|---|---|---|
| Bioresource consumption | Arable Land | Rice, wheat, corn, sorghum, cereals, beans, sweet potatoes, peanuts, rape, sesame, cotton, hemp, sugar cane, tobacco, cassava, other crops, pork, poultry, poultry eggs | 1.74 |
| Grassland | Beef and lamb, other meat, wool, milk, rabbit fur | 0.44 | |
| Forest Land | Oil tea seeds, pine resin, walnuts, chestnuts, wood, bamboo, other fruits | 1.41 | |
| Water Aera | Fish, crab, shellfish, other freshwater products | 0.35 |
| Formula | Description |
|---|---|
| 33,481.23 | 1. Total area constraint: With reference to the Hechi City Territorial Spatial Master Plan, the total area of each land use type is set at 33,481.23 km2 and remains unchanged. |
| 4,523,100 ≤ 120 (x1 + x2 + x3) + 3000 (x5 + x6) ≤ 4,618,000 | 2. Total population constraint: Based on the historical population statistics of the study area and with reference to the Hechi City Territorial Spatial Master Plan, the population of the study area in 2035 is the maximum number of people under the high development scenario constraint and the minimum number of people under the low scenario, where the population density of arable land, forest land and grassland is 120 people/km2, and the construction land is 3000 people/km2. |
| x1 ≥ 3919.27 | 3. Food security constraint: Based on the food security perspective, the total arable land area in the study area is not allowed to decrease relative to the area in 2020 based on the Hechi City Territorial Spatial Master Plan. |
| 136.49 ≤ x5 ≤ 143.27 | 4. Construction land constraint: Considering the construction land is not easy to change, with reference to the “Hechi City Territorial Spatial Master Plan”, the high development plan for construction land is the upper limit, and the current construction land area is the lower limit. |
| x4 ≥ 311.17 | 5. Water Bodies Constraint: The area of water bodies in Hechi City is increasing yearly, and the ecological value of water bodies is significant, so the area of each water body should be at least not less than the area in 2020. |
| 32,787.82 ≥ x1 + x2 + x3 + x4 ≥ 32,527.23 | 6. Ecological footprint constraint: A gray prediction model GM (1,1) was used to obtain the ecological footprint area per capita in the study area in 2035, and then multiplied by the population in 2035, with the population at the high development scale as the upper limit and the population at low development scale as the lower limit to obtain the ecological footprint constraint. |
| xi ≥ 0 (I = 1, 2…,7) | 7. Mathematical model constraint: all types of variables cannot have negative values. |
| Impact Factor | Form of Representation |
|---|---|
| Security needs | DEM |
| Population density | |
| Spiritual needs | Distance from river |
| Slope | |
| Material needs | Distance from railroad |
| Distance from road | |
| GDP | |
| Population density | |
| Slope |
| Type of Land Use | Area in 2020 | Security Needs Objectives | Material Needs Objectives | Spiritual Needs Objectives | Comprehensive Needs Objectives | LD Scenario |
|---|---|---|---|---|---|---|
| Arable land | 3919.27 | 3919.27 | 4705.12 | 3919.27 | 4703.12 | 3886.83 |
| Forest land | 24,887.55 | 25,176.17 | 23,723.93 | 23,985.54 | 23,189.20 | 24,867.71 |
| Grassland | 4198.31 | 3909.57 | 4486.15 | 5037.97 | 5037.97 | 4181.84 |
| Water | 311.17 | 311.17 | 373.4 | 373.4 | 373.4 | 350.50 |
| Residential land | 136.49 | 136.49 | 153.27 | 136.49 | 143.27 | 155.24 |
| Industrial and mining transportation land | 28.56 | 28.56 | 39.36 | 28.56 | 34.27 | 39.09 |
Publisher’s Note: MDPI stays neutral with regard to jurisdictional claims in published maps and institutional affiliations. |
© 2022 by the authors. Licensee MDPI, Basel, Switzerland. This article is an open access article distributed under the terms and conditions of the Creative Commons Attribution (CC BY) license (https://creativecommons.org/licenses/by/4.0/).
Share and Cite
Wang, J.; Hu, Y.; Song, R.; Wang, W. Research on the Optimal Allocation of Ecological Land from the Perspective of Human Needs—Taking Hechi City, Guangxi as an Example. Int. J. Environ. Res. Public Health 2022, 19, 12418. https://doi.org/10.3390/ijerph191912418
Wang J, Hu Y, Song R, Wang W. Research on the Optimal Allocation of Ecological Land from the Perspective of Human Needs—Taking Hechi City, Guangxi as an Example. International Journal of Environmental Research and Public Health. 2022; 19(19):12418. https://doi.org/10.3390/ijerph191912418
Chicago/Turabian StyleWang, Jingheng, Yecui Hu, Rong Song, and Wei Wang. 2022. "Research on the Optimal Allocation of Ecological Land from the Perspective of Human Needs—Taking Hechi City, Guangxi as an Example" International Journal of Environmental Research and Public Health 19, no. 19: 12418. https://doi.org/10.3390/ijerph191912418
APA StyleWang, J., Hu, Y., Song, R., & Wang, W. (2022). Research on the Optimal Allocation of Ecological Land from the Perspective of Human Needs—Taking Hechi City, Guangxi as an Example. International Journal of Environmental Research and Public Health, 19(19), 12418. https://doi.org/10.3390/ijerph191912418