Article

Metronidazole Degradation by UV and UV/H2O2 Advanced Oxidation Processes: Kinetics, Mechanisms, and Effects of Natural Water Matrices

1
PowerChina Zhongnan Engineering Corporation Limited, Changsha 410004, China
2
Hunan First Normal University, Changsha 410114, China
3
College of Environmental Science and Engineering, Central South University of Forestry & Technology, Changsha 410004, China
*
Author to whom correspondence should be addressed.
These authors contributed equally to this work.
Int. J. Environ. Res. Public Health 2022, 19(19), 12354; https://doi.org/10.3390/ijerph191912354
Submission received: 14 August 2022 / Revised: 23 September 2022 / Accepted: 26 September 2022 / Published: 28 September 2022

Abstract

:
Advanced oxidation technology represented by hydroxyl radicals has great potential to remove residual antibiotics. In this study, we systematically compared the metronidazole (MTZ) degradation behavior and mechanism in the UV and UV/H2O2 systems at pH 3.00 condition. The results show that the initial reaction rates were 0.147 and 1.47 µM min−1 in the UV and UV/H2O2 systems, respectively. The main reason for the slow direct photolysis of MTZ is the relatively low molar absorption coefficient (2645.44 M−1 cm−1) and quantum yield (5.9 × 10⁻³ mol Einstein−1). Then, we measured k MTZ , OH   as 2.79 (±0.12) × 109 M−1 s−1 by competitive kinetics, and calculated k MTZ , OH   and [ OH   ] SS as 2.43 (±0.11) × 109 M−1 s−1 and 2.36 × 10⁻¹³ M by establishing a kinetic model based on the steady-state hypothesis in our UV/H2O2 system. The contribution of direct photolysis and OH to the MTZ degradation was 9.9% and 90.1%. OH plays a major role in the MTZ degradation, and OH was the main active material in the UV/H2O2 system. This result was also confirmed by MTZ degradation and radicals’ identification experiments. MTZ degradation increases with H2O2 dosage, but excessive H2O2 had the opposite effect. A complex matrix has influence on MTZ degradation. Organic matter could inhibit the degradation of MTZ, and the quenching of the radical was the main reason. NO 3 promoted the MTZ degradation, while SO 4 2 and Cl had no effect. These results are of fundamental and practical importance in understanding the MTZ degradation, and to help select preferred processes for the optimal removal of antibiotics in natural water bodies, such as rivers, lakes, and groundwater

1. Introduction

In recent years, residual antibiotics in urban sewage have become one of the practical problems in the field of sewage treatment technology [1,2]. Antibiotics are a class of organic pollutants closely related to human beings, which will enter the environmental water body through the sewage treatment system [3,4]. At present, there are many reports of residual antibiotics detected in different environmental areas, such as sewage treatment plants, livestock farms, rivers and sediments, soil, and groundwater [5,6,7,8]. The test results of Ben et al. [9] on antibiotics in drinking water and bottled/barreled water showed that at least 5 kinds of antibiotics were detected in each sample of drinking water, and the highest was 41 kinds, with a concentration range of 0.021–1133 ng/L. At least 3 kinds of antibiotics were detected in each sample of bottled/barreled water, up to 31 kinds, and the concentration was between 0.0094 and 3462 ng/L [9]. These residual antibiotics usually have stable chemical properties, a long residual time, low environmental concentration and are not easy to be degraded in the environment, which seriously threatens the safety of food and drinking water, endangers the health of non-target organisms and enhances bacterial resistance [10,11,12]. The drug resistance genes of drug-resistant bacteria can also continue to spread among bacteria, animals and humans, endangering human health [13,14,15]. In the special period when the world is facing the threat of various viruses and bacteria, the use of drugs, especially antibiotics, has increased significantly, which will lead to a sharp increase in the content of residual antibiotics in urban sewage. In view of the continuous increase in antibiotic residues and its adverse impact on the ecological environment and human health, it is urgent to control the residual antibiotics in the environment.
However, many sewage treatment plants adopt the traditional sewage treatment process, which lacks pertinence to this new type of organic pollutants and is difficult to achieve the purpose of effective removal [16,17,18,19,20]. Osińska et al. [16] found that the design operation mode and water treatment process of most sewage treatment plants could not completely remove the antibiotic organic pollutants. Zhao et al. [17] reported that the activated sludge process could not remove trimethoprim well. Jia et al. [21] found that the anaerobic anoxic aerobic treatment unit of the municipal sewage treatment plant had very little effect on the reduction in the quality change percentage of quinolones and fluoroquinolones in the sewage, indicating that biodegradation has little effect on the removal of quinolones and fluoroquinolones in the municipal sewage. Due to the characteristics of antibiotic organic compounds such as water solubility, weak volatility, stable chemical quality, poor biodegradability and high biological toxicity, the traditional flocculation sedimentation adsorption and biodegradation processes cannot effectively and completely remove antibiotics from urban sewage [22,23,24]. Therefore, efficient removal of residual antibiotics in sewage has become a difficult problem to be solved in the process of urban sewage treatment.
Advanced oxidation technologies (AOPs) with hydroxyl radicals (OH) as the main active material is new treatment technologies that improve the biodegradability of wastewater through oxidation or directly degrade organic pollutants through mineralization [25,26,27]. Hydroxyl radical has a high redox potential (E0 = 1.89~2.72 V vs. NHE), and it is a strong oxidant and has a good degradation effect on organic pollutants. In 1894, Fenton first discovered that the mixed solution of H2O2 and Fe2+ could rapidly oxidize tartaric acid, marking the origin of advanced oxidation technology. In Fenton reagent, H2O2 is catalytically decomposed by Fe2+ ion to generate OH, which has a strong oxidation ability. Canadian scientist Eisenhaner first applied Fenton reagent to water treatment in 1964, and then a large number of studies expanded its application scope. Traditional AOPs use OH as the main active material to degrade pollutants. In addition to Fenton reagent and Fenton-like reagent methods, ozone and combined process methods, semiconductor photocatalytic oxidation methods, ferrate oxidation methods, etc., are also common in OH generation technologies in advanced oxidation [25,28,29,30]. Among them, OH generated by ultraviolet-activated H2O2 technology degrades organic pollutants, with the characteristics of simple operation, convenience and efficiency, no special requirements for the environment, less secondary pollution and broad application prospects [31]. However, advanced oxidation technology for the degradation of emerging organic pollutants by ultraviolet-activated hydrogen peroxide still has problems, such as it being difficult to determine the degradation mechanism of pollutants and difficult to predict the impact of the complex matrix.
In this study, we systematically compared the antibiotic degradation behavior and mechanism in the alone UV and UV/H2O2 systems at pH 3.00 condition. We determined the effective light intensity and the effective light path of the photochemical reaction system by using two chemical photometric methods of potassium ferric oxalate and hydrogen peroxide. Due to its huge usage and environmental relevance, metronidazole (MTZ) was selected as an example of antibiotics in this study [32,33]. Then, we detected the molar absorption coefficient and quantum yield of MTZ by direct UV experiment. MTZ degradation kinetics of the UV and UV/H2O2 systems was compared. We experimentally measured k MTZ , OH   , [ OH   ] SS , the contribution of direct photolysis and OH using the steady-state approximation kinetic model, and k MTZ , OH   was verified by the competitive kinetic method [34,35]. Finally, we studied the effect of the H2O2 dosage and complex matrix of the MTZ degradation in the H2O2 system by the steady-state kinetic model and experimentation. The study on the oxidative degradation mechanism and complex matrix effect of the antibiotic is of scientific and practical importance, as those determine the removal efficiency of the antibiotic, where results can vary from partial remediation to complete mineralization.

2. Materials and Methods

2.1. Materials and Experimental Design

Disodium hydrogen phosphate (99.0%), phosphoric acid (85–90%), sodium dihydrogen phosphate (99.0%), metronidazole (99.0%), 4-chlorobenzoic acid (pCBA, 99.0%), t-butanol (99.7%) and fulvic acid (technical) were purchased from Sigma Aldrich. Methanol (chromatographically pure) and acetonitrile (chromatographically pure) were purchased from Merck. Hydrogen peroxide (30% by weight), concentrated sulfuric acid (superior purity), KMnO4 (analytical purity), Na2C2O4 (analytical purity), humic acid (analytical purity) was purchased from Sinopharm Chemical Reagent. Other chemical substances involved in the experiment are all superior pure. Deionized (DI) water is prepared by Molresearc 1020A ultrapure water reactor.
Stock solutions of MTZ and pCBA were prepared in DI water and stored at 4 °C in the dark. For the kinetic studies, the initial concentrations of MTZ and pCBA in the working solutions were 10 μM. Solution pH was adjusted to pH 3.0 with 10 mM phosphate buffer system. The pH value of the reaction system remained constant throughout the experiment. Experimental design and operation process had been introduced in our previous papers [36,37].

2.2. Analytical Methods

Average light intensity per volume (I0) and effective optical path length (l) was measured by potassium ferric oxalate and H2O2 chemical photometer method. USB 2000+, Ocean Optics fiber optic spectrometer was used to measure the emission spectrum and light intensity of low-pressure mercury lamp. Absorption spectra of MTZ and pCBA were measured by Shimadzu UV-2550 spectrometer. Solution pH was determined by Mettler Toledo S400-K pH meter. Ultra-performance liquid chromatography (UPLC, Waters ACQUITY H-Class, Waters, Milford, MA, USA), which has a BEH C18 column (1.7 μm, 2.1 mm × 50 mm, Waters, Milford, MA, USA), was used to analyze MTZ and pCBA content. Detailed analysis method is shown in Table 1.

2.3. Statistics Analysis

Data were statistically analyzed by using Microsoft Office Excel 2016. Charts are drawn by Origan Pro 2018. All data were expressed as mean ± standard deviation of three replicate experiments (n = 3).

3. Results and Discussion

3.1. Effective Light Intensity and Optical Path of Photochemical Reaction System

Chemical photometry is a chemical method widely used in photochemistry research to measure the irradiation intensity of photochemical systems [38,39,40,41]. Compared with other measurement methods, the chemical photometer measurement method has the characteristics of simple operation, sensitive response, reliable data, and so on. It can accurately measure the radiation intensity and has good reproducibility [39,40]. Therefore, as a simple and accurate method to determine the irradiation intensity, chemical photometry has been widely used in the field of photochemistry in recent years.
The chemical photometry method is mainly based on the principle of photochemical reaction, and selects substances whose quantum yield has been accurately measured and whose value is relatively stable to measure the irradiation intensity of the photochemical system [38,39]. Substances selected by the chemical photometry method may not be limited by the form. At present, liquid-phase chemical photometry is more used in the determination of irradiation intensity of the photochemical system, while gas-phase and solid-phase chemical photometry are less used [38,40]. Gas phase chemical photometry is mainly used to measure the irradiation intensity in a vacuum system [40,41].
In this study, the effective irradiation intensity of the low-pressure mercury lamp in the photochemical system was measured by the potassium ferric oxalate chemical photometer method [38,39] and the hydrogen peroxide chemical photometer method [40,41,42]. Both of the two chemical photometry methods belong to the liquid phase chemical photometry method, which is mainly applicable to the light source with the wavelength range of 200~380 nm. The main irradiation intensity of the low-pressure mercury lamp used in this study is concentrated at 254 nm, which is included in the measurement wavelength range of potassium ferric oxalate and hydrogen peroxide chemical photometer method.

3.1.1. Potassium Ferric Oxalate Chemical Photometer Method

In this method, the absorbance of the red complex formed by the reaction of analytical reagent 1, 10 o-phenanthroline with Fe2+ was measured by UV-Vis spectrophotometer at 510 nm, and the concentration of Fe2+ was calculated according to the standard curve. Fe2+ is produced by Fe3+ under acidic conditions through light radiation. The stoichiometric relationship of the reaction is as follows [38]:
2   [ Fe ( C 2 O 4 ) 3 ] 3 + h v   2   [ Fe ( C 2 O 4 ) 2 ] 2 + [ C 2 O 4 ] 2 + 2 CO 2
Effective light intensity can be calculated according to the following two methods:
(1)
Calculate the fitting equation of [ Fe 2 + ] for UV irradiation time t, and obtain k 0 value.
d [ Fe 2 + ] dt = k 0
Effective radiation intensity can be calculated by the following formula:
I 0 = k 0 / Φ
where I 0 is the effective light intensity (Einstein L−1s−1); Φ is the quantum yield of potassium iron oxalate, and the quantum yield at 254 nm is 1.25 mol Einstein−1 [43].
(2)
Effective light intensity ( I 0 ) can also be calculated by the following formula:
I 0 = Δ n / ( 10 3 Φ V 1 t )
where I 0 is the effective light intensity (Einstein L−1s−1); Δn is the amount of Fe2+ generated at time t of photochemical reaction (mole); Φ is the quantum yield of potassium iron oxalate, and the quantum yield at 254 nm is 1.25 mol Einstein−1 [43]; V1 is the volume of reaction solution exposed to light (mL); t is the reaction time (s).
Δn can be calculated by the following formula:
Δn = 10−3V1V3Ct/V2
where V1 is the volume of reaction solution illuminate; V2 is the volume of sampling and analysis (mL); V3 is the total volume of absorbance measured after dilution (mL); Ct is the concentration of Fe2+ measured after dilution (M).
Ct can be calculated according to the following formula by measuring the absorbance at 510 nm:
Ct = A/(ε·l)
where A is the absorbance at 510 nm; ε is the molar absorption coefficient (M−1 cm−1), which is equal to the slope of the previous standard curve; l is 1 cm, the optical path of the cuvette.
According to the experimental results, the fitting curve of the amount of photogenerated Fe2+ to the illumination time is drawn, as shown in Figure 1.
According to the above calculation method of effective irradiation intensity, the average value of the measured effective irradiation intensity is 7.50 (±0.23) × 10−6 Einstein L−1 s−1. When the interval between two batches of experiments is too long, the effective light intensity needs to be re-measured to eliminate interference.

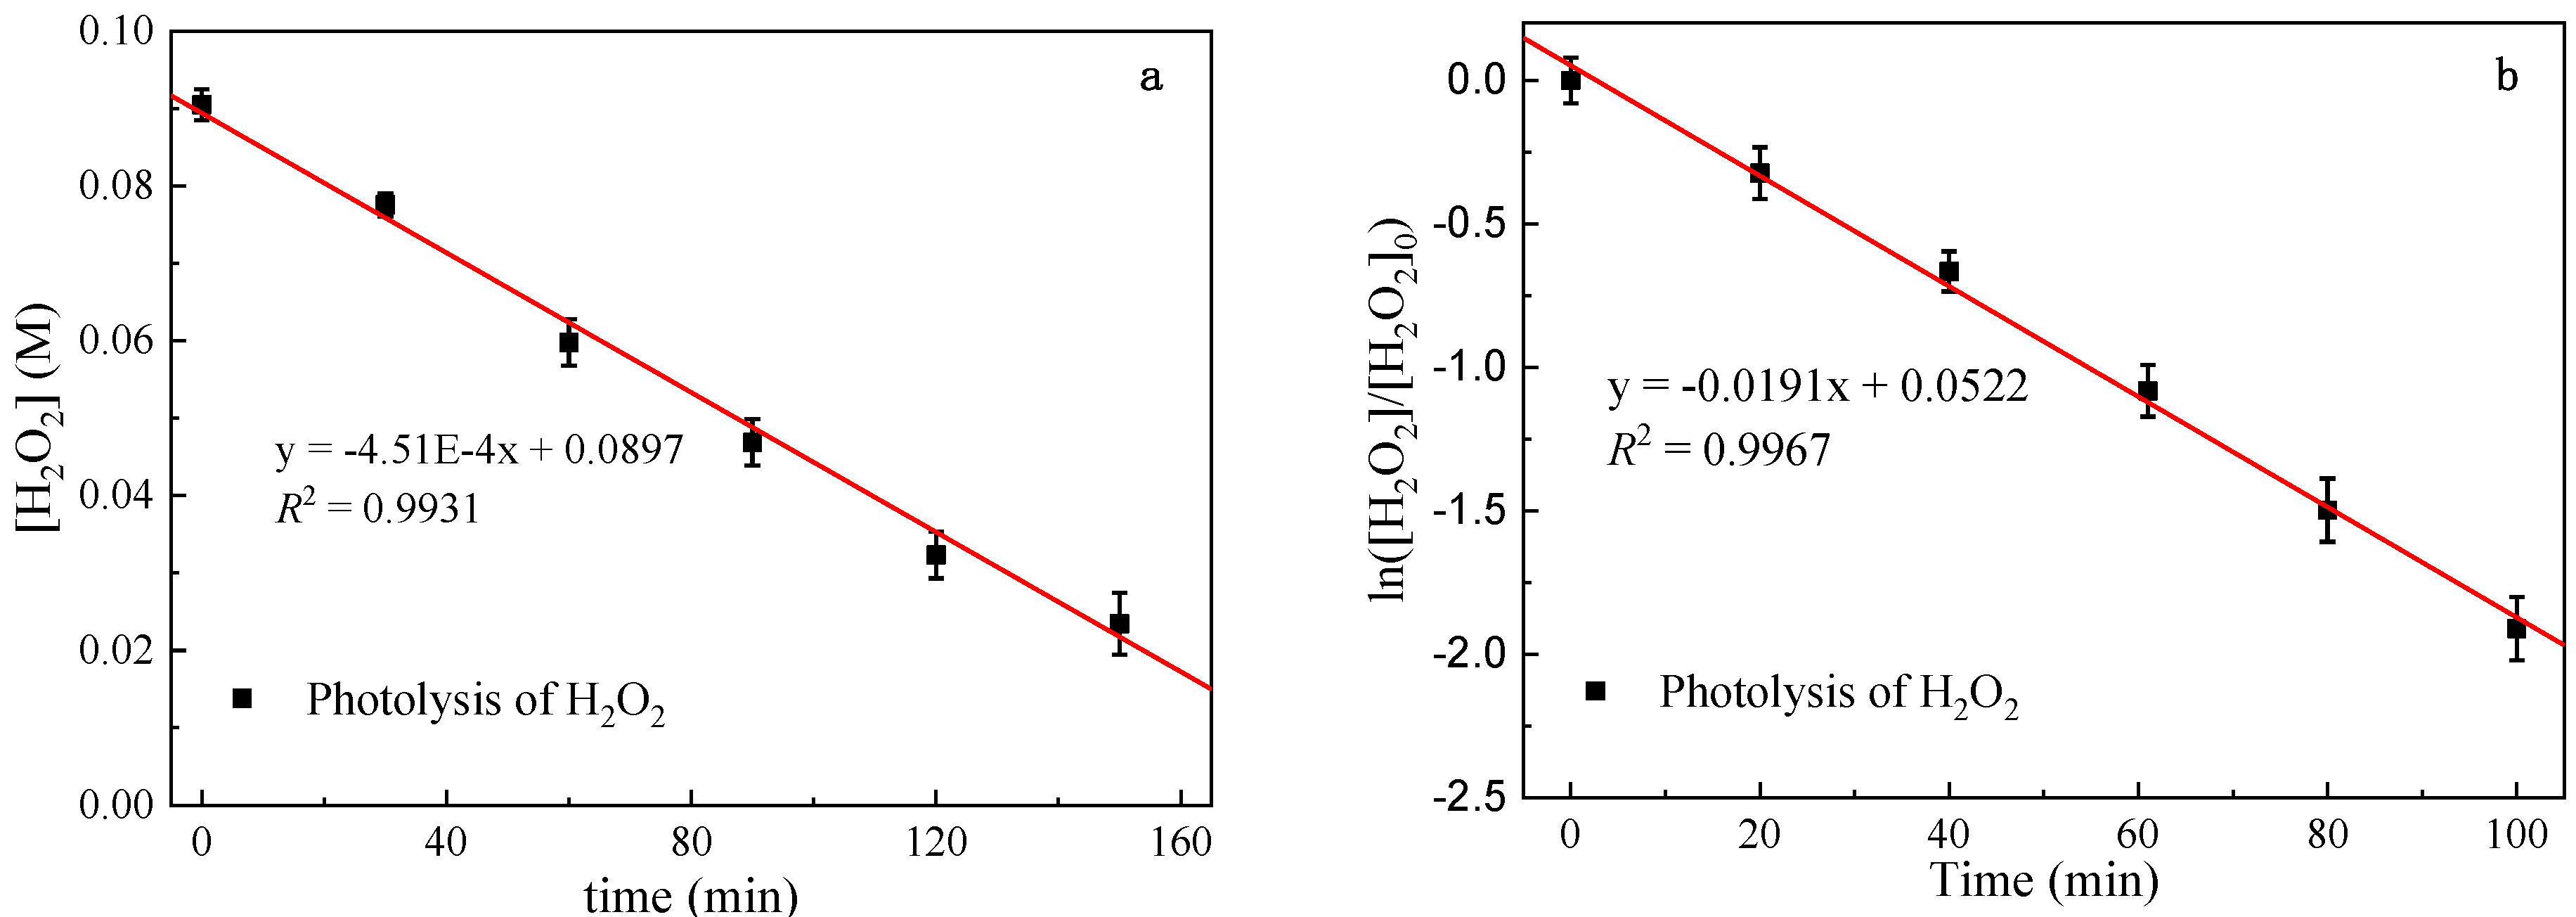
3.1.2. Hydrogen Peroxide Chemical Photometer Method

Based on quantum yield and Lambert–Beer law, the overall photolysis rate of hydrogen peroxide can be described as:
dC dt = Φ λ I 0 ( 1 e 2.303 ε λ l C )
where Φ λ is the quantum yield of hydrogen peroxide at 254 nm (0.5 mol Einstein−1); I 0 is the effective light intensity (Einstein L−1 s−1); ε λ is the molar absorption coefficient (M−1 cm−1), and the molar absorption coefficient of hydrogen peroxide at 254 nm is 19.6 M−1 cm−1; l is the effective optical path (cm); C is the initial concentration of hydrogen peroxide (M).
When 2.303ελlC > 2, this formula can be simplified as
dC dt = Φ λ I 0
When 2.303ελlC < 0.02, this formula can be simplified as
dC dt = 2.303 Φ λ I 0 ε λ l C
This simplified formula can be used to calculate the effective light intensity and effective optical path of the photochemical reaction system, respectively [41].
As shown in Figure 2, the photodegradation experimental results of high-concentration H2O2 in the photochemical reaction system are fitted to the zero-order reaction kinetics, and the R2 was 0.9931. According to the above light intensity calculation formula, the effective light intensity calculation result is 7.50 (±0.25) × 10−6 Einstein L−1 s−1. The result is consistent with the value determined by potassium ferric oxalate photometry, proving that the two methods have good repeatability and effectiveness.
Photodegradation experimental results of low concentration H2O2 in the photochemical reaction system shows that the fitting degree of the first-order reaction kinetics is the highest. Therefore, the photolysis of low-concentration H2O2 is more in line with the first-order reaction kinetic equation. The effective optical path can be calculated according to the formula l = kobs/2.3ε ΦpI0. As shown in the H2O2 photolysis experimental results (Figure 2b), R2 fitting the first-order reaction kinetics reaches 0.9967. The effective optical path was measured as 0.935 (±0.04) cm.
The results show that the measured value by the hydrogen peroxide chemical photometer method is consistent with that of the potassium ferric oxalate chemical photometer method, which has good repeatability and effectiveness. It should be noted that when the interval between two batches of experiments is too long, the effective light intensity and the effective optical path of the photochemical reaction system need to be recalibrated to eliminate the interference as much as possible.

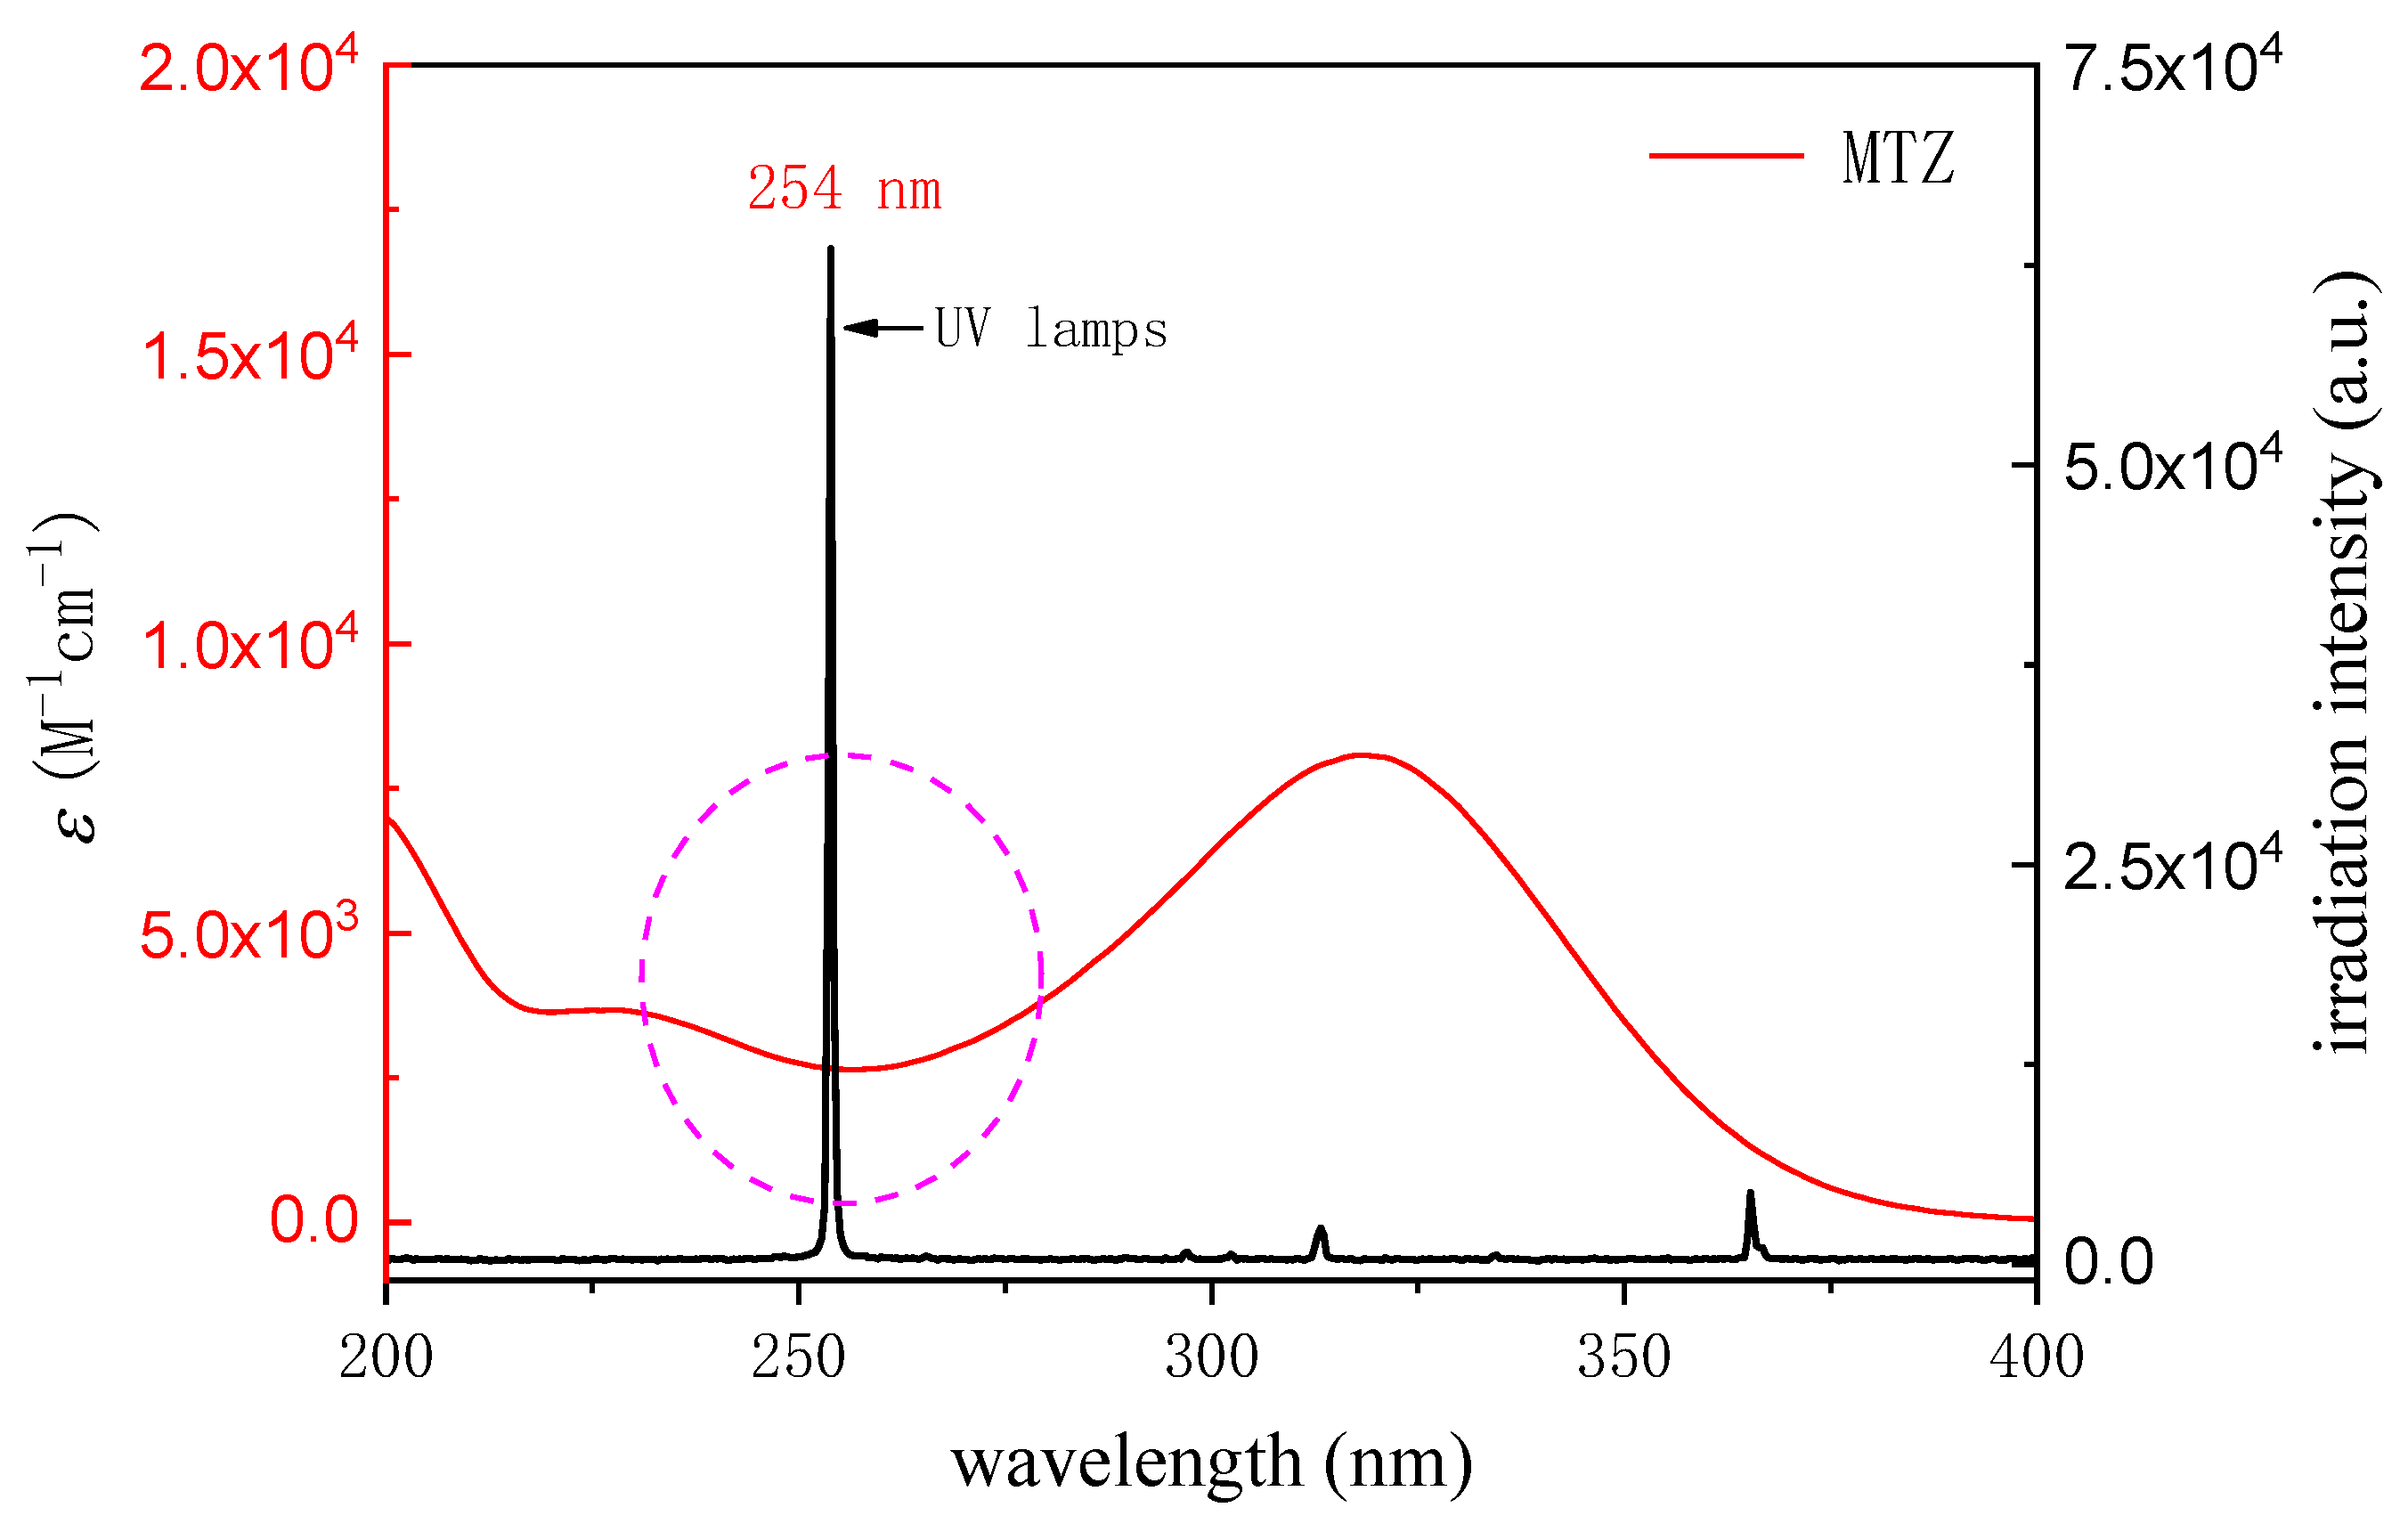
3.2. Direct Photolysis of Metronidazole

The kinetic equation fitting of the direct degradation process of the MTZ-containing nitroimidazole ring structure in the UV system was carried out using the linear regression method, and the results show that the pseudo first-order reaction kinetics were followed (Figure 3). Under the UV radiation of light intensity 7.50 × 10⁻⁶ Einstein L−1s−1, the initial direct photolysis rate of MTZ (initial concentration 10 µM) is 0.147 µM min−1 (pH = 3.00).
Molar absorption coefficient and quantum yield have important effects on the direct photolysis of compounds [44,45]. Molar absorption coefficient (ε) indicates that the compound absorbs a specific wavelength (λ) light. ε can be calculated by measuring the absorbance (A) of MTZ (10 µM) solution with pH = 3.00 in 1 cm optical path (l) quartz cuvette:
A = ε   [ MTZ ] l
Figure 4 shows the overlapping diagram of the molar absorption coefficient of MTZ and the emission spectrum of the low-pressure mercury lamp. It can be seen that the emission wavelength of the low-pressure mercury lamp (GPH212T5L/4, 10 W, Heraeus) is mainly distributed around 254 nm. The main UV absorption range of MTZ is 300~350 nm, and the UV absorption of 254 nm mainly emitted by the low-pressure mercury lamp used in this experiment is weak. The molar absorption coefficient of MTZ at 254 nm is 2645.44 M−1 cm−1 (pH 3.00). Previously, the molar absorptivity of MTZ has not been reported yet. Compared with other PPCPs, the molar absorptivity is at a lower level [46]. For example, Kwon et al. [47] reported that the molar absorption coefficient of IBU at 254 nm was 256 M−1 cm−1 under neutral conditions, Vogna [48] reported that the molar absorption coefficient of CBZ at 254 nm was 6025 M−1 cm−1, and Yang [46] reported that the molar absorption coefficient of sulfamethoxazole at 254 nm under neutral conditions was 16,200 M−1 cm−1.
Quantum yield represents the utilization rate of light quantum in photochemical reaction and describes the ratio of the total number of effective photons to the total number of photons absorbed by the compound. The quantum yield of MTZ can be calculated as follows [44]:
φ MTZ = r UV I 0 ( 1 10 ε MTZ   l   [ MTZ ] )
where φ MTZ (mol Einstein−1) is the quantum yield of MTZ at 254 nm; ruv (M s−1) is the direct photolysis rate (MTZ initial concentration 10 μM); ε MTZ is the molar absorption coefficient at 254 nm (2645.44 M−1 cm−1, pH 3.00). The φ MTZ (5.9 × 10⁻³ mol Einstein−1) is consistent with the reported value 3.3 × 10⁻³ mol Einstein−1 [49]. φ MTZ is higher than trimethoprim (1.52 × 10⁻³ mol Einstein−1), and close to naproxen (9.3 × 10⁻³ mol Einstein−1), but lower than phenytoin sodium (0.279 mol Einstein−1) and clofibric acid (0.539 mol Einstein−1) [44,50]. Although the molar absorption coefficient of MTZ was 2645.44 M−1 cm−1, low φ MTZ (5.9 × 10⁻³ mol Einstein−1) leads to the low direct photolysis of MTZ.

3.3. MTZ Degradation Kinetic in UV/H2O2 System

The degradation process of MTZ in the UV/H2O2 system was fitted to the kinetic equation using the linear regression method. The results show that the degradation of MTZ followed the pseudo first-order reaction kinetics (Figure 3). MTZ concentration in the system did not change within 60 min after adding 100 µM H2O2 to the dark reaction control experiment, indicating that, alone, H2O2 had no degradation effect on MTZ. Compared with UV irradiation alone, the MTZ degradation rate was significantly increased after adding 100 μM H2O2 to the UV system, and the degradation rate was 1.47 µM min−1 at pH 3.00, which is 10 times higher than that of UV alone. Therefore, free radicals might play a major role in MTZ degradation.
At present, TPA is often used to measure OH in reaction systems by fluorimetry [51,52]. TPA itself does not fluoresce, but it can react with OH to produce 2-hydroxyterephthalic acid (HTPA), which has fluorescence characteristics. As shown in the interior drawing of Figure 5, HTPA is the only product due to the symmetry of the TPA structure.
As shown in Figure 5, OH exists in the UV/H2O2 system. Compared with UV alone, the main reason for the MTZ degradation rate increase in the UV/H2O2 system is that the dominant mechanism of MTZ degradation in the photoreaction system is turn the direct photolysis induced by UV to the OH-mediated oxidation produced by UV-activated H2O2.

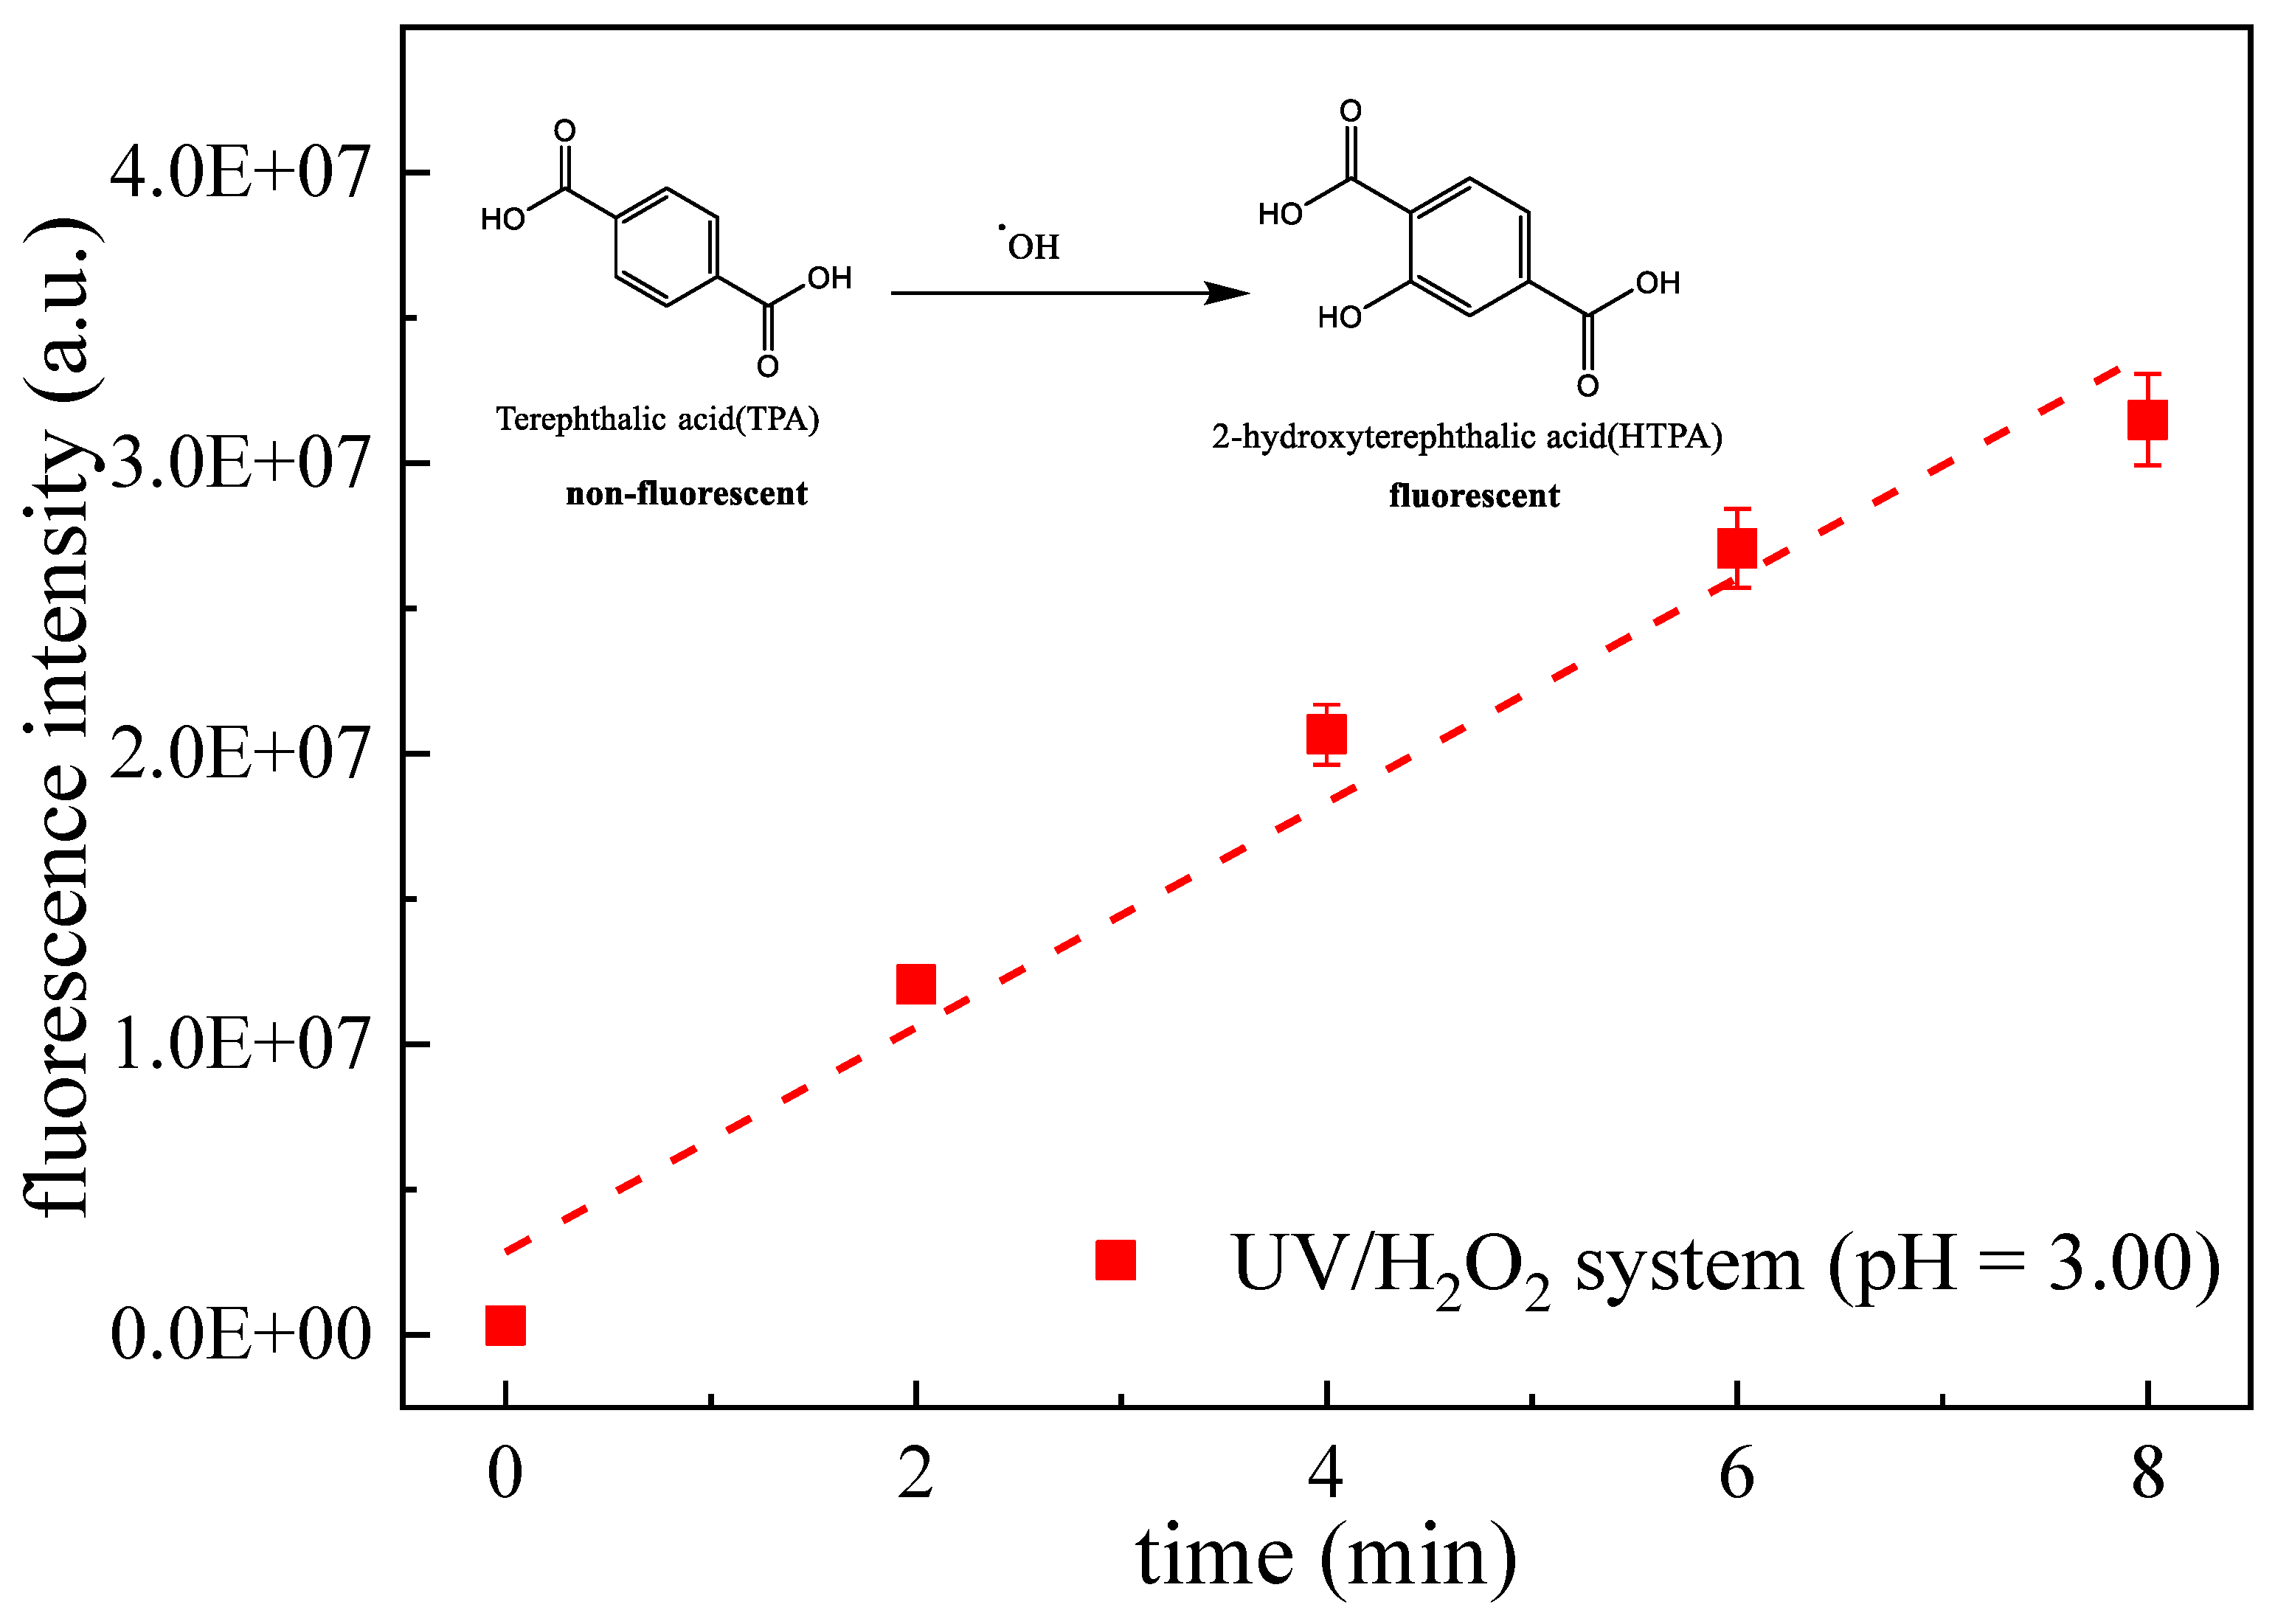
3.4. Competitive Kinetic

Second-order reaction rate constant k MTZ , OH   for OH and MTZ reactions can be calculated by the competitive kinetic method with 4-chlorobenzoic acid (pCBA) as the reference substance, and the calculation formula is as follows [53,54,55]:
k MTZ , OH   k p CBA , OH   = ( ln   [ MTZ ] t   [ MTZ ] 0 ) tot ( ln   [ MTZ ] t   [ MTZ ] 0 ) UV ( ln   [ p CBA ] t   [ p CBA ] 0 ) tot ( ln   [ p CBA ] t   [ p CBA ] 0 ) UV = k tot ,   MTZ k UV ,   MTZ k tot ,   p CBA k UV ,   p CBA
From the above formula, k tot , MTZ k UV , MTZ is the MTZ degradation rate caused by OH, k tot , p CBA k UV , p CBA is the pCBA degradation rate caused by OH. At pH 3.00, the average reaction rate constant ratio of MTZ and pCBA to OH is 0.62 ([MTZ] = [pCBA] = 10 μM, [H2O2] = 100 μM, and I0 = 7.50 × 10⁻⁶ Einstein L−1 s−1, l = 0.935 cm), k MTZ , OH   value is calculated as 2.79 (±0.32) × 109 M−1 s−1. The value of k MTZ , OH   in this study is consistent with the measured value 3.54 (±0.42) × 109 M−1 s−1, which is reported by Lian [56]. k MTZ , OH   is smaller than that of other compounds with OH. For example, the k value of trimethoprim with OH is 6.69 × 10⁹ M−1 s−1 [57], the k value of ibuprofen with OH is 5.57 × 10⁹ M−1 s−1 [47] and the k value of sulfamethoxazole with OH is 1.2 × 10¹⁰ M−1 s−1 [58].

3.5. Pseudo First-Order Reaction Kinetic Model Based on Steady State Assumption

MTZ degradation kinetic in the UV/H2O2 system can be explained by the pseudo first-order reaction kinetic model of free radical steady state hypothesis. This method is based on the assumption that the free radicals (i.e., OH) generated by UV-excited H2O2 play a major role in the degradation of the target compound, and the free radical concentration in the system is relatively stable [36]. The main reactions and reaction rate constants in the UV/H2O2 system are summarized in Table 2. The kinetic model of MTZ degradation in the UV/H2O2 system is established as follows.
Under steady-state conditions, the reaction rate (rtot, M s−1) of MTZ in the UV/H2O2 system can be expressed as the following formula [59]:
r tot = r UV + r OH  
where rUV is the initial reaction rate of direct photolysis of MTZ in the UV/H2O2 system; r OH   is the reaction rate of MTZ with OH. rUV and r OH   can be expressed by the following formula:
r UV = φ MTZ I 0   l   ε MTZ   [ MTZ ] A ( 1 10 A )
r OH   = k MTZ , OH   [ OH   ] SS   [ MTZ ]
A = l   ( ε MTZ   [ MTZ ] + ε H 2 O 2   [ H 2 O 2 ] )
where I0 is the effective light intensity; l is the effective optical path; A is the absorbance value of the reaction solution; ε H 2 O 2 is the molar absorptivity of H2O2 at 254 nm (19.6 M−1 cm−1) [59]. ε MTZ is the molar absorption coefficient of MTZ at 254 nm; φ MTZ is the quantum yield of MTZ at 254 nm; [ OH   ] SS is the steady-state concentration of OH in the system; k MTZ , OH   are the second-order reaction rate constants of MTZ and OH. In this system, I0 is 7.50 × 10⁻⁶ Einstein L−1 s−1, l is 0.935 cm, the molar absorptivity of the target compound MTZ in this study is 2645.44 M−1 cm−1, and the quantum yield is 5.9 × 10⁻³ mol Einstein−1 (pH 3.00). [MTZ]0 and [H2O2]0 are actually measured as 10 and 90 μM, respectively. The reaction condition was stable at pH 3.00.
MTZ degradation follows pseudo first-order reaction kinetic equation (the unit, s−1) in the UV/H2O2 system, as follows:
k tot   [ MTZ ] = k UV [ MTZ ] + k MTZ , OH     [ OH   ] SS   [ MTZ ]
Under steady-state conditions, the production rate ( r 0 , OH   ) of OH is equal to the consumption rate. Therefore, the steady-state concentration of OH (i.e., [ OH   ] SS ) can be calculated by the following formula:
0 = d [ OH   ] d t = r 0 , OH   ( k MTZ , OH     [ MTZ ] [ OH   ] SS + k 1 [ H 2 O 2 ] [ OH   ] SS + k 2 [ HO 2 ] [ OH   ] SS + k H 1 [ OH   ] SS [ H 2 PO 4 ] + k H 2 [ OH   ] SS [ HPO 4 2 ] + k Hi [ OH   ] SS [ S i ] )
In the UV/H2O2 system, r 0 , OH   can be calculated by the following formula [59]:
r 0 , OH   = 2 φ OH   E H = 2 φ OH   I 0   f H 2 O 2   ( 1 10 A )
f H 2 O 2 =   l   ε H 2 O 2 [ H 2 O 2 ] A
where φ OH   is the quantum yield (0.5 mol Einstein−1) of H2O2 at 254 nm [59]. The mean values of r 0 _ OH   and k tot were 2.34 × 10⁻⁸ M s−1 and 2.45 × 10⁻³ s−1 (pH 3.00).
Through the above formula, k MTZ , OH   and steady state concentration [ OH   ] SS was calculated by the following formula:
k MTZ , OH   = ( k tot k UV ) ( k 1 [ H 2 O 2 ] + k 2 [ HO 2 ] + k H 1 [ H 2 PO 4 ] + k H 2 [ HPO 4 2 ] + k Hi [ S i ] ) 2 φ H I 0 f H   ( 1 10 l ε i C i ) ( k tot k UV )   [ MTZ ]
[ OH   ] SS = 2 φ H I 0 f H   ( 1 10 l ε i C i ) k 1 [ H 2 O 2 ] + k 2 [ HO 2 ] + k MTZ , OH   [ MTZ ] + k H 1 [ H 2 PO 4 ] + k H 2 [ HPO 4 2 ] + k Hi [ S i ]
According to the steady state kinetic model, the k MTZ , OH   can be calculated as 2.43 (±0.25) × 109 M−1 s−1, which is similar to the value determined by the competitive kinetic method in this study (2.79 (±0.32) × 109 M−1 s−1). This verifies the reliability of this steady state kinetic model. Under the initial conditions of pH 3.00, the mean values of [ OH   ] SS were 2.36 × 10⁻¹³ M. Kwon et al. [47] reported that [ OH   ] SS was 2.70 × 10⁻¹³ M in their UV/H2O2 system ([H2O2]0 = 0.5 mM, I0 = 0.5 mW cm−2, l = 0.79 cm, [IBU]0 = 10 µM, pH = 7.00), which was consistent with our measured [ OH   ] SS value.
The contribution of direct photolysis and OH to MTZ degradation in the UV/H2O2 system can be calculated by the above k HO , MTZ , [ OH   ] SS and Formulas (21) and (22).
r tot ( r tot r tot ) = r UV   ( r UV r tot ) + r OH     ( r OH   r tot )
At pH 3.00, rUV and r OH   were 2.43 × 10⁻⁹ M s−1 and 2.21 × 10⁻⁸ M s−1 in the UV/H2O2 system, respectively.
r tot ( 100 % ) = r UV   ( 9.9 % ) + r OH     ( 90.1 % )
The contribution of direct photolysis and OH to the MTZ degradation is shown in the above. When the pH value is 3.00, the contribution of OH to MTZ degradation is 90.1%, while the contribution of direct photolysis is only 9.9%. The kinetic model results show that OH plays a major role in the MTZ degradation and OH is the main active material in the UV/H2O2 system. This result also verifies the conclusion that OH plays a major role in the MTZ degradation in UV/H2O2 system proposed in the kinetic analysis section.

3.6. Influence of H2O2 Dosage and Complex Matrix

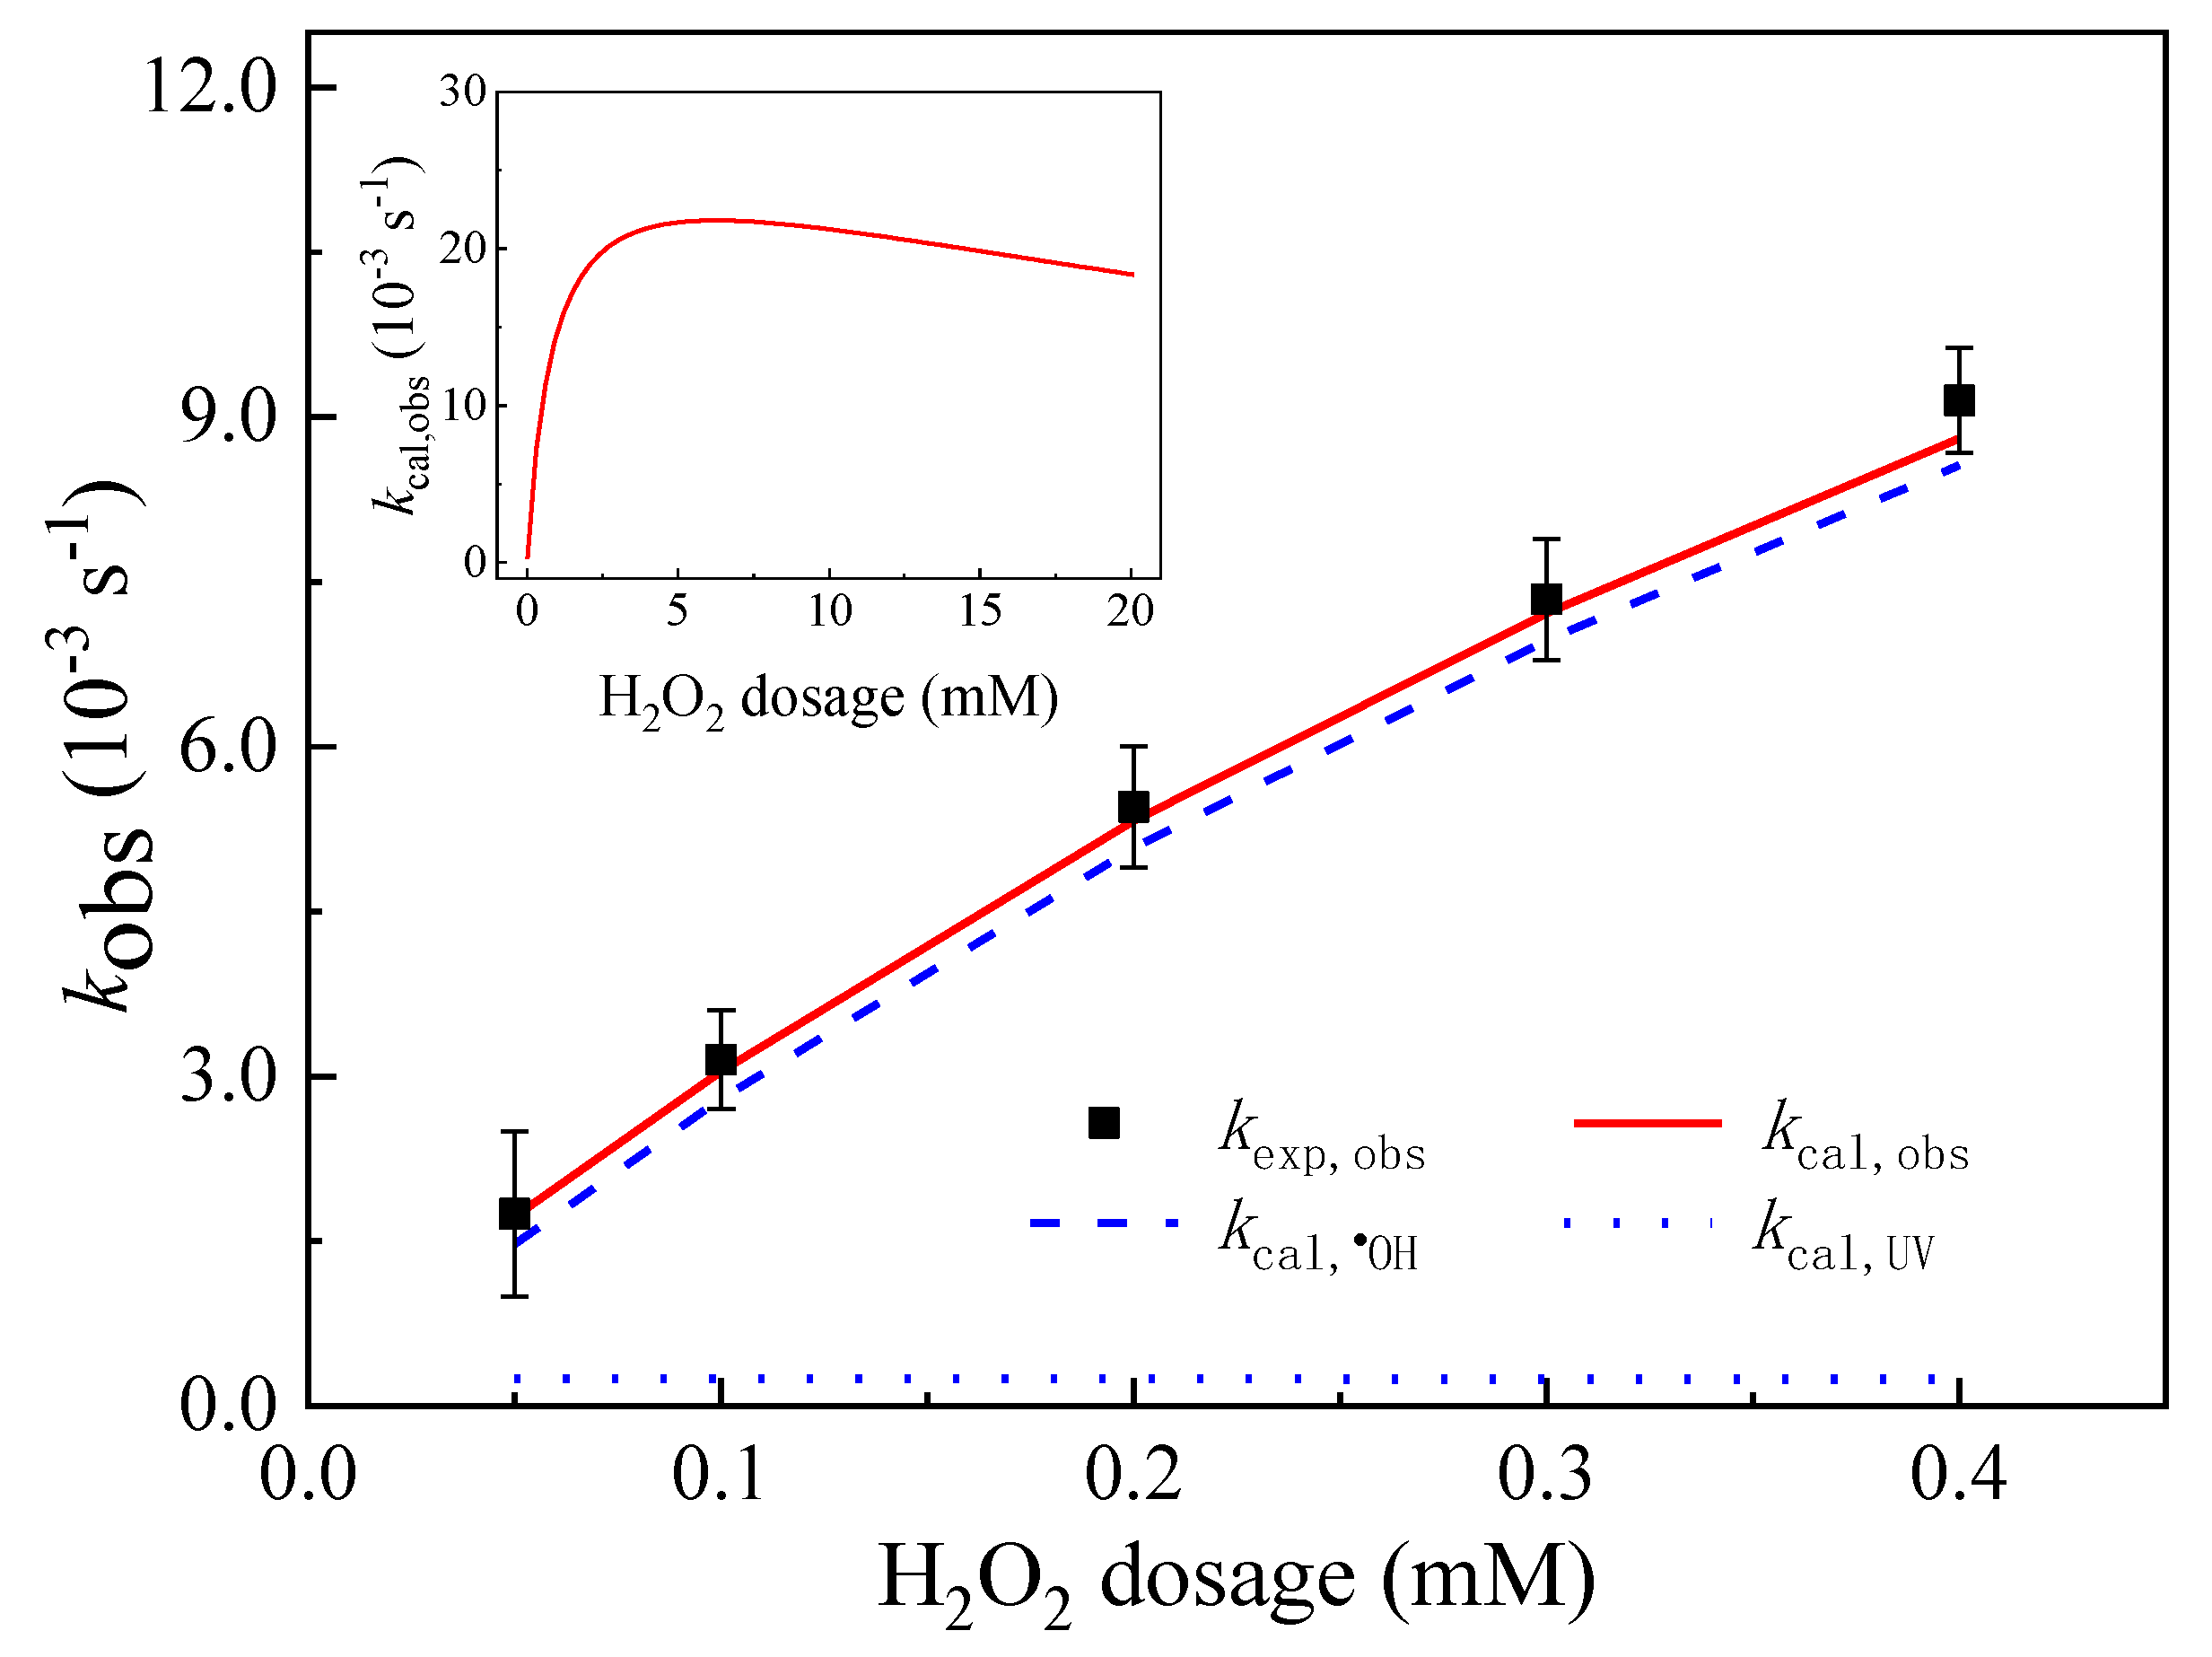
3.6.1. Effect of the Initial H2O2 Dosage

In the UV/H2O2 system, the pseudo first-order reaction kinetic model can be used to simulate and study the effects of other factors on MTZ degradation [41]. The contribution rate of direct photolysis to the degradation of MTZ ( k cal , UV ) and the contribution rate of OH to the degradation of MTZ ( k cal , OH   ) under different conditions are calculated, respectively, by the following formula:
k cal , UV     = φ MTZ I 0   l   ε MTZ A ( 1 10 A )
k cal , OH   = k MTZ , OH     [ OH   ] SS
The total contribution rate ( k cal , obs ) is the sum of direct photolysis and OH to MTZ degradation, as follows:
k cal , obs = k cal , UV + k cal , OH  
H2O2 dosage has an important effect on the degradation of MTZ in the UV/H2O2 system. As shown in Figure 6, with the H2O2 concentration gradually increases from 50 to 400 μM, the pseudo first-order reaction kinetic constant ( k exp , obs ) of MTZ degradation actually measured increases from 1.75 × 10⁻³ s−1 to 9.15 × 10⁻³ s−1. The predicted value of kinetic model k cal , obs and actual measured value k exp , obs coincided well.
The contribution rate of direct photolysis and OH to the MTZ degradation calculated by the kinetic model shows that the concentration of H2O2 gradually increases from 50 to 400 μM and the contribution rate of OH to the MTZ degradation is always greater than 90%, while the contribution rate of direct photolysis is less than 10%. OH is always the main active material in the UV/H2O2 system and plays a major role in the MTZ degradation. The kinetic model predicts that with an initial H2O2 concentration of 90 μM in the UV/H2O2 system, the contribution rates of OH and direct photolysis to MTZ degradation are 92.68% and 7.32%, which are basically consistent with the actual measured contribution rates of OH and direct photolysis (90.1% and 9.9%). Guo et al. [71] found that with the gradual increase in H2O2 concentration from 0 to 5 mM, the experimentally determined apparent rate constant ( k app ) of ciprofloxacin gradually increased from 0.39 × 10⁻³ s−1 to 3.72 × 10⁻³ s−1, which is consistent with the results obtained in our study. The kinetic model simulation results also show that with the further increase in H2O2 concentration, it would have a negative impact on the degradation of MTZ. As shown in the internal diagram of Figure 6, when the H2O2 concentration exceeds 5 mM, k cal , obs gradually showed a downward trend. The main reason for this is that OH can be cleared by excess H2O2, and the second-order reaction rate constant between OH and H2O2 is 2.7 × 10⁷ M−1 s−1 [60].

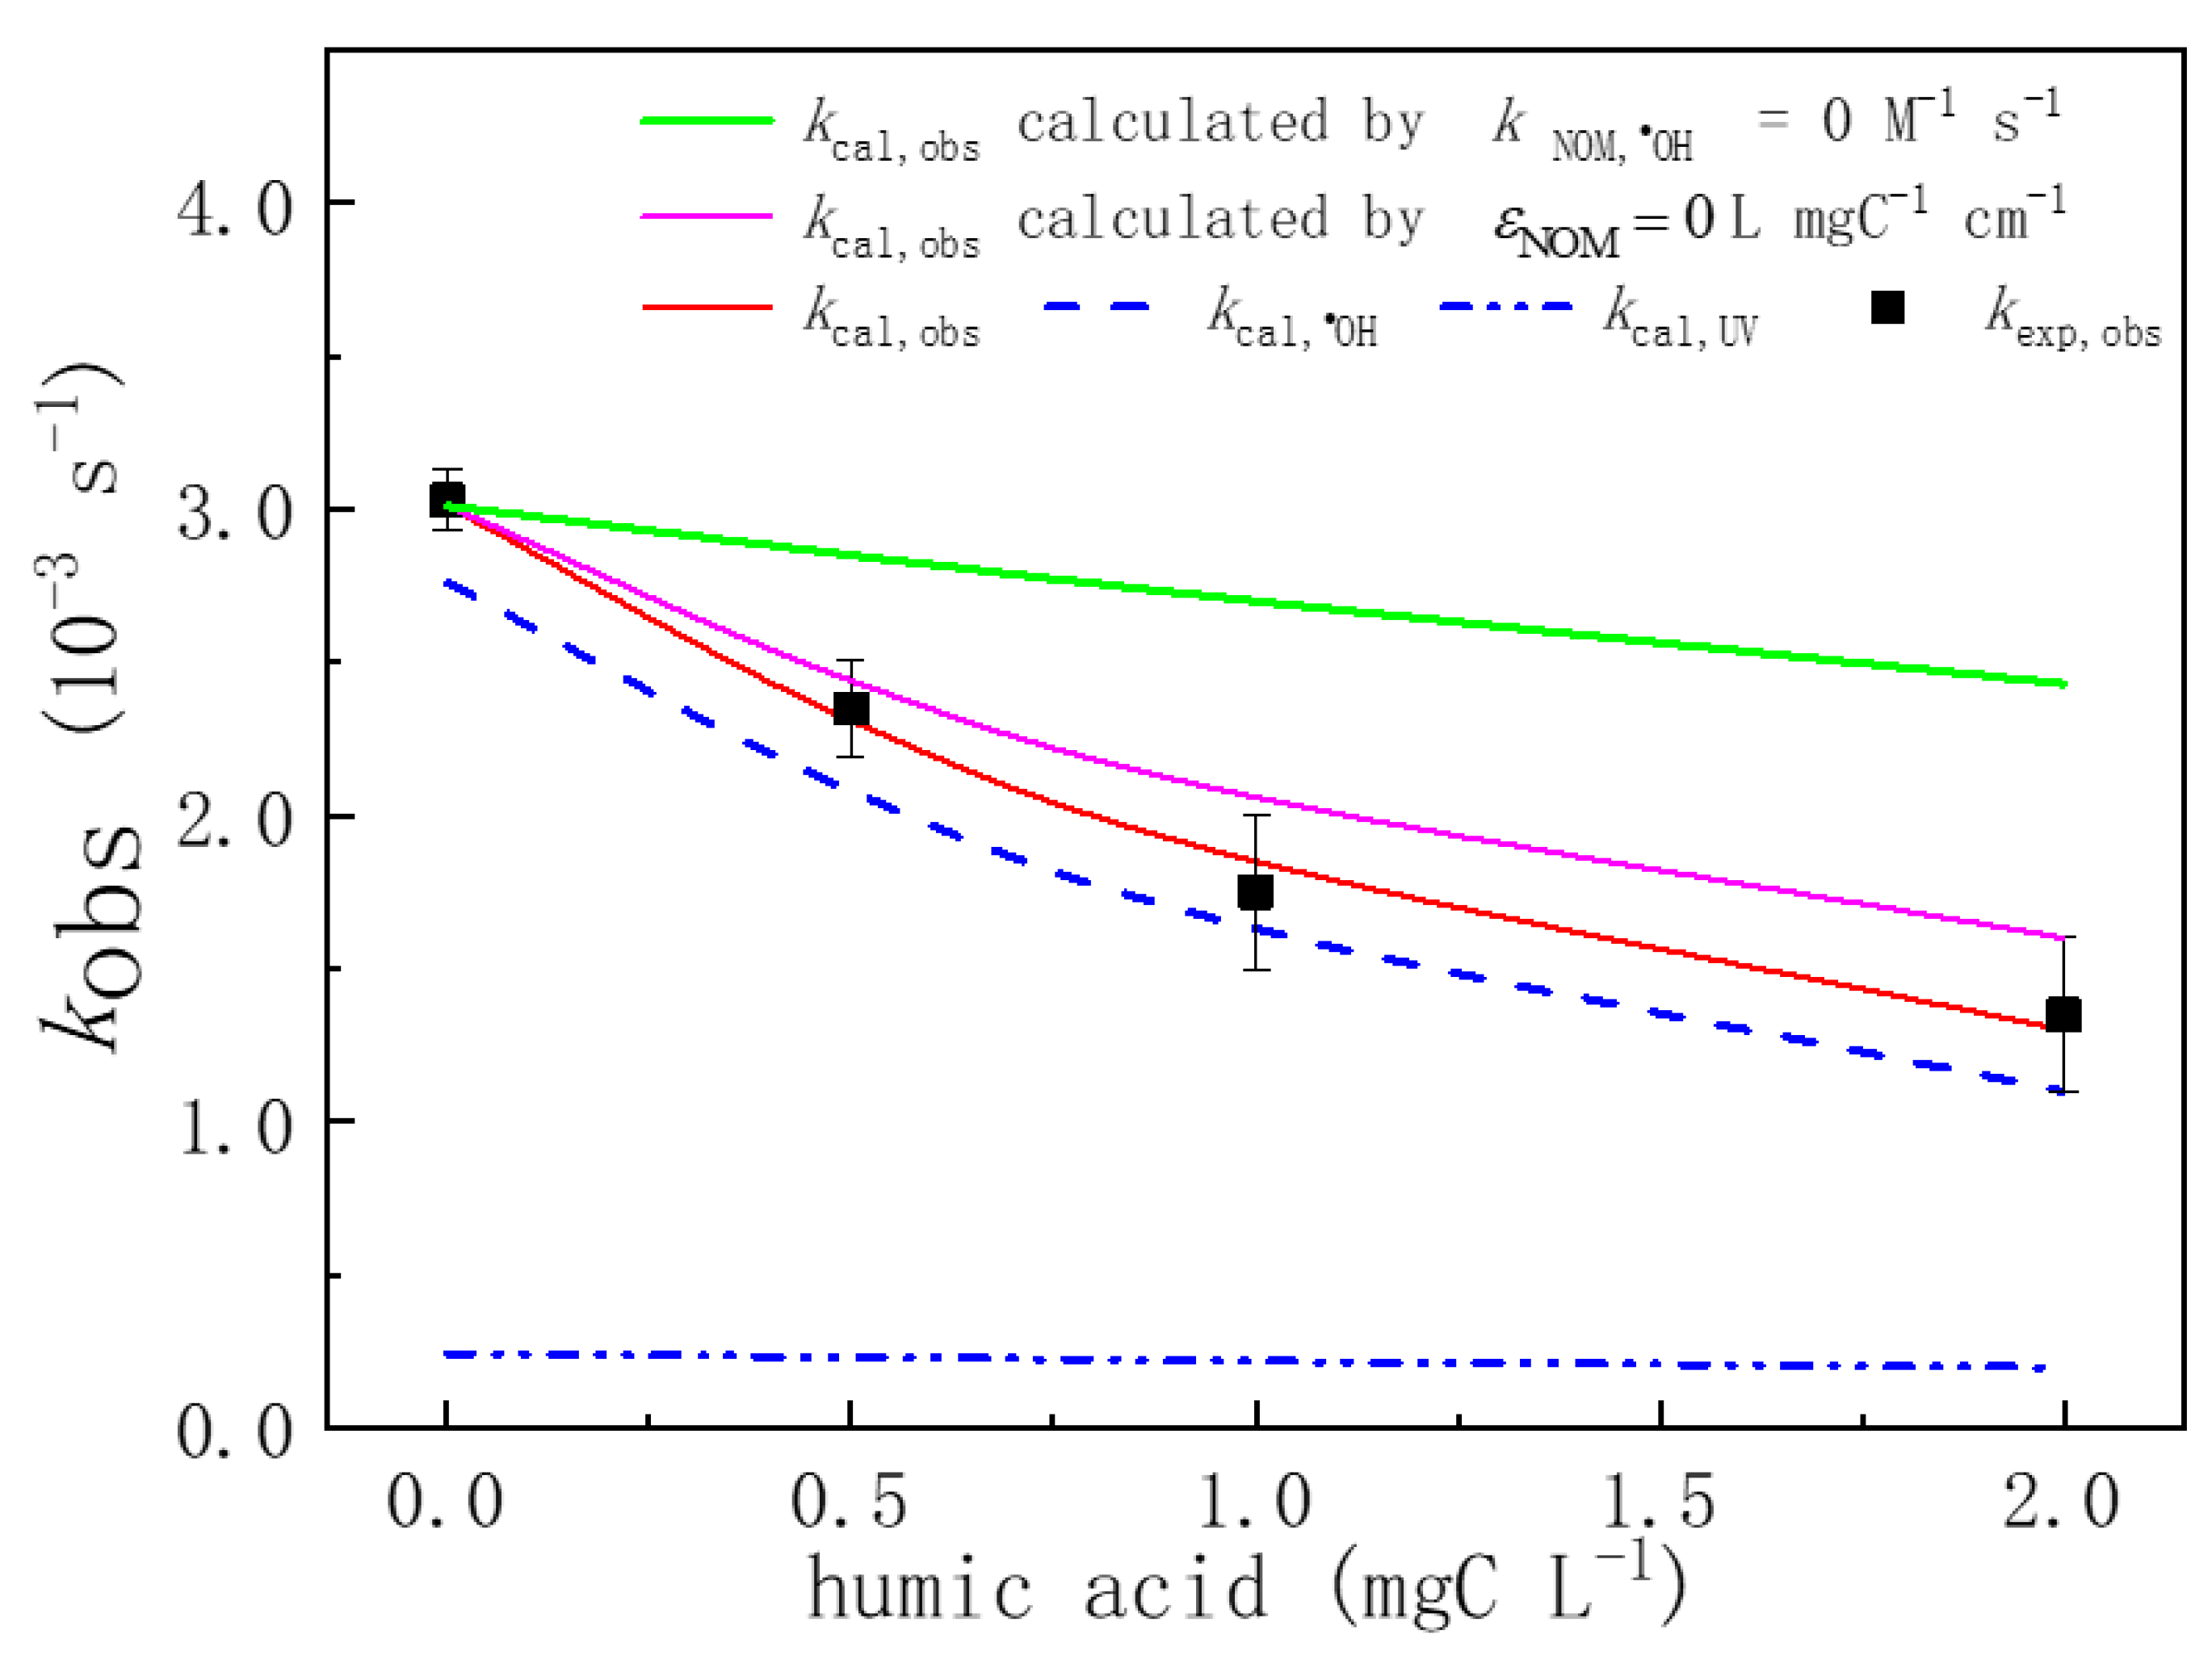
3.6.2. Effect of Organic Matter

As humic acid is the main component of organic matter, the effect of organic matter on the degradation of MTZ in the UV/H2O2 system can be studied by adding humic acid of different concentrations. Figure 7 shows that the humic acid concentration increases from 0 1 to 2.0 mgC L−1, k exp , obs gradually decreased from 3.01 × 10⁻³ s−1 to 2.43 × 10⁻³ s−1 at pH 3.00 condition. The k cal , obs value of MTZ degradation can be obtained by model calculation in the UV/H2O2 system, which has added humic acid, and actual measured value k exp , obs is slightly larger than k cal , obs calculated by the model, indicating that humic acid not only plays the role of quenching free radicals and competing for ultraviolet light in the system, but also contributes to the MTZ degradation by some secondary free radicals, which are generated by the reaction of humic acid and OH [46].
In this study, the inhibition rate of competing UV light and quenching free radicals on the MTZ degradation by humic acid was predicted by the kinetic model. After the addition of humic acid, the overall absorbance of the solution in the UV/H2O2 system is A (A = l(εMTZ [MTZ] +   ε H 2 O 2 [H2O2] + εNOM [humic acid]), and εNOM is determined to be 0.10 L mgC−1 cm−1. If the competition of humic acid for ultraviolet light is ignored (i.e., assuming that the εNOM of humic acid is zero), k cal , obs (purple) only obtained a slight increase (Figure 7). If the role of humic acid as a quenching radical is ignored (i.e., assuming no reaction between humic acid and OH), k cal , obs is greatly improved compared with the actual measured value. These comparative studies show that the effect of humic acid as a quenching radical is greater than that of humic acid as competition for ultraviolet light on the inhibition of MTZ degradation. At the same time, this study compared the contribution rate of direct photolysis and OH to MTZ degradation in the UV/H2O2 system with humic acid. The results show that the contribution rate of OH was still significantly higher than that of direct photolysis, and OH still played a major role in MTZ degradation.

3.6.3. Effect of Inorganic Anions

In the natural water environment, Cl, SO 4 2 , NO 3 and HCO 3 is the main inorganic anion. Therefore, the effect of inorganic anions on MTZ degradation was studied by adding different concentrations (0~5 mM) of Cl, SO 4 2 , NO 3 and HCO 3 in the UV/H2O2 system. At pH 3.00 condition, CO 3 2 / HCO 3 do not exist in the water body, so the impact of CO 3 2 / HCO 3 was not considered in this study. According to the actual measurement, the molar absorptivity of SO 4 2 , NO 3 and Cl at 254 nm is 0.31, 3.53 and 0.045 M−1cm−1, respectively. The study of Xiao et al. [41] also confirmed that the inorganic anions such as SO 4 2 , NO 3 and Cl have no effect on the absorbance value of the reaction solution at 254 nm. Since inorganic anions have no absorbance to UV in UV254 and have no influence on MTZ direct photolysis, direct photolysis rate after adding inorganic anions is approximately equal to the direct photolysis rate when no ions are added. Meanwhile, the production rate of OH can be regarded as approximately equal to that in deionized water. Therefore, the addition of inorganic anions mainly affects the degradation rate through the action of OH and a series of subsequent reactions.
As shown in Figure 8, NO 3 slightly promoted the MTZ degradation in the system, which is consistent with what Xiao et al. [41] reported. Xiao et al. [41] found that the degradation of CHCl2I was promoted by adding NO 3 to the UV/H2O2 system. Under neutral conditions, the redox potential of NO 3 / NO 3 (2.3~2.6 V) is closed to that of OH/H2O (2.39 V), which leads to a slow reaction between NO 3 and OH. Therefore, NO 3 has limited scavenging effect on free radicals [41]. However, NO 3 can absorb ultraviolet light and produce OH in a low quantum yield in the process of complex photolysis (Table 2) [69].
However, SO 4 2 and Cl had little effect on the degradation of MTZ in the UV/H2O2 system. This result is consistent with the previous findings of Xiao et al. [41] and Guo et al. [71]. Xiao et al. [41] found that the CHCl2I degradation rate did not change in the UV/H2O2 system by adding 1~5 mM SO 4 2 and Cl. Guo et al. [71] also reported that SO 4 2 had no effect on the ciprofloxacin degradation. The redox potentials of SO 4 / SO 4 2 (2.43 V) and Cl/Cl (2.41 V) are very similar to OH/H2O (2.39 V) under neutral conditions [72]. The results of this study show that the scavenging effect of SO 4 2 on free radicals is negligible and the scavenging effect of Cl on free radicals is limited. It reports that OH can react with Cl rapidly to form, for example, Cl, ClOH , Cl 2 and other secondary chlorine radicals. ClOH and Cl 2 can also generate OH and Cl through complex chain reaction under the pH condition greater than 7.2 [73]. Therefore, the reaction between the secondary free radicals generated by adding Cl to the UV/H2O2 system and MTZ cannot be ignored. For example, Cl is a strong selective oxidant with high reactivity to compounds containing aromatic groups and electron-rich groups [74]. Cl 2 and Cl have strong oxidation ability, and the redox potential is 2.0 and 2.47 V, respectively [75]. Studies have shown that in some cases, the reaction activity of Cl with organic substances is higher than that of OH. For example, Cl reacts faster with three substituted aromatic hydrocarbons, toluene, benzoic acid and chlorobenzene, compared to OH [76]. Cl 2 oxidizing is less than Cl , but it can also react with organics selectively [77]. Therefore, the effect of Cl quenching free radicals is offset by the OH released by some intermediates (such as ClOH•−) and the reaction of these secondary free radicals with MTZ [78].
Natural water bodies contain a variety of complex matrices. The influence of the complex matrix in natural water on the degradation of organic pollutants could not be ignored. According to the previous reported works, organic matter and inorganic anions are the two substances with a relatively large impact on the removal of organic pollutants [46,69]. Similar results were found on MTZ degradation in the UV/H2O2 system. The results could provide theoretical guidance for the selection of removal technologies of organic pollutants and the specific application of advanced oxidation technologies based on OH in natural water bodies, such as rivers, lakes, and groundwater.

4. Conclusions

In this study, we systematically compared the MTZ degradation behavior and mechanism in the alone UV and UV/H2O2 systems. Specifically, we determined the effective light intensity and effective light path of the photochemical reaction system by using two chemical photometric methods of potassium ferric oxalate and hydrogen peroxide, and we found that the results are consistent in the two methods. MTZ degradation conformed to the pseudo first-order reaction kinetic equation in the UV and UV/H2O2 systems. Compared with the alone UV system, MTZ had a faster degradation rate in the UV/H2O2 system. Molar absorption coefficient and quantum yield have significant effects on the direct photolysis of compounds. Our experimental results show that the relatively low molar absorption coefficient and quantum yield restricted the MTZ direct photolysis. Then, we calculated k MTZ , OH   and [ OH   ] SS by establishing a kinetic model based on the steady-state hypothesis in our UV/H2O2 system. These measured values show good agreement with previously reported ones and competitive kinetic measurement results. Kinetic model analysis and the radical identification experiment showed that OH plays a major role in the MTZ degradation, and OH is the primary active material in the UV/H2O2 system. Finally, we predicted the effect of H2O2 dosage and the complex matrix through the above steady-state kinetic model. The predicted results show a good agreement with the experimental results. H2O2 dosage and the complex matrix have influence on MTZ degradation, which cannot be ignored. These results provided guidance for us to apply advanced oxidation technology based on OH in natural water bodies, such as rivers, lakes, and groundwater. In addition, the developed method combined with experimental and steady-state kinetic model approaches could be applicable to measure and predict the degradation kinetics for other antibiotics to prioritize persistent contaminants at the screening level.

Author Contributions

All authors contributed to the study conception and design. Data curation, Z.W., Z.L. and D.O.; Funding acquisition, R.S.; Methodology, R.S. and Y.L.; Project administration, R.S. and Y.C.; Writing—original draft, R.S. and X.D.; Writing—review and editing, R.S., X.D., H.W. and Y.L. All authors have read and agreed to the published version of the manuscript.

Funding

This research was funded by National Nature Science Foundation of China, grant number 52000183, Key Project of Scientific Research Project of Hunan Provincial Department of Education [20A523], Central South University of Forestry and Technology Introduced Talent Research Startup Fund [2020YJ010].

Institutional Review Board Statement

Not applicable.

Informed Consent Statement

Not applicable.

Data Availability Statement

The authors confirm that the data supporting the findings of this study are available within the article.

Acknowledgments

The authors thank all the participants who devoted their free time to participate in this study. The authors thank Central South University of Forestry and Technology and Central South University for their support. The authors thank the College Students’ Innovation and Entrepreneurship Training Program of China [202110538019X] for their support.

Conflicts of Interest

The authors declare no conflict of interest. The company had no role in the design of the study; in the collection, analyses, or interpretation of data; in the writing of the manuscript, or in the decision to publish the results.

References

  1. K’Oreje, K.O.; Kandie, F.J.; Vergeynst, L.; Abira, M.A.; Van Langenhove, H.; Okoth, M.; Demeestere, K. Occurrence, fate and removal of pharmaceuticals, personal care products and pesticides in wastewater stabilization ponds and receiving rivers in the Nzoia Basin, Kenya. Sci. Total Environ. 2018, 637–638, 336–348. [Google Scholar] [CrossRef] [PubMed]
  2. Ben, Y.; Fu, C.; Hu, M.; Liu, L.; Wong, M.H.; Zheng, C. Human health risk assessment of antibiotic resistance associated with antibiotic residues in the environment: A review. Environ. Res. 2019, 169, 483–493. [Google Scholar] [CrossRef] [PubMed]
  3. Klein, E.Y.; Van Boeckel, T.P.; Martinez, E.M.; Pant, S.; Gandra, S.; Levin, S.A.; Goossens, H.; Laxminarayan, R. Global increase and geographic convergence in antibiotic consumption between 2000 and 2015. Proc. Natl. Acad. Sci. USA 2018, 115, E3463–E3470. [Google Scholar] [CrossRef] [PubMed]
  4. Wang, J.; Zhuan, R.; Chu, L. The occurrence, distribution and degradation of antibiotics by ionizing radiation: An overview. Sci. Total Environ. 2019, 646, 1385–1397. [Google Scholar] [CrossRef]
  5. Guo, X.; Yan, Z.; Zhang, Y.; Xu, W.; Kong, D.; Shan, Z.; Wang, N. Behavior of antibiotic resistance genes under extremely high-level antibiotic selection pressures in pharmaceutical wastewater treatment plants. Sci. Total Environ. 2018, 612, 119–128. [Google Scholar] [CrossRef]
  6. Zhao, R.; Feng, J.; Yin, X.; Jie, L.; Wenjie, F.; Berendonk, T.; Zhang, T.; Li, X.; Li, B. Antibiotic resistome in landfill leachate from different cities of China deciphered by metagenomic analysis. Water Res. 2018, 134, 126–139. [Google Scholar] [CrossRef]
  7. Zhi, S.; Zhou, J.; Yang, F.; Tian, L.; Zhang, K. Systematic analysis of occurrence and variation tendency about 58 typical veterinary antibiotics during animal wastewater disposal processes in Tianjin, China. Ecotoxicol. Environ. Saf. 2018, 165, 376–385. [Google Scholar] [CrossRef]
  8. Su, R.; Li, Y.; Min, M.-Y.; Ouyang, X.-H.; Song, R.-J.; Li, J.-H. Copper-catalyzed oxidative intermolecular 1,2-alkylarylation of styrenes with ethers and indoles. Chem. Commun. 2018, 54, 13511–13514. [Google Scholar] [CrossRef]
  9. Ben, Y.; Hu, M.; Zhang, X.; Wu, S.; Wong, M.H.; Wang, M.; Andrews, C.B.; Zheng, C. Efficient detection and assessment of human exposure to trace antibiotic residues in drinking water. Water Res. 2020, 175, 115699. [Google Scholar] [CrossRef]
  10. Zhang, Q.-Q.; Ying, G.-G.; Pan, C.-G.; Liu, Y.-S.; Zhao, J.-L. Comprehensive Evaluation of Antibiotics Emission and Fate in the River Basins of China: Source Analysis, Multimedia Modeling, and Linkage to Bacterial Resistance. Environ. Sci. Technol. 2015, 49, 6772–6782. [Google Scholar] [CrossRef]
  11. Krzeminski, P.; Tomei, M.C.; Karaolia, P.; Langenhoff, A.; Almeida, C.M.R.; Felis, E.; Gritten, F.; Andersen, H.R.; Fernandes, T.; Manaia, C.M.; et al. Performance of secondary wastewater treatment methods for the removal of contaminants of emerging concern implicated in crop uptake and antibiotic resistance spread: A review. Sci. Total Environ. 2019, 648, 1052–1081. [Google Scholar] [CrossRef] [PubMed]
  12. Su, R.; Ou, Q.; Wang, H.; Luo, Y.; Dai, X.; Wang, Y.; Chen, Y.; Shi, L. Comparison of phytoremediation potential of Nerium indicum with inorganic modifier calcium carbonate and organic modifier mushroom residue to lead-zinc tailings. Int. J. Environ. Res. Public Health 2022, 19, 10353. [Google Scholar] [CrossRef] [PubMed]
  13. Zhu, D.; An, X.-L.; Chen, Q.-L.; Yang, X.; Christie, P.; Ke, X.; Wu, L.; Zhu, Y.-G. Antibiotics disturb the microbiome and increase the iIncidence of resistance genes in the gut of a common soil collembolan. Environ. Sci. Technol. 2018, 52, 3081–3090. [Google Scholar] [CrossRef] [PubMed]
  14. Wang, R.-N.; Zhang, Y.; Cao, Z.-H.; Wang, X.-Y.; Ma, B.; Wu, W.-B.; Hu, N.; Huo, Z.-Y.; Yuan, Q.-B. Occurrence of super antibiotic resistance genes in the downstream of the Yangtze River in China: Prevalence and antibiotic resistance profiles. Sci. Total Environ. 2019, 651, 1946–1957. [Google Scholar] [CrossRef]
  15. He, L.; Su, R.; Chen, Y.; Zeng, P.; Du, L.; Cai, B.; Zhang, A.; Zhu, H. Integration of manganese accumulation, subcellular distribution, chemical forms, and physiological responses to understand manganese tolerance in Macleaya cordata. Environ. Sci. Pollut. Res. 2022, 29, 39017–39026. [Google Scholar] [CrossRef]
  16. Osińska, A.; Korzeniewska, E.; Harnisz, M.; Felis, E.; Bajkacz, S.; Jachimowicz, P.; Niestępski, S.; Konopka, I. Small-scale wastewater treatment plants as a source of the dissemination of antibiotic resistance genes in the aquatic environment. J. Hazard. Mater. 2020, 381, 121221. [Google Scholar] [CrossRef]
  17. Zhao, R.; Feng, J.; Liu, J.; Fu, W.; Li, X.; Li, B. Deciphering of microbial community and antibiotic resistance genes in activated sludge reactors under high selective pressure of different antibiotics. Water Res. 2019, 151, 388–402. [Google Scholar] [CrossRef]
  18. Su, R.; Xie, C.; Alhassan, S.I.; Huang, S.; Chen, R.; Xiang, S.; Wang, Z.; Huang, L. Oxygen reduction reaction in the field of water environment for application of nanomaterials. Nanomaterials 2020, 10, 1719. [Google Scholar] [CrossRef]
  19. Su, R.; Zhang, H.; Chen, F.; Wang, Z.; Huang, L. Applications of single atom catalysts for environmental management. Int. J. Environ. Res. Public Health 2022, 19, 11155. [Google Scholar] [CrossRef]
  20. Su, R.; Yang, X.-H.; Hu, M.; Wang, Q.-A.; Li, J.-H. Annulation Cascades of N-Allyl-N-((2-bromoaryl)ethynyl)amides Involving C–H Functionalization. Org. Lett. 2019, 21, 2786–2789. [Google Scholar] [CrossRef]
  21. Jia, A.; Wan, Y.; Xiao, Y.; Hu, J. Occurrence and fate of quinolone and fluoroquinolone antibiotics in a municipal sewage treatment plant. Water Res. 2012, 46, 387–394. [Google Scholar] [CrossRef] [PubMed]
  22. Le, T.-H.; Ng, C.; Tran, N.H.; Chen, H.; Gin, K.Y.-H. Removal of antibiotic residues, antibiotic resistant bacteria and antibiotic resistance genes in municipal wastewater by membrane bioreactor systems. Water Res. 2018, 145, 498–508. [Google Scholar] [CrossRef] [PubMed]
  23. Rodriguez-Mozaz, S.; Chamorro, S.; Marti, E.; Huerta, B.; Gros, M.; Sànchez-Melsió, A.; Borrego, C.M.; Barceló, D.; Balcázar, J.L. Occurrence of antibiotics and antibiotic resistance genes in hospital and urban wastewaters and their impact on the receiving river. Water Res. 2015, 69, 234–242. [Google Scholar] [CrossRef] [PubMed]
  24. Luo, Y.; Su, R.; Yang, H. Efficient copper(i)-catalyzed oxidative intermolecular 1,2-estersulfenylation of styrenes with peroxyesters and disulfides. Org. Biomol. Chem. 2020, 18, 5045–5049. [Google Scholar] [CrossRef]
  25. Huang, Y.; Kong, M.; Coffin, S.; Cochran, K.; Westerman, D.; Schlenk, D.; Richardson, S.; Lei, L.; Dionysiou, D. Degradation of contaminants of emerging concern by UV/H2O2 for water reuse: Kinetics, mechanisms, and cytotoxicity analysis. Water Res. 2020, 174, 115587. [Google Scholar] [CrossRef]
  26. Yang, Y.; Cao, Y.; Jiang, J.; Lu, X.; Ma, J.; Pang, S.; Li, J.; Liu, Y.; Zhou, Y.; Guan, C. Comparative study on degradation of propranolol and formation of oxidation products by UV/H2O2 and UV/persulfate (PDS). Water Res. 2019, 149, 543–552. [Google Scholar] [CrossRef]
  27. Starling, M.C.V.M.; Souza, P.P.; Le Person, A.; Amorim, C.C.; Criquet, J. Intensification of UV-C treatment to remove emerging contaminants by UV-C/H2O2 and UV-C/S2O82−: Susceptibility to photolysis and investigation of acute toxicity. Chem. Eng. J. 2019, 376, 120856. [Google Scholar] [CrossRef]
  28. Zhang, B.; Wang, X.; Fang, Z.; Wang, S.; Shan, C.; Wei, S.; Pan, B. Unravelling molecular transformation of dissolved effluent organic matter in UV/H2O2, UV/persulfate, and UV/chlorine processes based on FT-ICR-MS analysis. Water Res. 2021, 199, 117158. [Google Scholar] [CrossRef]
  29. Lee, M.Y.; Wang, W.L.; Du, Y.; Jeon, T.W.; Shin, S.K.; Wu, Q.Y.; Dao, G.H.; Hu, H.Y. Applications of UV/H2O2, UV/persulfate, and UV/persulfate/Cu2+ for the elimination of reverse osmosis concentrate generated from municipal wastewater reclamation treatment plant: Toxicity, transformation products, and disinfection byproducts. Sci. Total Environ. 2021, 762, 144161. [Google Scholar] [CrossRef]
  30. Shad, A.; Chen, J.; Qu, R.J.; Dar, A.A.; Bin-Jumah, M.; Allam, A.A.; Wang, Z.Y. Degradation of sulfadimethoxine in phosphate buffer solution by UV alone, UV/PMS and UV/H2O2: Kinetics, degradation products, and reaction pathways. Chem. Eng. J. 2020, 398, 125357. [Google Scholar] [CrossRef]
  31. Chen, L.; Cai, T.; Cheng, C.; Xiong, Z.; Ding, D. Degradation of acetamiprid in UV/H2O2 and UV/persulfate systems: A comparative study. Chem. Eng. J. 2018, 351, 1137–1146. [Google Scholar] [CrossRef]
  32. Forouzesh, M.; Ebadi, A.; Aghaeinejad-Meybodi, A. Degradation of metronidazole antibiotic in aqueous medium using activated carbon as a persulfate activator. Sep. Purif. Technol. 2019, 210, 145–151. [Google Scholar] [CrossRef]
  33. Tyers, M.; Wright, G.D. Drug combinations: A strategy to extend the life of antibiotics in the 21st century. Nat. Rev. Microbiol. 2019, 17, 141–155. [Google Scholar] [CrossRef] [PubMed]
  34. Lee, Y.M.; Lee, G.; Zoh, K.D. Benzophenone-3 degradation via UV/H2O2 and UV/persulfate reactions. J. Hazard. Mater. 2021, 403, 11. [Google Scholar] [CrossRef] [PubMed]
  35. Pan, M.; Wu, Z.; Tang, C.; Guo, K.; Cao, Y.; Fang, J. Comparative study of naproxen degradation by the UV/chlorine and the UV/H2O2 advanced oxidation processes. Environ. Sci. Water Res. Technol. 2018, 4, 1219–1230. [Google Scholar] [CrossRef]
  36. Su, R.; Chai, L.; Tang, C.; Li, B.; Yang, Z. Comparison of the degradation of molecular and ionic ibuprofen in a UV/H2O2 system. Water Sci. Technol. 2018, 77, 2174–2183. [Google Scholar] [CrossRef] [PubMed]
  37. Luo, Y.; Su, R.; Yao, H.; Zhang, A.; Xiang, S.; Huang, L. Degradation of trimethoprim by sulfate radical-based advanced oxidation processes: Kinetics, mechanisms, and effects of natural water matrices. Environ. Sci. Pollut. Res. 2021, 28, 62572–62582. [Google Scholar] [CrossRef]
  38. Parker, C.A. A new sensitive chemical actinometer. I. Some trials with potassium ferrioxalate. Proc. R. Soc. A 1953, 220, 104–116. [Google Scholar]
  39. Hatchard, C.G.; Parker, C.A. A new sensitive chemical actinometer. II. potassium ferrioxalate as a standard chemical actinometer. Proc. R. Soc. A 1956, 235, 518–536. [Google Scholar]
  40. Beltran, F.J.; Ovejero, G.; Garcia-Araya, J.F.; Rivas, J. Oxidation of polynuclear aromatic hydrocarbons in water. 2. UV radiation and ozonation in the presence of UV radiation. Ind. Eng. Chem. Res. 1995, 34, 1607–1615. [Google Scholar] [CrossRef]
  41. Xiao, Y.; Zhang, L.; Yue, J.; Webster, R.D.; Lim, T.T. Kinetic modeling and energy efficiency of UV/H2O2 treatment of iodinated trihalomethanes. Water Res. 2015, 75, 259–269. [Google Scholar] [CrossRef] [PubMed]
  42. Zhang, R.; Sun, P.; Boyer, T.H.; Zhao, L.; Huang, C.H. Degradation of pharmaceuticals and metabolite in synthetic human urine by UV, UV/H2O2, and UV/PDS. Environ. Sci. Technol. 2015, 49, 3056–3066. [Google Scholar] [CrossRef] [PubMed]
  43. Leifer, A. The Kinetics of Environmental Aquatic Photochemistry: Theory and Practice; American Chemical Society: Washington, DC, USA, 1988. [Google Scholar]
  44. Pereira, V.J.; Weinberg, H.S.; Linden, K.G.; Singer, P.C. UV degradation kinetics and modeling of pharmaceutical compounds in laboratory grade and surface water via direct and indirect photolysis at 254 nm. Environ. Sci. Technol. 2007, 41, 1682–1688. [Google Scholar] [CrossRef] [PubMed]
  45. Szabó, R.K. Decomposition of some pharmaceuticals by Advanced Oxidation Processes. Ph.D. Thesis, University of Szeged Doctoral School of Environmental Sciences, Szeged, Hungary, 2010. [Google Scholar]
  46. Yang, Y.; Pignatello, J.J.; Ma, J.; Mitch, W.A. Effect of matrix components on UV/H2O2 and UV/S2O82− advanced oxidation processes for trace organic degradation in reverse osmosis brines from municipal wastewater reuse facilities. Water Res. 2016, 89, 192–200. [Google Scholar] [CrossRef] [PubMed]
  47. Kwon, M.; Kim, S.; Yoon, Y.; Jung, Y.; Hwang, T.; Lee, J.; Kang, J. Comparative evaluation of ibuprofen removal by UV/H2O2 and UV/S2O82− processes for wastewater treatment. Chem. Eng. J. 2015, 269, 379–390. [Google Scholar] [CrossRef]
  48. Vogna, D.; Marotta, R.; Andreozzi, R.; Napolitano, A.; d’Ischia, M. Kinetic and chemical assessment of the UV/H2O2 treatment of antiepileptic drug carbamazepine. Chemosphere 2004, 54, 497–505. [Google Scholar] [CrossRef]
  49. Shemer, H.; Kunukcu, Y.K.; Linden, K.G. Degradation of the pharmaceutical Metronidazole via UV, Fenton and photo-Fenton processes. Chemosphere 2006, 63, 269–276. [Google Scholar] [CrossRef]
  50. Yuan, F.; Hu, C.; Hu, X.; Qu, J.; Yang, M. Degradation of selected pharmaceuticals in aqueous solution with UV and UV/H2O2. Water Res. 2009, 43, 1766–1774. [Google Scholar] [CrossRef]
  51. Barreto, J.C.; Smith, G.S.; Strobel, N.H.P.; McQuillin, P.A.; Miller, T.A. Terephthalic acid: A dosimeter for the detection of hydroxyl radicals in vitro. Life Sci. 1994, 56, PL89–PL96. [Google Scholar] [CrossRef]
  52. Qu, X.; Kirschenbaum, L.J.; Borish, E.T. Hydroxyterephthalate as a fluorescent probe for hydroxyl radicals: Application to hair melanin. Photochem. Photobiol. 2010, 71, 307–313. [Google Scholar] [CrossRef]
  53. Haag, W.R.; Yao, C.D. Rate constants for reaction of hydroxyl radicals with several drinking water contaminants. Environ. Sci. Technol. 1992, 26, 1005–1013. [Google Scholar] [CrossRef]
  54. Packer, J.L.; Werner, J.J.; Latch, D.E.; McNeill, K.; Arnold, W.A. Photochemical fate of pharmaceuticals in the environment: Naproxen, diclofenac, clofibric acid, and ibuprofen. Aquat. Sci. 2003, 65, 342–351. [Google Scholar] [CrossRef]
  55. Van Scherpenzeel, M.; van den Berg, R.J.; Donker-Koopman, W.E.; Liskamp, R.M.; Aerts, J.M.; Overkleeft, H.S.; Pieters, R.J. Nanomolar affinity, iminosugar-based chemical probes for specific labeling of lysosomal glucocerebrosidase. Bioorgan. Med. Chem. 2010, 18, 267–273. [Google Scholar] [CrossRef] [PubMed]
  56. Lian, L.; Yao, B.; Hou, S.; Fang, J.; Yan, S.; Song, W. Kinetic study of hydroxyl and sulfate radical-mediated oxidation of pharmaceuticals in wastewater effluents. Environ. Sci. Technol. 2017, 51, 2954. [Google Scholar] [CrossRef]
  57. Dodd, M.C.; Buffle, M.-O.; von Gunten, U. Oxidation of antibacterial molecules by aqueous ozone: Moiety-specific reaction kinetics and application to ozone-based wastewater treatment. Environ. Sci. Technol. 2006, 40, 1969–1977. [Google Scholar] [CrossRef]
  58. Mahdi Ahmed, M.; Barbati, S.; Doumenq, P.; Chiron, S. Sulfate radical anion oxidation of diclofenac and sulfamethoxazole for water decontamination. Chem. Eng. J. 2012, 197, 440–447. [Google Scholar] [CrossRef]
  59. Crittenden, J.C.; Hu, S.; Hand, D.W.; Green, S.A. A kinetic model for H2O2/UV process in a completely mixed batch reactor. Water Res. 1999, 33, 2315–2328. [Google Scholar] [CrossRef]
  60. Buxton, G.V.; Greenstock, C.L.; Helman, W.P.; Ross, A.B. Critical review of rate constants for reactions of hydrated electrons, hydrogen atoms and hydroxyl radicals (OH/O) in aqueous solution. J. Phys. Chem. Ref. Data 1988, 17, 513–886. [Google Scholar] [CrossRef]
  61. Stumm, W.; Morgan, J. Aquatic Chemistry: Chemical Equilibria and Rates in Natural Waters; Wiley: New York, NY, USA, 1996. [Google Scholar]
  62. Lutze, H.V.; Bircher, S.; Rapp, I.; Kerlin, N.; Bakkour, R.; Geisler, M.; von Sonntag, C.; Schmidt, T.C. Degradation of chlorotriazine pesticides by sulfate radicals and the influence of organic matter. Environ. Sci. Technol. 2015, 49, 1673–1680. [Google Scholar] [CrossRef]
  63. Jayson, G.; Parsons, B.; Swallow, A.J. Some simple, highly reactive, inorganic chlorine derivatives in aqueous solution. Their formation using pulses of radiation and their role in the mechanism of the fricke dosimeter. J. Chem. Soc. Faraday Trans. 1973, 69, 1597–1607. [Google Scholar] [CrossRef]
  64. Kläning, U.K.; Wolff, T. Laser flash photolysis of HCIO, CIO, HBrO, and BrO in aqueous solution. reactions of Cl and Br Atoms. Ber. Bunsenges. Phys. Chem. 1985, 89, 243–245. [Google Scholar] [CrossRef]
  65. Yu, X.Y.; Bao, Z.C.; Barker, J.R. Free radical reactions involving Cl, Cl2•−, and SO4•− in the 248 nm photolysis of aqueous solutions containing S2O82− and Cl. J. Phys. Chem. A 2004, 108, 295–308. [Google Scholar] [CrossRef]
  66. McElroy, W.J. A laser photolysis study of the reaction of SO4 with Cl and the subsequent decay of Cl2in aqueous solution. J. Phys. Chem. 1990, 94, 2434–2441. [Google Scholar] [CrossRef]
  67. Luo, C.; Jiang, J.; Ma, J.; Pang, S.; Liu, Y.; Song, Y.; Guan, C.; Li, J.; Jin, Y.; Wu, D. Oxidation of the odorous compound 2,4,6-trichloroanisole by UV activated persulfate: Kinetics, products, and pathways. Water Res. 2016, 96, 12–21. [Google Scholar] [CrossRef] [PubMed]
  68. Grigor’ev, A.; Makarov, I.; Pikaev, A. Formation of Cl2 in the bulk of solution during radiolysis of concentrated aqueous solutions of chlorides. Khimiya Vysok. Ehnergij 1987, 21, 123–126. [Google Scholar]
  69. Keen, O.S.; Love, N.G.; Linden, K.G. The role of effluent nitrate in trace organic chemical oxidation during UV disinfection. Water Res. 2012, 46, 5224–5234. [Google Scholar] [CrossRef]
  70. Mack, J.; Bolton, J.R. Photochemistry of nitrite and nitrate in aqueous solution: A review. J. Photochem. Photobiol. A 1999, 128, 1–13. [Google Scholar] [CrossRef]
  71. Guo, H.G.; Gao, N.Y.; Chu, W.H.; Li, L.; Zhang, Y.J.; Gu, J.S.; Gu, Y.L. Photochemical degradation of ciprofloxacin in UV and UV/H2O2 process: Kinetics, parameters, and products. Environ. Sci. Pollut. Res. 2013, 20, 3202–3213. [Google Scholar] [CrossRef]
  72. Huie, R.E.; Clifton, C.L.; Kafafi, S.A. Rate constants for hydrogen abstraction reactions of the sulfate radical, SO4•−: Experimental and theoretical results for cyclic ethers. J. Phys. Chem. 1991, 95, 9336–9340. [Google Scholar] [CrossRef]
  73. Yang, Y.; Pignatello, J.J.; Ma, J.; Mitch, W.A. Comparison of halide impacts on the efficiency of contaminant degradation by sulfate and hydroxyl radical-based advanced oxidation processes (AOPs). Environ. Sci. Technol. 2014, 48, 2344–2351. [Google Scholar] [CrossRef]
  74. Grebel, J.E.; Pignatello, J.J.; Mitch, W.A. Effect of halide ions and carbonates on organic contaminant degradation by hydroxyl radical-based advanced oxidation processes in saline waters. Environ. Sci. Technol. 2010, 44, 6822–6828. [Google Scholar] [CrossRef] [PubMed]
  75. Beitz, T.; Bechmann, W.; Mitzner, R. Investigations of reactions of selected azaarenes with radicals in water. 2. chlorine and bromine radicals. J. Phys. Chem. A 1998, 102, 6766–6771. [Google Scholar] [CrossRef]
  76. Watts, M.J.; Rosenfeldt, E.J.; Linden, K.G. Comparative OH radical oxidation using UV-Cl2 and UV-H2O2 processes. J. Water Supply Res. Technol.-AQUA 2007, 56, 469. [Google Scholar] [CrossRef]
  77. Alegre, M.L.; Geronés, M.; Rosso, J.A.; Bertolotti, S.; Braun, A.; Mártir, D.O.; Gonzalez, M.C. Kinetic Study of the Reactions of Chlorine Atoms and Cl2•− Radical Anions in Aqueous Solutions. 1. Reaction with Benzene. J. Phys. Chem. A 2000, 104, 3117–3125. [Google Scholar] [CrossRef]
  78. Deng, J.; Shao, Y.; Gao, N.; Xia, S.; Tan, C.; Zhou, S.; Hu, X. Degradation of the antiepileptic drug carbamazepine upon different UV-based advanced oxidation processes in water. Chem. Eng. J. 2013, 222 (Suppl. C), 150–158. [Google Scholar] [CrossRef]
Figure 1. Potassium oxalate method for the determination of effective light intensity.
Ijerph 19 12354 g001
Figure 2. High (a) and low (b) concentration photolysis of H2O2.
Ijerph 19 12354 g002
Figure 3. Time-dependent degradation kinetics of MTZ in the UV, UV/H2O2 system. The degradation was fitted to a first-order kinetic model (lines). ([MTZ] = 10 μM, [H2O2] = 100 μM, I0 = 7.50 × 10⁻⁶ Einstein L−1·s−1, l = 0.935 cm).
Ijerph 19 12354 g003
Figure 4. Decadic molar absorption coefficient (ε) of MTZ with reference to the UV lamp emission spectra from 200 to 400 nm.
Ijerph 19 12354 g004
Figure 5. Fluorescence signal intensity of HTPA over time. ([TPA] = 100 μM, [H2O2] = 100 μM, and I0 = 7.50 × 10⁻⁶ Einstein L−1 s−1).
Ijerph 19 12354 g005
Figure 6. Impacts of H2O2 dosages on the pseudo first-order constants of MTZ (kobs). ([MTZ]0 = 10 μM, pH = 3.00, and I0 = 7.50 × 10⁻⁶ Einstein L−1 s−1, l = 0.935 cm.)
Ijerph 19 12354 g006
Figure 7. Impacts of humic acid on the pseudo first-order constants of MTZ (kobs). ([MTZ]0 = 10 μM, [H2O2]0 = 100 μM, and I0 = 7.50 × 10⁻⁶ Einstein L−1 s−1, l = 0.935 cm).
Ijerph 19 12354 g007
Figure 8. Impacts of inorganic anions on the pseudo first-order constants of MTZ (kobs). ([MTZ]0 = 10 μM, [H2O2]0 = 100 μM, and I0 = 7.50 × 10⁻⁶ Einstein L−1 s−1, l = 0.935 cm).
Ijerph 19 12354 g008
Table 1. UPLC method of MTZ and pCBA.
CompoundAcetonitrilePhosphate Buffer
(20 mM, pH 3)
λFlow RateInjection VolumeColumn Temperature
nmmL min−1µL°C
MTZ15%85%3200.3535
pCBA30%70%238
Table 2. Summary of the reactions and k in the UV/H2O2 system.
#Reactionk (M−1 s−1)Reference
1 H 2 O 2 + hv 2   OH   r 0 , OH   = 2 φ H E H , s−1[59]
2 H 2 O 2 + OH   HO 2 + H 2 O k1 = 2.7 × 10⁷[60]
3 OH   + HO 2 HO 2 + OH k2 = 7.5 × 10⁹[59]
4 H 2 O 2     H + + HO 2 k3 = 2.51 × 10⁻¹²[59]
In the presence of Phosphates
5H3PO4 ⇌ H+ + H 2 PO 4 pKa1 = 2.1 unitless[61]
6 H 2 PO 4 ⇌ H+ + HPO 4 2 pKa2 = 7.2 unitless[61]
7 HPO 4 2 ⇌ H+ + PO 4 3 pKa3 = 12.3 unitless[61]
8 O   H + H 2 PO 4   HPO 4 + H 2 O kH1 = 2.0 × 10⁴[60]
9 O   H + HPO 4 2   HPO 4 + OH kH2 = 1.5 × 10⁵[60]
10 OH   + PO 4 3     PO 4 2 + OH kH3 < 1.5 × 10⁷[60]
11 OH   + H 3 PO 4     H 2 PO 4 + H 2 O kH4 = 2.7 × 10⁶[60]
In the presence of NOM [62]
12 O   H + NOM products k14 = 1.4 × 10⁴ L mgC−1 s−1[62]
In the presence of Cl
13 O   H +   Cl   ClOH k16 = 4.3 × 10⁹[63]
14 Cl + OH   ClOH k17 = 1.8 × 10¹⁰[64]
15 Cl + H 2 O   ClOH + H + k18 = 2.5 × 10⁵[63]
16 ClOH   Cl + O   H k19 = 6.0 × 10⁹[63]
17 ClOH + H +   Cl + H 2 O k20 = 2.1 × 10¹⁰[64]
18 Cl + Cl   Cl 2 k21 = 8.5 × 10⁹[65]
19 Cl 2 + H 2 O   ClOH + H + + Cl k22 = 1.3 × 10³[66,67]
20 Cl 2 + OH   ClOH + Cl k23 = 4.5 × 10⁷[68]
21 Cl 2 + Cl 2   Cl 2 + 2 Cl k24 = 9.0 × 10⁸[65]
In the presence of Carbonates
22 O   H +   HCO 3 H 2 O + CO 3 k27 = 8.5 × 10⁶[60]
23 O   H +   CO 3 2 OH + CO 3 k28 = 3.9 × 10⁸[60]
In the presence of NO 3
24 O   H + NO 3 OH + NO 3 k30 < 1.0 × 10⁵[69]
25 NO 3 + H +   hv   O   H + NO 2 Φ O   H = 0.24 mol Einstein−1[69]
26 NO 3 + hv NO 2 + 1 2 O 2 Φ NO 2 [70]
27 NO 3 + hv NO 2 + O /[70]
28 2 NO 2 + H 2 O NO 2 +   NO 3 + 2 H + /[69]
29 1 2 O 2 + H 2 O   2 OH   /[69]
30 O + H 2 O   OH   + OH /[69]
Degradation of MTZ
31 MTZ + hv products rUV, M s−1*
32 O   H + MTZ products k MTZ , HO   *
33Secondary radical + MTZ →?N.A.N.A.
Note:   Φ NO 2 = 0.015~0.028 mol Einstein−1, * measure in this study.
Publisher’s Note: MDPI stays neutral with regard to jurisdictional claims in published maps and institutional affiliations.

