
Physiological Implication of Slope Gradient during Incremental Running Test

 , , ,
, , , 
Abstract
:1. Introduction
2. Methodology
2.1. Participants
2.2. Experiential Design
2.3. Physiological Measurements
2.4. Statistic
3. Results
4. Discussion
5. Conclusions
Author Contributions
Funding
Institutional Review Board Statement
Conflicts of Interest
References
- Billat, L.V.; Koralsztein, J.P. Significance of the Velocity at VO2max and Time to Exhaustion at This Velocity. Sports Med. Auckl. NZ 1996, 22, 90–108. [Google Scholar] [CrossRef] [PubMed]
- di Prampero, P.E.; Atchou, G.; Brückner, J.C.; Moia, C. The Energetics of Endurance Running. Eur. J. Appl. Physiol. 1986, 55, 259–266. [Google Scholar] [CrossRef] [PubMed]
- Joyner, M.J. Physiological Limiting Factors and Distance Running: Influence of Gender and Age on Record Performances. Exerc. Sport Sci. Rev. 1993, 21, 103–133. [Google Scholar] [CrossRef]
- Margaria, R.; Cerretelli, P.; Aghemo, P.; Sassi, G. Energy Cost of Running. J. Appl. Physiol. 1963, 18, 367–370. [Google Scholar] [CrossRef]
- Jamnick, N.A.; Pettitt, R.W.; Granata, C.; Pyne, D.B.; Bishop, D.J. An Examination and Critique of Current Methods to Determine Exercise Intensity. Sports Med. 2020, 50, 1729–1756. [Google Scholar] [CrossRef]
- Beltz, N.M.; Gibson, A.L.; Janot, J.M.; Kravitz, L.; Mermier, C.M.; Dalleck, L.C. Graded Exercise Testing Protocols for the Determination of VO2max: Historical Perspectives, Progress, and Future Considerations. J. Sports Med. Hindawi Publ. Corp. 2016, 2016, 3968393. [Google Scholar] [CrossRef]
- Shephard, R.J. The Relative Merits of the Step Test, Bicycle Ergometer, and Treadmill in the Assessment of Cardio-Respiratory Fitness. Int. Z. Angew. Physiol. 1966, 23, 219–230. [Google Scholar] [CrossRef] [PubMed]
- Volkov, N.I.; Shirkovets, E.A.; Borilkevich, V.E. Assessment of Aerobic and Anaerobic Capacity of Athletes in Treadmill Running Tests. Eur. J. Appl. Physiol. 1975, 34, 121–130. [Google Scholar] [CrossRef]
- Borges, T.O.; Dascombe, B.; Bullock, N.; Coutts, A.J. Physiological Characteristics of Well-Trained Junior Sprint Kayak Athletes. Int. J. Sports Physiol. Perform. 2015, 10, 593–599. [Google Scholar] [CrossRef]
- Butts, N.K.; Henry, B.A.; Mclean, D. Correlations between VO2max and Performance Times of Recreational Triathletes. J. Sports Med. Phys. Fitness 1991, 31, 339–344. [Google Scholar]
- Baquet, G.; van Praagh, E.; Berthoin, S. Endurance Training and Aerobic Fitness in Young People. Sports Med. 2003, 33, 1127–1143. [Google Scholar] [CrossRef] [Green Version]
- Midgley, A.W.; Mc Naughton, L.R. Time at or near VO2max during Continuous and Intermittent Running. A Review with Special Reference to Considerations for the Optimisation of Training Protocols to Elicit the Longest Time at or near VO2max. J. Sports Med. Phys. Fit. 2006, 46, 1–14. [Google Scholar]
- Berthoin, S.; Gerbeaux, M.; Turpin, E.; Guerrin, F.; Lensel-Corbeil, G.; Vandendorpe, F. Comparison of Two Field Tests to Estimate Maximum Aerobic Speed. J. Sports Sci. 1994, 12, 355–362. [Google Scholar] [CrossRef] [PubMed]
- Kuipers, H.; Rietjens, G.; Verstappen, F.; Schoenmakers, H.; Hofman, G. Effects of Stage Duration in Incremental Running Tests on Physiological Variables. Int. J. Sports Med. 2003, 24, 486–491. [Google Scholar] [CrossRef] [PubMed]
- Meyer, T.; Welter, J.-P.; Scharhag, J.; Kindermann, W. Maximal Oxygen Uptake during Field Running Does Not Exceed That Measured during Treadmill Exercise. Eur. J. Appl. Physiol. 2003, 88, 387–389. [Google Scholar] [CrossRef]
- Hoffman, M.D.; Ong, J.C.; Wang, G. Historical Analysis of Participation in 161 Km Ultramarathons in North America. Int. J. Hist. Sport 2010, 27, 1877–1891. [Google Scholar] [CrossRef] [PubMed]
- Breiner, T.J.; Ortiz, A.L.R.; Kram, R. Level, Uphill and Downhill Running Economy Values Are Strongly Inter-Correlated. Eur. J. Appl. Physiol. 2019, 119, 257–264. [Google Scholar] [CrossRef] [PubMed]
- Lemire, M.; Hureau, T.J.; Favret, F.; Geny, B.; Kouassi, B.Y.L.; Boukhari, M.; Lonsdorfer, E.; Remetter, R.; Dufour, S.P. Physiological Factors Determining Downhill vs Uphill Running Endurance Performance. J. Sci. Med. Sport 2021, 24, 85–91. [Google Scholar] [CrossRef]
- Vernillo, G.; Giandolini, M.; Edwards, W.B.; Morin, J.-B.; Samozino, P.; Horvais, N.; Millet, G.Y. Biomechanics and Physiology of Uphill and Downhill Running. Sports Med. 2017, 47, 615–629. [Google Scholar] [CrossRef]
- di Prampero, P.E.; Salvadego, D.; Fusi, S.; Grassi, B. A Simple Method for Assessing the Energy Cost of Running during Incremental Tests. J. Appl. Physiol. 2009, 107, 1068–1075. [Google Scholar] [CrossRef]
- Minetti, A.E.; Ardigò, L.P.; Saibene, F. Mechanical Determinants of the Minimum Energy Cost of Gradient Running in Humans. J. Exp. Biol. 1994, 195, 211–225. [Google Scholar] [CrossRef] [PubMed]
- Minetti, A.E.; Moia, C.; Roi, G.S.; Susta, D.; Ferretti, G. Energy Cost of Walking and Running at Extreme Uphill and Downhill Slopes. J. Appl. Physiol. 2002, 93, 1039–1046. [Google Scholar] [CrossRef] [PubMed] [Green Version]
- Kasch, F.W.; Wallace, J.P.; Huhn, R.R.; Krogh, L.A.; Hurl, P.M. VO2max during Horizontal and Inclined Treadmill Running. J. Appl. Physiol. 1976, 40, 982–983. [Google Scholar] [CrossRef] [PubMed]
- Balducci, P.; Clémençon, M.; Morel, B.; Quiniou, G.; Saboul, D.; Hautier, C.A. Comparison of Level and Graded Treadmill Tests to Evaluate Endurance Mountain Runners. J. Sports Sci. Med. 2016, 15, 239–246. [Google Scholar] [PubMed]
- Paavolainen, L.; Nummela, A.; Rusko, H. Muscle Power Factors and VO2max as Determinants of Horizontal and Uphill Running Performance. Scand. J. Med. Sci. Sports 2000, 10, 286–291. [Google Scholar] [CrossRef]
- Schöffl, I.; Jasinski, D.; Ehrlich, B.; Dittrich, S.; Schöffl, V. Outdoor Uphill Exercise Testing for Trail Runners, a More Suitable Method? J. Hum. Kinet. 2021, 79, 123–133. [Google Scholar] [CrossRef]
- Pokan, R.; Schwaberger, G.; Hofmann, P.; Eber, B.; Toplak, H.; Gasser, R.; Fruhwald, F.M.; Pessenhofer, H.; Klein, W. Effects of Treadmill Exercise Protocol with Constant and Ascending Grade on Levelling-off O2 Uptake and VO2 Max. Int. J. Sports Med. 1995, 16, 238–242. [Google Scholar] [CrossRef]
- Scheer, V.; Ramme, K.; Reinsberger, C.; Heitkamp, H.-C. VO2max Testing in Trail Runners: Is There a Specific Exercise Test Protocol? Int. J. Sports Med. 2018, 39, 456–461. [Google Scholar] [CrossRef]
- Taylor, H.L.; Buskirk, E.; Henschel, A. Maximal Oxygen Intake as an Objective Measure of Cardio-Respiratory Performance. J. Appl. Physiol. 1955, 8, 73–80. [Google Scholar] [CrossRef]
- di Prampero, P.E. An Analysis of the Factors Limiting Maximal Oxygen Consumption in Healthy Subjects. Chest 1992, 101, 188S–191S. [Google Scholar] [CrossRef]
- Sloniger, M.A.; Cureton, K.J.; Prior, B.M.; Evans, E.M. Lower Extremity Muscle Activation during Horizontal and Uphill Running. J. Appl. Physiol. 1997, 83, 2073–2079. [Google Scholar] [CrossRef] [PubMed]
- Swanson, S.C.; Caldwell, G.E. An Integrated Biomechanical Analysis of High Speed Incline and Level Treadmill Running. Med. Sci. Sports Exerc. 2000, 32, 1146–1155. [Google Scholar] [CrossRef] [PubMed]
- Mendez-Villanueva, A.; Buchheit, M.; Kuitunen, S.; Poon, T.K.; Simpson, B.; Peltola, E. Is the Relationship between Sprinting and Maximal Aerobic Speeds in Young Soccer Players Affected by Maturation? Pediatr. Exerc. Sci. 2010, 22, 497–510. [Google Scholar] [CrossRef] [PubMed]
- Midgley, A.W.; Bentley, D.J.; Luttikholt, H.; McNaughton, L.R.; Millet, G.P. Challenging a Dogma of Exercise Physiology: Does an Incremental Exercise Test for Valid VO 2 Max Determination Really Need to Last between 8 and 12 Minutes? Sports Med. 2008, 38, 441–447. [Google Scholar] [CrossRef]
- Macfarlane, D.J.; Wong, P. Validity, Reliability and Stability of the Portable Cortex Metamax 3B Gas Analysis System. Eur. J. Appl. Physiol. 2012, 112, 2539–2547. [Google Scholar] [CrossRef]
- Beaver, W.L.; Wasserman, K.; Whipp, B.J. A New Method for Detecting Anaerobic Threshold by Gas Exchange. J. Appl. Physiol. 1986, 60, 2020–2027. [Google Scholar] [CrossRef]
- Pereira, D.G.; Afonso, A.; Medeiros, F.M. Overview of Friedman’s Test and Post-Hoc Analysis. Commun. Stat.-Simul. Comput. 2015, 44, 2636–2653. [Google Scholar] [CrossRef]
- Taheri, S.M.; Hesamian, G. A Generalization of the Wilcoxon Signed-Rank Test and Its Applications. Stat. Pap. 2013, 54, 457–470. [Google Scholar] [CrossRef]
- Goulet-Pelletier, J.-C.; Cousineau, D. A Review of Effect Sizes and Their Confidence Intervals, Part I: The Cohen’s d Family. Quant. Methods Psychol. 2018, 14, 242–265. [Google Scholar] [CrossRef]
- Hopkins, W.G.; Marshall, S.W.; Batterham, A.M.; Hanin, J. Progressive Statistics for Studies in Sports Medicine and Exercise Science. Med. Sci. Sports Exerc. 2009, 41, 3–13. [Google Scholar] [CrossRef]
- O’Halloran, J.; Hamill, J.; McDermott, W.J.; Remelius, J.G.; Van Emmerik, R.E.A. Locomotor-Respiratory Coupling Patterns and Oxygen Consumption during Walking above and below Preferred Stride Frequency. Eur. J. Appl. Physiol. 2012, 112, 929–940. [Google Scholar] [CrossRef] [PubMed]
- Takano, N. Phase Relation and Breathing Pattern during Locomotor/Respiratory Coupling in Uphill and Downhill Running. Jpn. J. Physiol. 1995, 45, 47–58. [Google Scholar] [CrossRef] [Green Version]
- Tiller, N.B.; Price, M.J.; Campbell, I.G.; Romer, L.M. Effect of Cadence on Locomotor–Respiratory Coupling during Upper-Body Exercise. Eur. J. Appl. Physiol. 2017, 117, 279–287. [Google Scholar] [CrossRef] [PubMed]
- Giovanelli, N.; Ortiz, A.L.R.; Henninger, K.; Kram, R. Energetics of Vertical Kilometer Foot Races; Is Steeper Cheaper? J. Appl. Physiol. 2016, 120, 370–375. [Google Scholar] [CrossRef]
- Lemire, M.; Falbriard, M.; Aminian, K.; Millet, G.P.; Meyer, F. Level, Uphill, and Downhill Running Economy Values Are Correlated Except on Steep Slopes. Front. Physiol. 2021, 12, 697315. [Google Scholar] [CrossRef] [PubMed]
- Pringle, J.S.; Carter, H.; Doust, J.H.; Jones, A.M. Oxygen Uptake Kinetics during Horizontal and Uphill Treadmill Running in Humans. Eur. J. Appl. Physiol. 2002, 88, 163–169. [Google Scholar] [CrossRef] [PubMed]
- Sloniger, M.A.; Cureton, K.J.; Prior, B.M.; Evans, E.M. Anaerobic Capacity and Muscle Activation during Horizontal and Uphill Running. J. Appl. Physiol. 1997, 83, 262–269. [Google Scholar] [CrossRef]
- Wall-Scheffler, C.M.; Chumanov, E.; Steudel-Numbers, K.; Heiderscheit, B. Electromyography Activity across Gait and Incline: The Impact of Muscular Activity on Human Morphology. Am. J. Phys. Anthropol. 2010, 143, 601–611. [Google Scholar] [CrossRef]
- Yokozawa, T.; Fujii, N.; Ae, M. Muscle Activities of the Lower Limb during Level and Uphill Running. J. Biomech. 2007, 40, 3467–3475. [Google Scholar] [CrossRef]
- Dewolf, A.H.; Peñailillo, L.E.; Willems, P.A. The Rebound of the Body during Uphill and Downhill Running at Different Speeds. J. Exp. Biol. 2016, 219, 2276–2288. [Google Scholar] [CrossRef]
- Snyder, K.L.; Kram, R.; Gottschall, J.S. The Role of Elastic Energy Storage and Recovery in Downhill and Uphill Running. J. Exp. Biol. 2012, 215, 2283–2287. [Google Scholar] [CrossRef] [PubMed]
- Roberts, T.J.; Belliveau, R.A. Sources of Mechanical Power for Uphill Running in Humans. J. Exp. Biol. 2005, 208, 1963–1970. [Google Scholar] [CrossRef] [PubMed] [Green Version]
- Biewener, A.A.; Roberts, T.J. Muscle and Tendon Contributions to Force, Work, and Elastic Energy Savings: A Comparative Perspective. Exerc. Sport Sci. Rev. 2000, 28, 99–107. [Google Scholar]
- Cavagna, G.A.; Saibene, F.P.; Margaria, R. Mechanical Work in Running. J. Appl. Physiol. 1964, 19, 249–256. [Google Scholar] [CrossRef] [PubMed]
- Gottschall, J.S.; Kram, R. Ground Reaction Forces during Downhill and Uphill Running. J. Biomech. 2005, 38, 445–452. [Google Scholar] [CrossRef]
- Pastor, F.S.; Besson, T.; Varesco, G.; Parent, A.; Fanget, M.; Koral, J.; Foschia, C.; Rupp, T.; Rimaud, D.; Féasson, L.; et al. Performance Determinants in Trail-Running Races of Different Distances. Int. J. Sports Physiol. Perform. 2022, 17, 844–851. [Google Scholar] [CrossRef]


| 0% | 15% | 25% | 40% | ||
|---|---|---|---|---|---|
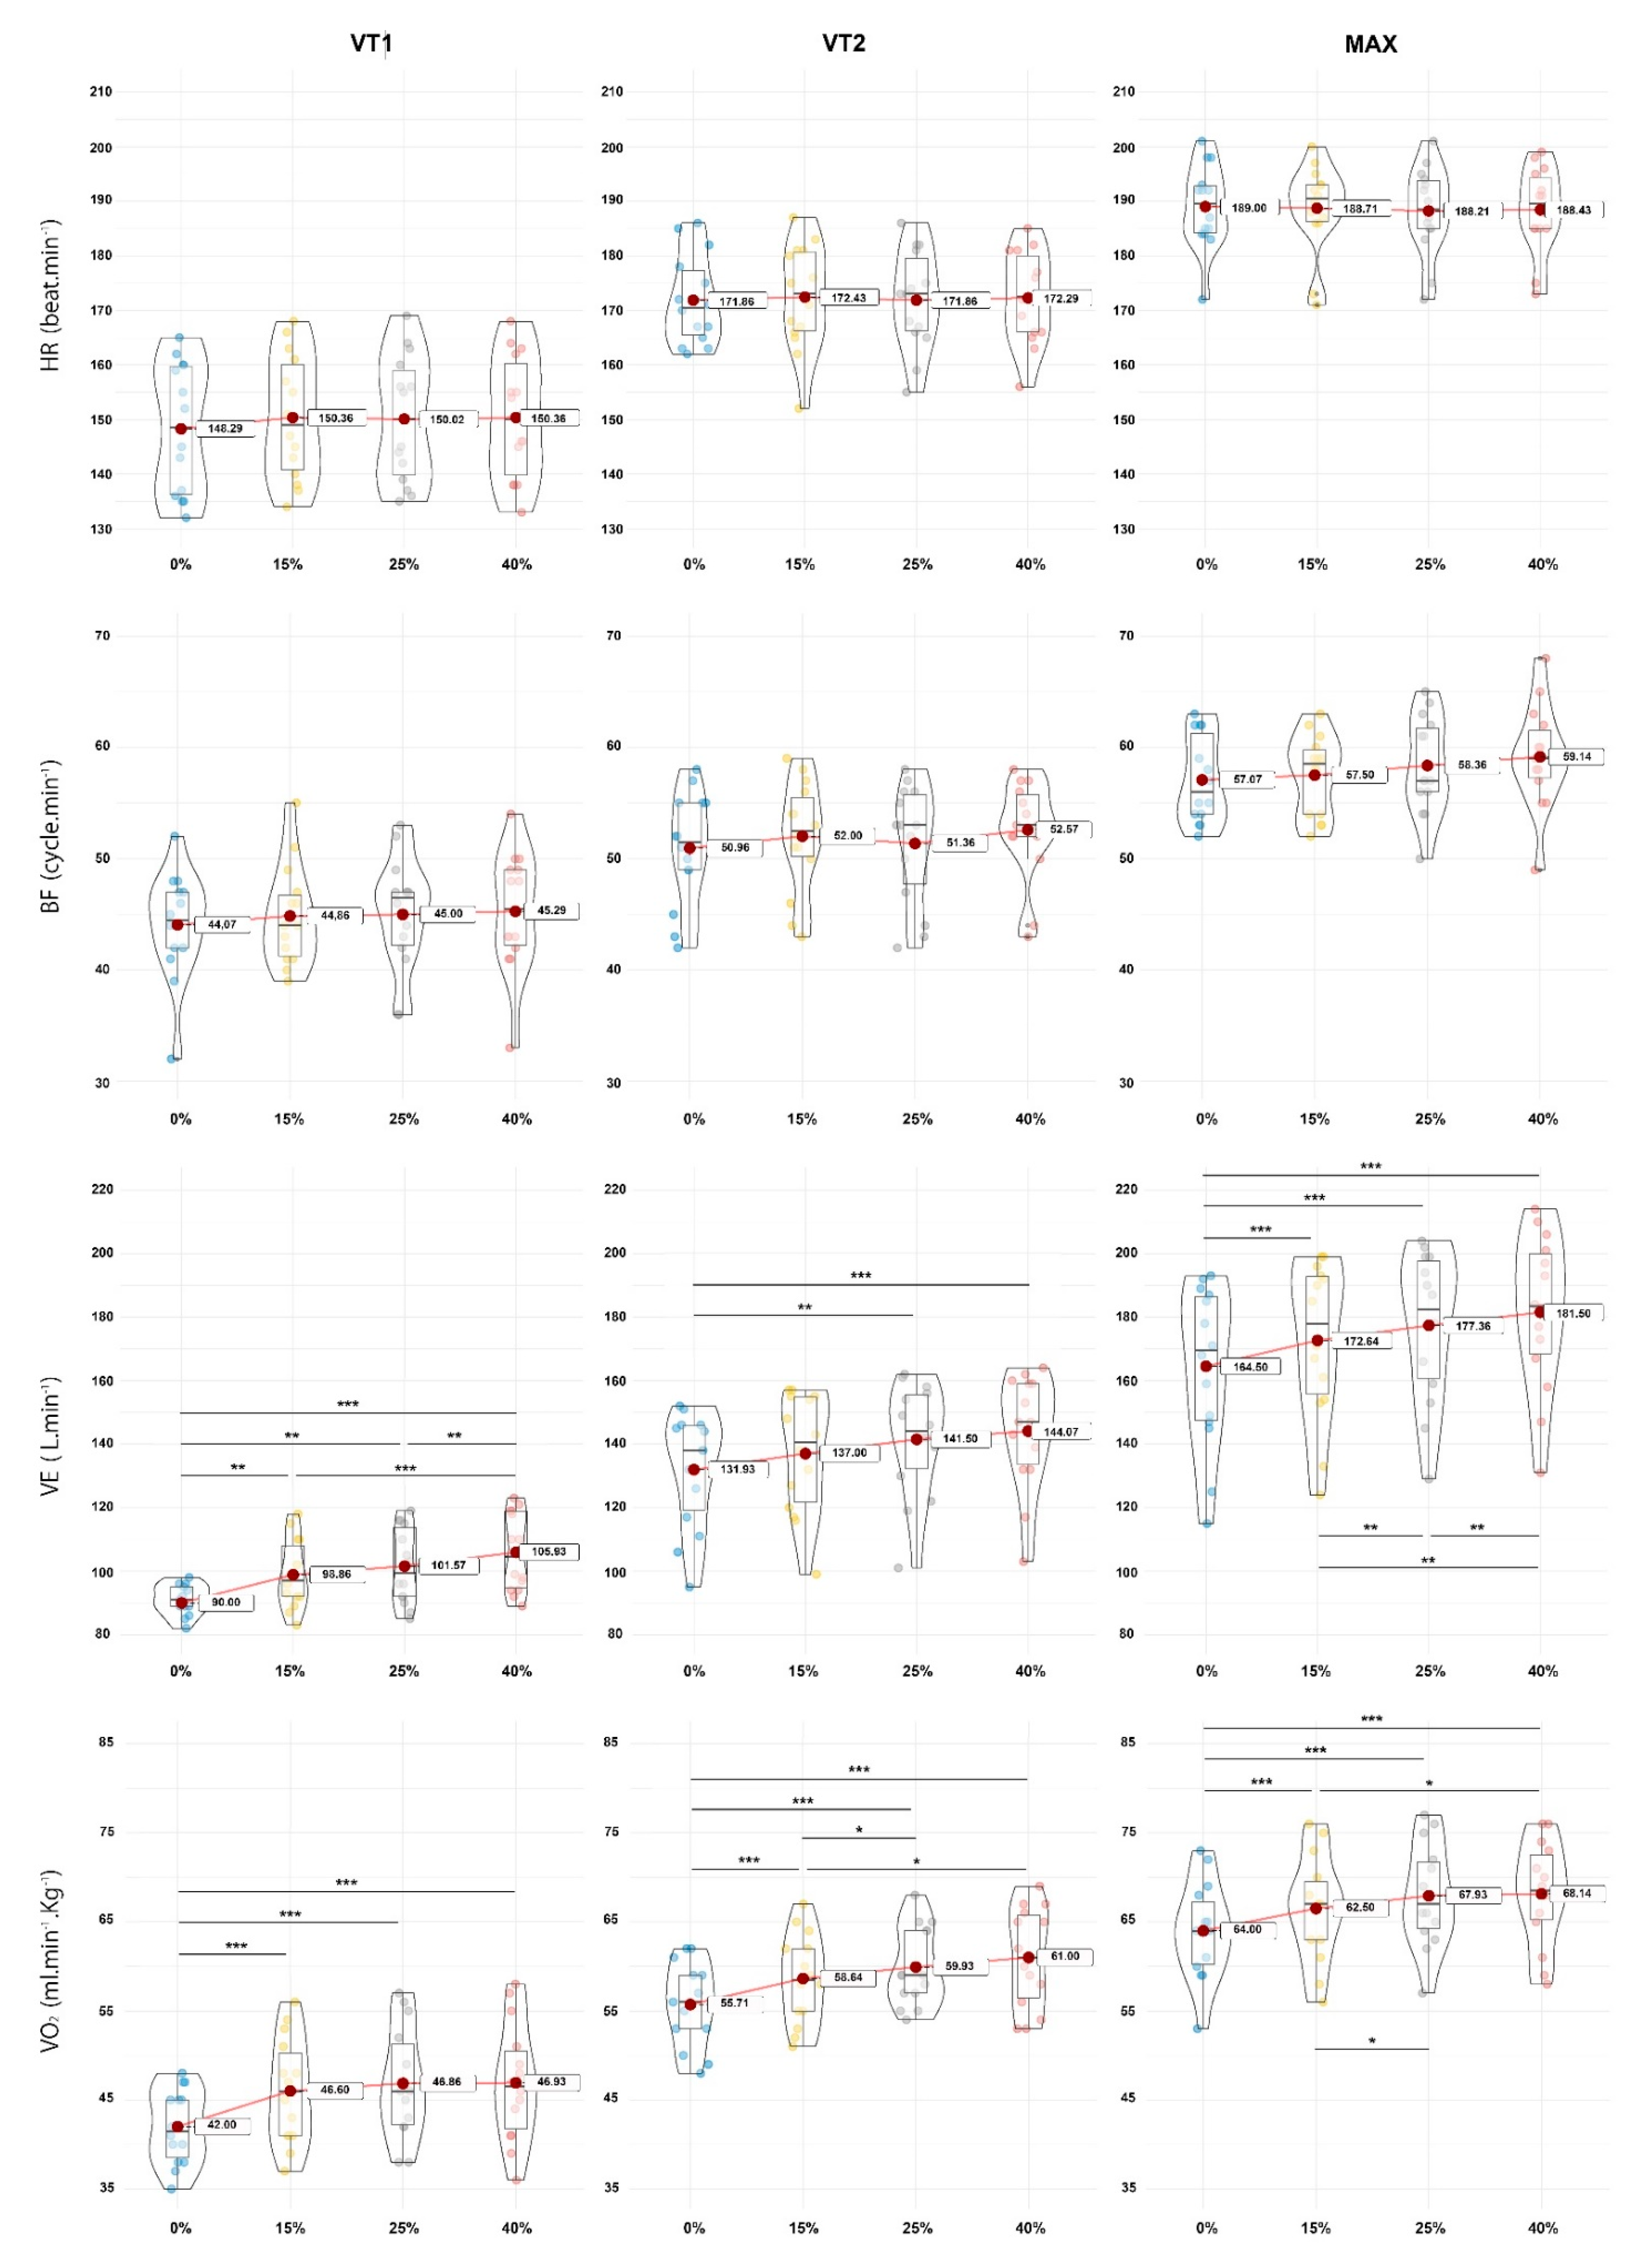
| VT1 | HR (bpm) | 148.3 ± 11.9 | 150.4 ± 11.4 | 150.1 ± 11.6 | 150.4 ± 11.4 |
| BF (cycles·min−1) | 44.1 ± 4.8 | 44.9 ± 4.5 | 45 ± 5.1 | 45.3 ± 5.4 | |
| VE (L·min−1) | 90 ± 5.8 Ø β | 98.9 ± 10.8 § | 101.6 ± 11.9 § | 105.9 ± 12.4 § Ø β | |
| VO2 (mL·min−1·kg) | 42 ± 4.2 Ø β | 46 ± 6 § | 46.9 ± 6.2 § | 46.9 ± 6.7 § | |
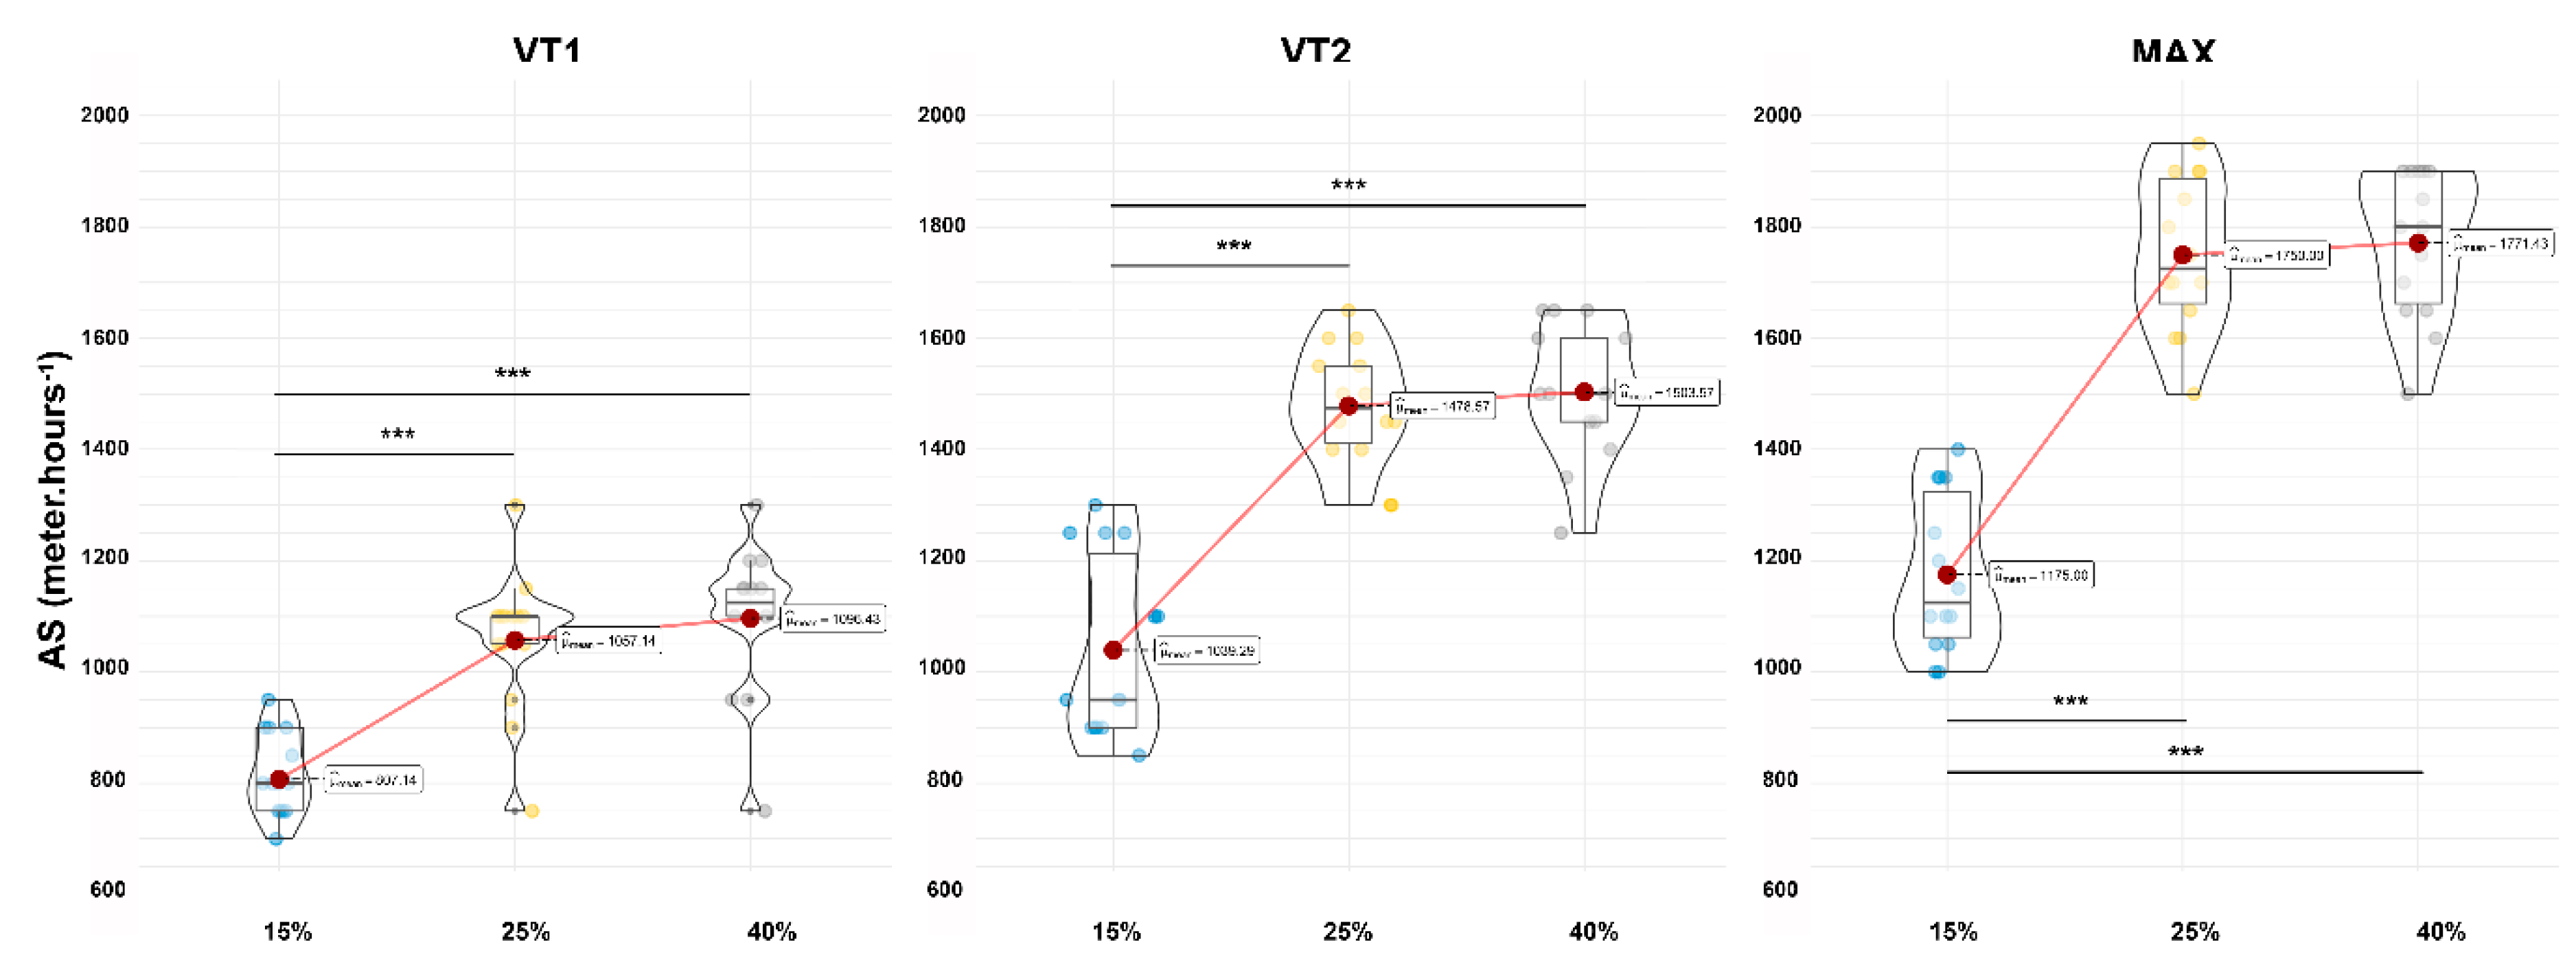
| AS (m·h−1) | - | 807.1 ± 85.1 β | 1057.1 ± 126.8 | 1096.4 ± 135.1 Ø | |
| VT2 | HR (bpm) | 171.9 ± 8.2 | 172.4 ± 9.7 | 171.9 ± 9.1 | 172.3 ± 8.5 |
| BF (cycles·min−1) | 50.9 ± 5 | 52 ± 5 | 51.4 ± 5.4 | 52.6 ± 4.5 | |
| VE (L·min−1) | 131.9 ± 18.2 β | 137 ± 18.8 | 141.5 ± 17.9 § | 144.1 ± 18.1 § | |
| VO2 (mL·min−1·kg) | 55.1 ± 6 Ø β | 58.6 ± 5 § β | 59.9 ± 4.4 § | 61 ± 5.6 § Ø | |
| AS (m·h−1) | - | 1039.2 ± 163.1 β | 1478.5 ± 106.9 | 1503.5 ± 120 Ø | |
| Max | HR (bpm) | 189 ± 7.6 | 188.7 ± 8.2 | 188.2 ± 8.1 | 188.4 ± 7.8 |
| BF (cycles·min−1) | 57.1 ± 3.9 | 57.5 ± 3.6 | 58.4 ± 4.4 | 59.1 ± 4.7 | |
| VE (L·min−1) | 164.5 ± 25.3 Ø β | 172.6 ± 24.8 § | 177.4 ± 23.6 § Ø | 181.5 ± 24.5 § Ø β | |
| VO2 (mL·min−1·Kg) | 63.3 ± 7.3 Ø β | 66.5 ± 5.9 § β | 67.9 ± 5.8 § Ø | 68.1 ± 5.9 § Ø | |
| AS (m·h−1) | - | 1175 ± 141.1 β | 1750 ± 137.2 | 1771.4 ± 132.6 Ø |
| Anova One-Way Repeated Measures | Bonferroni Post-Hoc | Effect Size | |||||||||||
|---|---|---|---|---|---|---|---|---|---|---|---|---|---|
| HR | VT1 | Slope | p value | Normality | p value | p value | g Hedges | ||||||
| 0% | 0.074 | Valid | 0.006 | 0% | 15% | 25% | 0% | 15% | 25% | ||||
| 15% | 0.449 | Valid | 15% | 0.22 | 15% | 0.172 | |||||||
| 25% | 0.202 | Valid | 25% | 0.13 | 0.999 | 25% | 0.142 | 0.024 | |||||
| 40% | 0.352 | Valid | 40% | 0.16 | 0.999 | 0.999 | 40% | 0.173 | 0 | 0.241 | |||
| VT2 | Slope | p value | Normality | p value | p value | g Hedges | |||||||
| 0% | 0.182 | Valid | 0.920 | 0% | 15% | 25% | 0% | 15% | 25% | ||||
| 15% | 0.753 | Valid | 15% | 0.999 | 15% | 0.061 | |||||||
| 25% | 0.806 | Valid | 25% | 0.999 | 0.999 | 25% | 0.001 | 0.059 | |||||
| 40% | 0.771 | Valid | 40% | 0.999 | 0.999 | 0.999 | 40% | 0.049 | 0.015 | 0.047 | |||
| MAX | Slope | p value | Normality | p value | p value | g Hedges | |||||||
| 0% | 0.453 | Failed | 0.899 | 0% | 15% | 25% | 0% | 15% | 25% | ||||
| 15% | 0.068 | Valid | 15% | 0.999 | 15% | 0.035 | |||||||
| 25% | 0.72 | Valid | 25% | 0.999 | 0.999 | 25% | 0.096 | 0.059 | |||||
| 40% | 0.287 | Valid | 40% | 0.999 | 0.999 | 0.999 | 40% | 0.074 | 0.034 | 0.026 | |||
| BF | VT1 | Slope | p value | Normality | p value | p value | g Hedges | ||||||
| 0% | 0.377 | Valid | 0.421 | 0% | 15% | 25% | 0% | 15% | 25% | ||||
| 15% | 0.434 | Valid | 15% | 0.999 | 15% | 0.163 | |||||||
| 25% | 0.444 | Valid | 25% | 0.999 | 0.999 | 25% | 0.181 | 0.028 | |||||
| 40% | 0.3 | Valid | 40% | 0.5 | 0.5 | 0.999 | 40% | 0.23 | 0.083 | 0.053 | |||
| VT2 | Slope | p value | Normality | p value | p value | g Hedges | |||||||
| 0% | 0.453 | Valid | 0.182 | 0% | 15% | 25% | 0% | 15% | 25% | ||||
| 15% | 0.49 | Valid | 15% | 0.999 | 15% | 0.209 | |||||||
| 25% | 0.107 | Valid | 25% | 0.999 | 0.999 | 25% | 0.08 | 0.121 | |||||
| 40% | 0.054 | Valid | 40% | 0.19 | 0.999 | 0.78 | 40% | 0.336 | 0.117 | 0.329 | |||
| MAX | Slope | p value | Normality | p value | p value | g Hedges | |||||||
| 0% | 0.08 | Valid | 0.011 | 0% | 15% | 25% | 0% | 15% | 25% | ||||
| 15% | 0.187 | Valid | 15% | 0.999 | 15% | 0.11 | |||||||
| 25% | 0.586 | Valid | 25% | 0.058 | 0.666 | 25% | 0.301 | 0.207 | |||||
| 40% | 0.913 | Valid | 40% | 0.051 | 0.064 | 0.307 | 40% | 0.468 | 0.382 | 0.169 | |||
| VE | VT1 | Slope | p value | Normality | p value | p value | g Hedges | ||||||
| 0% | 0.643 | Valid | <0.001 | 0% | 15% | 25% | 0% | 15% | 25% | ||||
| 15% | 0.49 | Valid | 15% | 0.01 | 15% | 0.994 | |||||||
| 25% | 0.163 | Valid | 25% | 0.008 | 0.439 | 25% | 1.2 | 0.232 | |||||
| 40% | 0.056 | Valid | 40% | <0.001 | <0.001 | 0.002 | 40% | 1.6 | 0.591 | 0.348 | |||
| VT2 | Slope | p value | Normality | p value | p value | g Hedges | |||||||
| 0% | 0.095 | Valid | < 0.001 | 0% | 15% | 25% | 0% | 15% | 25% | ||||
| 15% | 0.118 | Valid | 15% | 0.569 | 15% | 0.266 | |||||||
| 25% | 0.208 | Valid | 25% | <0.001 | 0.205 | 25% | 0.515 | 0.238 | |||||
| 40% | 0.119 | Valid | 40% | <0.001 | 0.086 | 0.097 | 40% | 0.651 | 0.372 | 0.139 | |||
| MAX | Slope | p value | Normality | p value | p value | g Hedges | |||||||
| 0% | 0.186 | Failed | <0.001 | 0% | 15% | 25% | 0% | 15% | 25% | ||||
| 15% | 0.097 | Valid | 15% | <0.001 | 15% | 0.316 | |||||||
| 25% | 0.193 | Valid | 25% | <0.001 | 0.01 | 25% | 0.511 | 0.189 | |||||
| 40% | 0.689 | Valid | 40% | <0.001 | 0.003 | 0.036 | 40% | 0.663 | 0.348 | 0.167 | |||
| VO2 | VT1 | Slope | p value | Normality | p value | p value | g Hedges | ||||||
| 0% | 0.398 | Valid | <0.001 | 0% | 15% | 25% | 0% | 15% | 25% | ||||
| 15% | 0.614 | Valid | 15% | <0.001 | 15% | 0.754 | |||||||
| 25% | 0.409 | Valid | 25% | <0.001 | 0.201 | 25% | 0.886 | 0.136 | |||||
| 40% | 0.848 | Valid | 40% | <0.001 | 0.505 | 0.999 | 40% | 0.86 | 0.143 | 0.010 | |||
| VT2 | Slope | p value | Normality | p value | p value | g Hedges | |||||||
| 0% | 0.22 | Valid | <0.001 | 0% | 15% | 25% | 0% | 15% | 25% | ||||
| 15% | 0.81 | Valid | 15% | <0.001 | 15% | 0.588 | |||||||
| 25% | 0.184 | Valid | 25% | <0.001 | 0.048 | 25% | 0.898 | 0.264 | |||||
| 40% | 0.204 | Valid | 40% | <0.001 | 0.001 | 0.739 | 40% | 0.994 | 0.43 | 0.205 | |||
| MAX | Slope | p value | Normality | p value | p value | g Hedges | |||||||
| 0% | 0.034 | Failed | <0.001 | 0% | 15% | 25% | 0% | 15% | 25% | ||||
| 15% | 0.749 | Valid | 15% | <0.001 | 15% | 0.427 | |||||||
| 25% | 0.889 | Valid | 25% | <0.001 | 0.042 | 25% | 0.680 | 0.237 | |||||
| 40% | 0.482 | Valid | 40% | <0.001 | 0.039 | 0.999 | 40% | 0.712 | 0.271 | 0.035 | |||
| Anova One-Way Repeated Measures | Bonferroni Post-Hoc | Effect Size | |||||||||
|---|---|---|---|---|---|---|---|---|---|---|---|
| AS | VT1 | Slope | p value | Normality | p value | p value | g Hedges | ||||
| 15% | 0.655 | Valid | <0.001 | 15% | 25% | 15% | 25% | ||||
| 25% | 0.046 | Valid | 25% | <0.001 | 25% | 2.25 | |||||
| 40% | 0.036 | Valid | 40% | <0.001 | 0.999 | 40% | 2.49 | 0.291 | |||
| VT2 | Slope | p value | Normality | p value | p value | g Hedges | |||||
| 15% | 0.013 | Valid | <0.001 | 15% | 25% | 15% | 25% | ||||
| 25% | 0.65 | Valid | 25% | <0.001 | 25% | 3.09 | |||||
| 40% | 0.275 | Valid | 40% | <0.001 | 0.999 | 40% | 3.15 | 0.214 | |||
| Max | Slope | p value | Normality | p value | p value | g Hedges | |||||
| 15% | 0.094 | Valid | <0.001 | 15% | 25% | 15% | 25% | ||||
| 25% | 0.518 | Valid | 25% | <0.001 | 25% | 4.01 | |||||
| 40% | 0.056 | Valid | 40% | <0.001 | 0.999 | 40% | 4.23 | 0.154 | |||
Publisher’s Note: MDPI stays neutral with regard to jurisdictional claims in published maps and institutional affiliations. |
© 2022 by the authors. Licensee MDPI, Basel, Switzerland. This article is an open access article distributed under the terms and conditions of the Creative Commons Attribution (CC BY) license (https://creativecommons.org/licenses/by/4.0/).
Share and Cite
Cassirame, J.; Godin, A.; Chamoux, M.; Doucende, G.; Mourot, L. Physiological Implication of Slope Gradient during Incremental Running Test. Int. J. Environ. Res. Public Health 2022, 19, 12210. https://doi.org/10.3390/ijerph191912210
Cassirame J, Godin A, Chamoux M, Doucende G, Mourot L. Physiological Implication of Slope Gradient during Incremental Running Test. International Journal of Environmental Research and Public Health. 2022; 19(19):12210. https://doi.org/10.3390/ijerph191912210
Chicago/Turabian StyleCassirame, Johan, Antoine Godin, Maxime Chamoux, Gregory Doucende, and Laurent Mourot. 2022. "Physiological Implication of Slope Gradient during Incremental Running Test" International Journal of Environmental Research and Public Health 19, no. 19: 12210. https://doi.org/10.3390/ijerph191912210
APA StyleCassirame, J., Godin, A., Chamoux, M., Doucende, G., & Mourot, L. (2022). Physiological Implication of Slope Gradient during Incremental Running Test. International Journal of Environmental Research and Public Health, 19(19), 12210. https://doi.org/10.3390/ijerph191912210