
A New Approach to Monitoring Urban Built-Up Areas in Kunming and Yuxi from 2012 to 2021: Promoting Healthy Urban Development and Efficient Governance

Abstract
1. Introduction
2. Materials and Methods
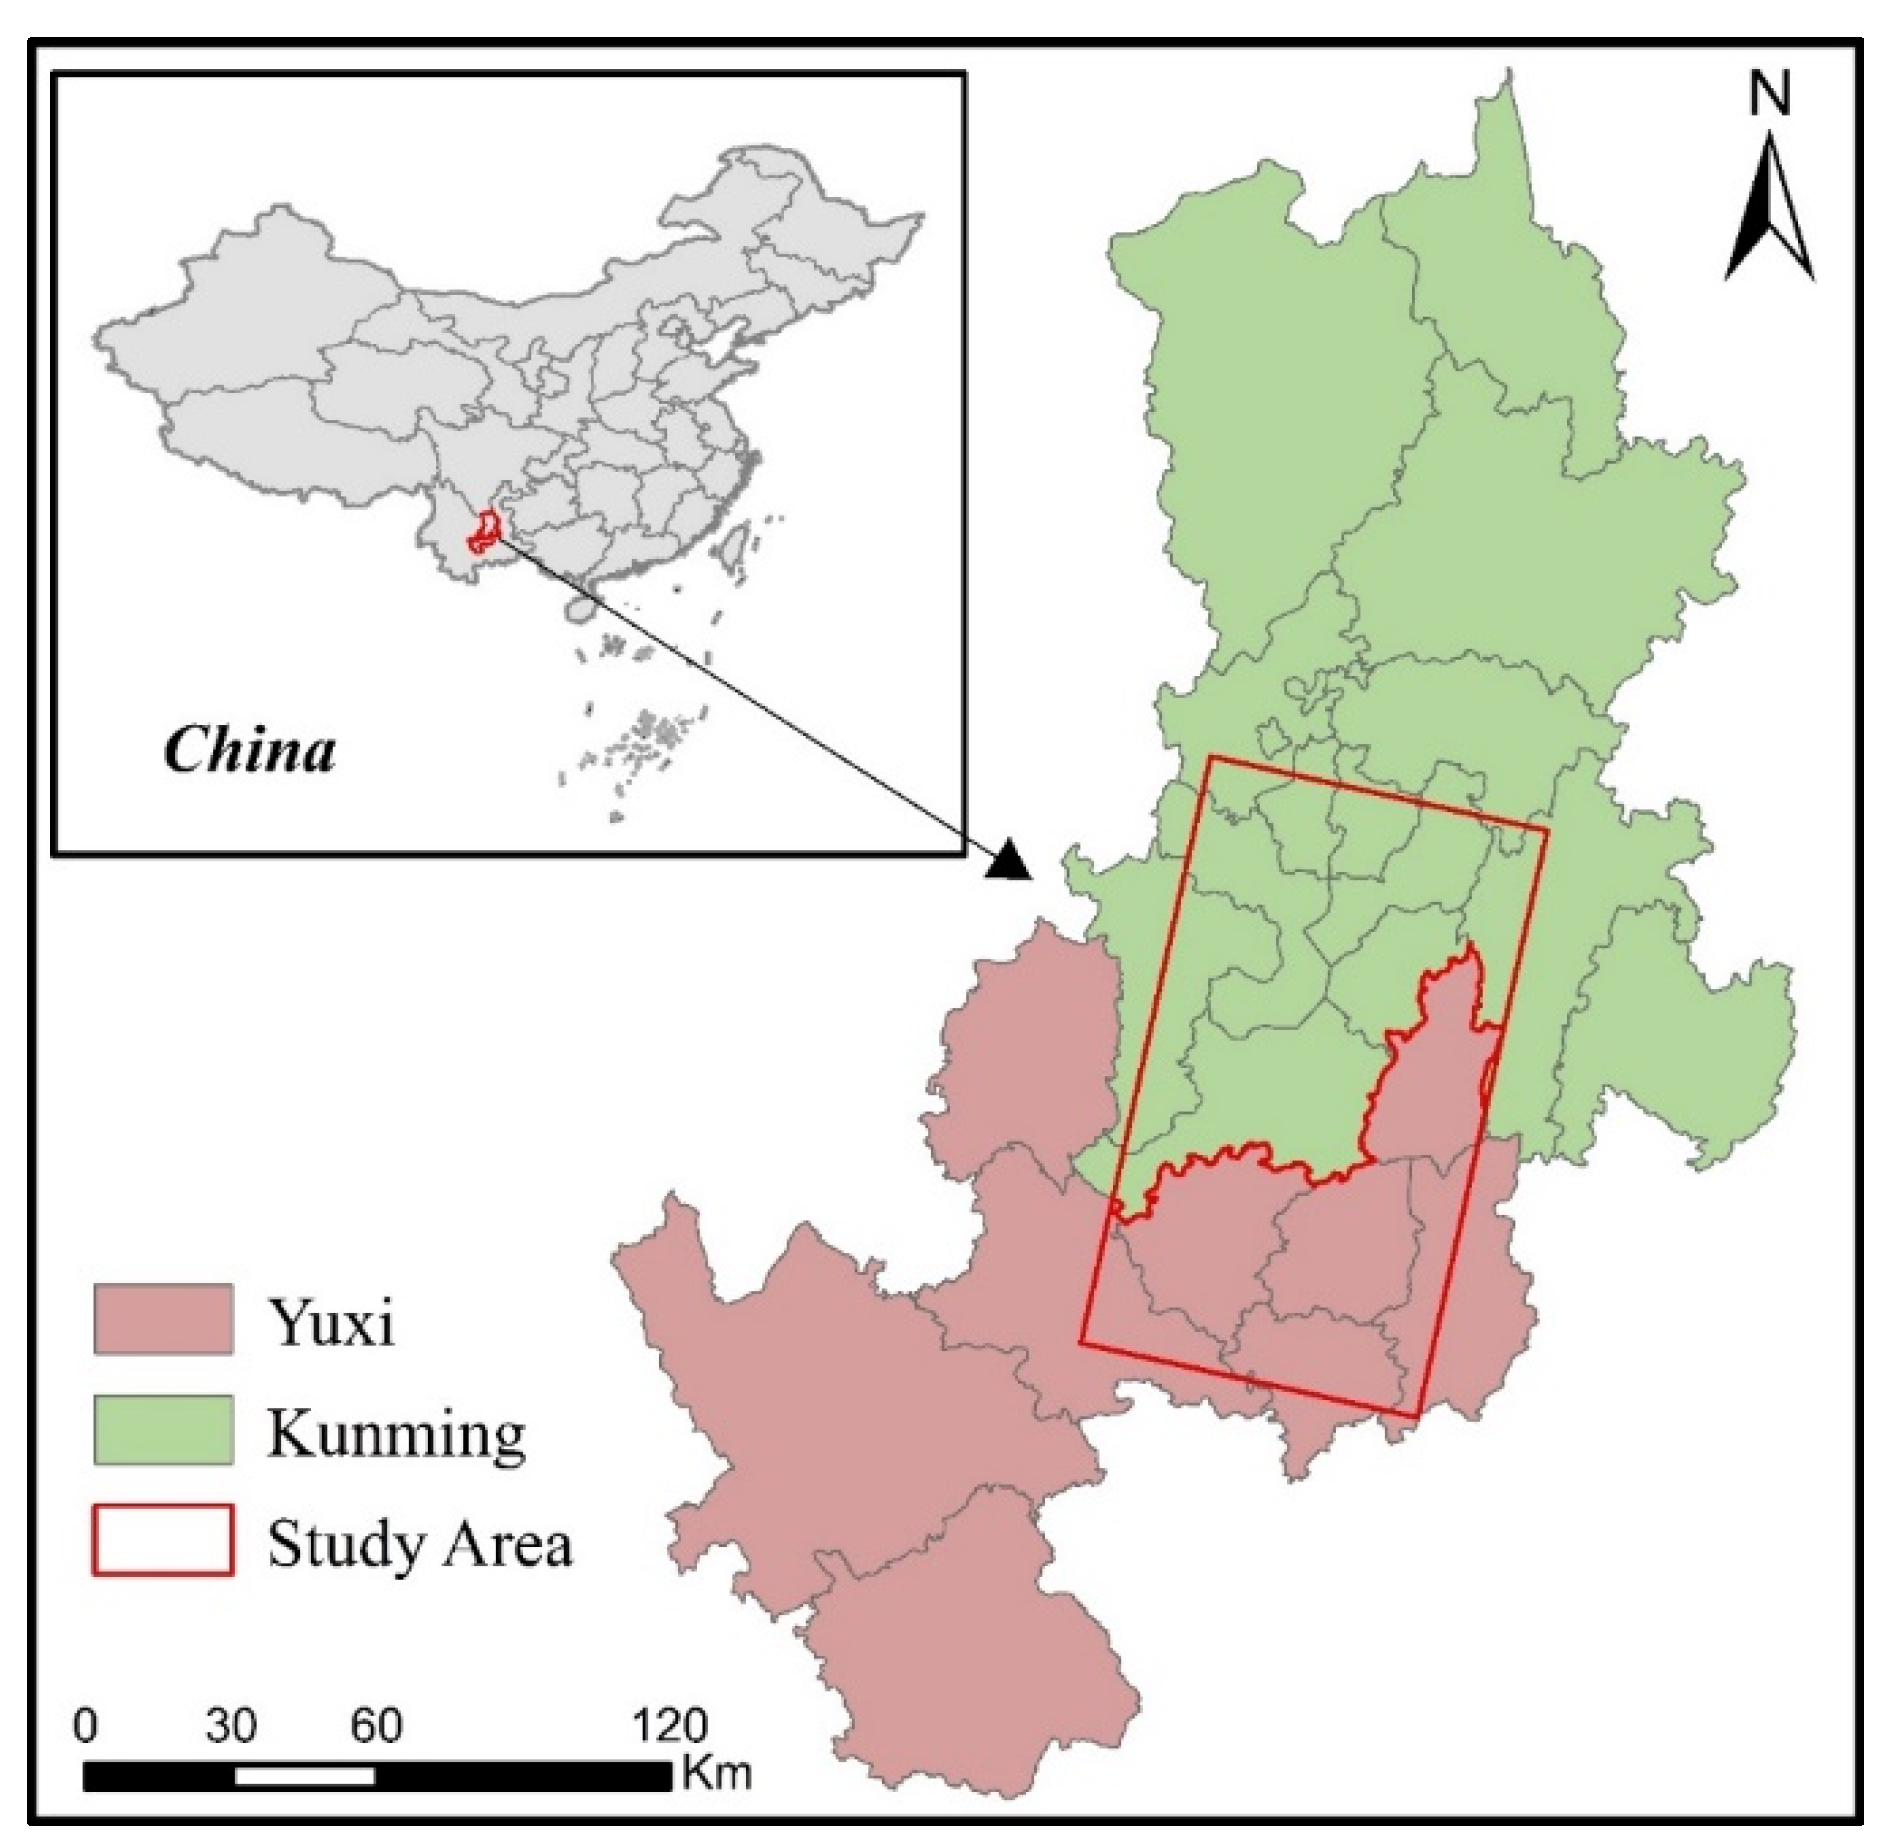
2.1. Study Area
2.2. Study Data
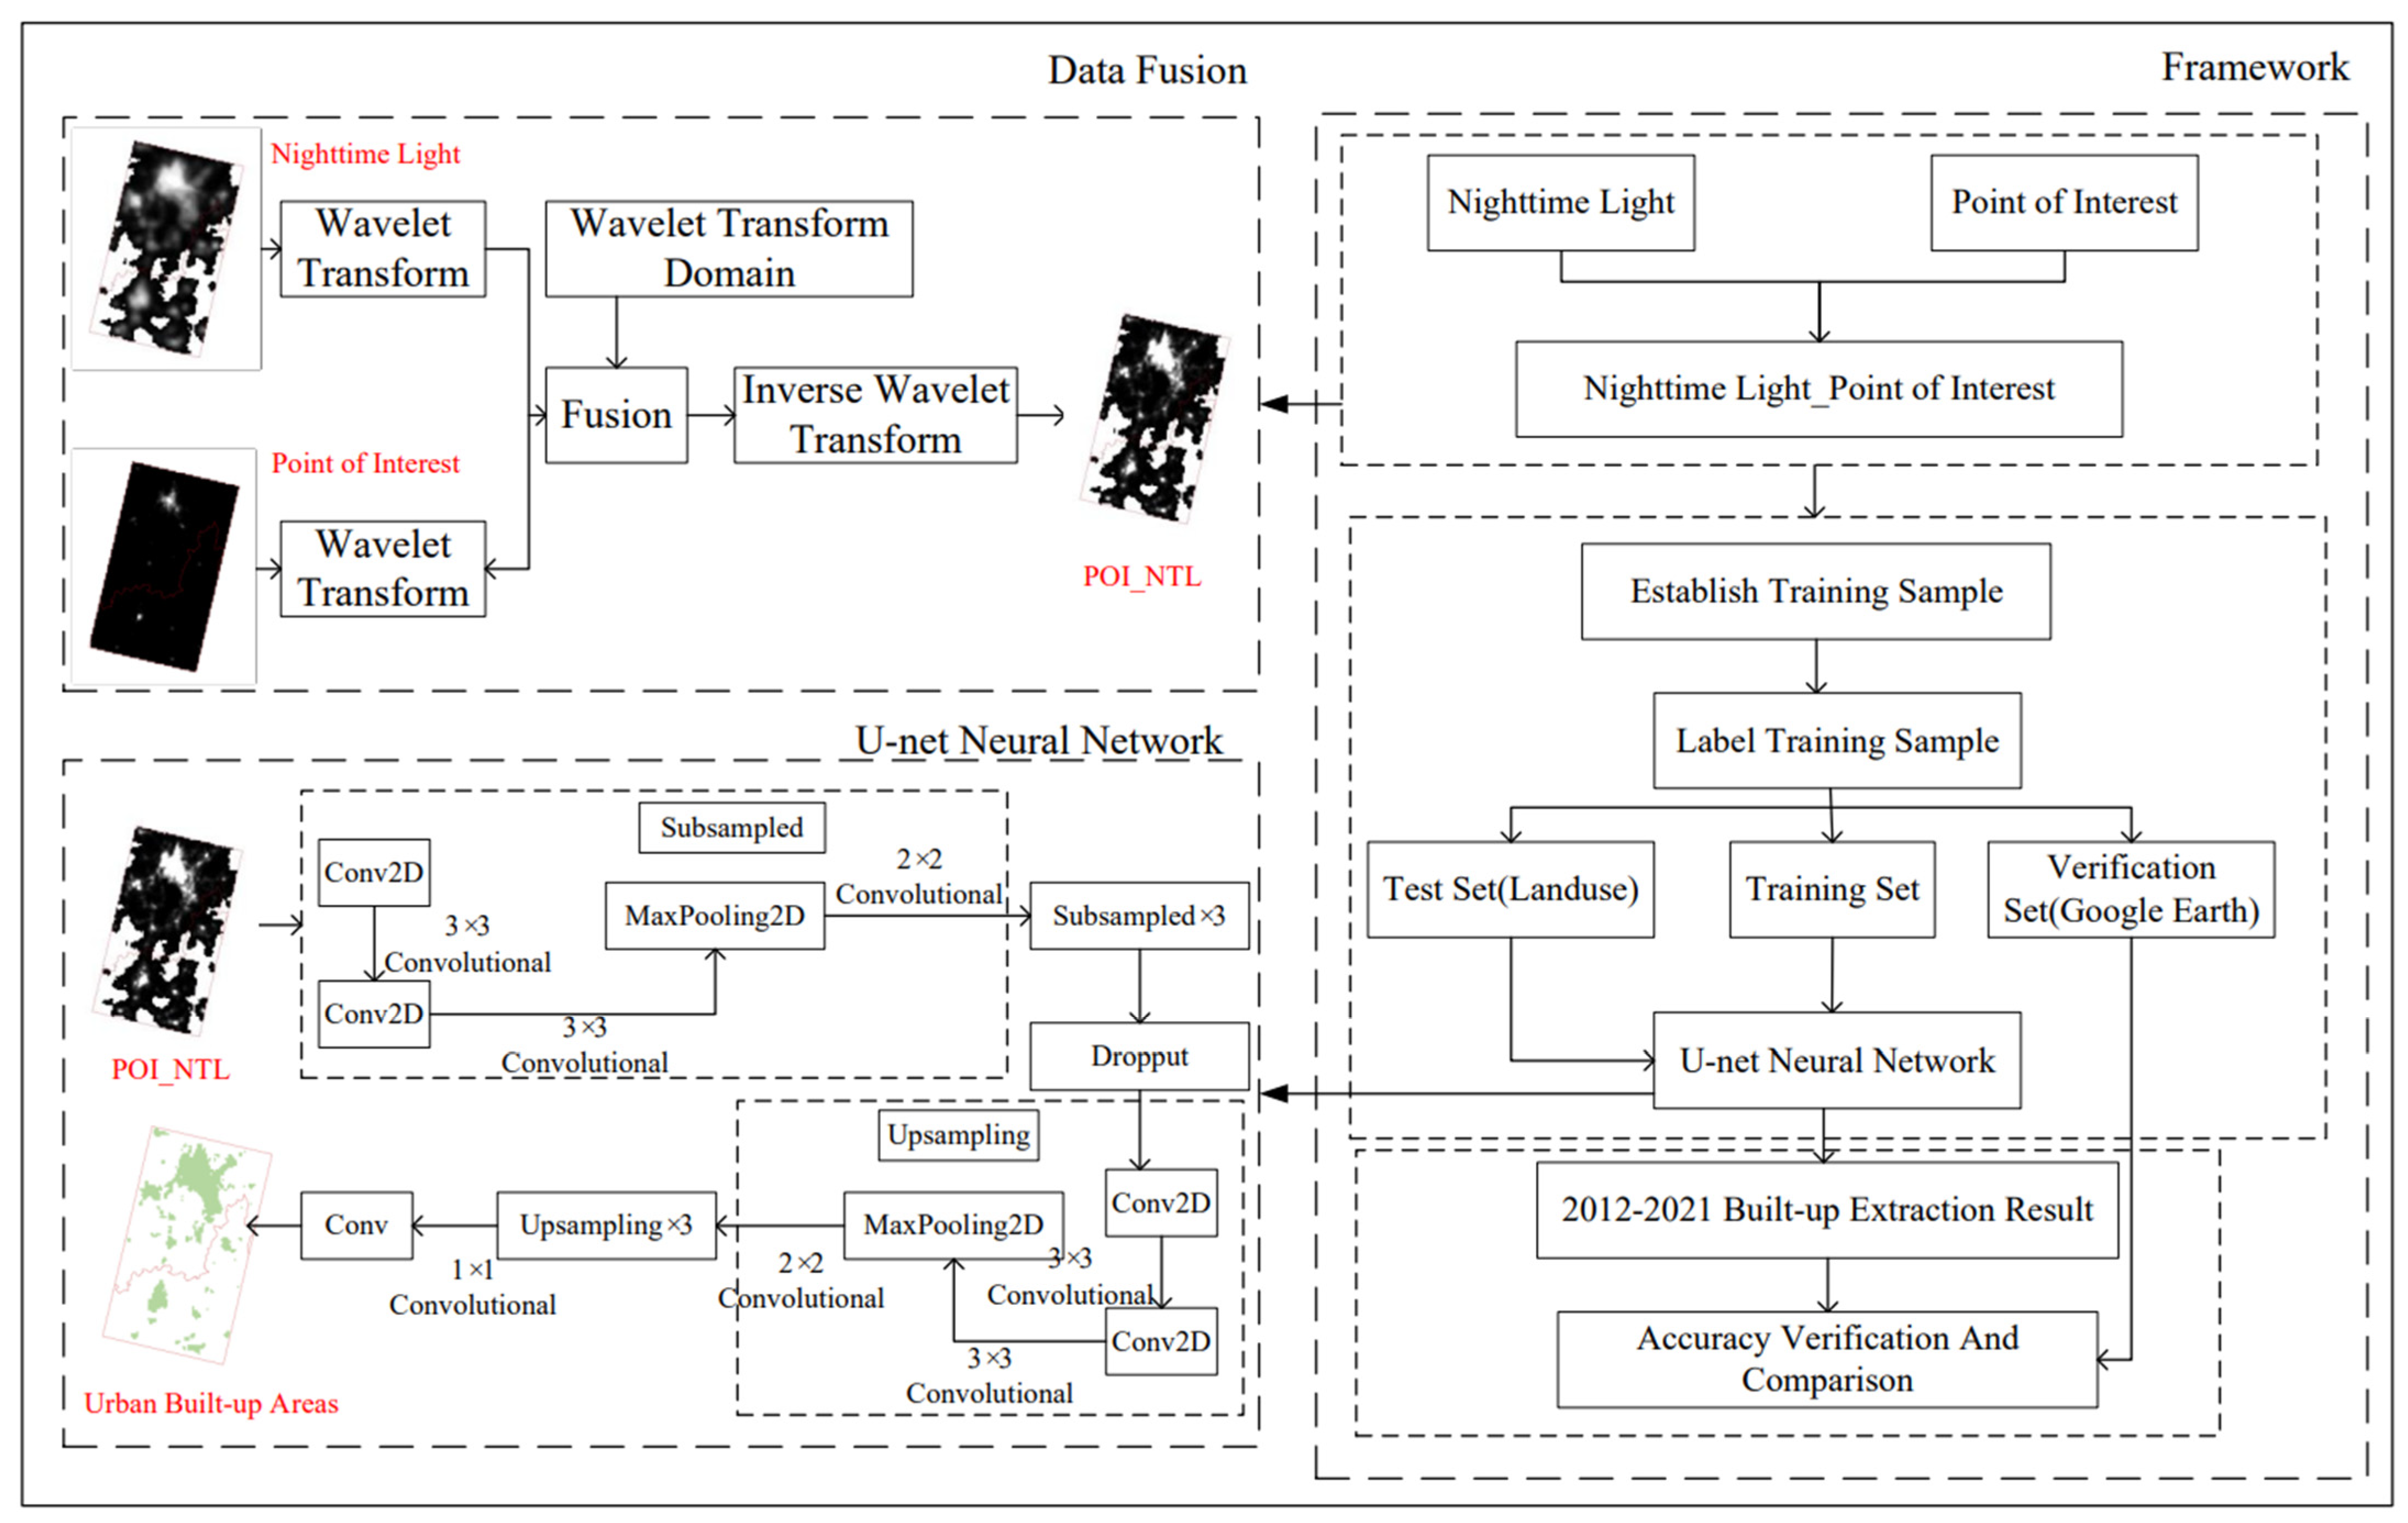
2.3. Methods
2.3.1. Kernel Density Analysis (KDA)
2.3.2. Image Fusion Modification
2.3.3. Image Characteristics Extraction
2.3.4. Accuracy Verification
3. Results
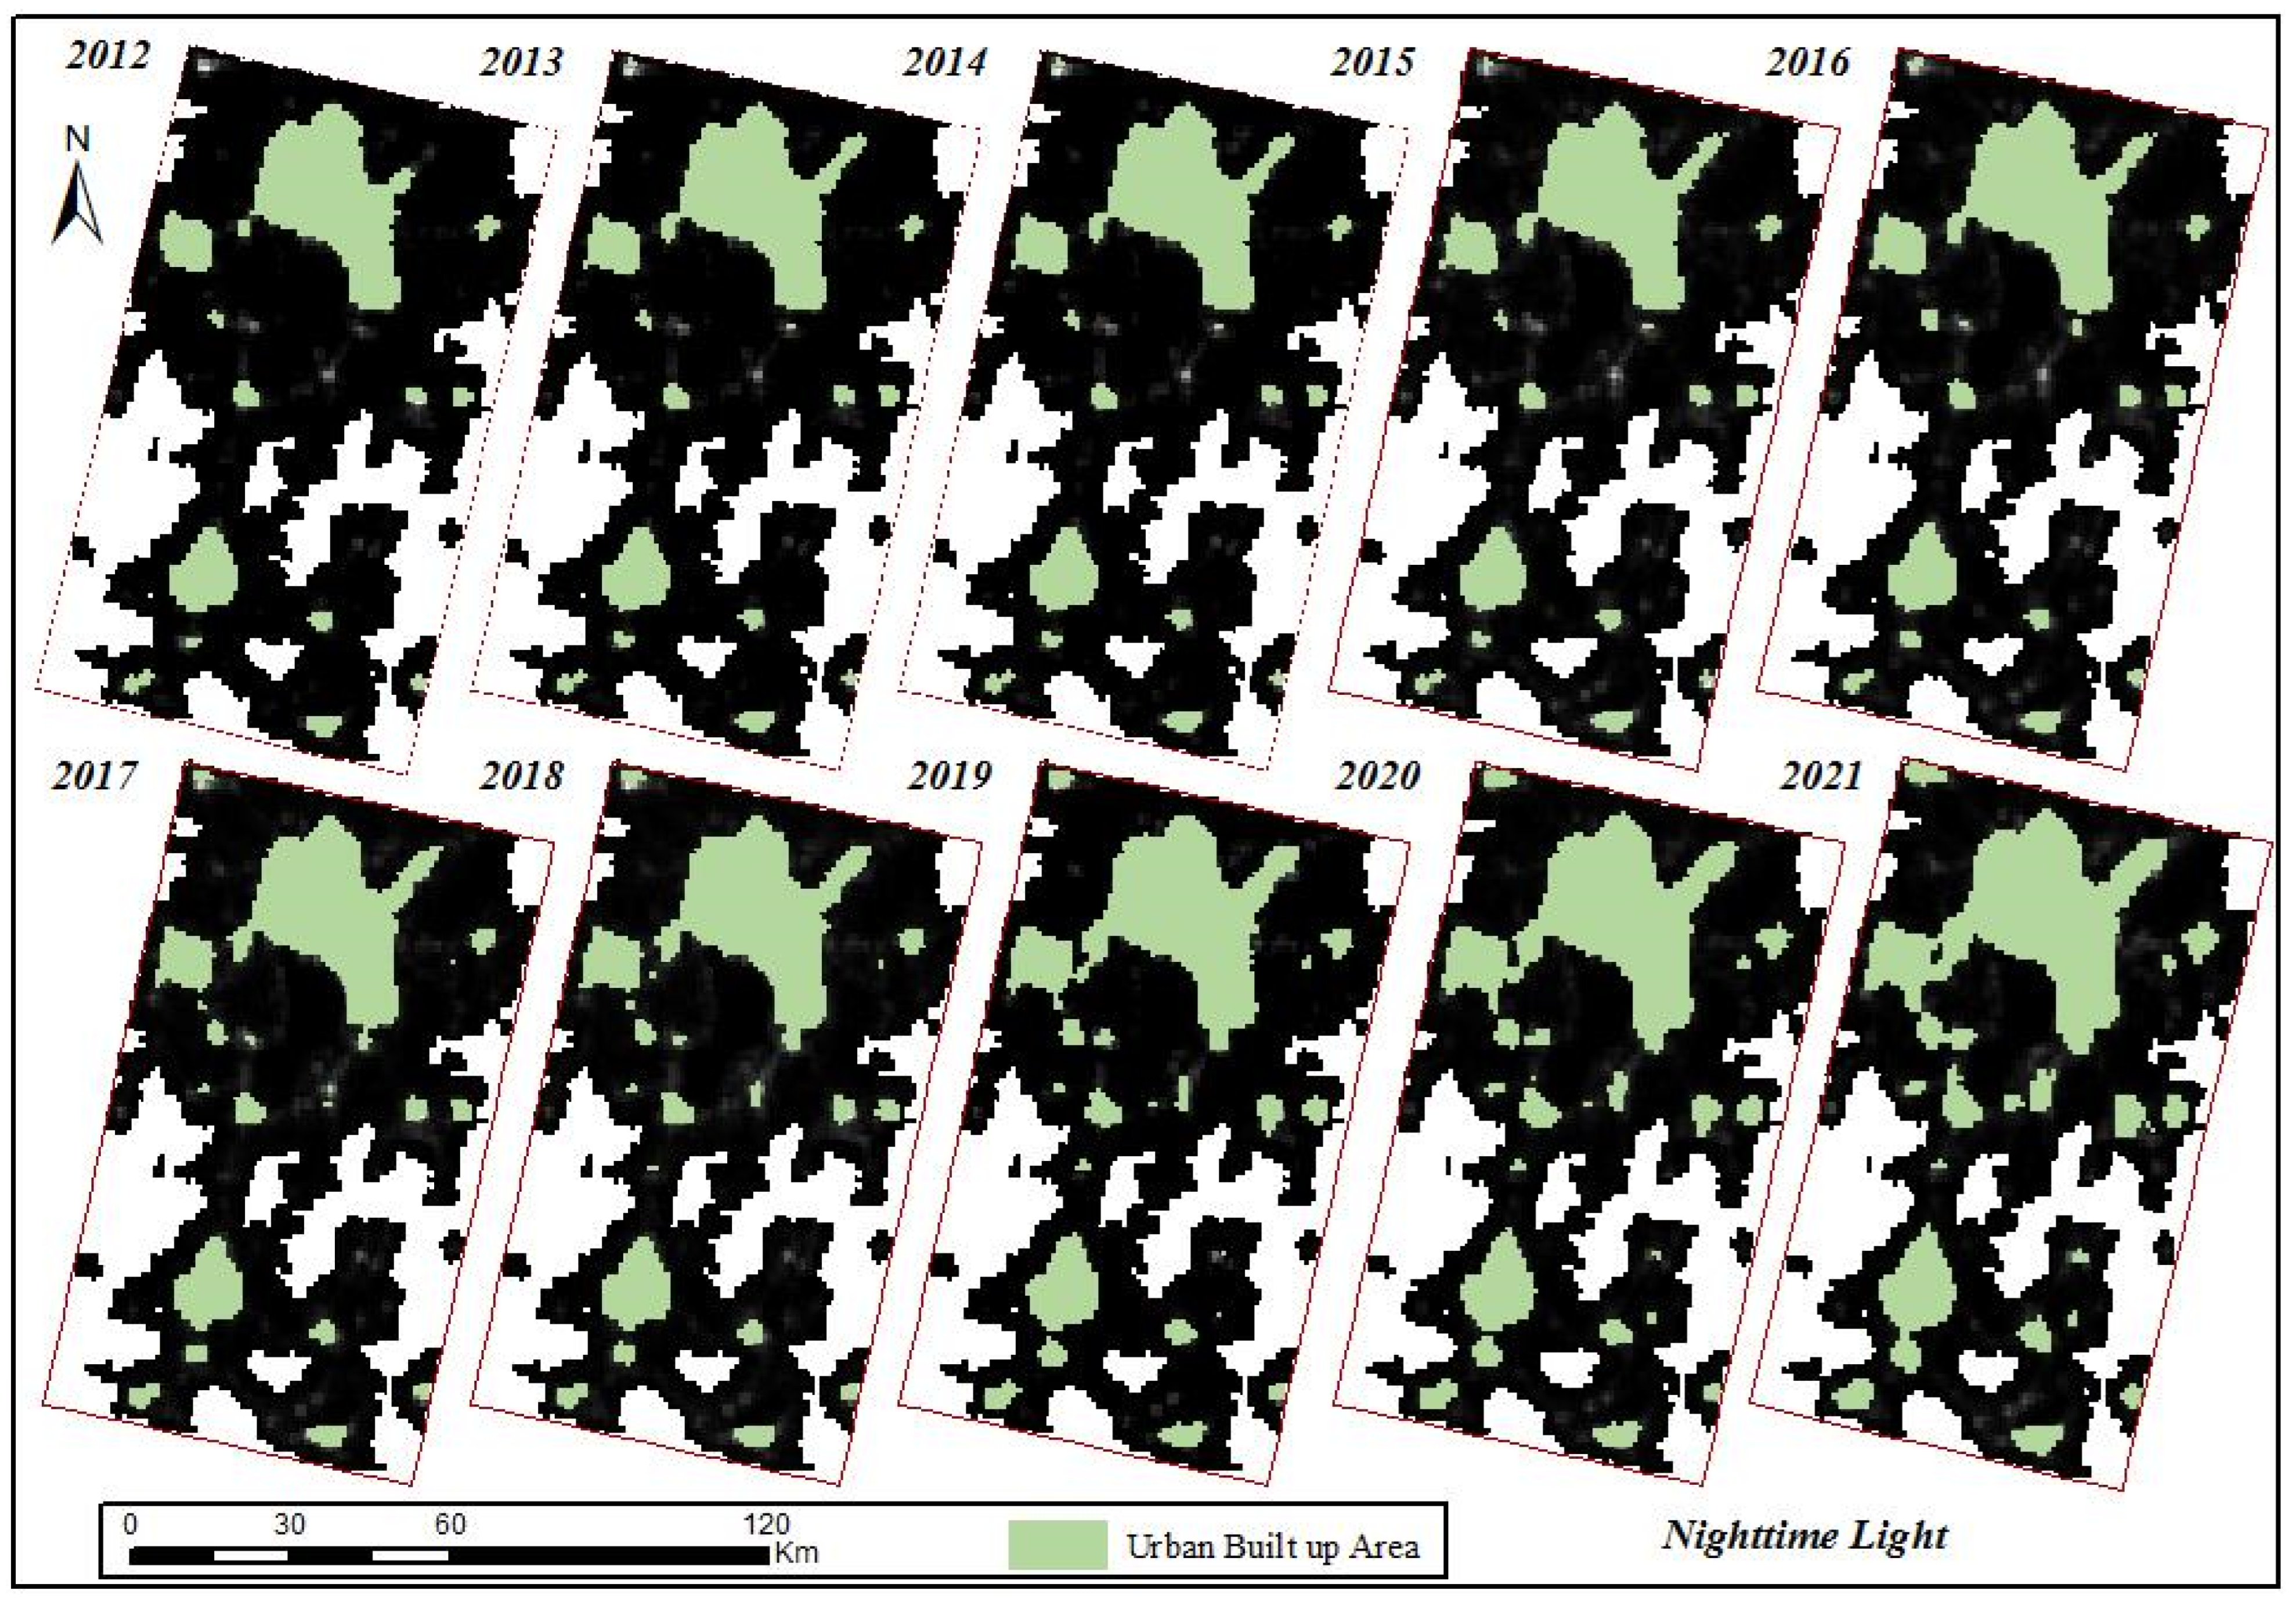
3.1. Monitoring Urban Built-Up Area Using NTL Data
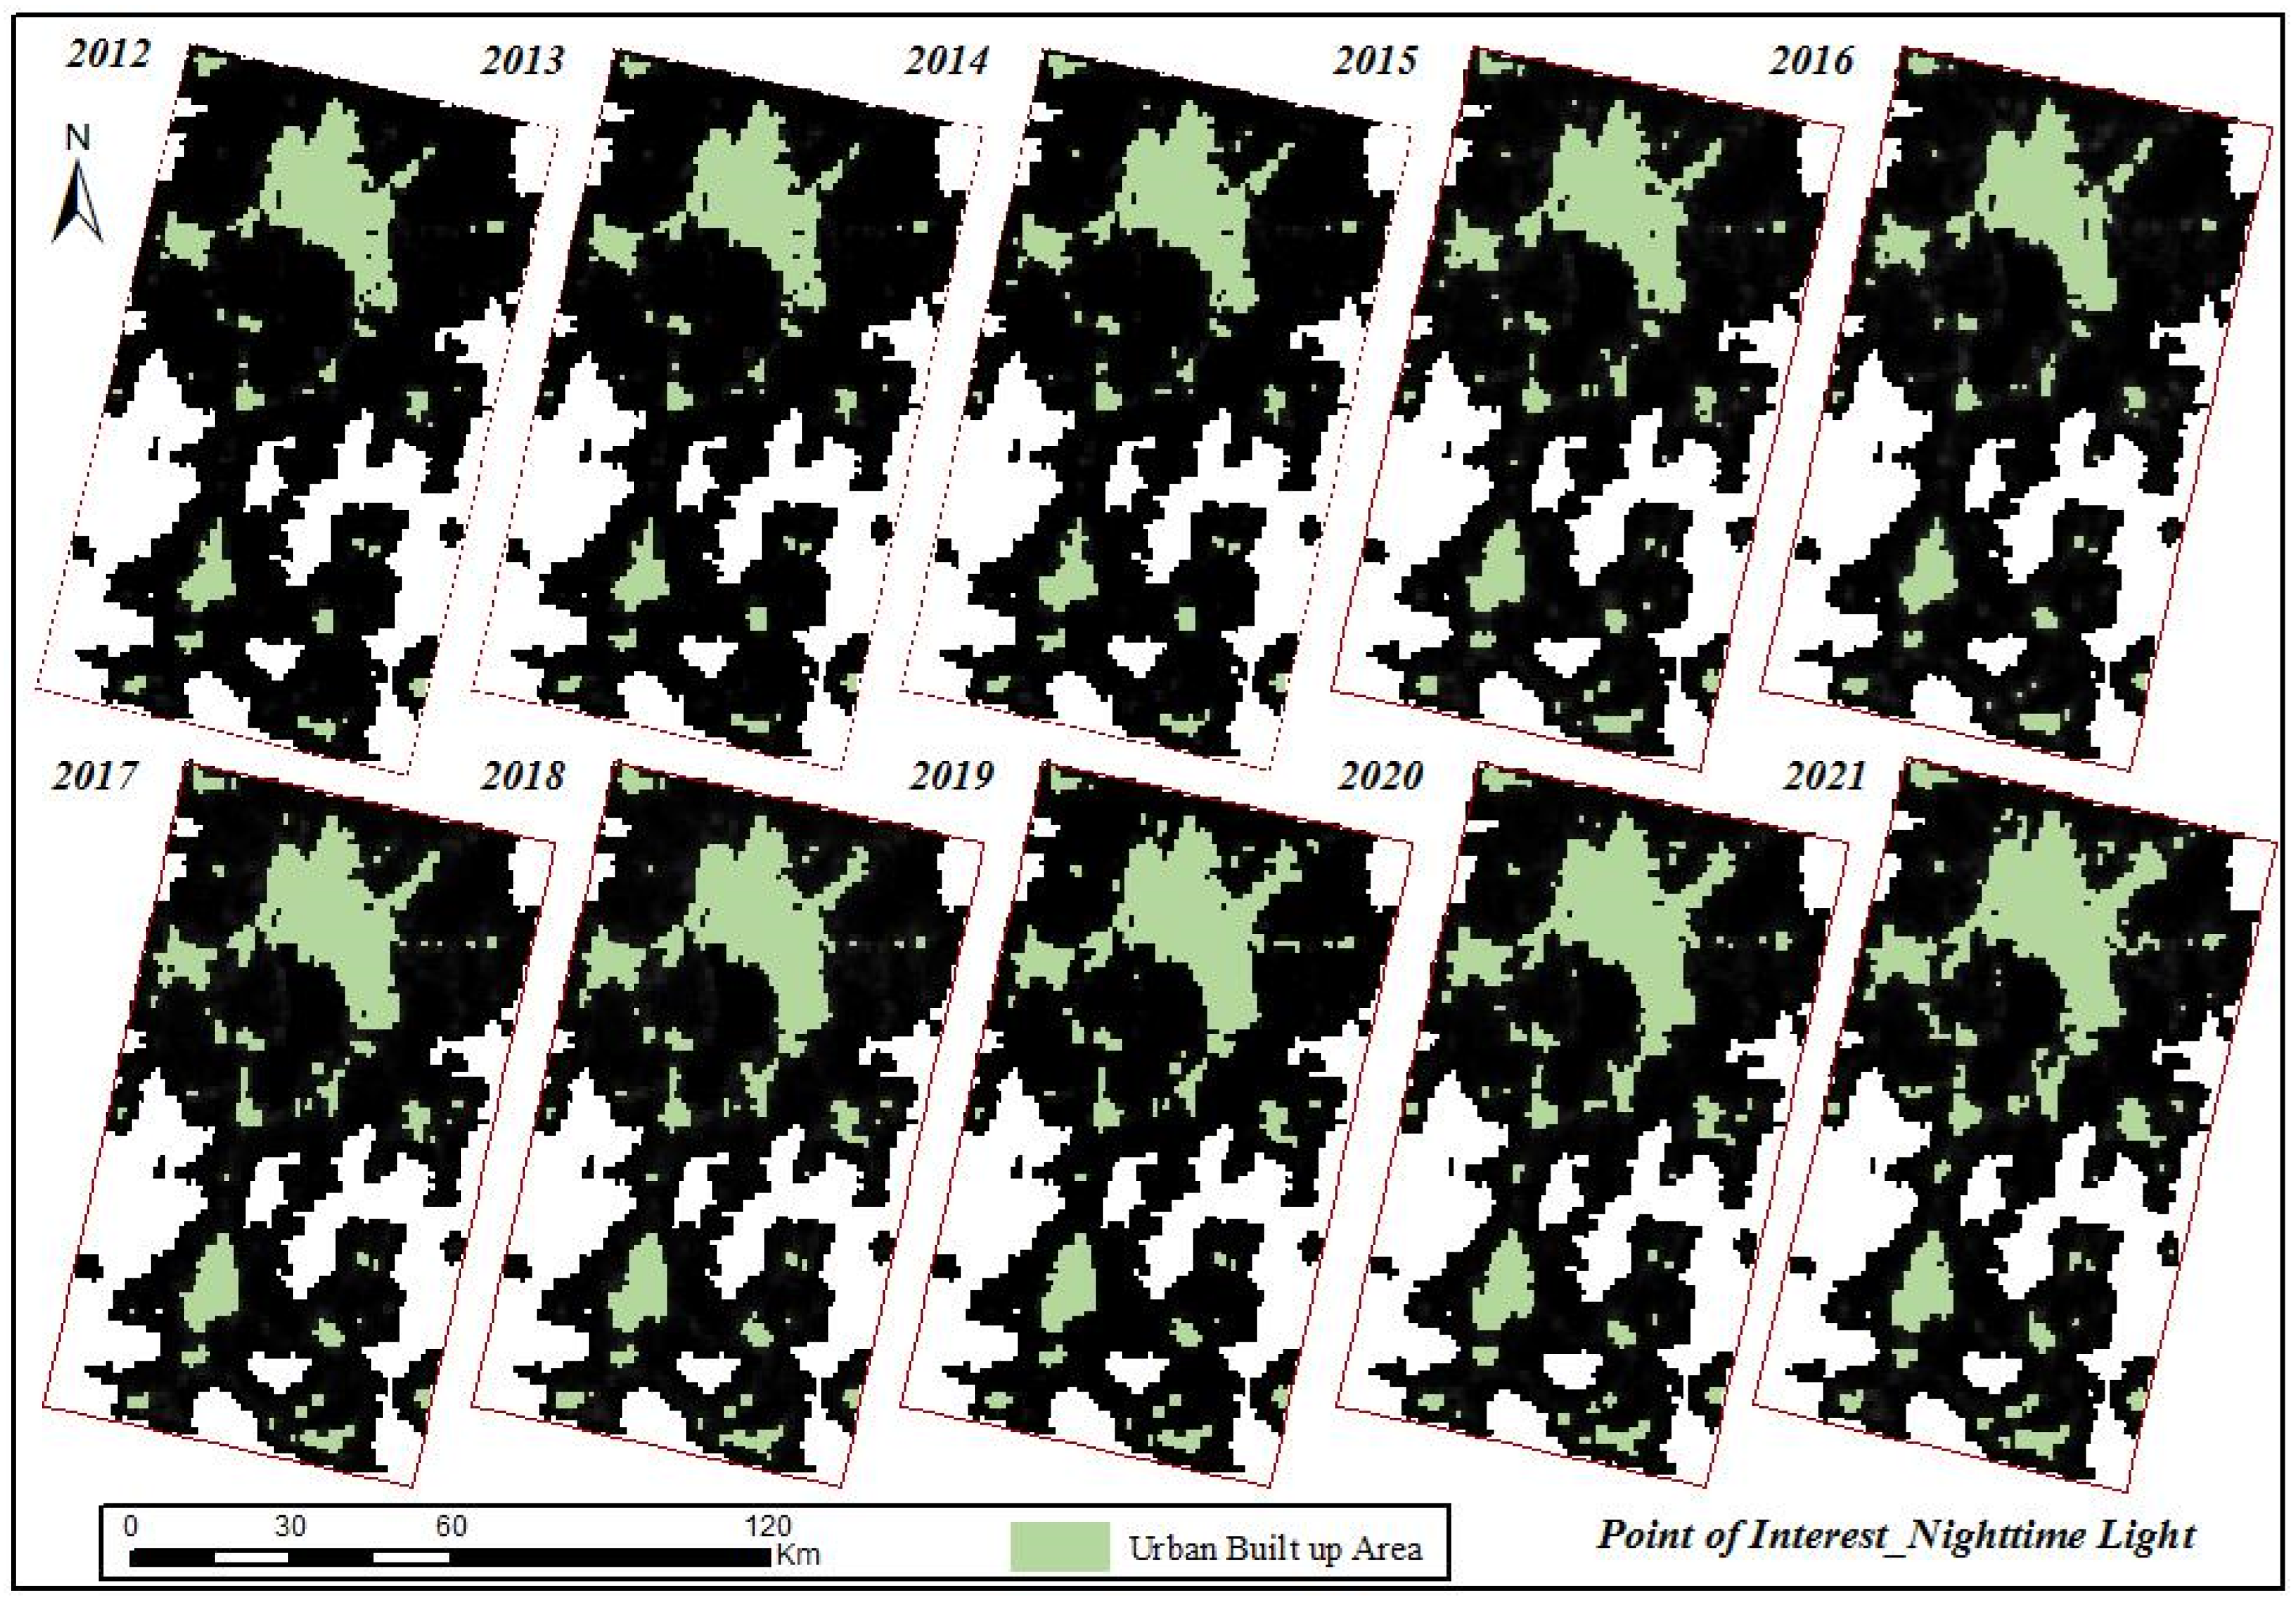
3.2. Monitoring Urban Built-Up Area Extracted Urban Built-Up Area by Fusing NTL Data and POI Data
3.3. Accuracy Verification and Difference Analysis
4. Discussion
5. Conclusions
Author Contributions
Funding
Institutional Review Board Statement
Informed Consent Statement
Data Availability Statement
Conflicts of Interest
References
- Shorabeh, S.N.; Kakroodi, A.; Firozjaei, M.K.; Minaei, F.; Homaee, M. Impact assessment modeling of climatic conditions on spatial-temporal changes in surface biophysical properties driven by urban physical expansion using satellite images. Sustain. Cities Soc. 2022, 80, 103757. [Google Scholar] [CrossRef]
- Aburas, M.M.; Ho, Y.M.; Ramli, M.F.; Ash’Aari, Z.H. Monitoring and assessment of urban growth patterns using spatio-temporal built-up area analysis. Environ. Monit. Assess. 2018, 190, 156. [Google Scholar] [CrossRef] [PubMed]
- Mubareka, S.; Koomen, E.; Estreguil, C.; Lavalle, C. Development of a composite index of urban compactness for land use modelling applications. Landsc. Urban Plan. 2011, 103, 303–317. [Google Scholar] [CrossRef]
- Das, S.; Angadi, D.P. Land use land cover change detection and monitoring of urban growth using remote sensing and GIS techniques: A micro-level study. GeoJournal 2021, 87, 2101–2123. [Google Scholar] [CrossRef]
- Tang, D.; Liu, H.; Song, E.; Chang, S. Urban expansion simulation from the perspective of land acquisition-based on bargaining model and ant colony optimization. Comput. Environ. Urban Syst. 2020, 82, 101504. [Google Scholar] [CrossRef]
- Gao, L.; Tao, F.; Liu, R.; Wang, Z.; Leng, H.; Zhou, T. Multi-scenario simulation and ecological risk analysis of land use based on the PLUS model: A case study of Nanjing. Sustain. Cities Soc. 2022, 85, 104055. [Google Scholar] [CrossRef]
- Mishra, B.K.; Mebeelo, K.; Chakraborty, S.; Kumar, P.; Gautam, A. Implications of urban expansion on land use and land cover: Towards sustainable development of Mega Manila, Philippines. GeoJournal 2019, 86, 927–942. [Google Scholar] [CrossRef]
- Lu, Y.; Yue, W.; Liu, Y.; Huang, Y. Investigating the spatiotemporal non-stationary relationships between urban spatial form and land surface temperature: A case study of Wuhan, China. Sustain. Cities Soc. 2021, 72, 103070. [Google Scholar] [CrossRef]
- Frankhauser, P.; Tannier, C.; Vuidel, G.; Houot, H. An integrated multifractal modelling to urban and regional planning. Comput. Environ. Urban Syst. 2018, 67, 132–146. [Google Scholar] [CrossRef]
- Singh, P.; Chaudhuri, A.S.; Verma, P.; Singh, V.K.; Meena, S.R. Earth observation data sets in monitoring of urbanization and urban heat island of Delhi, India. Geomat. Nat. Hazards Risk 2022, 13, 1762–1779. [Google Scholar] [CrossRef]
- Bechtel, B.; Pesaresi, M.; Florczyk, A.J.; Mills, G. Beyond built-up: The internal makeup of urban areas. In Urban Remote Sensing; CRC Press: Boca Raton, FL, USA, 2018; pp. 83–124. [Google Scholar]
- Luqman, M.; Rayner, P.J.; Gurney, K.R. Combining Measurements of Built-up Area, Nighttime Light, and Travel Time Distance for Detecting Changes in Urban Boundaries: Introducing the BUNTUS Algorithm. Remote Sens. 2019, 11, 2969. [Google Scholar] [CrossRef]
- Lu, D.; Wang, Y.; Yang, Q.; Su, K.; Zhang, H.; Li, Y. Modeling Spatiotemporal Population Changes by Integrating DMSP-OLS and NPP-VIIRS Nighttime Light Data in Chongqing, China. Remote Sens. 2021, 13, 284. [Google Scholar] [CrossRef]
- Letu, H.; Hara, M.; Tana, G.; Bao, Y.; Nishio, F. Generating the Nighttime Light of the Human Settlements by Identifying Periodic Components from DMSP/OLS Satellite Imagery. Environ. Sci. Technol. 2015, 49, 10503–10509. [Google Scholar] [CrossRef]
- Zhou, Y.; Smith, S.J.; Zhao, K.; Imhoff, M.L.; Thomson, A.M.; Bond-Lamberty, B.; Asrar, G.R.; Zhang, X.; He, C.; Elvidge, C.D. A global map of urban extent from nightlights. Environ. Res. Lett. 2015, 10, 0554011. [Google Scholar] [CrossRef]
- Fan, P.; Ouyang, Z.; Nguyen, D.D.; Nguyen, T.T.H.; Park, H.; Chen, J. Urbanization, economic development, environmental and social changes in transitional economies: Vietnam after Doimoi. Landsc. Urban Plan. 2018, 187, 145–155. [Google Scholar] [CrossRef]
- Hassan, M.M.; Odeh, I.; El-Rayes, K. New Approach to Compare Glare and Light Characteristics of Conventional and Balloon Lighting Systems. J. Constr. Eng. Manag. 2011, 137, 39–44. [Google Scholar] [CrossRef]
- Chen, Y.-L.; Wu, B.-F.; Huang, H.-Y.; Fan, C.-J. A Real-Time Vision System for Nighttime Vehicle Detection and Traffic Surveillance. IEEE Trans. Ind. Electron. 2010, 58, 2030–2044. [Google Scholar] [CrossRef]
- Zhang, J.; Yuan, X.; Tan, X.; Zhang, X. Delineation of the Urban-Rural Boundary through Data Fusion: Applications to Improve Urban and Rural Environments and Promote Intensive and Healthy Urban Development. Int. J. Environ. Res. Public Health 2021, 18, 7180. [Google Scholar] [CrossRef]
- Imhoff, M.L.; Lawrence, W.T.; Elvidge, C.D.; Paul, T.; Levine, E.; Privalsky, M.V.; Brown, V. Using nighttime DMSP/OLS images of city lights to estimate the impact of urban land use on soil resources in the United States. Remote Sens. Environ. 1997, 59, 105–117. [Google Scholar] [CrossRef]
- Du, J.; Fu, Q.; Fang, S.; Wu, J.; He, P.; Quan, Z. Effects of rapid urbanization on vegetation cover in the metropolises of China over the last four decades. Ecol. Indic. 2019, 107, 105458. [Google Scholar] [CrossRef]
- Ma, X.; Tong, X.; Liu, S.; Li, C.; Ma, Z. A Multisource Remotely Sensed Data Oriented Method for “Ghost City” Phenomenon Identification. IEEE J. Sel. Top. Appl. Earth Obs. Remote Sens. 2018, 11, 2310–2319. [Google Scholar] [CrossRef]
- Li, K.; Chen, Y. A Genetic Algorithm-Based Urban Cluster Automatic Threshold Method by Combining VIIRS DNB, NDVI, and NDBI to Monitor Urbanization. Remote Sens. 2018, 10, 277. [Google Scholar] [CrossRef]
- Gao, Y.; Liu, K.; Zhou, P.; Xie, H. The Effects of Residential Built Environment on Supporting Physical Activity Diversity in High-Density Cities: A Case Study in Shenzhen, China. Int. J. Environ. Res. Public Health 2021, 18, 6676. [Google Scholar] [CrossRef] [PubMed]
- Shi, K.; Yu, B.; Huang, C.; Wu, J.; Sun, X. Exploring spatiotemporal patterns of electric power consumption in countries along the Belt and Road. Energy 2018, 150, 847–859. [Google Scholar] [CrossRef]
- Zhang, J.; Fukuda, H.; Wei, X.; Zhang, L.; Jiang, J. Effects of urban environmental attributes on graduate job preferences in Northeastern China: An application of conjoint analysis and big data methods. Environ. Res. Lett. 2021, 16, 115008. [Google Scholar] [CrossRef]
- Kong, L.; Liu, Z.; Wu, J. A systematic review of big data-based urban sustainability research: State-of-the-science and future directions. J. Clean. Prod. 2020, 273, 123142. [Google Scholar] [CrossRef]
- Yao, R.; Wang, L.; Gui, X.; Zheng, Y.; Zhang, H.; Huang, X. Urbanization Effects on Vegetation and Surface Urban Heat Islands in China’s Yangtze River Basin. Remote Sens. 2017, 9, 540. [Google Scholar] [CrossRef]
- Song, Y.; Chen, B.; Kwan, M.-P. How does urban expansion impact people’s exposure to green environments? A comparative study of 290 Chinese cities. J. Clean. Prod. 2019, 246, 119018. [Google Scholar] [CrossRef]
- He, X.; Zhou, C.; Zhang, J.; Yuan, X. Using Wavelet Transforms to Fuse Nighttime Light Data and POI Big Data to Extract Urban Built-Up Areas. Remote Sens. 2020, 12, 3887. [Google Scholar] [CrossRef]
- Jun, Z.; Xiao-Die, Y.; Han, L. The Extraction of Urban Built-Up Areas by Integrating Night-Time Light and POI Data—A Case Study of Kunming, China. IEEE Access 2021, 9, 22417–22429. [Google Scholar] [CrossRef]
- Li, F.; Yan, Q.; Bian, Z.; Liu, B.; Wu, Z. A POI and LST Adjusted NTL Urban Index for Urban Built-Up Area Extraction. Sensors 2020, 20, 2918. [Google Scholar] [CrossRef] [PubMed]
- Lou, G.; Chen, Q.; He, K.; Zhou, Y.; Shi, Z. Using Nighttime Light Data and POI Big Data to Detect the Urban Centers of Hangzhou. Remote Sens. 2019, 11, 1821. [Google Scholar] [CrossRef]
- He, X.; Zhang, Z.; Yang, Z. Extraction of urban built-up area based on the fusion of night-time light data and point of interest data. R. Soc. Open Sci. 2021, 8, 210838. [Google Scholar] [CrossRef] [PubMed]
- Zhou, Y.; He, X.; Zhu, Y. Identification and Evaluation of the Polycentric Urban Structure: An Empirical Analysis Based on Multi-Source Big Data Fusion. Remote Sens. 2022, 14, 2705. [Google Scholar] [CrossRef]
- He, X.; Zhu, Y.; Chang, P.; Zhou, C. Using Tencent User Location Data to Modify Night-Time Light Data for Delineating Urban Agglomeration Boundaries. Front. Environ. Sci. 2022, 10, 860365. [Google Scholar] [CrossRef]
- Li, Z.; Wang, Y.; Zhang, N.; Zhang, Y.; Zhao, Z.; Xu, D.; Ben, G.; Gao, Y. Deep Learning-Based Object Detection Techniques for Remote Sensing Images: A Survey. Remote Sens. 2022, 14, 2385. [Google Scholar] [CrossRef]
- Xie, Y.; Xu, Y.; Hu, C.; Lu, L.; Hu, X.; Rong, Q. Urban forestry detection by deep learning method with GaoFen-2 remote sensing images. J. Appl. Remote Sens. 2022, 16, 022206. [Google Scholar] [CrossRef]
- Zhang, J.; Zhang, X.; Tan, X.; Yuan, X. Extraction of Urban Built-Up Area Based on Deep Learning and Multi-Sources Data Fusion—The Application of an Emerging Technology in Urban Planning. Land 2022, 11, 1212. [Google Scholar] [CrossRef]
- Wu, Z.; Gao, Y.; Li, L.; Xue, J.; Li, Y. Semantic segmentation of high-resolution remote sensing images using fully convolutional network with adaptive threshold. Connect. Sci. 2018, 31, 169–184. [Google Scholar] [CrossRef]
- Sun, X.; Liu, L.; Li, C.; Yin, J.; Zhao, J.; Si, W. Classification for Remote Sensing Data with Improved CNN-SVM Method. IEEE Access 2019, 7, 164507–164516. [Google Scholar] [CrossRef]
- Kamaraj, N.P.; Shekhar, S.; Sivashankari, V.; Balasubramani, K.; Prasad, K.A. Detecting heat-inducing urban built-up surface material with multi remote sensing datasets using reflectance and emission spectroscopy. Remote Sens. Environ. 2021, 264, 112591. [Google Scholar] [CrossRef]
- Li, W.; Liu, H.; Wang, Y.; Li, Z.; Jia, Y.; Gui, G. Deep Learning-Based Classification Methods for Remote Sensing Images in Urban Built-Up Areas. IEEE Access 2019, 7, 36274–36284. [Google Scholar] [CrossRef]
- Zhang, Z.; Wang, B.; Buyantuev, A.; He, X.; Gao, W.; Wang, Y.; Dawazhaxi; Yang, Z. Urban agglomeration of Kunming and Yuxi cities in Yunnan, China: The relative importance of government policy drivers and environmental constraints. Landsc. Ecol. 2019, 34, 663–679. [Google Scholar] [CrossRef]
- Tishi, T.R.; Islam, I. Urban fire occurrences in the Dhaka Metropolitan Area. GeoJournal 2018, 84, 1417–1427. [Google Scholar] [CrossRef]
- Ma, X.; Zhang, X.; Pun, M.-O. A Crossmodal Multiscale Fusion Network for Semantic Segmentation of Remote Sensing Data. IEEE J. Sel. Top. Appl. Earth Obs. Remote Sens. 2022, 15, 3463–3474. [Google Scholar] [CrossRef]
- Norton, C.L.; Hartfield, K.; Collins, C.D.H.; van Leeuwen, W.J.D.; Metz, L.J. Multi-Temporal LiDAR and Hyperspectral Data Fusion for Classification of Semi-Arid Woody Cover Species. Remote Sens. 2022, 14, 2896. [Google Scholar] [CrossRef]
- Chen, L.; Shi, W.; Fan, C.; Zou, L.; Deng, D. A Novel Coarse-to-Fine Method of Ship Detection in Optical Remote Sensing Images Based on a Deep Residual Dense Network. Remote Sens. 2020, 12, 3115. [Google Scholar] [CrossRef]
- He, X.; Yuan, X.; Zhang, D.; Zhang, R.; Li, M.; Zhou, C. Delineation of Urban Agglomeration Boundary Based on Multisource Big Data Fusion—A Case Study of Guangdong–Hong Kong–Macao Greater Bay Area (GBA). Remote Sens. 2021, 13, 1801. [Google Scholar] [CrossRef]
- Shi, J.; Liu, W.; Zhu, Y.; Wang, S.; Hao, S.; Zhu, C.; Shan, H.; Li, E.; Li, X.; Zhang, L. Fine Object Change Detection Based on Vector Boundary and Deep Learning With High-Resolution Remote Sensing Images. IEEE J. Sel. Top. Appl. Earth Obs. Remote Sens. 2022, 15, 4094–4103. [Google Scholar] [CrossRef]
- Liu, Y.; Chen, D.; Ma, A.; Zhong, Y.; Fang, F.; Xu, K. Multiscale U-Shaped CNN Building Instance Extraction Framework With Edge Constraint for High-Spatial-Resolution Remote Sensing Imagery. IEEE Trans. Geosci. Remote Sens. 2020, 59, 6106–6120. [Google Scholar] [CrossRef]
- Chen, Z.; Luo, R.; Li, J.; Du, J.; Wang, C. U-Net Based Road Area Guidance for Crosswalks Detection from Remote Sensing Images. Can. J. Remote Sens. 2021, 47, 83–99. [Google Scholar] [CrossRef]
- Yu, M.; Chen, X.; Zhang, W.; Liu, Y. AGs-Unet: Building Extraction Model for High Resolution Remote Sensing Images Based on Attention Gates U Network. Sensors 2022, 22, 2932. [Google Scholar] [CrossRef] [PubMed]
- Lin, C.; Guo, S.; Chen, J.; Sun, L.; Zheng, X.; Yang, Y.; Xiong, Y. Deep Learning Network Intensification for Preventing Noisy-Labeled Samples for Remote Sensing Classification. Remote Sens. 2021, 13, 1689. [Google Scholar] [CrossRef]
- Liu, R.; Tao, F.; Liu, X.; Na, J.; Leng, H.; Wu, J.; Zhou, T. RAANet: A Residual ASPP with Attention Framework for Semantic Segmentation of High-Resolution Remote Sensing Images. Remote Sens. 2022, 14, 3109. [Google Scholar] [CrossRef]
- Zhou, C.; He, X.; Wu, R.; Zhang, G. Using Food Delivery Data to Identify Urban -Rural Areas: A Case Study of Guangzhou, China. Front. Earth Sci. 2022, 10, 860361. [Google Scholar] [CrossRef]
- He, X.; Cao, Y.; Zhou, C. Evaluation of Polycentric Spatial Structure in the Urban Agglomeration of the Pearl River Delta (PRD) Based on Multi-Source Big Data Fusion. Remote Sens. 2021, 13, 3639. [Google Scholar] [CrossRef]
- Frolking, S.; Milliman, T.; Seto, K.C.; Friedl, M.A. A global fingerprint of macro-scale changes in urban structure from 1999 to 2009. Environ. Res. Lett. 2013, 8, 024004. [Google Scholar] [CrossRef]
- Kuang, W. Mapping global impervious surface area and green space within urban environments. Sci. China Earth Sci. 2019, 62, 1591–1606. [Google Scholar] [CrossRef]
- Li, L.; Zha, Y. Satellite-Based Spatiotemporal Trends of Canopy Urban Heat Islands and Associated Drivers in China’s 32 Major Cities. Remote Sens. 2019, 11, 102. [Google Scholar] [CrossRef]
- Wang, Y.; Shen, Z. Comparing Luojia 1-01 and VIIRS Nighttime Light Data in Detecting Urban Spatial Structure Using a Threshold-Based Kernel Density Estimation. Remote Sens. 2021, 13, 1574. [Google Scholar] [CrossRef]
- Zhai, W.; Han, B.; Cheng, C. Evaluation of Luojia 1–01 Nighttime Light Imagery for Built-Up Urban Area Extraction: A Case Study of 16 Cities in China. IEEE Geosci. Remote Sens. Lett. 2019, 17, 1802–1806. [Google Scholar] [CrossRef]
- Yu, B.; Tang, M.; Wu, Q.; Yang, C.; Deng, S.; Shi, K.; Peng, C.; Wu, J.; Chen, Z. Urban Built-Up Area Extraction From Log-Transformed NPP-VIIRS Nighttime Light Composite Data. IEEE Geosci. Remote Sens. Lett. 2018, 15, 1279–1283. [Google Scholar] [CrossRef]
- Chang, D.; Wang, Q.; Xie, J.; Yang, J.; Xu, W. Research on the Extraction Method of Urban Built-Up Areas With an Improved Night Light Index. IEEE Geosci. Remote Sens. Lett. 2022, 19, 1–5. [Google Scholar] [CrossRef]
- Wang, M.; Song, Y.; Wang, F.; Meng, Z. Boundary Extraction of Urban Built-Up Area Based on Luminance Value Correction of NTL Image. IEEE J. Sel. Top. Appl. Earth Obs. Remote Sens. 2021, 14, 7466–7477. [Google Scholar] [CrossRef]
- Wang, R.; Min, J.; Li, Y.; Hu, Y.; Yang, S. Analysis on Seasonal Variation and Influencing Mechanism of Land Surface Thermal Environment: A Case Study of Chongqing. Remote Sens. 2022, 14, 2022. [Google Scholar] [CrossRef]
- Singh, P.P.; Garg, R. A two-stage framework for road extraction from high-resolution satellite images by using prominent features of impervious surfaces. Int. J. Remote Sens. 2014, 35, 8074–8107. [Google Scholar] [CrossRef]
- Wieland, M.; Pittore, M. Large-area settlement pattern recognition from Landsat-8 data. ISPRS J. Photogramm. Remote Sens. 2016, 119, 294–308. [Google Scholar] [CrossRef]
- Luo, X.; Tong, X.; Pan, H. Integrating Multiresolution and Multitemporal Sentinel-2 Imagery for Land-Cover Mapping in the Xiongan New Area, China. IEEE Trans. Geosci. Remote Sens. 2020, 59, 1029–1040. [Google Scholar] [CrossRef]
- Zhong, C.; Li, H.; Huang, X. A fast and effective approach to generate true orthophoto in built-up area. Sens. Rev. 2011, 31, 341–348. [Google Scholar] [CrossRef]
- Qiu, C.; Schmitt, M.; Geiß, C.; Chen, T.-H.K.; Zhu, X.X. A framework for large-scale mapping of human settlement extent from Sentinel-2 images via fully convolutional neural networks. ISPRS J. Photogramm. Remote Sens. 2020, 163, 152–170. [Google Scholar] [CrossRef]
- Shakeel, A.; Sultani, W.; Ali, M. Deep built-structure counting in satellite imagery using attention based re-weighting. ISPRS J. Photogramm. Remote Sens. 2019, 151, 313–321. [Google Scholar] [CrossRef]


| Data | Spatial Resolution | Data Sources | Access Time |
|---|---|---|---|
| Landsat7, Landsat8 | 30 m, 60 m | http://www.gscloud.cn/ | 1 May 2022 |
| DMSP/OLS, NPP/VIIRS | 1000 m, 500 m | https://eogdata.mines.edu/products/vnl/ | 1 May 2022 |
| Amap | - | www.Amap.com | 1 May 2022 |
| Kunming | Year | 2012 | 2013 | 2014 | 2015 | 2016 |
| Aera (km2) | 298.12 | 397.23 | 407.16 | 409.39 | 436.44 | |
| Year | 2017 | 2018 | 2019 | 2020 | 2021 | |
| Aera (km2) | 438.31 | 441.92 | 446.46 | 483.22 | 548.47 | |
| Yuxi | Year | 2012 | 2013 | 2014 | 2015 | 2016 |
| Aera (km2) | 24.11 | 24.56 | 33.57 | 37.14 | 38.12 | |
| Year | 2017 | 2018 | 2019 | 2020 | 2021 | |
| Aera (km2) | 38.47 | 38.69 | 39.25 | 42.19 | 46.2 |
| Kunming | Year | 2012 | 2013 | 2014 | 2015 | 2016 | 2017 | 2018 | 2019 | 2020 | 2021 |
| POI Number | 249,074 | 269,403 | 273,304 | 290,321 | 384,466 | 468,202 | 485,942 | 498,341 | 500,217 | 508,944 | |
| Yuxi | Year | 2012 | 2013 | 2014 | 2015 | 2016 | 2017 | 2018 | 2019 | 2020 | 2021 |
| POI Number | 163,089 | 170,372 | 177,635 | 183,897 | 194,482 | 308,719 | 347,648 | 367,741 | 369,013 | 374,538 |
| NTL | 2012 | 2013 | 2014 | 2015 | 2016 | |||||
| F1 | Accuracy | F1 | Accuracy | F1 | Accuracy | F1 | Accuracy | F1 | Accuracy | |
| 0.7233 | 88.02% | 0.7245 | 87.98% | 0.7331 | 88.19% | 0.7318 | 88.67% | 0.7238 | 88.45% | |
| 2017 | 2018 | 2019 | 2020 | 2021 | ||||||
| F1 | Accuracy | F1 | Accuracy | F1 | Accuracy | F1 | Accuracy | F1 | Accuracy | |
| 0.7401 | 88.89% | 0.7307 | 89.02% | 0.7297 | 89.31% | 0.7301 | 86.22% | 0.7406 | 85.89% | |
| POI_NTL | 2012 | 2013 | 2014 | 2015 | 2016 | |||||
| F1 | Accuracy | F1 | Accuracy | F1 | Accuracy | F1 | Accuracy | F1 | Accuracy | |
| 0.7891 | 91.78% | 0.7862 | 92.24% | 0.7902 | 92.13% | 0.7845 | 92.10% | 0.7913 | 92.18% | |
| 2017 | 2018 | 2019 | 2020 | 2021 | ||||||
| F1 | Accuracy | F1 | Accuracy | F1 | Accuracy | F1 | Accuracy | F1 | Accuracy | |
| 0.8502 | 95.01% | 0.8471 | 94.49% | 0.8549 | 95.31% | 0.8122 | 93.22% | 0.8204 | 93.18% | |
Publisher’s Note: MDPI stays neutral with regard to jurisdictional claims in published maps and institutional affiliations. |
© 2022 by the authors. Licensee MDPI, Basel, Switzerland. This article is an open access article distributed under the terms and conditions of the Creative Commons Attribution (CC BY) license (https://creativecommons.org/licenses/by/4.0/).
Share and Cite
Zhang, J.; Zhang, X.; Tan, X.; Yuan, X. A New Approach to Monitoring Urban Built-Up Areas in Kunming and Yuxi from 2012 to 2021: Promoting Healthy Urban Development and Efficient Governance. Int. J. Environ. Res. Public Health 2022, 19, 12198. https://doi.org/10.3390/ijerph191912198
Zhang J, Zhang X, Tan X, Yuan X. A New Approach to Monitoring Urban Built-Up Areas in Kunming and Yuxi from 2012 to 2021: Promoting Healthy Urban Development and Efficient Governance. International Journal of Environmental Research and Public Health. 2022; 19(19):12198. https://doi.org/10.3390/ijerph191912198
Chicago/Turabian StyleZhang, Jun, Xue Zhang, Xueping Tan, and Xiaodie Yuan. 2022. "A New Approach to Monitoring Urban Built-Up Areas in Kunming and Yuxi from 2012 to 2021: Promoting Healthy Urban Development and Efficient Governance" International Journal of Environmental Research and Public Health 19, no. 19: 12198. https://doi.org/10.3390/ijerph191912198
APA StyleZhang, J., Zhang, X., Tan, X., & Yuan, X. (2022). A New Approach to Monitoring Urban Built-Up Areas in Kunming and Yuxi from 2012 to 2021: Promoting Healthy Urban Development and Efficient Governance. International Journal of Environmental Research and Public Health, 19(19), 12198. https://doi.org/10.3390/ijerph191912198