

Describing the Rehabilitation Workforce Capacity in the Public Sector of Three Rural Provinces in South Africa: A Cross-Sectional Study


Abstract
1. Introduction
2. Materials and Methods
2.1. Study Design
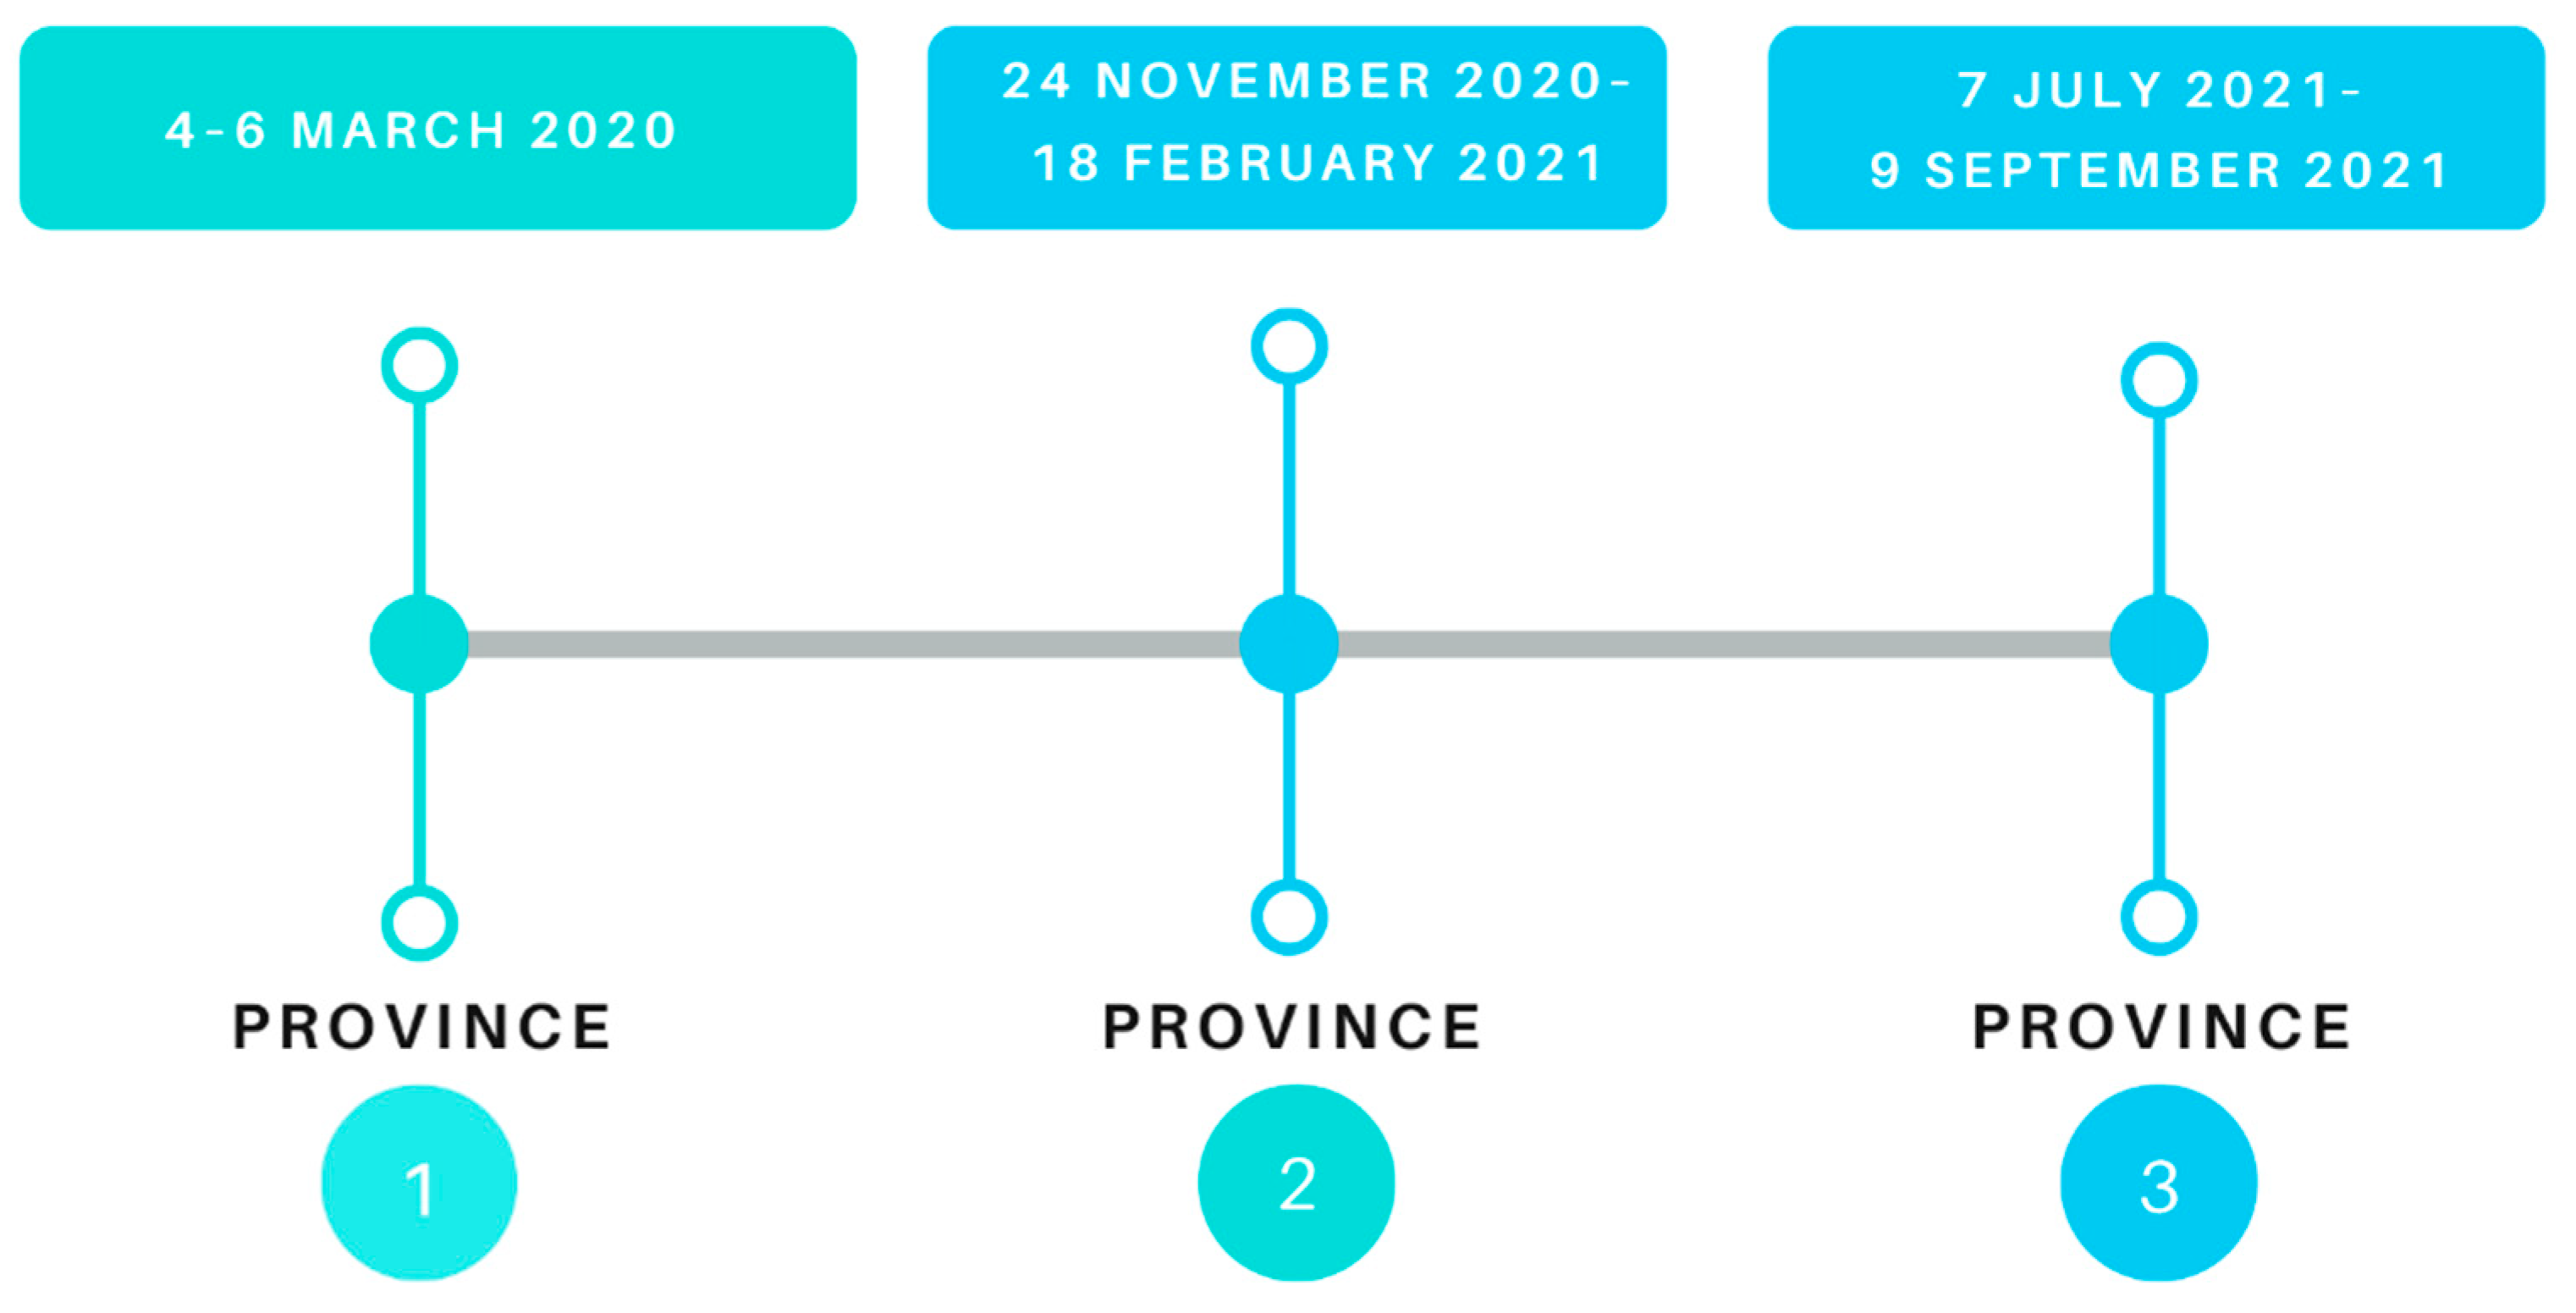
2.2. Setting
2.3. Eligibility Criteria
2.4. Data Collection Procedures
2.4.1. Preparing for Data Collection
2.4.2. Data Collection
Web-Based survey
Telephonic Survey
2.4.3. Data Validation
2.4.4. Data Analysis
3. Results
3.1. Web-Based Therapist Survey
3.1.1. Age
3.1.2. Years at Current Facility
3.1.3. Highest Level of Qualification
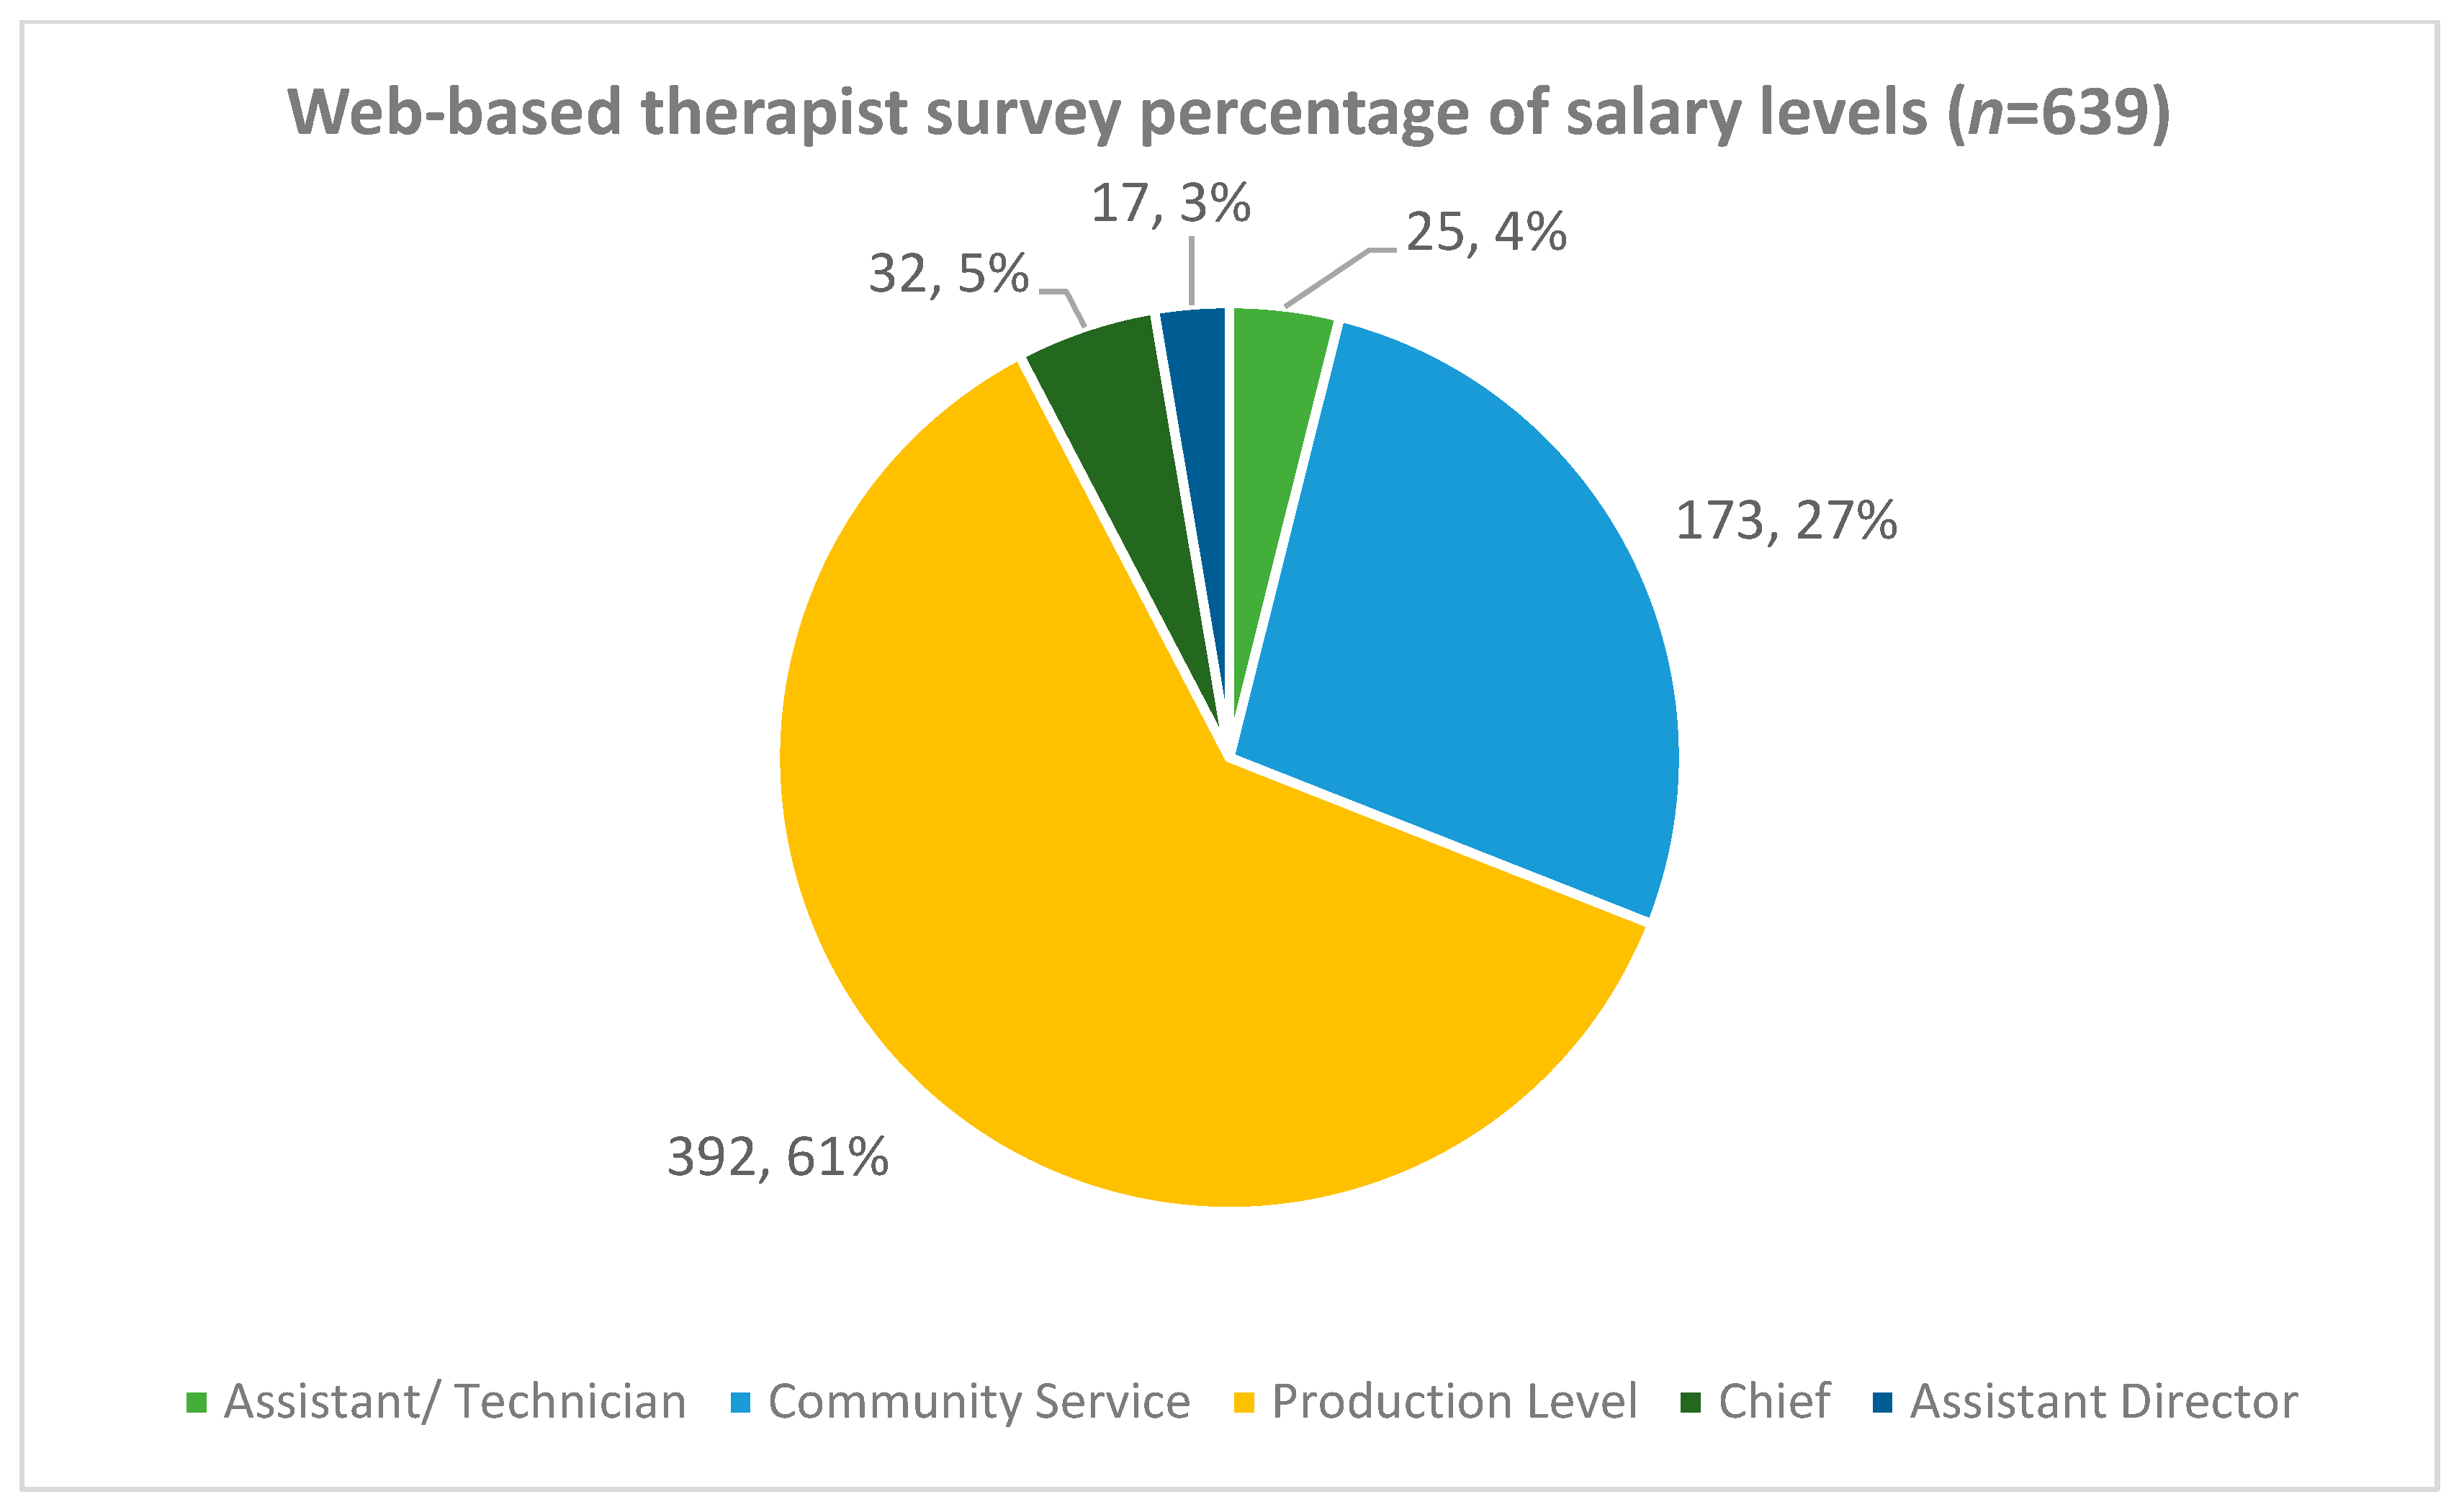
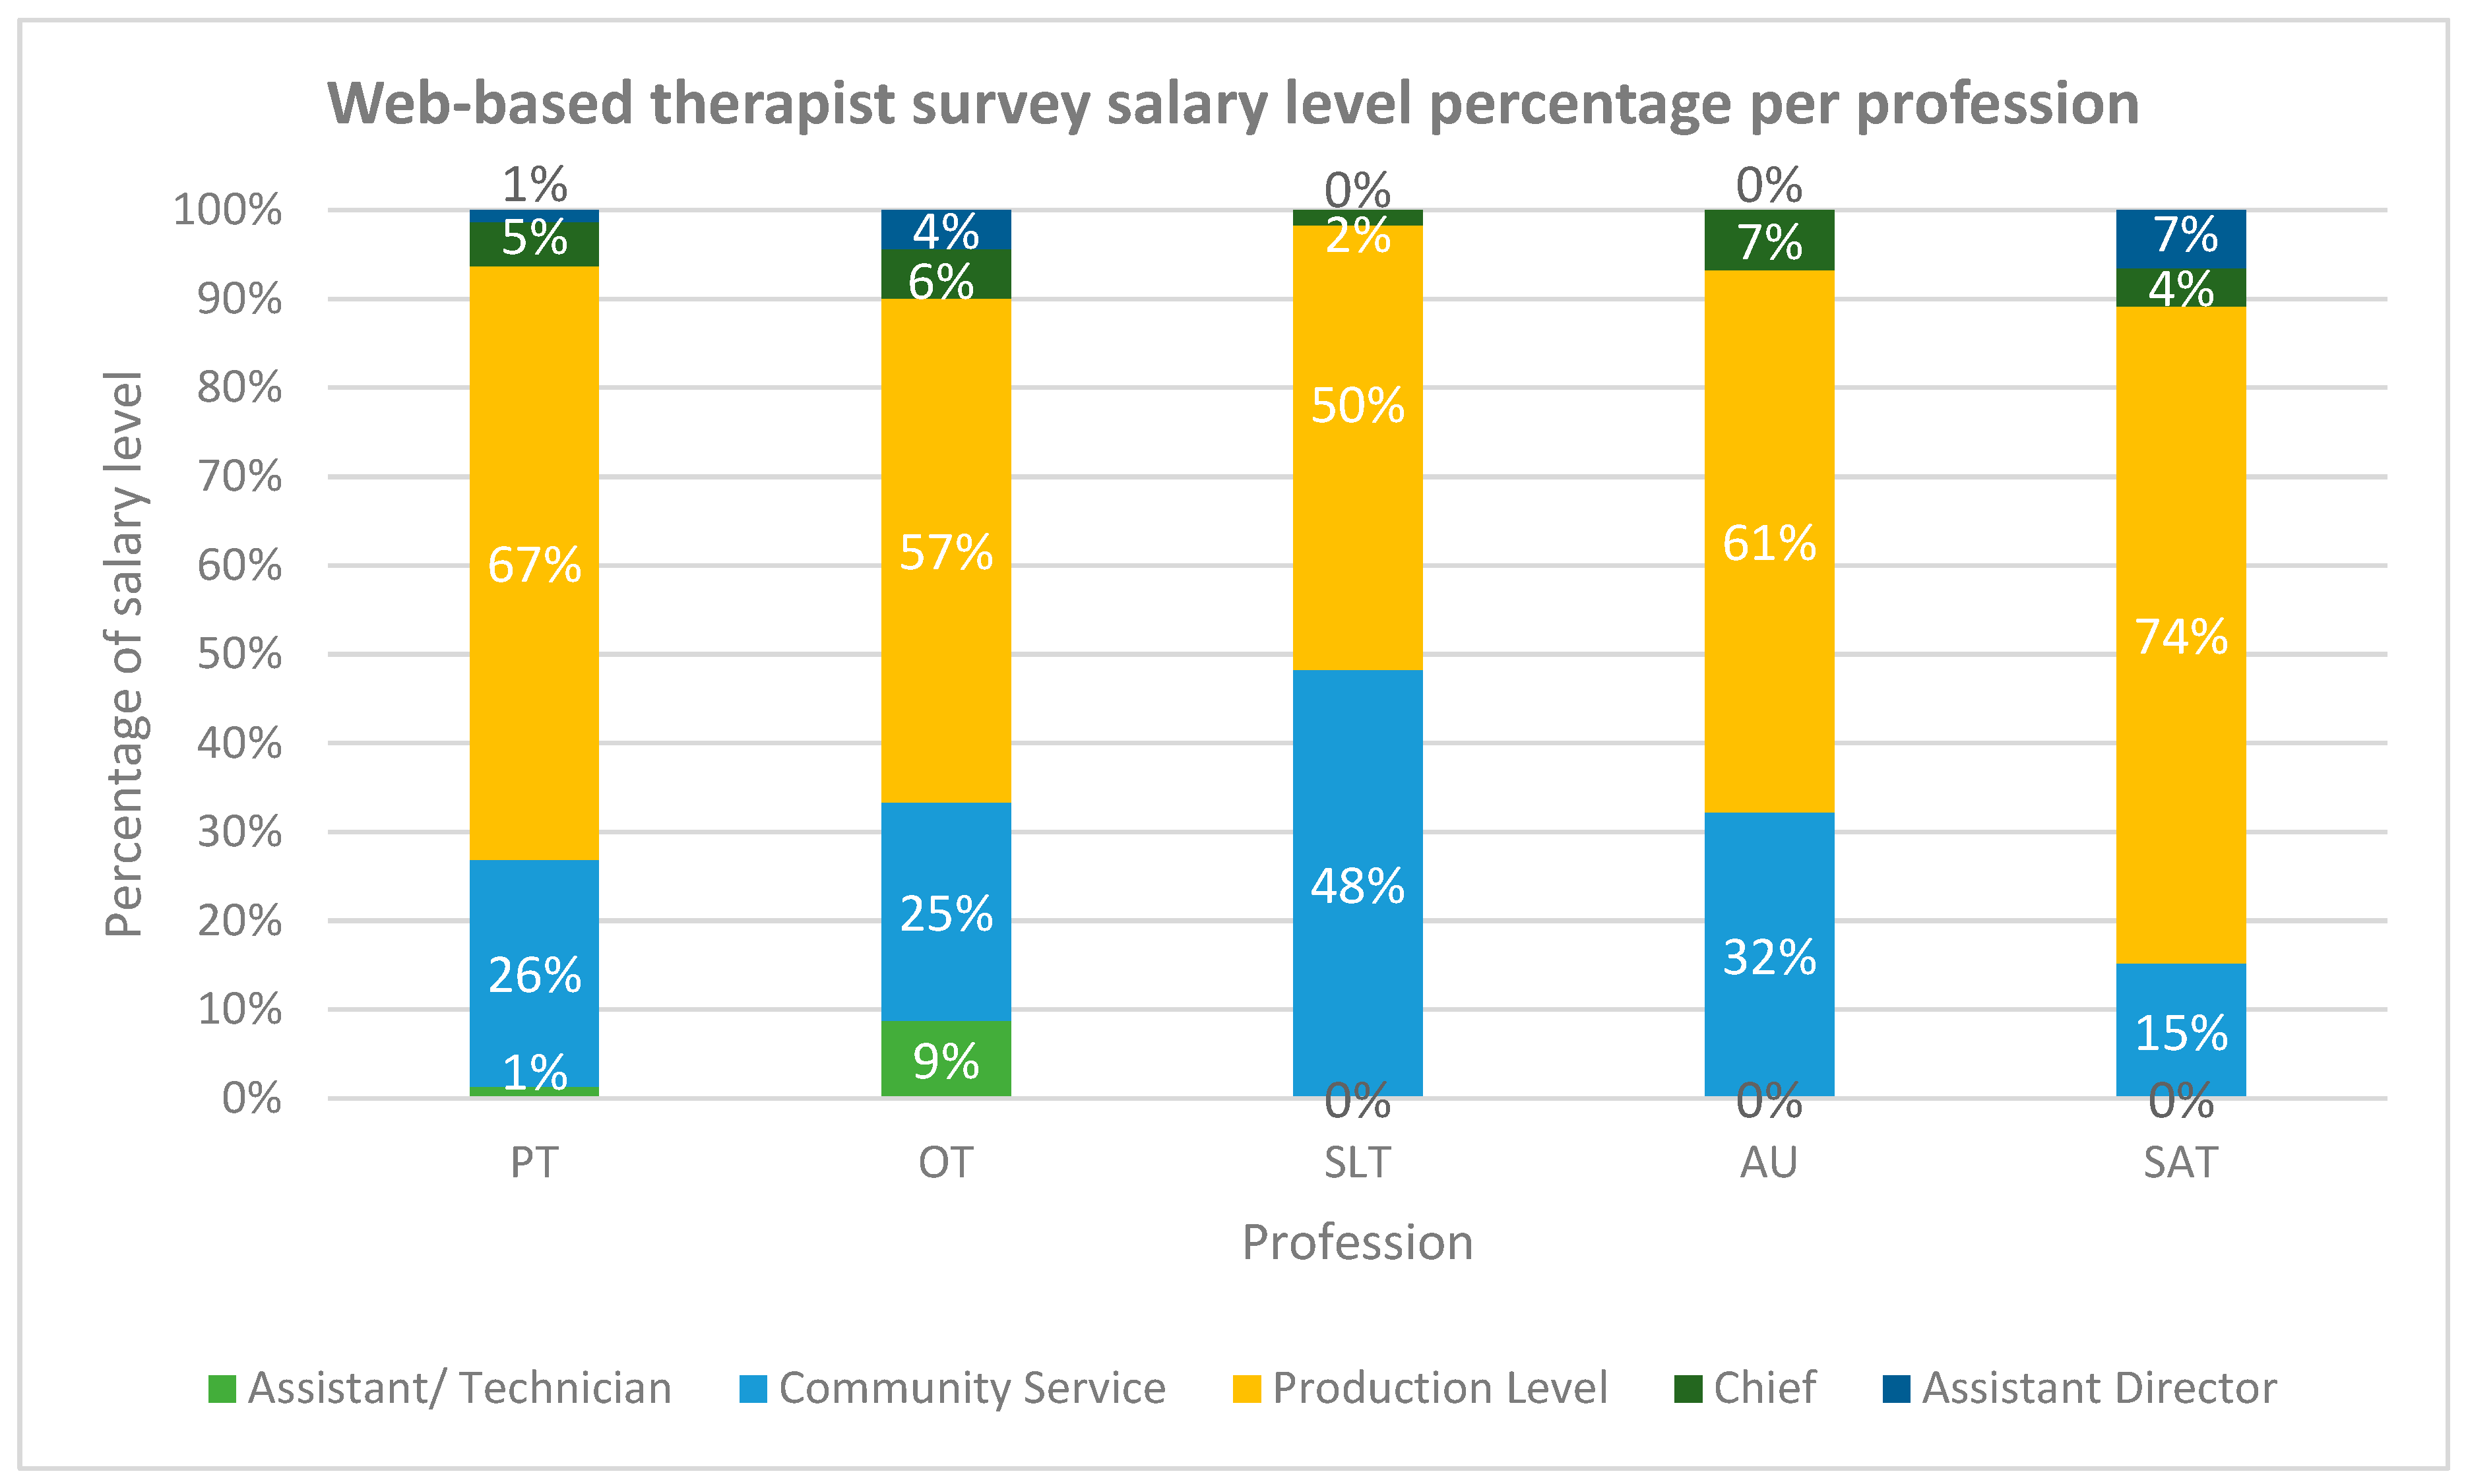
3.1.4. Salary Levels
3.2. Telephonic Facility Survey
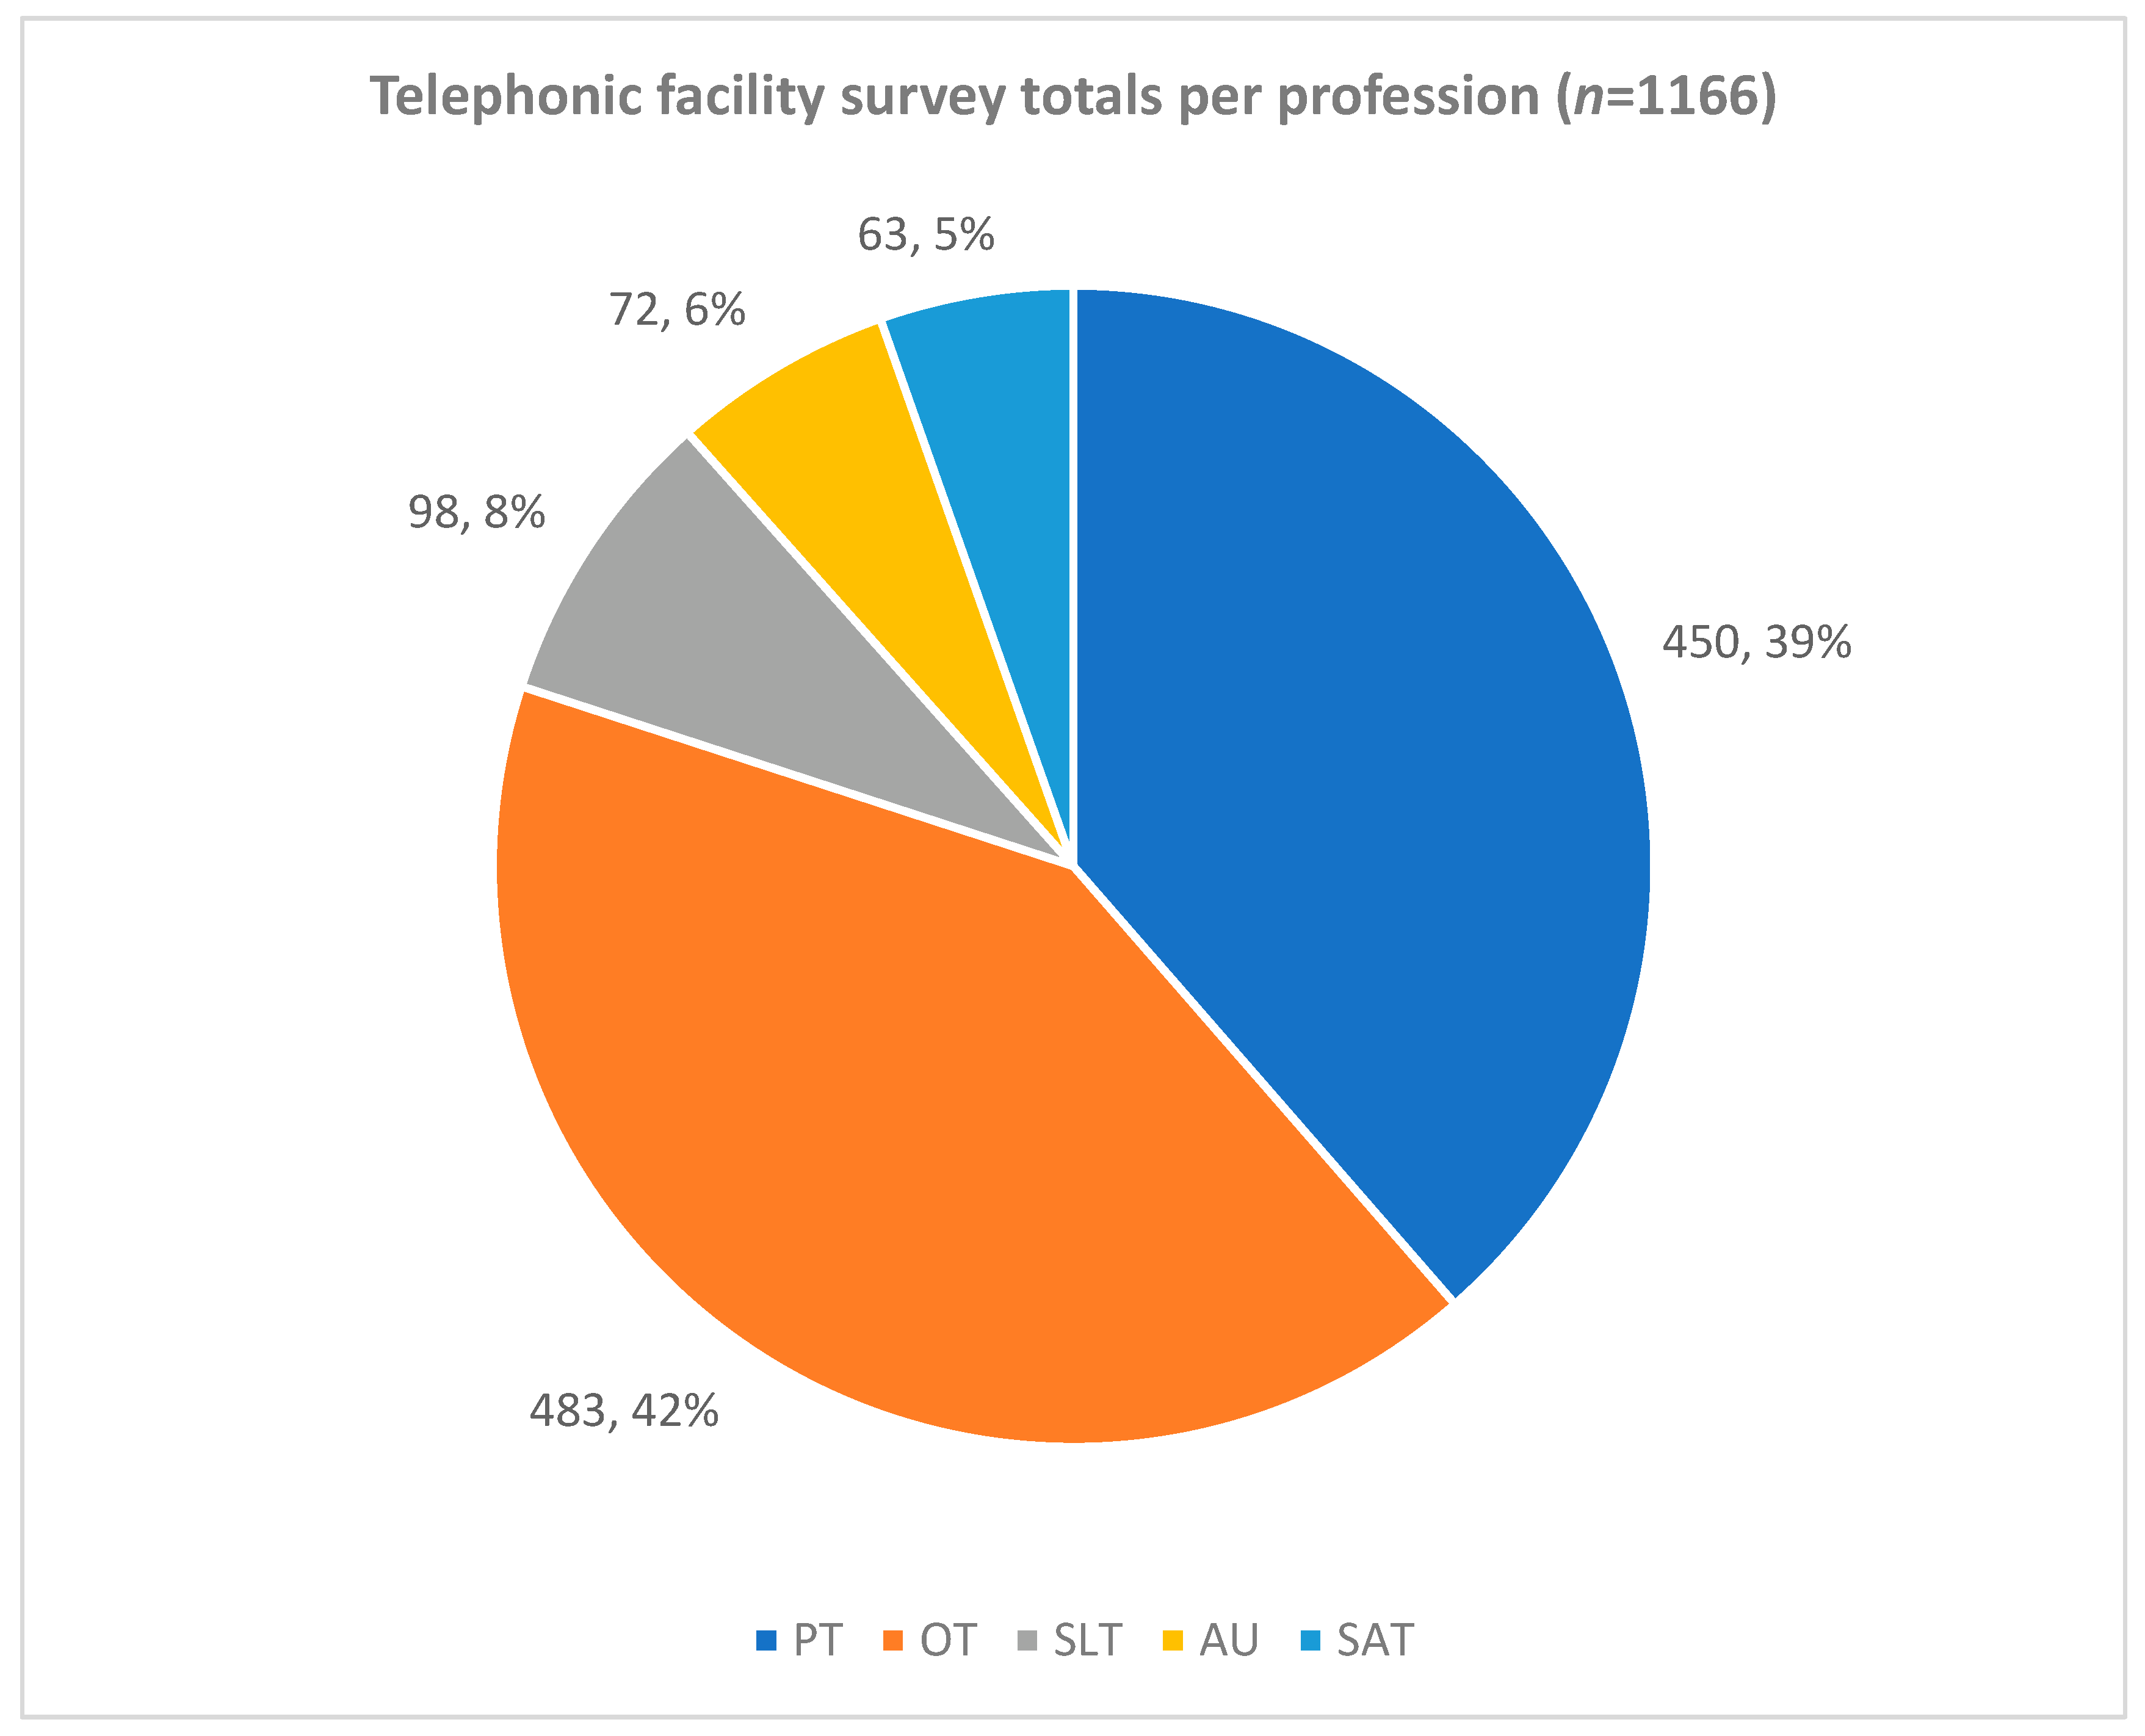
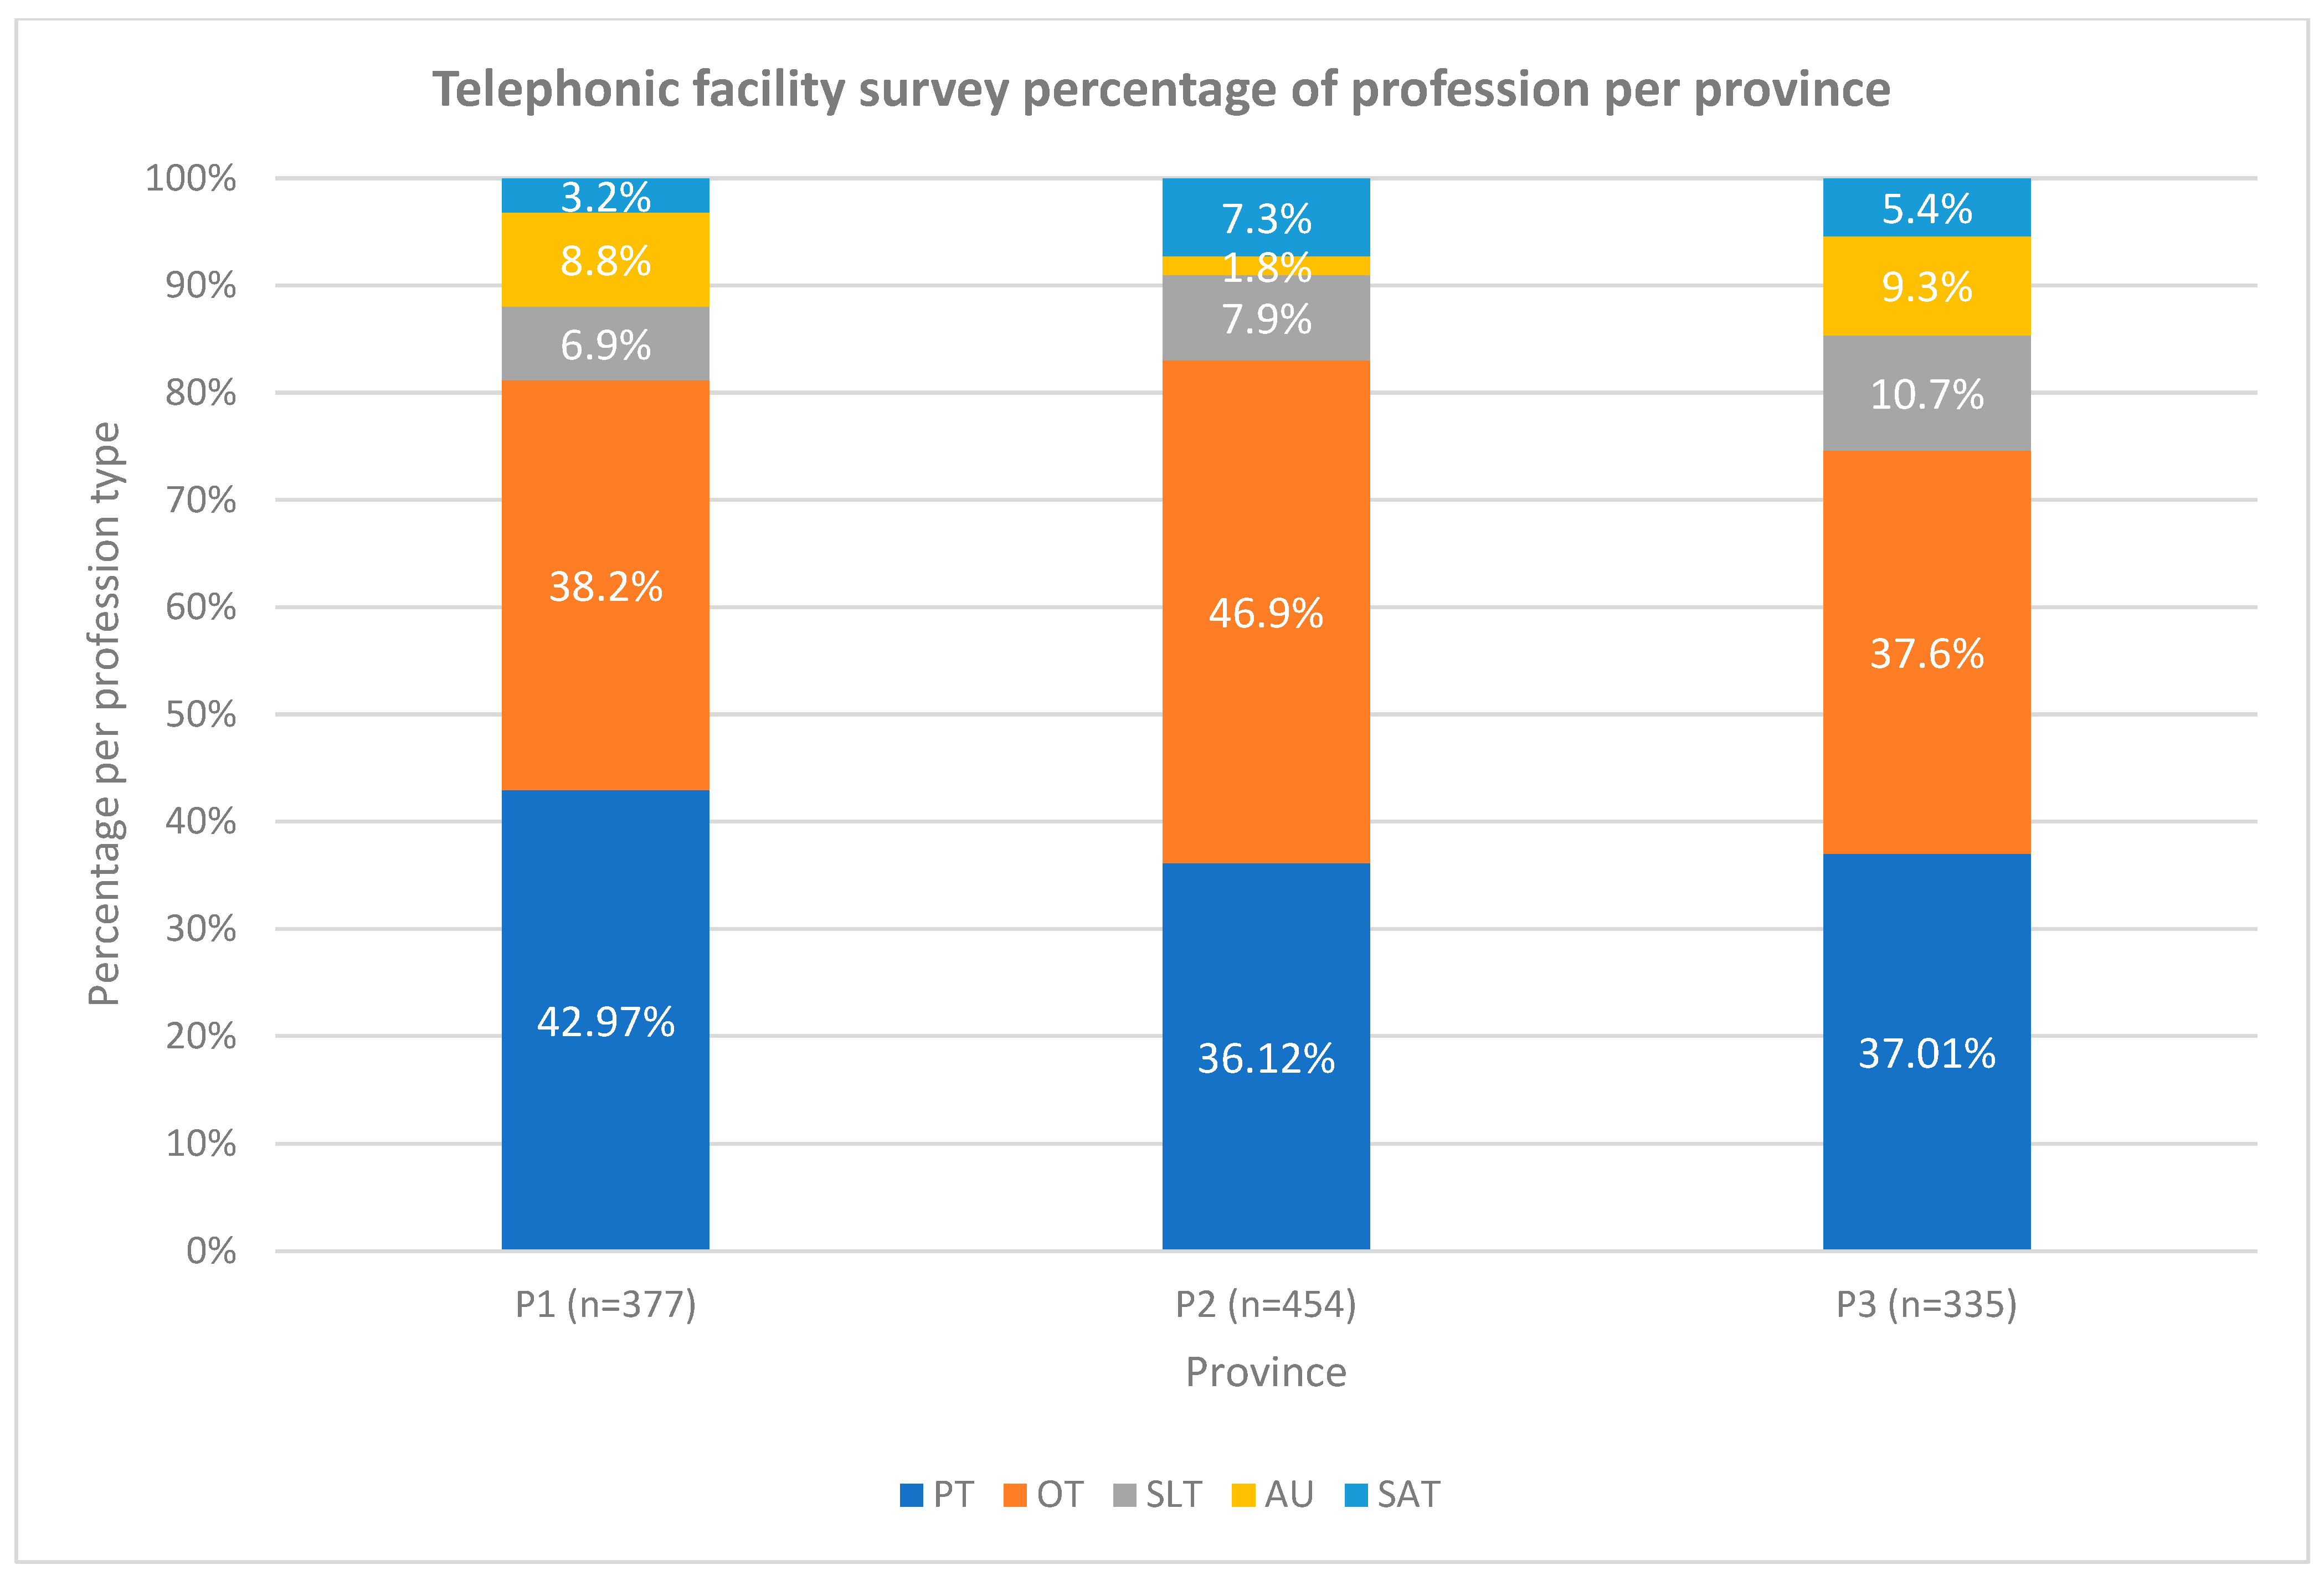
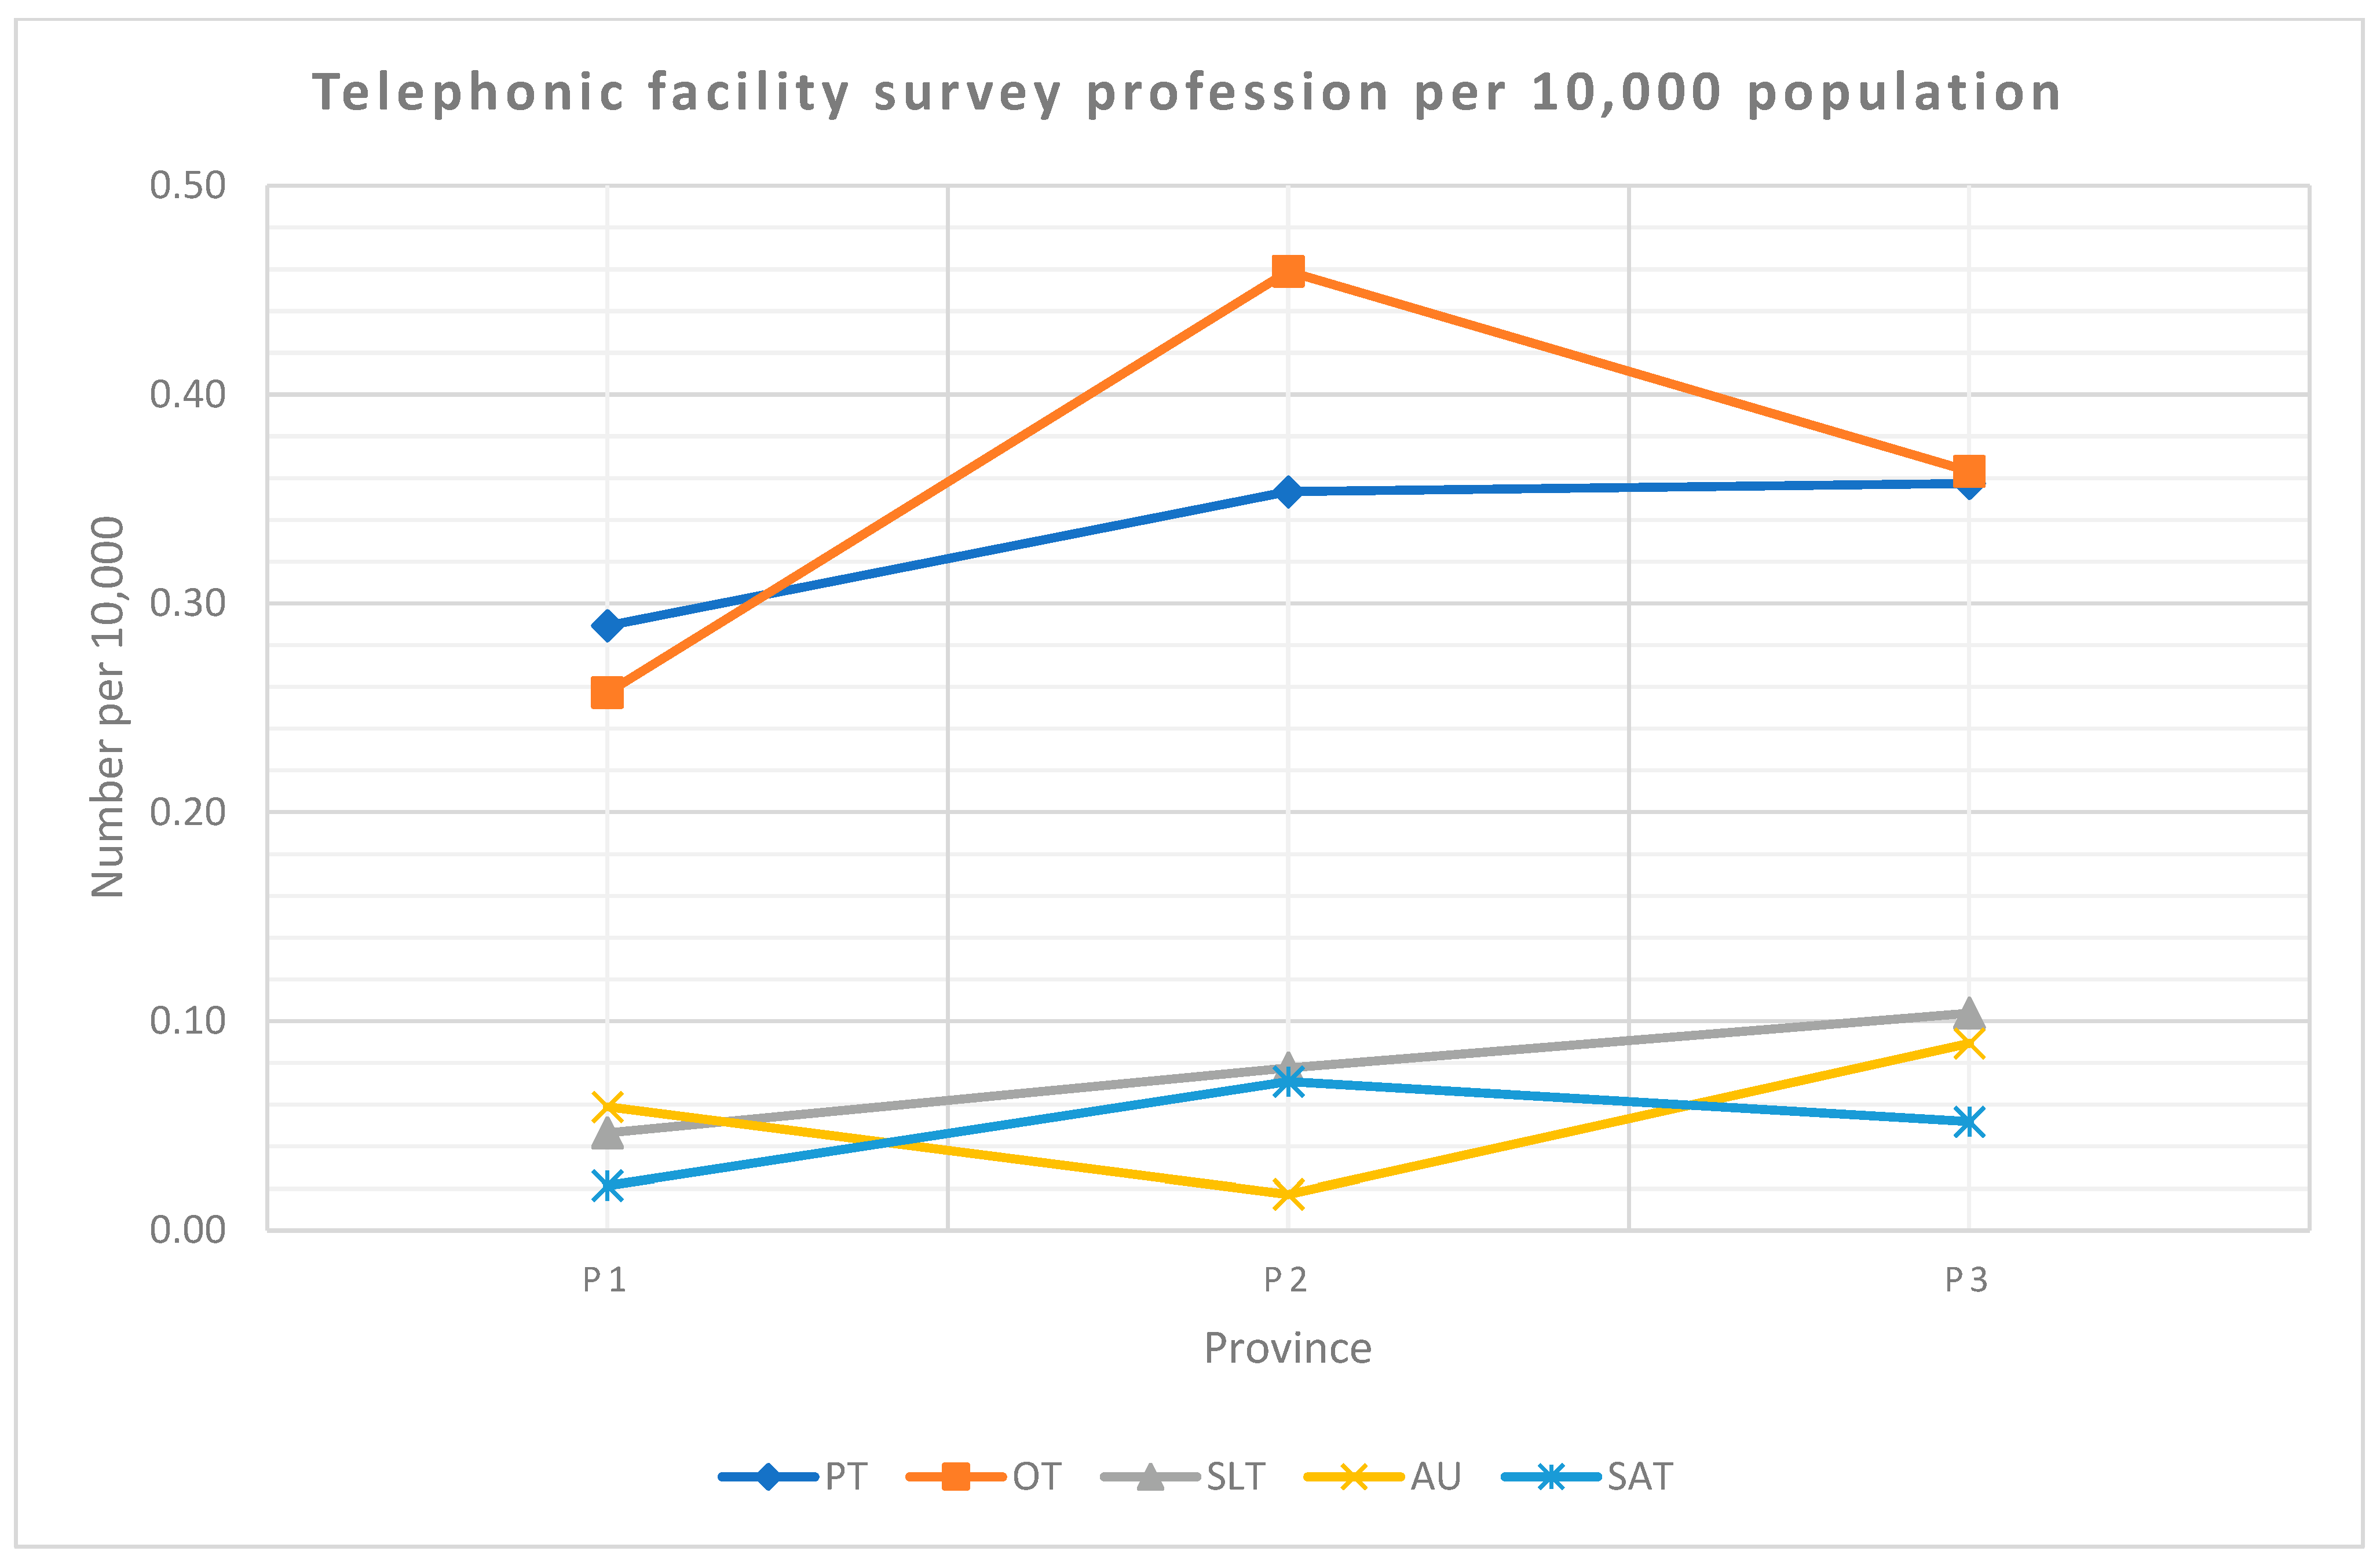
3.2.1. Profession Type
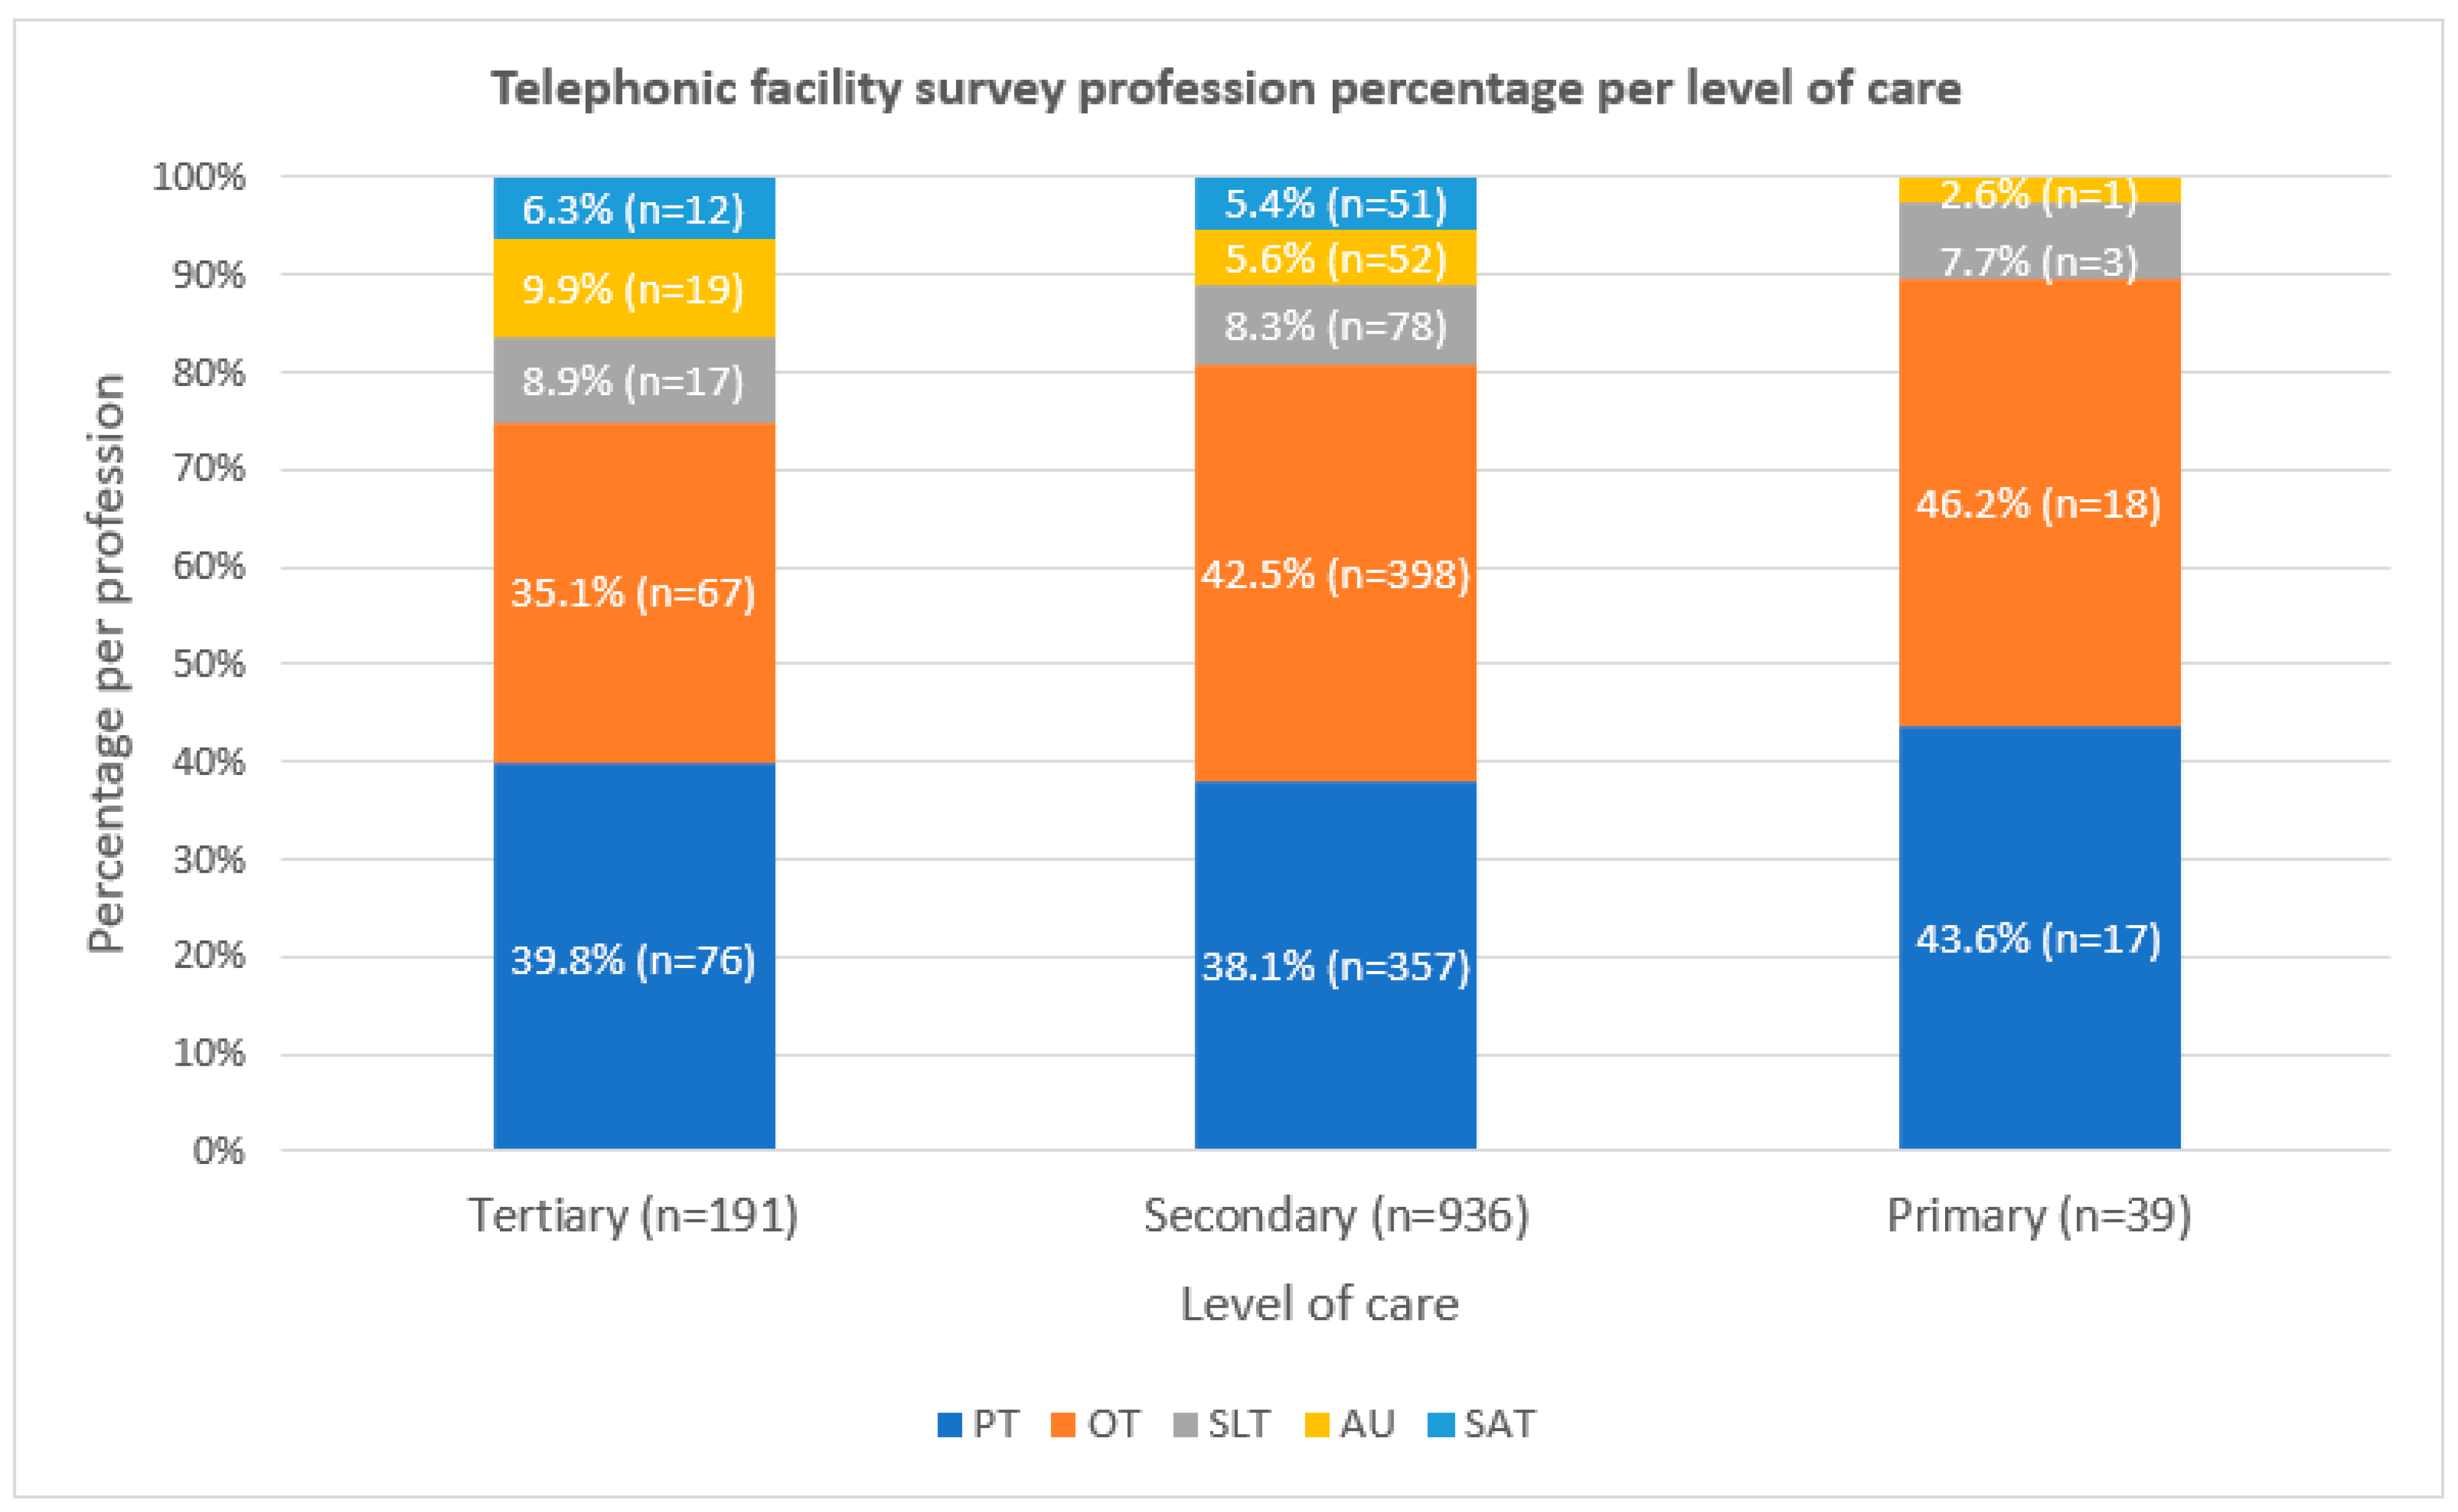
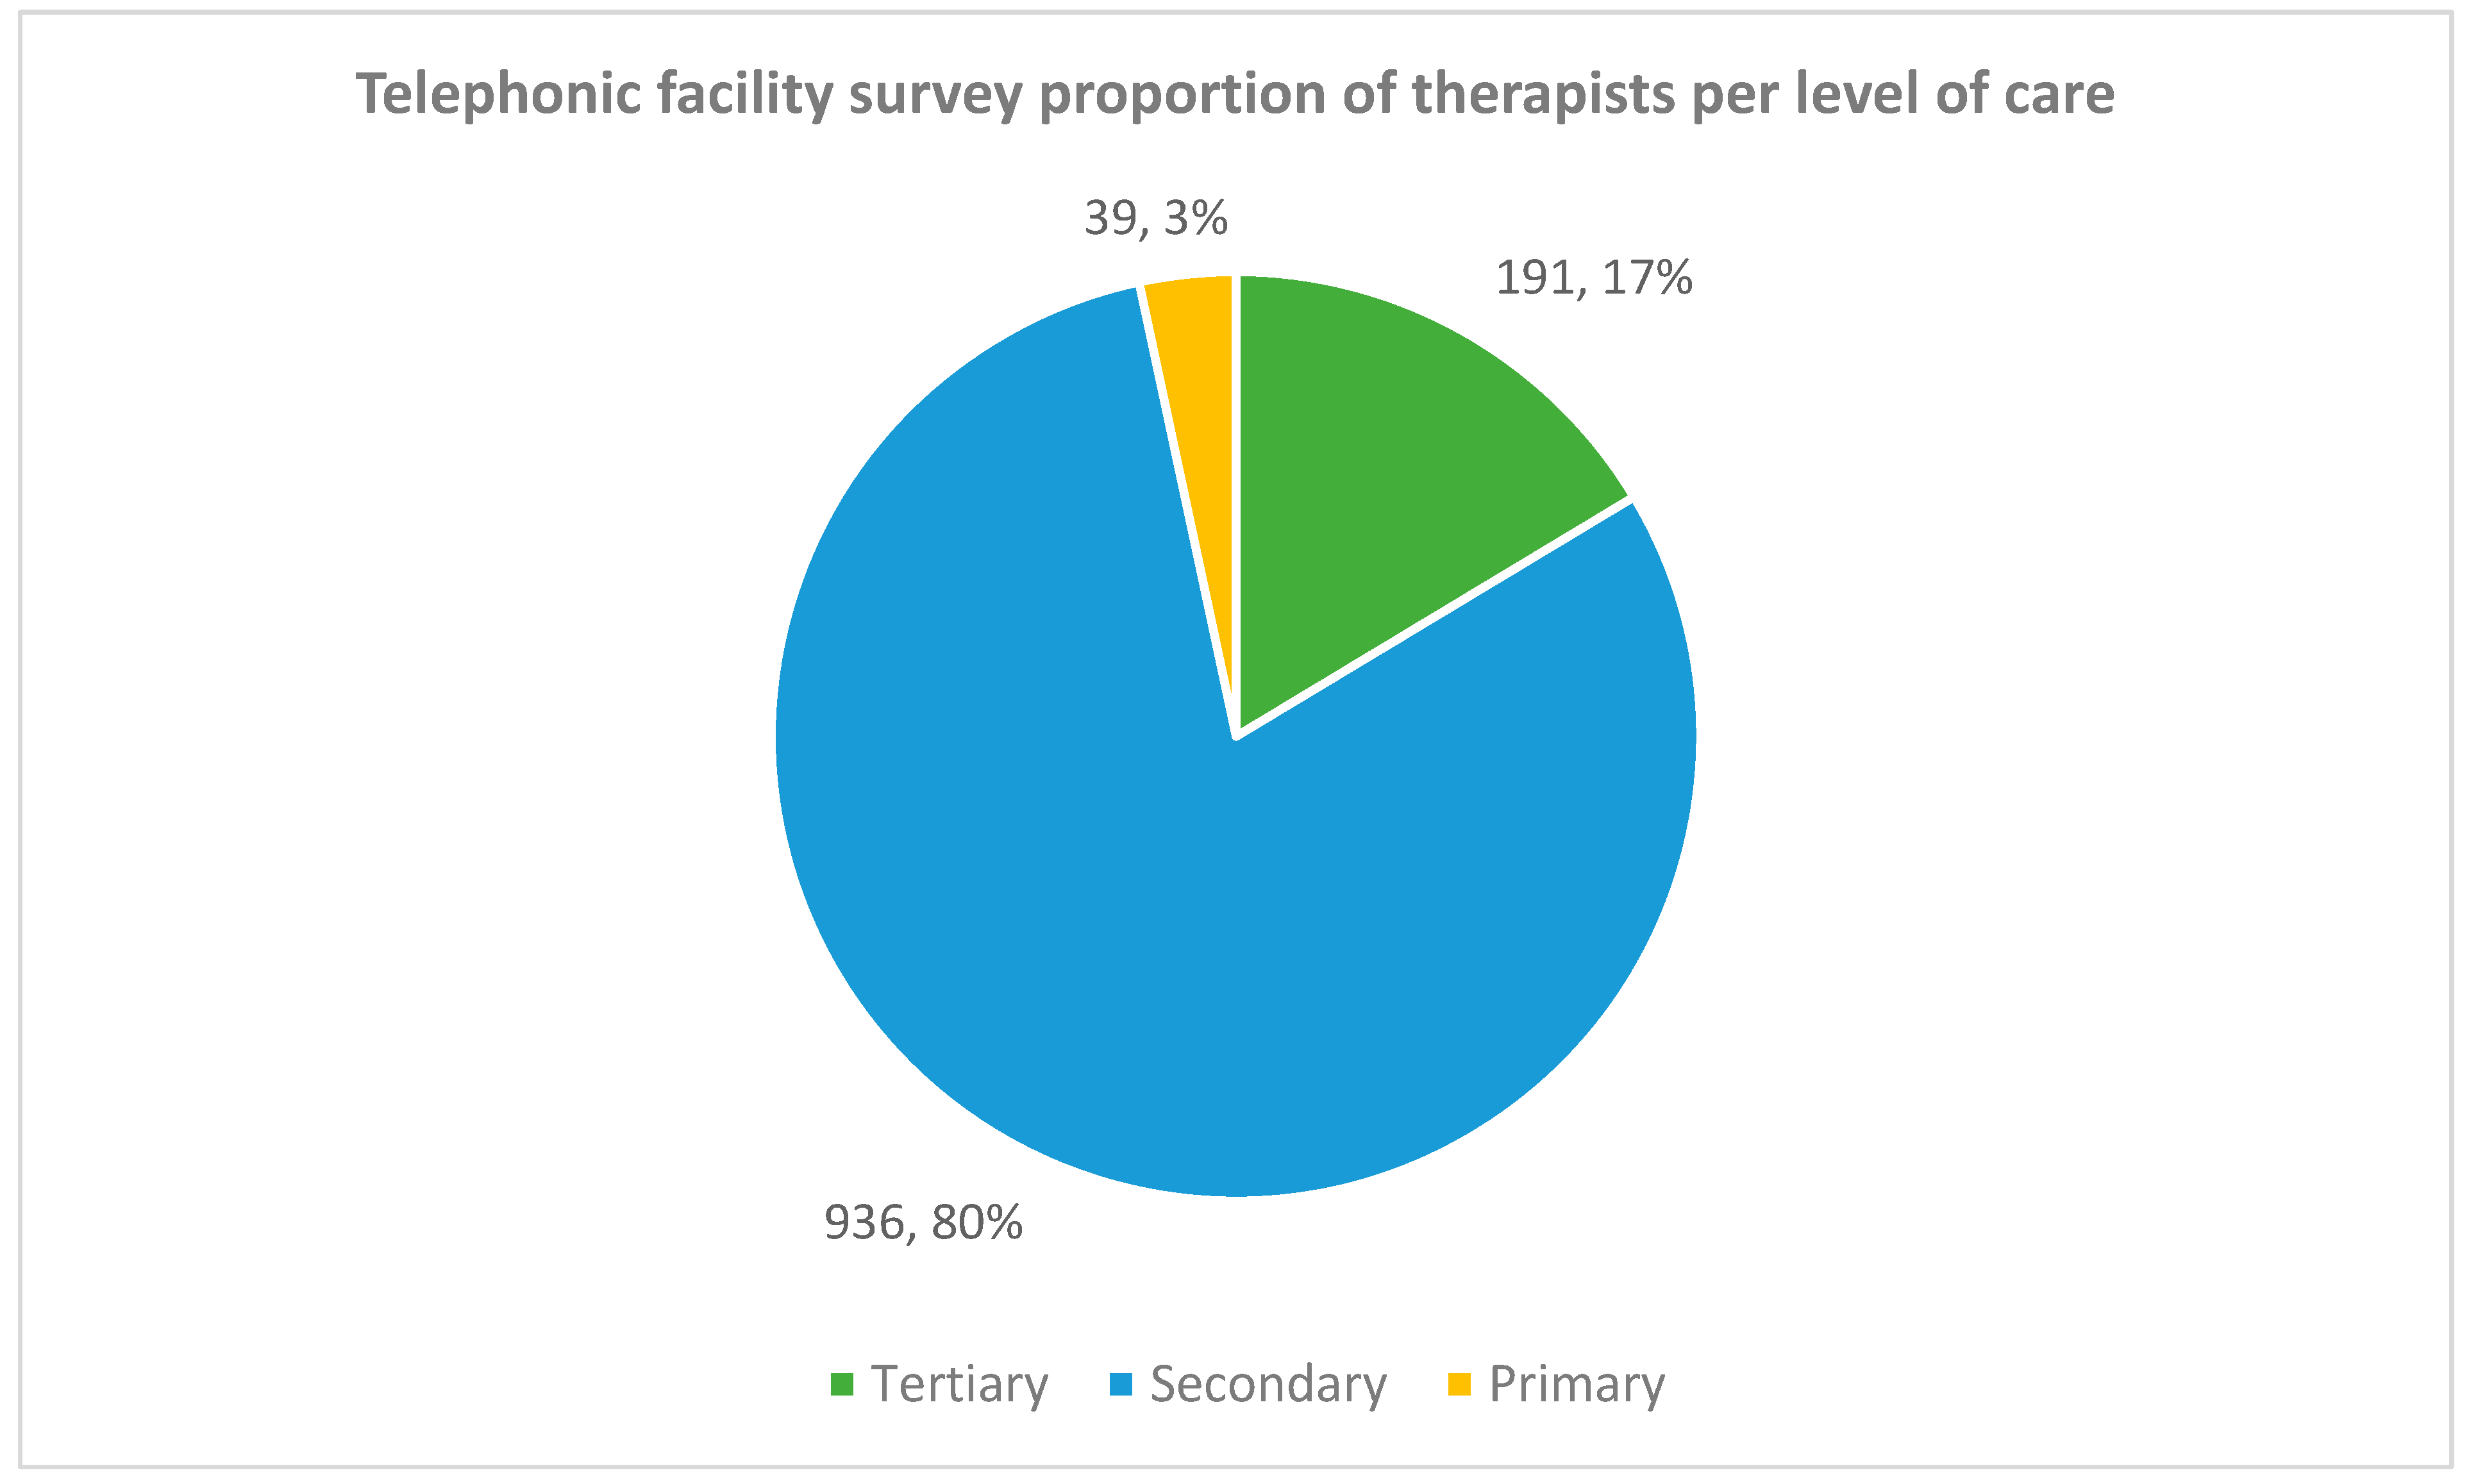
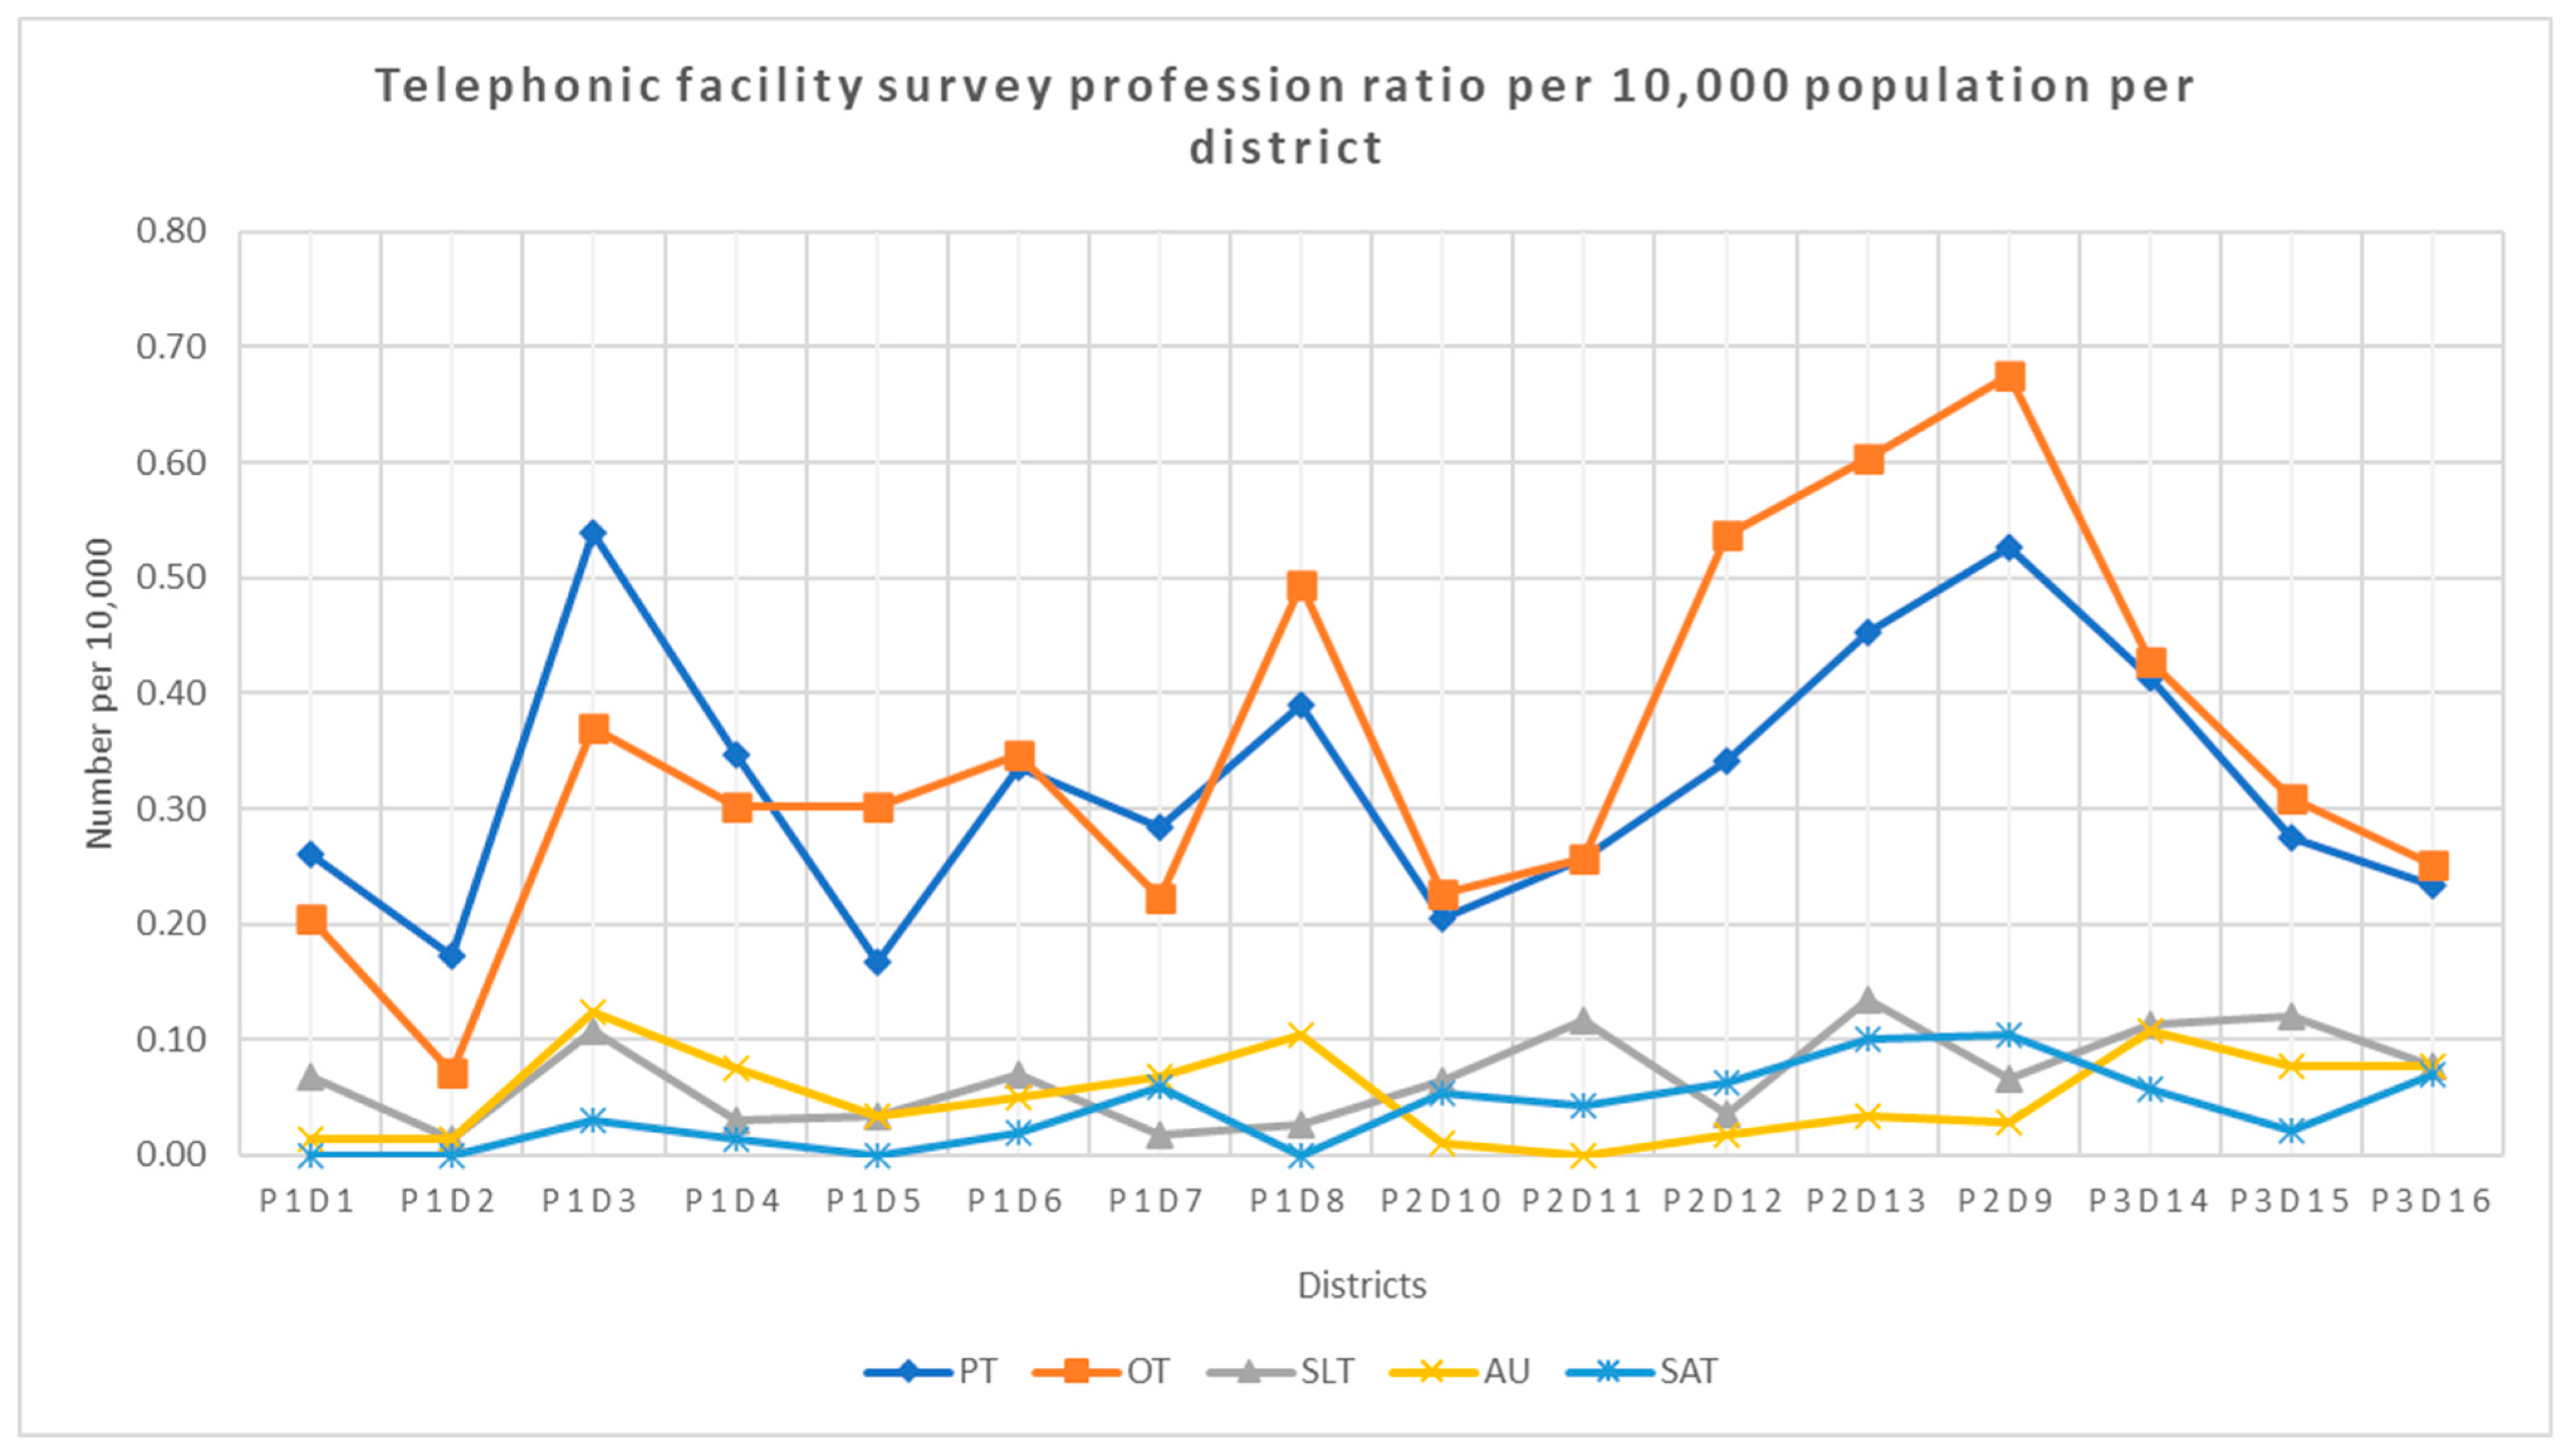
3.2.2. Level of Care
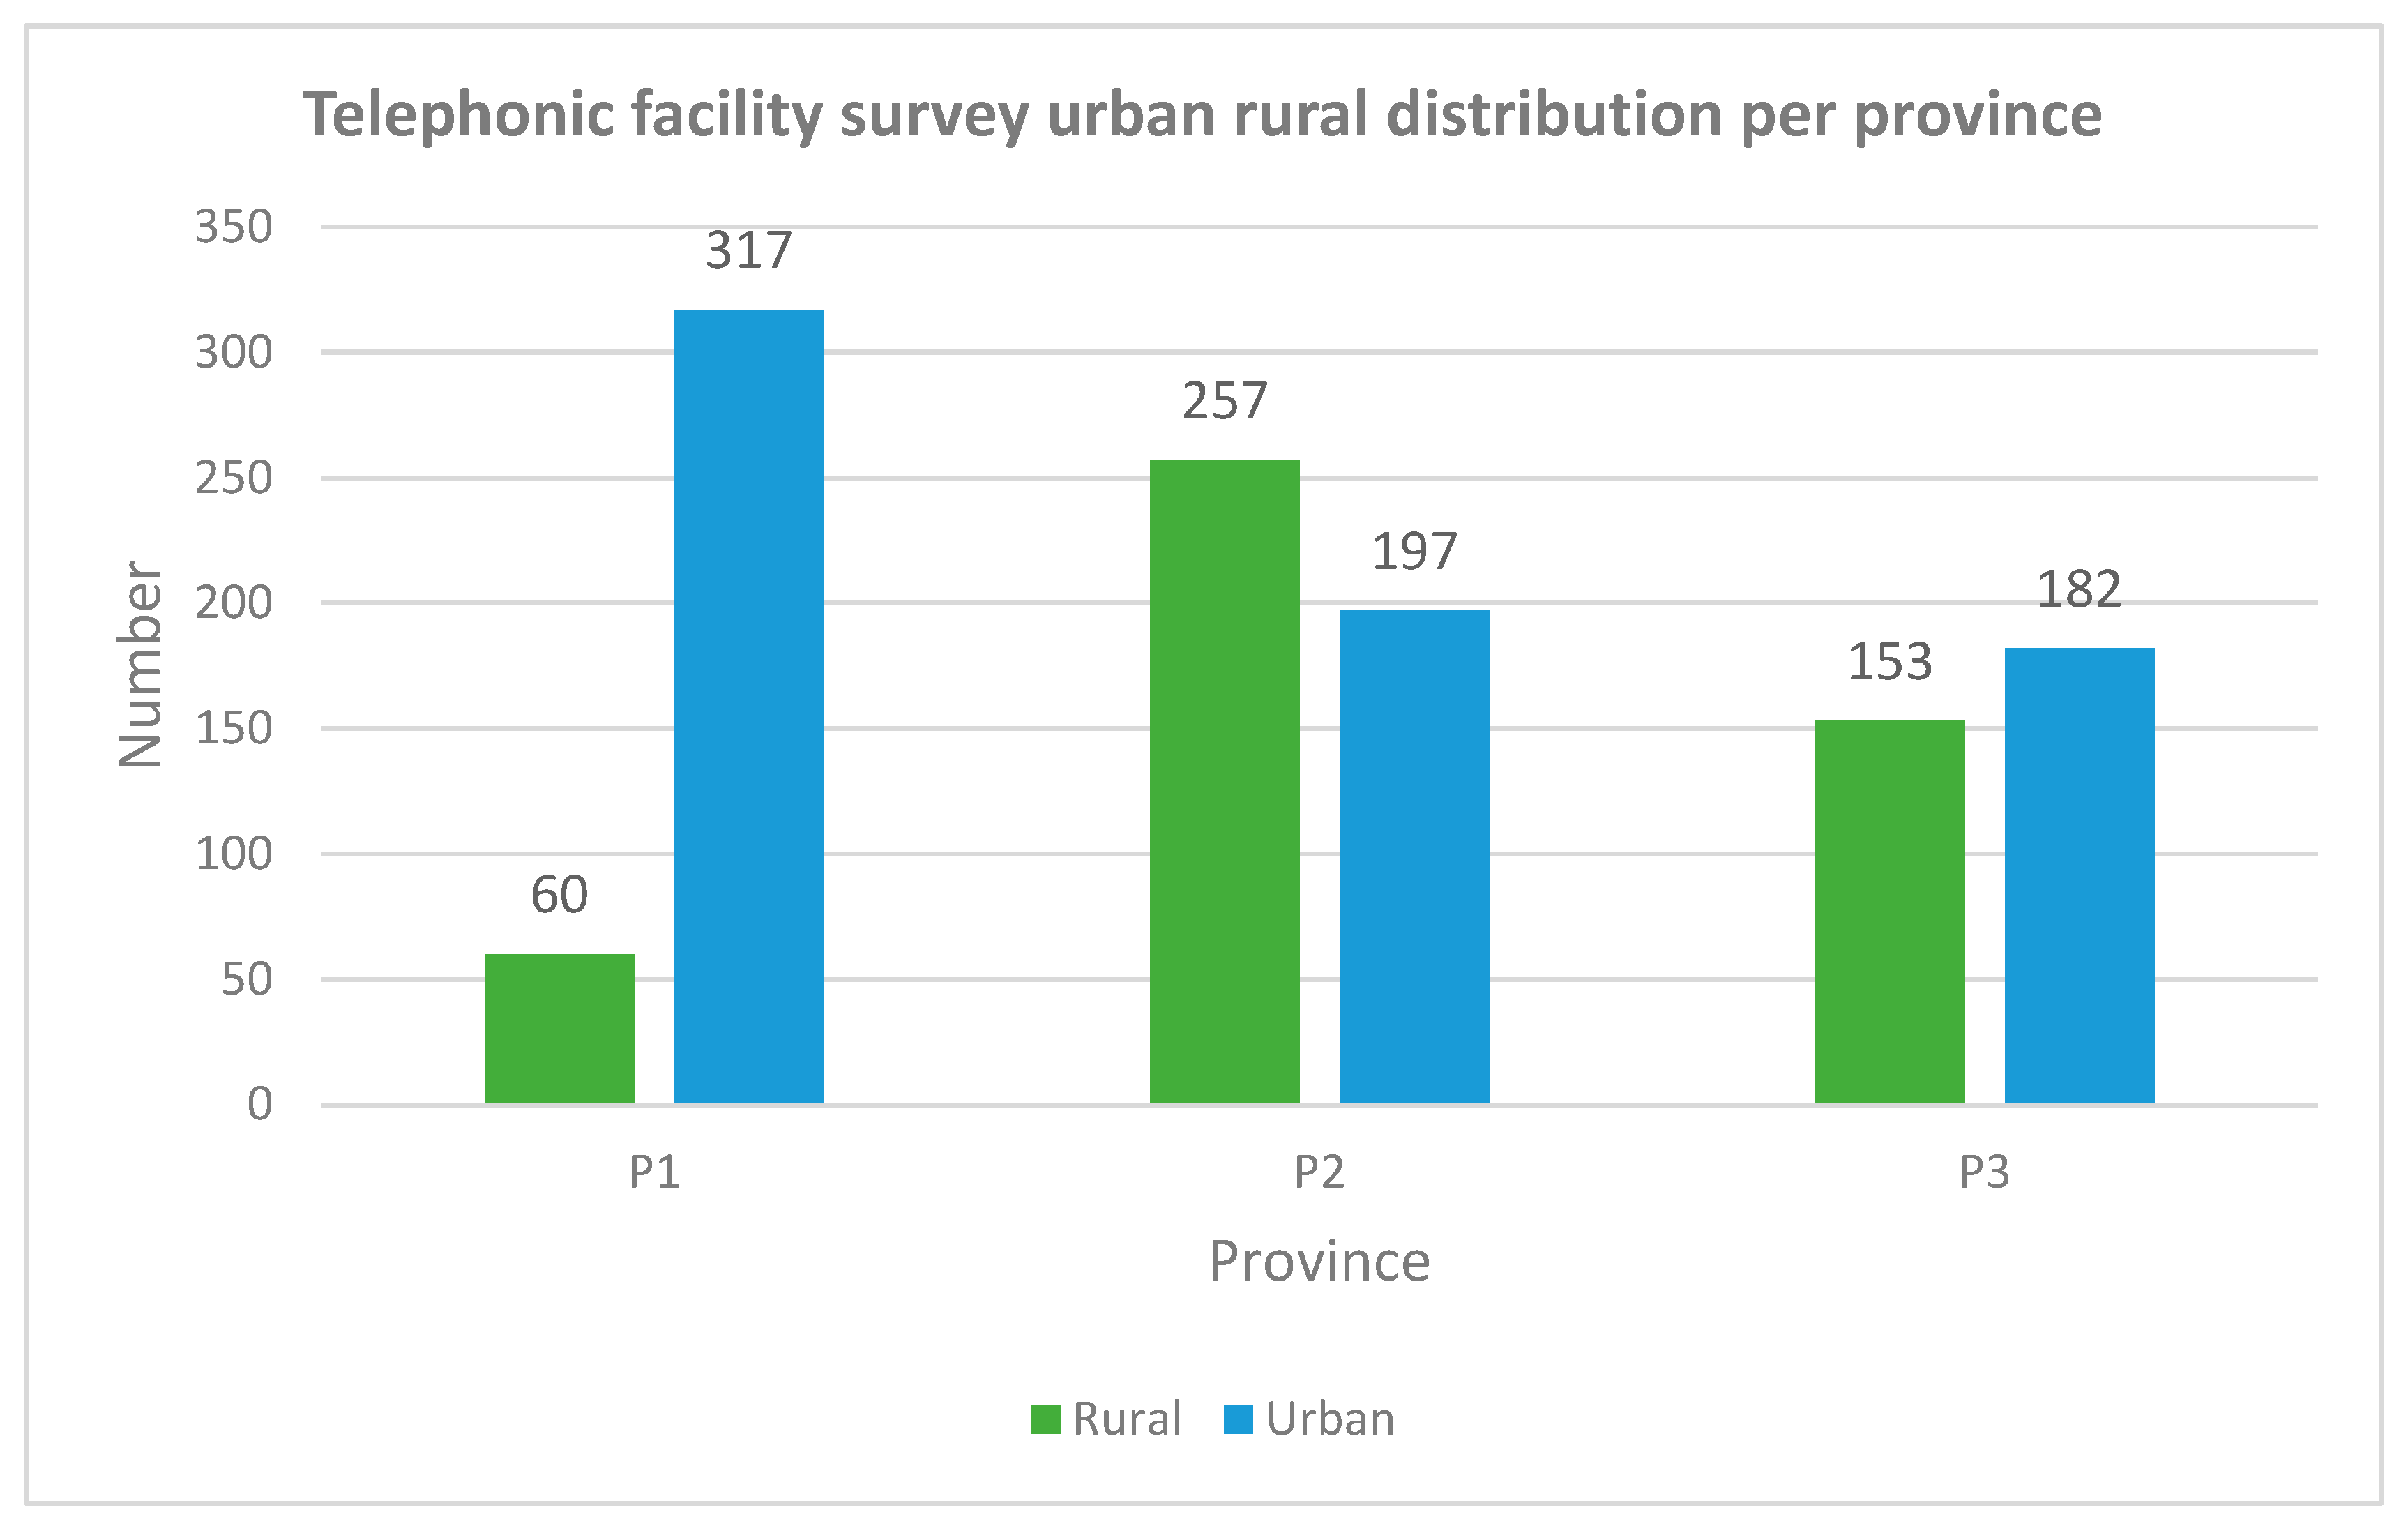
3.2.3. Rural Versus Urban
3.2.4. Distribution per Uninsured Population
4. Discussion
5. Limitations
6. Recommendations
7. Conclusions
Author Contributions
Funding
Institutional Review Board Statement
Informed Consent Statement
Data Availability Statement
Conflicts of Interest
Appendix A
| Definitions of Descriptors | |
| Audiologist | “Evaluating and determining the range, nature and degree of people’s hearing function in relation to their auditory efficiency and communication needs, including observation, the use of electro-acoustic instrumentation, and assessing receptive and expressive speech and language pathologies associated with hearing impairment. The planning, conducting or directing of or participating in the habilitation and/or rehabilitation of people with hearing pathologies, including the fitting and use of hearing aids, auditory training, speech reading, signing systems, speech conservation, speech and language acquisition, counselling and guidance related to the hearing impairment and to hearing conservation programmes [13].” |
| Speech and Language Therapist | “A Speech-Language Therapist optimises an individual’s ability to communicate and swallow, thereby enhancing the quality of life. Speech-Language Therapists provide services across the lifespan to all age groups from neonates to the geriatric population, to individuals, families and groups from diverse linguistic and cultural backgrounds. The professional functions in Speech-Language Therapy include clinical/educational services (diagnosis, assessment, planning and treatment), prevention, advocacy, education and administration [13].” |
| Dually qualified Speech and Audiology Therapist | Dual qualified Speech-language therapist and audiologist [14]. |
| Occupational Therapist | “Occupational Therapy is a skilled treatment that helps individuals achieve independence in all facets of their lives. It gives people the skills necessary for independent and satisfying lives. Occupational Therapists work across the lifespan with new-borns, young children, people with disabilities, the elderly, and with anyone who has a permanent or temporary impairment in their physical or mental functioning. Occupational Therapists help with rehabilitation of neuropsychological deficits, including memory and attention, as well as motor function, sensory function, and interpersonal skills [13].” |
| Physiotherapist | “A Physiotherapist assesses, treats and manages a wide variety of illnesses and injuries, including ailments from the fields of orthopaedics, neurology, respiratory and thoracic, cardiovascular, obstetrics, sports medicine, paediatrics, geriatrics, intensive care units and general rehabilitation [13].” |
| Primary health care | “Is the first level of contact for individuals seeking healthcare [13].” |
| Secondary health care | “Is specialist care that is typically rendered in a hospital setting following a referral from a primary or community health facility [13].” |
| Tertiary health care | “Specialist services rendered at this level will include theatre and ICU physiotherapy, as well as services rendered at the regional level [13].” |
| Urban | “The ‘built environment’ that includes all non-vegetative, human-constructed elements, such as roads, buildings, runways with public transport available [14].” |
| Rural | “Sparsely populated areas in which people farm or depend on natural resources, including villages and small towns that are dispersed through these areas [14].” |
| Salary level | “Means the relative value of a particular job as reflected by the job weight, which is linked to a salary range in a salary scale (an occupation or a sector within the public service, with specific amounts denoted as the beginning and end of salary ranges or notches within salary ranges) used in the public service [17].” |
References
- World Health Organization (WHO). Rehabilitation 2030: A Call for Action; WHO: Geneva, Switzerland, 2017. [Google Scholar] [CrossRef]
- World Health Organization (WHO). Rehabilitation Competency Framework; WHO: Geneva, Switzerland, 2020. [Google Scholar]
- World Health Organization (WHO). Rehabilitation in Health Systems; WHO: Geneva, Switzerland, 2017. [Google Scholar]
- United Nation. United Nations Convention on the Rights of Persons with Disabilities (CRPD). Int. Eur. Labour. Law 2006. [Google Scholar]
- Cieza, A.; Causey, K.; Kamenov, K.; Hanson, S.W.; Chatterji, S.; Vos, T. Global estimates of the need for rehabilitation based on the Global Burden of Disease study 2019: A systematic analysis for the Global Burden of Disease Study 2019. Lancet 2020, 396, 2006–2017. [Google Scholar] [CrossRef]
- World Health Organisation. The World Bank. World Report on Disability; WHO: Geneva, Switzerland, 2011. [Google Scholar]
- World Health Organisation (WHO). Rehabilitation in Health Systems: Guide for Action; WHO: Geneva, Switzerland, 2019. [Google Scholar]
- World Health Organization (WHO). Monitoring the Building Blocks of Health Systems: A Handbook of Indicators and Their Measurement Strategies; WHO: Geneva, Switzerland, 2010; p. 110. [Google Scholar]
- Cartmill, L.; Comans, T.A.; Clark, M.J.; Ash, S.; Sheppard, L. Using staffing ratios for workforce planning: Evidence on nine allied health professions. Hum. Resour. Health 2012, 10, 2. [Google Scholar] [CrossRef] [PubMed]
- Ned, L.; Tiwari, R.; Buchanan, H.; Van Niekerk, L.; Sherry, K.; Chikte, U. Changing demographic trends among South African occupational therapists: 2002 to 2018. Hum. Resour. Health 2020, 18, 22. [Google Scholar] [CrossRef]
- Stam, H.J.; Stucki, G.; Bickenbach, J. COVID-19 and post intensive care syndrome: A call for action. J. Rehabil. Med. 2020, 52, 19–22. [Google Scholar] [CrossRef]
- Louw, Q.; Grimmer, K.; Berner, K.; Conradie, T.; Bedada, D.T.; Jesus, T.S. Towards a needs-based design of the physical rehabilitation workforce in South Africa: Trend analysis [1990–2017] and a 5-year forecasting for the most impactful health conditions based on global burden of disease estimates. BMC Public Health 2021, 21, 913. [Google Scholar] [CrossRef]
- National Department of Health. Framework and Strategy for Disability and Rehabilitation; National Department of Health: Pretoria, South Africa, 2015; Available online: https://libguides.lib.uct.ac.za/c.php?g=194637&p=5049283 (accessed on 29 November 2021).
- Pillay, M.; Tiwari, R.; Kathard, H.; Chikte, U. Sustainable workforce: South African Audiologists and Speech Therapists. Hum. Resour. Health 2020, 18, 1–13. [Google Scholar] [CrossRef]
- National Department of Health. 2030 Human Resources for Health Strategy; National Department of Health: Pretoria, South Africa, 2020. [Google Scholar]
- Naidoo, S. The South African national health insurance: A revolution in health-care delivery! J. Public Health 2012, 34, 149–150. [Google Scholar] [CrossRef]
- Republic of South Africa. Public Service Regulations Act; Government Gazette, Republic of South Africa: Cape Town, South Africa, 2001; Volume 427. [Google Scholar]
- Harris, P.A.; Taylor, R.; Thielke, R.; Payne, J.; Gonzalez, N.; Conde, J.G. Research electronic data capture (REDCap)-A metadata-driven methodology and workflow process for providing translational research informatics support. J. Biomed. Inform. 2009, 42, 377–381. [Google Scholar] [CrossRef]
- Harris, P.A.; Taylor, R.; Minor, B.L.; Elliott, V.; Fernandez, M.; O’Neal, L.; McLeod, L.; Delacqua, G.; Delacqua, F.; Kirby, J.; et al. The REDCap consortium: Building an international community of software platform partners. J. Biomed. Inform. 2019, 95, 103208. [Google Scholar] [CrossRef]
- Statistics South Africa (StatsSA). Census 2001: Investigation into Appropriate Definitions of Urban and Rural Areas for South Africa; Statistics South Africa (StatsSA): Pretoria, South Africa, 2001. [Google Scholar]
- Statistics South Africa. Community Survey 2016: Statistical Release; Statistics South Africa (StatsSA): Pretoria, South Africa, 2016. [Google Scholar]
- Statistics South Africa. Community Survey 2016: Provinces at a Glance; Statistics South Africa (StatsSA): Pretoria, South Africa, 2016. [Google Scholar]
- StatsSA. General Household Survey. In J. Public Health Med.; 2019; 21, p. 482. Available online: http://www.ncbi.nlm.nih.gov/pubmed/11469378 (accessed on 29 November 2021).
- Jesus, T.S.; Koh, G.; Landry, M.; Ong, P.H.; Lopes, A.M.; Green, P.L.; Hoenig, H. Finding the “right-size” physical therapy workforce: International perspective across 4 countries. Phys. Ther. 2016, 96, 1597–1609. [Google Scholar] [CrossRef]
- Jesus, T.S.; Landry, M.D.; Hoenig, H.; Dussault, G.; Koh, G.C.; Fronteira, I. Is Physical Rehabilitation Need Associated With the Rehabilitation Workforce Supply? An Ecological Study Across 35 High-Income Countries. Int. J. Health Policy Manag. 2020, 11, 434–442. [Google Scholar] [CrossRef]
- Rodés, C.H.; Daré, J.V.; de Araujo, B.C.; Graciani, L.; João, S.M.; Germani, A.C.; Schmitt, A.C. The physiotherapy workforce in the Brazilian Unified Health Care System. Hum. Resour. Health 2021, 19, 1–11. [Google Scholar] [CrossRef]
- Landry, M.D.; Ricketts, T.C.; Fraher, E.; Verrier, M.C. Physical therapy health human resource ratios: A comparative analysis of the United States and Canada. Phys. Ther. 2009, 89, 149–161. [Google Scholar] [CrossRef]
- Eighan, J.; Walsh, B.; Smith, S.; Wren, M.-A.; Barron, S.; Morgenroth, E. A profile of physiotherapy supply in Ireland. Ir. J. Med. Sci. 2019, 188, 19–27. [Google Scholar] [CrossRef]
- SA National Treasury. Full Budget Review 2020. National Treasury. February 2020, 1–299. Available online: http://www.treasury.gov.za/documents/nationalbudget/2018/review/FullBR.pdf (accessed on 29 November 2021).
- Rodes, C.H.; Kurebayashi, R.; Kondo, V.E.; Dornelles Luft, V.; de Góes, Â.; Basso Schmitt, A.C. The access and rehabilitation working process in Primary Health Care. Fisioter Pesqui. 2017, 24, 74–82. Available online: http://search.ebscohost.com/login.aspx?direct=true&db=cin20&AN=125266410&site=ehost-live&scope=site (accessed on 29 November 2021). [CrossRef]
- Koch, S.F.; Setshegetso, N. Catastrophic health expenditures arising from out-of-pocket payments: Evidence from South African income and expenditure surveys. PLoS ONE 2020, 15, 1–14. [Google Scholar] [CrossRef]
- Ataguba, J.E.-O.; Akazili, J. Health care financing in South Africa: Moving towards universal coverage. Contin. Med. Educ. 2010, 28, 74–78. [Google Scholar]
- World Health Organization (WHO). Global Strategy on Human Resources for Health: Workforce 2030; WHO: Geneva, Switzerland, 2016; p. 64. [Google Scholar] [CrossRef]
- Anderson, G.; Ellis, E.; Williams, V.; Gates, C. Profile of the physiotherapy profession in New South Wales (1975–2002). Aust. J. Physiother. 2005, 51, 109–116. [Google Scholar] [CrossRef]
- Bath, B.; Gabrush, J.; Fritzler, R.; Dickson, N.; Bisaro, D.; Bryan, K.; Shah, T.I. Mapping the physiotherapy profession in saskatchewan: Examining rural versus urban practice patterns. Physiother. Can. 2015, 67, 221–231. [Google Scholar] [CrossRef]
- Coco, L.; Titlow, K.S.; Marrone, N. Geographic distribution of the hearing aid dispensing workforce: A teleaudiology planning assessment for Arizona. Am. J. Audiol. 2018, 27, 462–473. [Google Scholar] [CrossRef]
- Van Rensburg, H.C.J. South Africa’s protracted struggle for equal distribution and equitable access—Still not there. Hum. Resour. Health 2014, 12, 1–16. [Google Scholar] [CrossRef] [PubMed]
- Reid, S. 20 Years of community service in South Africa: What have we learnt? S. Afr. Health Rev. 2018, 2018, 41–50. [Google Scholar]
- Khan, N.B.; Knight, S.; Esterhuizen, T. Perceptions of and attitudes to the compulsory community service programme for therapists in KwaZulu-Natal. S. Afr. J. Commun. Disord. 2009, 56, 17–22. [Google Scholar] [CrossRef] [PubMed]
- Rispel, L.C.; Blaauw, D.; Ditlopo, P.; White, J. Human resources for health and universal health coverage: Progress, complexities and contestations. S. Afr. Health Rev. 2018, 1, 13–21. [Google Scholar]
- Cobbing, S.; Maddocks, S.; Govender, S.; Khan, S.; Mbhele, M.; Naidoo, K.; Tootla, S.; Weston, C. Physiotherapy postgraduate studies in South Africa: Facilitators and barriers. S. Afr. J Physiother. 2017, 73, 1–8. [Google Scholar] [CrossRef]


| Online Survey (Web-Based Therapist Survey) | Telephonic Survey (Telephonic Facility Survey) |
|---|---|
| Age of therapists | Total number of therapists and profession type 1
|
| Total years employed at facility | Level of care 1
|
| Highest level of qualification | Rural 2 versus urban 1 |
Salary level 1
|
| Mean Age (SD) | Range | ||
|---|---|---|---|
| Lowest | Highest | ||
| Province | |||
| 1 | 27.82 (6.43) | 22 | 59 |
| 2 | 34.47 (7.63) | 23 | 55 |
| 3 | 30.87 (9.33) | 22 | 64 |
| Profession | |||
| PT | 29.35 (6.84) | 22 | 56 |
| OT | 31.71 (10.02) | 22 | 64 |
| SLT | 26.68 (4.60) | 22 | 44 |
| AU | 27.9 (6.20) | 22 | 59 |
| SAT | 31.6 (6.82) | 22 | 51 |
| Mean Years (SD) | Range | ||
|---|---|---|---|
| Lowest Value | Highest Value | ||
| Province | |||
| 1 | 3.08 (7.82) | 0.00 | 14.33 |
| 2 | 7.88 (5.18) | 0.58 | 23.58 |
| 3 | 4.79 (6.50) | 0.00 | 30.25 |
| Profession | |||
| PT | 3.8 (4.53) | 0.08 | 26.17 |
| OT | 5.40 (6.75) | 0.08 | 30.25 |
| SLT | 2.35 (3.18) | 0.08 | 12.50 |
| AU | 2.85 (3.40) | 0.17 | 9.75 |
| SAT | 8.47 (17.51) | 0.17 | 21.17 |
| Qualification | PT | OT | SLT | AU | SAT | Total Count | |
|---|---|---|---|---|---|---|---|
| Certificate | Count | 0 | 4 | 0 | 0 | 0 | 4 |
| Percentage | 0.0% | 100.0% | 0.0% | 0.0% | 0.0% | ||
| Diploma | Count | 1 | 20 | 0 | 0 | 0 | 21 |
| Percentage | 4.8% | 95.2% | 0.0% | 0.0% | 0.0% | ||
| Bachelors | Count | 215 | 212 | 51 | 54 | 42 | 574 |
| Percentage | 37.5% | 36.9% | 8.9% | 9.4% | 7.3% | ||
| PG Diploma | Count | 0 | 1 | 0 | 0 | 0 | 1 |
| Percentage | 0.0% | 100.0% | 0.0% | 0.0% | 0.0% | ||
| Masters | Count | 6 | 15 | 7 | 5 | 4 | 37 |
| Percentage | 16.2% | 40.5% | 18.9% | 13.5% | 10.8% | ||
| Doctorate | Count | 1 | 0 | 0 | 0 | 0 | 1 |
| Percentage | 100.0% | 0.0% | 0.0% | 0.0% | 0.0% | ||
| Other1 | Count | 0 | 0 | 0 | 0 | 1 | 1 |
| Percentage | 0.0% | 0.0% | 0.0% | 0.0% | 100% |
| District | Total Number of Therapists | Percentage per District | Uninsured Population |
|---|---|---|---|
| P1D5 | 16 | 1.37% | 298,672 |
| P1D8 | 39 | 3.34% | 383,938.40 |
| P2D13 | 79 | 6.78% | 596,606.40 |
| P1D3 | 76 | 6.52% | 648,422.40 |
| P1D4 | 51 | 4.37% | 664,395.20 |
| P1D2 | 19 | 1.63% | 694,314.40 |
| P1D1 | 40 | 3.43% | 731,856 |
| P3D15 | 73 | 6.26% | 908,327.20 |
| P2D10 | 52 | 4.46% | 927,348 |
| P2D11 | 63 | 5.40% | 935,809.60 |
| P1D6 | 83 | 7.12% | 1,010,440.80 |
| P2D9 | 149 | 12.78% | 1,064,348.80 |
| P2D12 | 111 | 9.52% | 1,115,159.20 |
| P3D16 | 82 | 7.03% | 1,156,499.20 |
| P1D7 | 76 | 6.52% | 1,165,541.60 |
| P3D14 | 157 | 13.46% | 1,403,944.80 |
| Province | Total Number of Therapists | Ratio | Uninsured Population |
|---|---|---|---|
| P1 | 377 | 0.71 | 5,597,580.8 |
| P2 | 454 | 0.98 | 4,639,272 |
| P3 | 335 | 0.97 | 3,468,771.2 |
Publisher’s Note: MDPI stays neutral with regard to jurisdictional claims in published maps and institutional affiliations. |
© 2022 by the authors. Licensee MDPI, Basel, Switzerland. This article is an open access article distributed under the terms and conditions of the Creative Commons Attribution (CC BY) license (https://creativecommons.org/licenses/by/4.0/).
Share and Cite
Conradie, T.; Berner, K.; Louw, Q. Describing the Rehabilitation Workforce Capacity in the Public Sector of Three Rural Provinces in South Africa: A Cross-Sectional Study. Int. J. Environ. Res. Public Health 2022, 19, 12176. https://doi.org/10.3390/ijerph191912176
Conradie T, Berner K, Louw Q. Describing the Rehabilitation Workforce Capacity in the Public Sector of Three Rural Provinces in South Africa: A Cross-Sectional Study. International Journal of Environmental Research and Public Health. 2022; 19(19):12176. https://doi.org/10.3390/ijerph191912176
Chicago/Turabian StyleConradie, Thandi, Karina Berner, and Quinette Louw. 2022. "Describing the Rehabilitation Workforce Capacity in the Public Sector of Three Rural Provinces in South Africa: A Cross-Sectional Study" International Journal of Environmental Research and Public Health 19, no. 19: 12176. https://doi.org/10.3390/ijerph191912176
APA StyleConradie, T., Berner, K., & Louw, Q. (2022). Describing the Rehabilitation Workforce Capacity in the Public Sector of Three Rural Provinces in South Africa: A Cross-Sectional Study. International Journal of Environmental Research and Public Health, 19(19), 12176. https://doi.org/10.3390/ijerph191912176