

Assessing Changes in the Ecosystem Services Value in Response to Land-Use/Land-Cover Dynamics in Shanghai from 2000 to 2020

Abstract
1. Introduction
2. Materials and Methods
2.1. Study Area
2.2. Data Sources
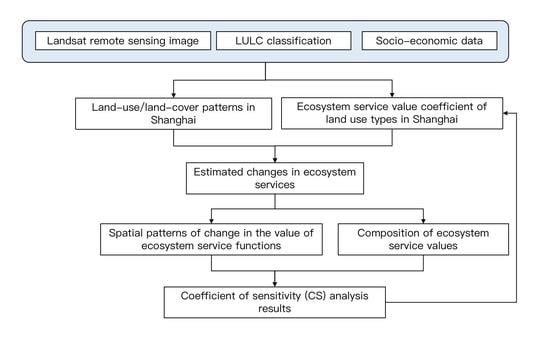
2.3. Methods
2.3.1. Land Use/land Cover Dynamics Analysis
2.3.2. Assignment of Ecosystem Service Values
2.3.3. Calculation of the Ecosystem Service Value
2.3.4. Sensitivity (CS)
3. Results
3.1. Land-Use/Land-Cover Patterns in Shanghai
3.2. Estimated Changes in Ecosystem Services
3.3. Composition of Ecosystem Service Values
3.4. Spatial Patterns of Change in the Value of Ecosystem Service Functions
3.5. Coefficient of Sensitivity (CS) Analysis Results
4. Discussion
4.1. Impact of LULC Change on Ecosystem Services in Shanghai
4.2. Limitations of the Study and Area of Future Research
5. Conclusions
Author Contributions
Funding
Institutional Review Board Statement
Informed Consent Statement
Data Availability Statement
Acknowledgments
Conflicts of Interest
References
- Daily, G. Nature’s Services: Societal Dependence on Natural Ecosystems; 1559634766; Island Press: Washington, DC, USA, 1997. [Google Scholar]
- Chen, B.; Chen, G.Q. Ecological footprint accounting based on emergy—A case study of the Chinese society. Ecol. Model. 2006, 198, 101–114. [Google Scholar] [CrossRef]
- Chen, B.; Chen, G.Q.; Yang, Z.F. Exergy-based resource accounting for China. Ecol. Model. 2006, 196, 313–328. [Google Scholar] [CrossRef]
- Chen, B.; Chen, G.Q. Modified ecological footprint accounting and analysis based on embodied exergy—A case study of the Chinese society 1981–2001. Ecol. Econ. 2007, 61, 355–376. [Google Scholar] [CrossRef]
- Su, S.; Xiao, R.; Jiang, Z.; Zhang, Y. Characterizing landscape pattern and ecosystem service value changes for urbanization impacts at an eco-regional scale. Appl. Geogr. 2012, 34, 295–305. [Google Scholar] [CrossRef]
- Pearce, D.; Moran, D. The Economic Value of Biodiversity; Routledge: London, UK, 2013. [Google Scholar]
- Zhao, B.; Kreuter, U.; Li, B.; Ma, Z.; Chen, J.; Nakagoshi, N. An ecosystem service value assessment of land-use change on Chongming Island, China. Land Use Policy 2004, 21, 139–148. [Google Scholar] [CrossRef]
- McNeely, J.A. Economic incentives for conserving biodiversity: Lessons for Africa. Ambio 1993, 22, 144–150. [Google Scholar]
- Peters, C.M.; Gentry, A.H.; Mendelsohn, R.O. Valuation of an Amazonian rainforest. Nature 1989, 339, 655–656. [Google Scholar] [CrossRef]
- Tobias, D.; Mendelsohn, R. Valuing ecotourism in a tropical rain-forest reserve. Ambio 1991, 20, 91–93. [Google Scholar]
- Munasinghe, M. Economic and policy issues in natural habitats and protected areas. In Protected Area Economics and Policy: Linking Conservation and Sustainable Development; World Bank: Washington, DC, USA, 1994. [Google Scholar]
- White, P.C.; Gregory, K.W.; Lindley, P.J.; Richards, G. Economic values of threatened mammals in Britain: A case study of the otter Lutra lutra and the water vole Arvicola terrestris. Biol. Conserv. 1997, 82, 345–354. [Google Scholar] [CrossRef]
- Braat, L.C.; de Groot, R. The ecosystem services agenda:bridging the worlds of natural science and economics, conservation and development, and public and private policy. Ecosyst. Serv. 2012, 1, 4–15. [Google Scholar] [CrossRef]
- de Groot, R.; Brander, L.; van der Ploeg, S.; Costanza, R.; Bernard, F.; Braat, L.; Christie, M.; Crossman, N.; Ghermandi, A.; Hein, L.; et al. Global estimates of the value of ecosystems and their services in monetary units. Ecosyst. Serv. 2012, 1, 50–61. [Google Scholar] [CrossRef]
- Costanza, R.; de Groot, R.; Sutton, P.; van der Ploeg, S.; Anderson, S.J.; Kubiszewski, I.; Farber, S.; Turner, R.K. Changes in the global value of ecosystem services. Global Environ. Change Hum. Policy Dimens. 2014, 26, 152–158. [Google Scholar] [CrossRef]
- Bartkowski, B. Are diverse ecosystems more valuable? Economic value of biodiversity as result of uncertainty and spatial interactions in ecosystem service provision. Ecosyst. Serv. 2017, 24, 50–57. [Google Scholar] [CrossRef]
- Costanza, R.; de Groot, R.; Braat, L.; Kubiszewski, I.; Fioramonti, L.; Sutton, P.; Farber, S.; Grasso, M. Twenty years of ecosystem services: How far have we come and how far do we still need to go? Ecosyst. Serv. 2017, 28, 1–16. [Google Scholar] [CrossRef]
- Kubiszewski, I.; Costanza, R.; Anderson, S.; Sutton, P. The future value of ecosystem services: Global scenarios and national implications. Ecosyst. Serv. 2017, 26, 289–301. [Google Scholar] [CrossRef]
- Sutton, P.C.; Anderson, S.J.; Costanza, R.; Kubiszewski, I. The ecological economics of land degradation: Impacts on ecosystem service values. Ecol. Econ. 2016, 129, 182–192. [Google Scholar] [CrossRef]
- Scolozzi, R.; Morri, E.; Santolini, R. Delphi-based change assessment in ecosystem service values to support strategic spatial planning in Italian landscapes. Ecol. Indic. 2012, 21, 134–144. [Google Scholar] [CrossRef]
- Burkhard, B.; Kroll, F.; Nedkov, S.; Mueller, F. Mapping ecosystem service supply, demand and budgets. Ecol. Indic. 2012, 21, 17–29. [Google Scholar] [CrossRef]
- Fang, X.; Zhao, W. Advances in Ecosystem Services Research: A review of the 11th INTECOL Congress 2013. Acta Ecol. Sin. 2013, 33, 6736–6740. [Google Scholar] [CrossRef]
- Sterling, S.M.; Ducharne, A.; Polcher, J. The impact of global land-cover change on the terrestrial water cycle. Nat. Clim. Change 2013, 3, 385–390. [Google Scholar] [CrossRef]
- Kreuter, U.P.; Harris, H.G.; Matlock, M.D.; Lacey, R.E. Change in ecosystem service values in the San Antonio area, Texas. Ecol. Econ. 2001, 39, 333–346. [Google Scholar] [CrossRef]
- Hu, H.; Liu, W.; Cao, M. Impact of land use and land cover changes on ecosystem services in Menglun, Xishuangbanna, Southwest China. Environ. Monit. Assess. 2008, 146, 147–156. [Google Scholar] [CrossRef] [PubMed]
- Anaya-Romero, M.; Munoz-Rojas, M.; Ibanez, B.; Maranon, T. Evaluation of forest ecosystem services in Mediterranean areas. A regional case study in South Spain. Ecosyst. Serv. 2016, 20, 82–90. [Google Scholar] [CrossRef]
- Kindu, M.; Schneider, T.; Teketay, D.; Knoke, T. Changes of ecosystem service values in response to land use/land cover dynamics in Munessa-Shashemene landscape of the Ethiopian highlands. Sci. Total Environ. 2016, 547, 137–147. [Google Scholar] [CrossRef]
- Tolessa, T.; Senbeta, F.; Kidane, M. The impact of land use/land cover change on ecosystem services in the central highlands of Ethiopia. Ecosyst. Serv. 2017, 23, 47–54. [Google Scholar] [CrossRef]
- Wang, X.; Dong, X.; Liu, H.; Wei, H.; Fan, W.; Lu, N.; Xu, Z.; Ren, J.; Xing, K. Linking land use change, ecosystem services and human well-being: A case study of the Manas River Basin of Xinjiang, China. Ecosyst. Serv. 2017, 27, 113–123. [Google Scholar] [CrossRef]
- Langerwisch, F.; Vaclavik, T.; von Bloh, W.; Vetter, T.; Thonicke, K. Combined effects of climate and land-use change on the provision of ecosystem services in rice agro-ecosystems. Environ. Res. Lett. 2018, 13, 015003. [Google Scholar] [CrossRef]
- Moser, D.; Dullinger, S.; Mang, T.; Huelber, K.; Essl, F.; Frank, T.; Hulme, P.E.; Grabherr, G.; Pascher, K. Changes in plant life-form, pollination syndrome and breeding system at a regional scale promoted by land use intensity. Divers. Distrib. 2015, 21, 1319–1328. [Google Scholar] [CrossRef]
- Darvill, R.; Lindo, Z. The inclusion of stakeholders and cultural ecosystem services in land management trade-off decisions using an ecosystem services approach. Landsc. Ecol. 2016, 31, 533–545. [Google Scholar] [CrossRef]
- Schuch, G.; Serrao-Neumann, S.; Morgan, E.; Choy, D.L. Water in the city: Green open spaces, land use planning and flood management—An Australian case study. Land Use Policy 2017, 63, 539–550. [Google Scholar] [CrossRef]
- Costanza, R.; d’Arge, R.; De Groot, R.; Farber, S.; Grasso, M.; Hannon, B.; Limburg, K.; Naeem, S.; O’neill, R.V.; Paruelo, J. The value of the world’s ecosystem services and natural capital. Nature 1997, 387, 253–260. [Google Scholar] [CrossRef]
- Zhang, Y. Some basic issues in ecosystem services research. Resour. Sci. 2012, 34, 725–733. [Google Scholar]
- Zheng, F.; Zang, Z.; Sun, Z. Prediction and analysis of the transition to green economy in China based on the theory of ecosystem services. Acta Ecol. Sin. 2014, 34, 7137–7147. [Google Scholar]
- Li, R.; Dong, M.; Cui, J.; Zhang, L.; Cui, Q.; He, W. Quantification of the impact of land-use changes on ecosystem services: A case study in Pingbian County, China. Environ. Monit. Assess. 2007, 128, 503–510. [Google Scholar] [CrossRef]
- Cabral, P.; Feger, C.; Levrel, H.; Chambolle, M.; Basque, D. Assessing the impact of land-cover changes on ecosystem services: A first step toward integrative planning in Bordeaux, France. Ecosyst. Serv. 2016, 22, 318–327. [Google Scholar] [CrossRef]
- Tolessa, T.; Senbeta, F.; Abebe, T. Land use/land cover analysis and ecosystem services valuation in the central highlands of Ethiopia. For. Trees Livelihoods 2017, 26, 111–123. [Google Scholar] [CrossRef]
- Duraiappah, A.K.; Naeem, S.; Agardy, T.; Ash, N.J.; Cooper, H.D.; Diaz, S.; Faith, D.P.; Mace, G.; McNeely, J.A.; Mooney, H.A. Ecosystems and Human Well-Being: Biodiversity Synthesis; A Report of the Millennium Ecosystem Assessment; World Resources Institute: Washington, DC, USA, 2005. [Google Scholar]
- Foerster, J.; Barkmann, J.; Fricke, R.; Hotes, S.; Kleyer, M.; Kobbe, S.; Kuebler, D.; Rumbaur, C.; Siegmund-Schultze, M.; Seppelt, R.; et al. Assessing ecosystem services for informing land-use decisions: A problem-oriented approach. Ecol. Soc. 2015, 20, 31. [Google Scholar] [CrossRef]
- Yi, H.; Gueneralp, B.; Filippi, A.M.; Kreuter, U.P.; Gueneralp, I. Impacts of Land Change on Ecosystem Services in the San Antonio River Basin, Texas, from 1984 to 2010. Ecol. Econ. 2017, 135, 125–135. [Google Scholar] [CrossRef]
- Yoshida, A.; Chanhda, H.; Ye, Y.-M.; Liang, Y.-R. Ecosystem service values and land use change in the opium poppy cultivation region in Northern Part of Lao PDR. Acta Ecol. Sin. 2010, 30, 56–61. [Google Scholar] [CrossRef]
- Polasky, S.; Nelson, E.; Pennington, D.; Johnson, K.A. The Impact of Land-Use Change on Ecosystem Services, Biodiversity and Returns to Landowners: A Case Study in the State of Minnesota. Environ. Resour. Econ. 2011, 48, 219–242. [Google Scholar] [CrossRef]
- Radford, K.G.; James, P. Changes in the value of ecosystem services along a rural-urban gradient: A case study of Greater Manchester, UK. Landsc. Urban Plan. 2013, 109, 117–127. [Google Scholar] [CrossRef]
- Martínez, M.L.; Pérez-Maqueo, O.; Vázquez, G.; Castillo-Campos, G.; García-Franco, J.; Mehltreter, K.; Equihua, M.; Landgrave, R. Effects of land use change on biodiversity and ecosystem services in tropical montane cloud forests of Mexico. For. Ecol. Manag. 2009, 258, 1856–1863. [Google Scholar] [CrossRef]
- Reyers, B.; O’Farrell, P.J.; Cowling, R.M.; Egoh, B.N.; Le Maitre, D.C.; Vlok, J.H.J. Ecosystem Services, Land-Cover Change, and Stakeholders: Finding a Sustainable Foothold for a Semiarid Biodiversity Hotspot. Ecol. Soc. 2009, 14, 38. [Google Scholar] [CrossRef]
- Egoh, B.N.; O’Farrell, P.J.; Charef, A.; Gurney, L.J.; Koellner, T.; Abi, H.N.; Egoh, M.; Willemen, L. An African account of ecosystem service provision: Use, threats and policy options for sustainable livelihoods. Ecosyst. Serv. 2012, 2, 71–81. [Google Scholar] [CrossRef]
- Leh, M.D.K.; Matlock, M.D.; Cummings, E.C.; Nalley, L.L. Quantifying and mapping multiple ecosystem services change in West Africa. Agric. Ecosyst. Environ. 2013, 165, 6–18. [Google Scholar] [CrossRef]
- de Groot, R. Function-analysis and valuation as a tool to assess land use conflicts in planning for sustainable, multi-functional landscapes. Landsc. Urban Plan. 2006, 75, 175–186. [Google Scholar] [CrossRef]
- Jiang, X.; Li, D.; Li, Z. Ecosystem service values based on land use in shiyang river basin. China Popul. Resour. Environ. 2010, 20, 68–73. [Google Scholar]
- Song, W.; Liu, M. Assessment of decoupling between rural settlement area and rural population in China. Land Use Policy 2014, 39, 331–341. [Google Scholar] [CrossRef]
- Song, W. Decoupling cultivated land loss by construction occupation from economic growth in Beijing. Habitat Int. 2014, 43, 198–205. [Google Scholar] [CrossRef]
- Tayyebi, A.H.; Tayyebi, A.; Khanna, N. Assessing uncertainty dimensions in land-use change models: Using swap and multiplicative error models for injecting attribute and positional errors in spatial data. Int. J. Remote Sens. 2014, 35, 149–170. [Google Scholar] [CrossRef]
- Ouyang, Z.; Wang, X.; Miao, H. A primary study on Chinese terrestrial ecosystem services and their ecological-economic values. Acta Ecol. Sin. 1999, 19, 607–613. [Google Scholar]
- Fu, B.; Zhang, L. Land-use change and ecosystem services: Concepts, methods and progress. Prog. Geogr. 2014, 33, 441–446. [Google Scholar]
- Feng, Y.; Luo, G.; Lu, L.; Yin, C.; Zhou, D.; Xu, W. Impacts of land use changes on ecosystem services value in typical river basin of arid area. J. Soil Water Conserv. 2009, 23, 247–251. [Google Scholar]
- Li, Y.; Luo, Y.; Liu, G.; Ouyang, Z.; Zheng, H. Effects of land use change on ecosystem services: A case study in Miyun reservoir watershed. Acta Ecol. Sin. 2013, 33, 726–736. [Google Scholar]
- Xie, G.; Lu, C.X.; Leng, Y.; Zheng, D.; Li, S. Ecological assets valuation of the Tibetan Plateau. J. Nat. Resour. 2003, 18, 189–196. [Google Scholar]
- Xie, G.; Zhen, L.; Lu, C.-X.; Xiao, Y.; Chen, C. Expert knowledge based valuation method of ecosystem services in China. J. Nat. Resour. 2008, 23, 911–919. [Google Scholar]
- Xie, G.; Zhang, C.; Zhang, L.; Chen, W.; Li, S. Improvement of the evaluation method for ecosystem service value based on per unit area. J. Nat. Resour. 2015, 30, 1243. [Google Scholar]
- Bolund, P.; Hunhammar, S. Ecosystem services in urban areas. Ecol. Econ. 1999, 29, 293–301. [Google Scholar] [CrossRef]
- Yin, J.; Yin, Z.; Zhong, H.; Xu, S.; Hu, X.; Wang, J.; Wu, J. Monitoring urban expansion and land use/land cover changes of Shanghai metropolitan area during the transitional economy (1979-2009) in China. Environ. Monit. Assess. 2011, 177, 609–621. [Google Scholar] [CrossRef]
- Wu, K.; Ye, X.; Qi, Z.; Zhang, H. Impacts of land use/land cover change and socioeconomic development on regional ecosystem services: The case of fast-growing Hangzhou metropolitan area, China. Cities 2013, 31, 276–284. [Google Scholar] [CrossRef]
- Wang, J.; Dun, Y. A review on the effects of land use change on ecosystem services. Resour. Environ. Yangtze Basin 2015, 24, 798–808. [Google Scholar]
- Wang, X.; Lv, Y.; Fu, B. Ecosystem services and ecological security. Chin. J. Nat. 2012, 34, 273–276+298. [Google Scholar]
- Liu, Y.; Hou, X.; Li, X.; Song, B.; Wang, C. Assessing and predicting changes in ecosystem service values based on land use/cover change in the Bohai Rim coastal zone. Ecol. Indic. 2020, 111, 106004. [Google Scholar] [CrossRef]
- Wu, C.; Chen, B.; Huang, X.; Wei, Y.H.D. Effect of land-use change and optimization on the ecosystem service values of Jiangsu province, China. Ecol. Indic. 2020, 117, 106507. [Google Scholar] [CrossRef]
- Song, W.; Deng, X. Land-use/land-cover change and ecosystem service provision in China. Sci. Total Environ. 2017, 576, 705–719. [Google Scholar] [CrossRef]
- Li, Y.; Feng, Y.; Guo, X.; Peng, F. Changes in coastal city ecosystem service values based on land use A case study of Yingkou, China. Land Use Policy 2017, 65, 287–293. [Google Scholar] [CrossRef]
- Song, W.; Deng, X.; Yuan, Y.; Wang, Z.; Li, Z. Impacts of land-use change on valued ecosystem service in rapidly urbanized North China Plain. Ecol. Model. 2015, 318, 245–253. [Google Scholar] [CrossRef]
- Peng, K.; Jiang, W.; Ling, Z.; Hou, P.; Deng, Y. Evaluating the potential impacts of land use changes on ecosystem service value under multiple scenarios in support of SDG reporting: A case study of the Wuhan urban agglomeration. J. Clean. Prod. 2021, 307, 127321. [Google Scholar] [CrossRef]
- Kang, Y.; Cheng, C.; Liu, X.; Zhang, F.; Li, Z.; Lu, S. An ecosystem services value assessment of land-use change in Chengdu: Based on a modification of scarcity factor. Phys. Chem. Earth 2019, 110, 157–167. [Google Scholar] [CrossRef]
- Zhu, H.; Li, X. Discussion on the index method of regional land use change. Acta Geogr. Sin. 2003, 58, 643–650. [Google Scholar]
- Gao, Q.; Shi, X.; Huang, Q.; Zhang, C.; Ma, H. Ecosystem service value respond to regional land use change. China Popul. Resour. Environ. 2013, 23, 308–312. [Google Scholar]
- Zhang, L.; Qu, L.; Lv, C.; Li, L. Study on land ecosystem service value in Wuhan with spatial structural perspective. Resour. Environ. Yangtze Basin 2018, 27, 1988–1997. [Google Scholar]
- Zhang, T.; Tian, Y.; Xu, S.; Tang, L.; Guo, W. The evolvement of land use patterns in coastal cities and its influence on ecosystem service values. Acta Ecol. Sin. 2018, 38, 7572–7581. [Google Scholar]
- Mamat, Z.; Halik, U.; Aji, R.; Nurmemet, I.; Anwar, M.; Keyimu, M. Ecology-economy harmonious development based on the ecological services value change in Yanqi Basin, Northwest China. Yingyong Shengtai Xuebao 2015, 26, 875–883. [Google Scholar]
- Wen, L.; Song, J.; Zhang, H.; Zhang, X.; Wang, F.; Ha, S.; Wang, L. Dynamics of ecosystem service value in Ulan buh Desert from 1990 to 2018. J. Arid. Land Resour. Environ. 2020, 34, 57–64. [Google Scholar]
- Yu, J.; Li, G.; Zhao, H.; Xu, J. Study on land use change and its ecological service value in Peixian County, Jiangsu Province. Jiangsu Agric. Sci. 2015, 43, 371–376. [Google Scholar]
- Muhtar, P.; Yimit, H. Ecosystem Services Sensitivity to Land-use Change: A Case Study of the Keriya Oasis. J. Nat. Resour. 2014, 29, 1849–1858. [Google Scholar]
- Han, G.; Xing, Q.; Yu, J.; Luo, Y.; Li, D.; Yang, L.; Wang, G.; Mao, P.; Xie, B.; Mikle, N. Agricultural reclamation effects on ecosystem CO2 exchange of a coastal wetland in the Yellow River Delta. Agric. Ecosyst. Environ. 2014, 196, 187–198. [Google Scholar] [CrossRef]
- Glaeser, L.C.; Vitt, D.H.; Ebbs, S. Responses of the wetland grass, Beckmannia syzigachne, to salinity and soil wetness: Consequences for wetland reclamation in the oil sands area of Alberta, Canada. Ecol. Eng. 2016, 86, 24–30. [Google Scholar] [CrossRef]
- Hu, M.; Li, Z.; Wang, Y.; Jiao, M.; Li, M.; Xia, B. Spatio-temporal changes in ecosystem service value in response to land-use/cover changes in the Pearl River Delta. Resour. Conserv. Recycl. 2019, 149, 106–114. [Google Scholar] [CrossRef]
- Sharma, B.; Rasul, G.; Chettri, N. The economic value of wetland ecosystem services: Evidence from the Koshi Tappu Wildlife Reserve, Nepal. Ecosyst. Serv. 2015, 12, 84–93. [Google Scholar] [CrossRef]
- Greenland-Smith, S.; Brazner, J.; Sherren, K. Farmer perceptions of wetlands and waterbodies: Using social metrics as an alternative to ecosystem service valuation. Ecol. Econ. 2016, 126, 58–69. [Google Scholar] [CrossRef]
- Roy, P.; Roy, A. Land use and land cover change in India: Aremote sensing & GIS prespective. J. Indian Inst. Sci. 2010, 90, 489–502. [Google Scholar]
- Dittman, D.E.; Chalupnicki, M.A.; Johnson, J.H.; Snyder, J. Reintroduction of Lake Sturgeon (Acipenser fulvescens) into the St. Regis River, NY: Post- Release Assessment of Habitat Use and Growth. Northeast. Nat. 2015, 22, 704–716. [Google Scholar] [CrossRef]
- Wang, S.; Meng, W.; Jin, X.; Zheng, B.; Zhang, L.; Xi, H. Ecological security problems of the major key lakes in China. Environ. Earth Sci. 2015, 74, 3825–3837. [Google Scholar] [CrossRef]
- Aschonitis, V.G.; Gaglio, M.; Castaldelli, G.; Fano, E.A. Criticism onelasticity-sensitivity coefficient for assessing the robustness and sensitivity of ecosystem services values. Ecosyst. Serv. 2016, 20, 66–68. [Google Scholar] [CrossRef]
- Yirsaw, E.; Wu, W.; Shi, X.; Temesgen, H.; Bekele, B. Land Use/Land Cover Change Modeling and the Prediction of Subsequent Changes in Ecosystem Service Values in a Coastal Area of China, the Su-Xi-Chang Region. Sustainability 2017, 9, 1204. [Google Scholar] [CrossRef]


| LULC Types | Descriptions | |
|---|---|---|
| Cultivated land | Refer to the land for planting crops, including arable land, newly reclaimed land, recreational land, rotation and rest land, grass field rotation crop land; Land for fruit, crop, agriculture, and forestry; Beaches and tidelands cultivated for more than three years. | |
| Forestland | Refer to the land for growing trees, shrubs, bamboo, as well as coastal mangrove forest and other forestry land. | |
| Grassland | Refer to all kinds of grassland, mainly herbaceous plants, with the coverage above 5%, including shrub grassland for grazing and sparsely forested grassland with canopy density below. | |
| Trench and lake 1 | Trench | Refer to the natural or artificial excavation of rivers and area with the bulk perennially below water level. Artificial channels include embankments. |
| Lakes | Refer to the land in naturally waterlogged area that is permanently below water level. | |
| Wetland pits 2 | Swag | Refer to the land in artificial water storage area that is perennially below the water level. |
| Ocean beaches | Refer to the tidal zone between high tide and low tide of coastal spring tide. | |
| Bottomland | Refer to the land between the water level of a river or lake and the water level of a flood. | |
| Construction land | Refer to urban areas, residential areas and land for industrial, mining and transportation purposes. | |
| Year | 2000 | 2005 | 2010 | 2015 | 2020 |
|---|---|---|---|---|---|
| Output value of food crops agricultural commodities (×108 yuan) | 10.15 | 9.20 | 16.43 | 21.69 | 24.04 |
| Sown area of grain Crops (×104 hm2) | 25.88 | 16.61 | 20.12 | 18.13 | 11.43 |
| Economic value of grain crops (yuan hm−2) | 3921.95 | 5538.83 | 8166.00 | 11,963.60 | 21,032.37 |
| Single equivalent ecosystem service value (yuan hm−2) | 560.28 | 820.63 | 1372.16 | 2338.35 | 4571.75 |
| Ecosystem Service Types | Cultivated Land | Forest Land | Grassland | Trench and Lakes | Wetland Pits |
|---|---|---|---|---|---|
| Supply service | |||||
| Food production | 2135.56 | 487.99 | 734.40 | 985.64 | 1546.10 |
| Material production | 473.49 | 1120.93 | 1082.27 | 966.32 | 444.50 |
| Water supply | −2522.08 | 579.79 | 599.12 | 5005.51 | 16,021.50 |
| Regulating service | |||||
| Gas regulation | 1720.04 | 3686.49 | 3807.28 | 3672.00 | 1488.13 |
| Climate regulation | 898.67 | 11,030.49 | 10,069.00 | 6957.47 | 4425.72 |
| Environment purification | 260.91 | 3232.32 | 3324.12 | 6957.47 | 10,726.10 |
| Hydrological adjusting | 2889.28 | 7218.37 | 7382.65 | 46,827.62 | 197,592.09 |
| Support service | |||||
| Soil conservation | 1004.97 | 4488.53 | 4638.31 | 4464.38 | 1797.35 |
| Nutrient cycling | 299.56 | 343.04 | 347.87 | 347.87 | 135.28 |
| Biodiversity | 328.55 | 4087.51 | 4213.13 | 15,209.80 | 4928.21 |
| Cultural service | |||||
| Landscape | 144.95 | 1792.51 | 1855.32 | 9141.34 | 3652.67 |
| Index | Year | Cultivated Land | Forest Land | Grassland | Trench and Lakes | Wetland Pits | Construction Land | |||
|---|---|---|---|---|---|---|---|---|---|---|
| Trench | Lakes | Swag | Ocean Beaches | Bottomland | ||||||
| Area (Thousand hm2) | 2000 | 455.21 | 10.31 | 1.17 | 10.98 | 0.26 | 31.04 | 7.52 | 9.37 | 144.98 |
| 2005 | 423.89 | 11.13 | 1.89 | 10.96 | 0.25 | 27.10 | 5.06 | 5.79 | 184.77 | |
| 2010 | 377.47 | 10.15 | 1.88 | 10.50 | 5.97 | 21.12 | 4.87 | 5.86 | 233.19 | |
| 2015 | 359.98 | 9.84 | 1.35 | 9.26 | 5.51 | 21.78 | 15.32 | 6.55 | 254.94 | |
| 2020 | 331.25 | 10.93 | 6.74 | 15.20 | 6.36 | 16.14 | 0.14 | 2.48 | 286.23 | |
| 2000–2020 | −123.96 | 0.62 | 5.57 | 4.22 | 6.10 | −14.90 | −7.38 | −6.89 | 141.26 | |
| Area proportion (%) | 2000 | 67.86 | 1.54 | 0.17 | 1.64 | 0.04 | 4.63 | 1.12 | 1.40 | 21.61 |
| 2005 | 63.19 | 1.66 | 0.28 | 1.63 | 0.04 | 4.04 | 0.75 | 0.86 | 27.54 | |
| 2010 | 56.25 | 1.51 | 0.28 | 1.57 | 0.89 | 3.15 | 0.73 | 0.87 | 34.75 | |
| 2015 | 52.59 | 1.44 | 0.20 | 1.35 | 0.80 | 3.18 | 2.24 | 0.96 | 37.24 | |
| 2020 | 49.04 | 1.62 | 1.00 | 2.25 | 0.94 | 2.39 | 0.02 | 0.37 | 42.38 | |
| LUDDi | 2000–2005 | −0.01 | 0.02 | 0.12 | 0.00 | 0.00 | −0.03 | −0.07 | −0.08 | 0.05 |
| 2005–2010 | −0.02 | −0.02 | 0.00 | −0.01 | 4.50 | −0.04 | −0.01 | 0.00 | 0.05 | |
| 2010–2015 | −0.01 | −0.01 | −0.06 | −0.02 | −0.02 | 0.01 | 0.43 | 0.02 | 0.02 | |
| 2015–2020 | −0.02 | 0.02 | 0.80 | 0.13 | 0.03 | −0.05 | −0.20 | −0.12 | 0.02 | |
| 2000–2020 | −0.01 | 0.01 | 0.24 | 0.02 | 1.20 | −0.02 | −0.05 | −0.04 | 0.05 | |
| Index | Year | Cultivated Land | Forest Land | Grassland | Trench and Lakes | Wetland Pits | Total | |||
|---|---|---|---|---|---|---|---|---|---|---|
| Trench | Lakes | Swag | Ocean Beaches | Bottomland | ||||||
| ESV (Million yuan) | 2000 | 3475.02 | 392.44 | 44.56 | 2665.13 | 61.92 | 3120.79 | 756.46 | 942.44 | 11,458.78 |
| 2005 | 3235.95 | 423.52 | 71.86 | 2661.37 | 61.63 | 2724.55 | 509.03 | 581.81 | 10,269.72 | |
| 2010 | 2881.58 | 386.44 | 71.43 | 2549.75 | 1448.38 | 2123.18 | 489.85 | 588.97 | 10,539.58 | |
| 2015 | 2748.04 | 374.62 | 51.42 | 2247.48 | 1337.72 | 2189.89 | 1540.25 | 658.98 | 11,148.40 | |
| 2020 | 2528.73 | 416.16 | 256.38 | 3689.42 | 1543.42 | 1622.67 | 14.17 | 249.42 | 10,320.38 | |
| 2000–2020 | −946.29 | 23.72 | 211.81 | 1024.29 | 1481.50 | −1498.12 | −742.30 | −693.02 | −1138.40 | |
| CRj (%) | 2000 | 30.33 | 3.42 | 0.39 | 23.26 | 0.54 | 27.23 | 6.60 | 8.22 | - |
| 2005 | 31.51 | 4.12 | 0.70 | 25.91 | 0.60 | 26.53 | 4.96 | 5.67 | - | |
| 2010 | 27.34 | 3.67 | 0.68 | 24.19 | 13.74 | 20.14 | 4.65 | 5.59 | - | |
| 2015 | 24.65 | 3.36 | 0.46 | 20.16 | 12.00 | 19.64 | 13.82 | 5.91 | - | |
| 2020 | 24.50 | 4.03 | 2.48 | 35.75 | 14.96 | 15.72 | 0.14 | 2.42 | - | |
| 2000–2020 | −5.82 | 0.61 | 2.10 | 12.49 | 14.41 | −11.51 | −6.46 | −5.81 | - | |
| (a) 2000–2005 | (b) 2005–2010 | ||||||||||||||
| Year | 2005 | Year | 2010 | ||||||||||||
| (1) | (2) | (3) | (4) | (5) | (6) * | (1) | (2) | (3) | (4) | (5) | (6) | ||||
| 2000 | (1) | 0.00 | 34.98 | 0.21 | 12.10 | 175.26 | −298.22 | 2005 | (1) | 0.00 | 15.21 | 1.16 | 88.67 | 122.10 | −392.85 |
| (2) | −4.59 | 0.00 | 0.00 | 4.73 | 2.04 | −18.70 | (2) | −13.20 | 0.00 | 0.00 | 6.65 | 3.08 | −46.02 | ||
| (3) | −2.03 | 0.00 | 0.00 | 0.00 | 1.09 | −0.27 | (3) | −1.74 | 0.00 | 0.00 | 2.10 | 1.73 | −0.46 | ||
| (4) | −18.94 | −0.39 | −0.02 | 0.00 | −2.10 | −10.75 | (4) | −70.97 | −7.28 | −1.40 | 0.00 | −68.88 | −113.68 | ||
| (5) | −750.19 | −6.03 | −62.17 | 3.64 | 0.00 | −278.87 | (5) | −116.62 | −4.72 | −2.42 | 841.97 | 0.00 | −85.19 | ||
| (6) | 18.83 | 2.70 | 0.04 | 6.01 | 2.33 | 0.00 | (6) | 39.54 | 5.31 | 0.17 | 50.82 | 10.41 | 0.00 | ||
| (c) 2010–2015 | (d) 2015–2020 | ||||||||||||||
| Year | 2015 | Year | 2020 | ||||||||||||
| (1) | (2) | (3) | (4) | (5) | (6) | (1) | (2) | (3) | (4) | (5) | (6) | ||||
| 2010 | (1) | 0.00 | 0.00 | 0.00 | 47.76 | 31.19 | −145.93 | 2015 | (1) | 0.00 | 15.36 | 86.66 | 380.41 | 221.34 | −295.74 |
| (2) | 0.00 | 0.00 | 0.00 | 0.00 | 0.00 | −11.82 | (2) | −17.64 | 0.00 | −0.01 | 17.78 | 8.20 | −28.78 | ||
| (3) | −11.40 | 0.00 | 0.00 | 0.00 | 1.59 | −4.78 | (3) | −3.30 | 0.00 | 0.00 | 4.96 | 3.72 | −2.37 | ||
| (4) | −79.67 | 0.00 | 0.00 | 0.00 | −221.07 | −4.15 | (4) | −104.39 | −8.23 | −8.25 | 0.00 | −95.56 | −113.61 | ||
| (5) | −109.29 | 0.00 | 0.00 | 0.00 | 0.00 | −6.42 | (5) | −1204.05 | −3.28 | −245.34 | 90.85 | 0.00 | −307.33 | ||
| (6) | 2.08 | 0.00 | 0.00 | 1.51 | 1.57 | 0.00 | (6) | 71.93 | 5.00 | 46.11 | 152.65 | 47.46 | 0.00 | ||
| Type of Service | Services Available | ESV (Million Yuan) | CRi (%) | ||||||||
|---|---|---|---|---|---|---|---|---|---|---|---|
| 2000 | 2005 | 2010 | 2015 | 2020 | 2000 | 2005 | 2010 | 2015 | 2020 | ||
| Supply service | Food production | 1042.64 | 966.81 | 869.30 | 840.41 | 769.51 | 9.10 | 9.41 | 8.25 | 7.54 | 7.46 |
| Material production | 279.68 | 256.88 | 230.24 | 231.69 | 204.10 | 2.44 | 2.50 | 2.18 | 2.08 | 1.98 | |
| Water supply | −721.45 | −691.83 | −521.71 | −446.24 | −385.80 | −6.30 | −6.74 | −4.95 | −4.00 | −3.74 | |
| Regulating service | Gas regulation | 1018.20 | 933.36 | 835.30 | 842.89 | 736.69 | 8.89 | 9.09 | 7.93 | 7.56 | 7.14 |
| Climate regulation | 917.85 | 836.36 | 764.58 | 814.77 | 712.05 | 8.01 | 8.14 | 7.25 | 7.31 | 6.90 | |
| Environment purification | 610.02 | 537.19 | 535.78 | 592.38 | 505.90 | 5.32 | 5.23 | 5.08 | 5.31 | 4.90 | |
| Hydrological adjusting | 5862.90 | 5312.52 | 5923.46 | 6083.63 | 6223.58 | 51.17 | 51.73 | 56.20 | 54.57 | 60.30 | |
| Support service | Soil conservation | 743.39 | 674.28 | 605.41 | 633.65 | 535.72 | 6.49 | 6.57 | 5.74 | 5.68 | 5.19 |
| Nutrient cycling | 158.50 | 146.17 | 130.52 | 128.87 | 114.77 | 1.38 | 1.42 | 1.24 | 1.16 | 1.11 | |
| Biodiversity | 981.15 | 825.20 | 739.01 | 900.99 | 573.50 | 8.56 | 8.04 | 7.01 | 8.08 | 5.56 | |
| Cultural service | Landscape | 565.90 | 472.78 | 427.70 | 525.36 | 330.36 | 4.94 | 4.60 | 4.06 | 4.71 | 3.20 |
| Value Coefficient | ESV (million yuan) | CS | ||||||||
|---|---|---|---|---|---|---|---|---|---|---|
| 2000 | 2005 | 2010 | 2015 | 2020 | 2000 | 2005 | 2010 | 2015 | 2020 | |
| Cultivated land (+50.0%) | 13,196.29 | 11,887.70 | 11,980.37 | 12,522.41 | 11,584.74 | 0.303 | 0.315 | 0.273 | 0.246 | 0.245 |
| Cultivated land (−50.0%) | 9721.27 | 8651.75 | 9098.79 | 9774.38 | 9056.01 | |||||
| Forestland (+50.0%) | 11,655.00 | 10,481.48 | 10,732.80 | 11,335.71 | 10,528.46 | 0.034 | 0.041 | 0.037 | 0.034 | 0.040 |
| Forestland (−50.0%) | 11,262.55 | 10,057.96 | 10,346.36 | 10,961.08 | 10,112.30 | |||||
| Grassland (+50.0%) | 11,481.06 | 10,305.65 | 10,575.29 | 11,174.11 | 10,448.57 | 0.004 | 0.007 | 0.007 | 0.005 | 0.025 |
| Grassland (−50.0%) | 11,436.49 | 10,233.79 | 10,503.86 | 11,122.69 | 10,192.19 | |||||
| Wetland pits (+50.0%) | 13,868.63 | 12,177.42 | 12,140.58 | 13,342.95 | 11,263.51 | 0.421 | 0.372 | 0.304 | 0.394 | 0.183 |
| Wetland pits (−50.0%) | 9048.93 | 8362.03 | 8938.58 | 8953.84 | 9377.24 | |||||
| Trench and lakes (+50.0%) | 12,822.30 | 11,631.23 | 12,538.64 | 12,941.00 | 12,936.80 | 0.238 | 0.265 | 0.379 | 0.322 | 0.507 |
| Trench and lakes (−50.0%) | 10,095.25 | 8908.22 | 8540.51 | 9355.79 | 7703.96 | |||||
Publisher’s Note: MDPI stays neutral with regard to jurisdictional claims in published maps and institutional affiliations. |
© 2022 by the authors. Licensee MDPI, Basel, Switzerland. This article is an open access article distributed under the terms and conditions of the Creative Commons Attribution (CC BY) license (https://creativecommons.org/licenses/by/4.0/).
Share and Cite
Gong, Y.; Cai, M.; Yao, L.; Cheng, L.; Hao, C.; Zhao, Z. Assessing Changes in the Ecosystem Services Value in Response to Land-Use/Land-Cover Dynamics in Shanghai from 2000 to 2020. Int. J. Environ. Res. Public Health 2022, 19, 12080. https://doi.org/10.3390/ijerph191912080
Gong Y, Cai M, Yao L, Cheng L, Hao C, Zhao Z. Assessing Changes in the Ecosystem Services Value in Response to Land-Use/Land-Cover Dynamics in Shanghai from 2000 to 2020. International Journal of Environmental Research and Public Health. 2022; 19(19):12080. https://doi.org/10.3390/ijerph191912080
Chicago/Turabian StyleGong, Yuan, Mengmeng Cai, Lei Yao, Linsong Cheng, Chunxu Hao, and Zheng Zhao. 2022. "Assessing Changes in the Ecosystem Services Value in Response to Land-Use/Land-Cover Dynamics in Shanghai from 2000 to 2020" International Journal of Environmental Research and Public Health 19, no. 19: 12080. https://doi.org/10.3390/ijerph191912080
APA StyleGong, Y., Cai, M., Yao, L., Cheng, L., Hao, C., & Zhao, Z. (2022). Assessing Changes in the Ecosystem Services Value in Response to Land-Use/Land-Cover Dynamics in Shanghai from 2000 to 2020. International Journal of Environmental Research and Public Health, 19(19), 12080. https://doi.org/10.3390/ijerph191912080