
How Does Topography Affect the Value of Ecosystem Services? An Empirical Study from the Qihe Watershed
Abstract
:1. Introduction
2. Data Sources and Research Methods
2.1. Study Area
2.2. Data Sources and Initial Data Processing
2.3. Methodology
- (1)
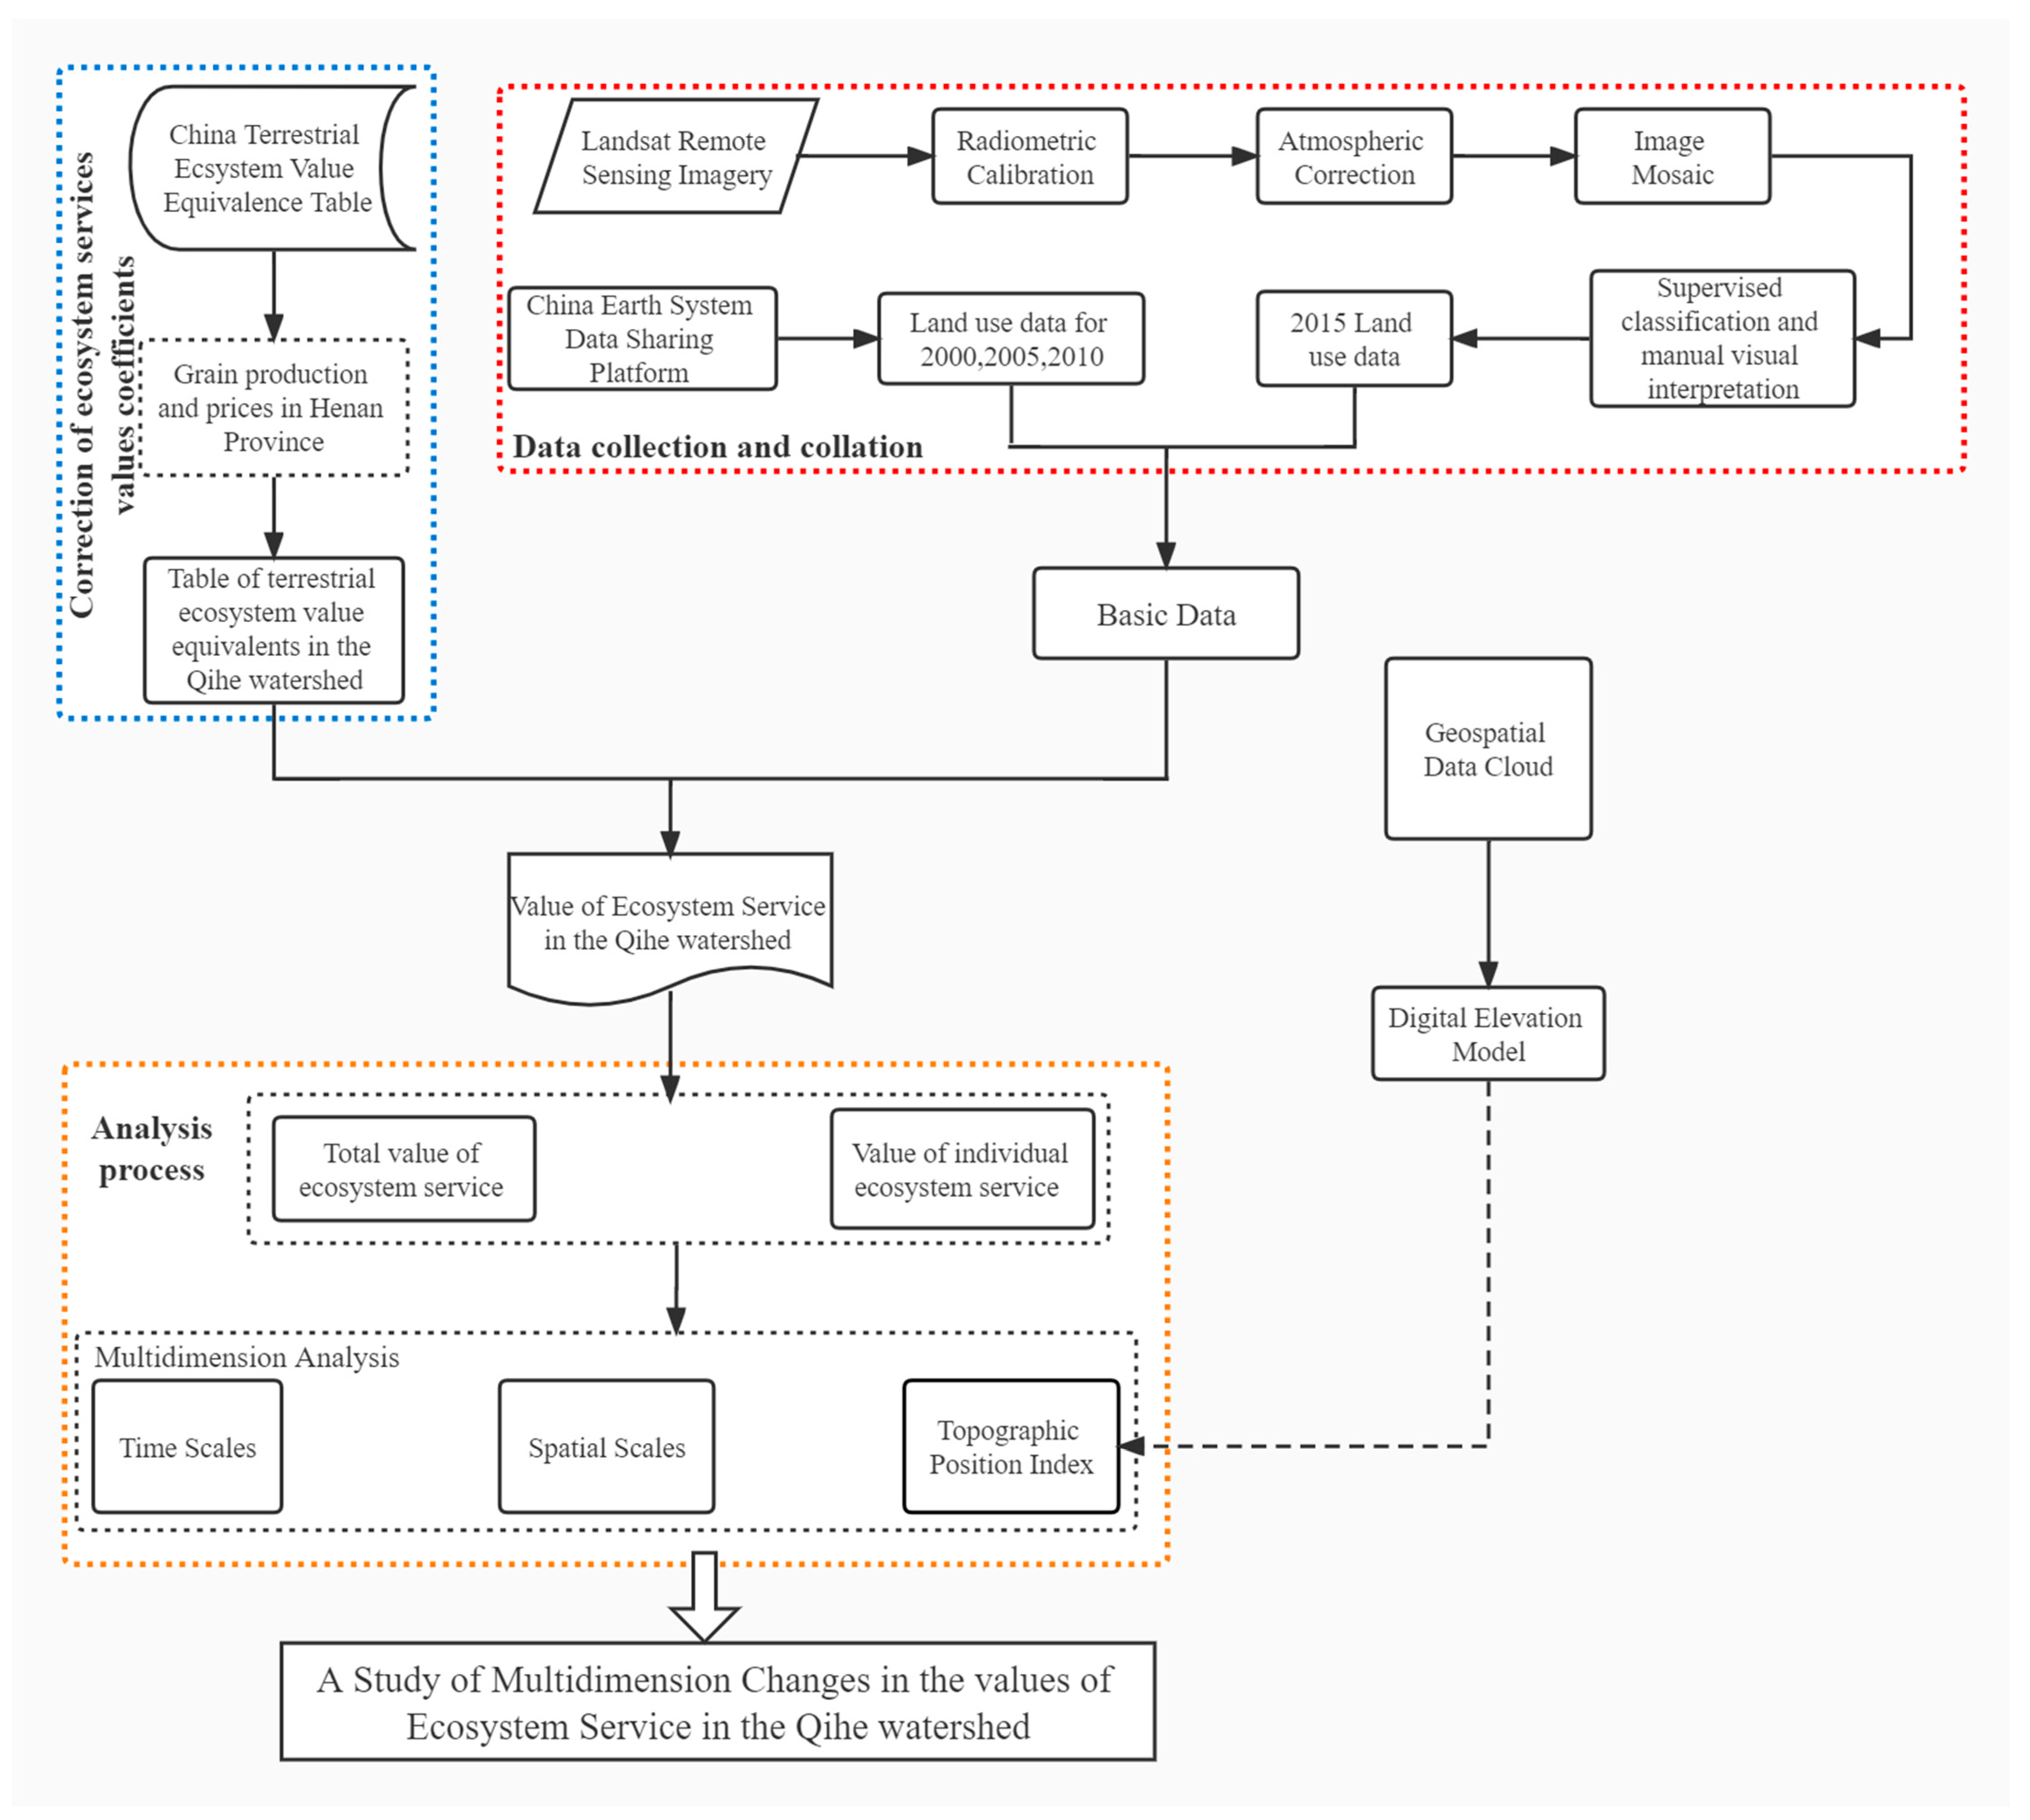
- Data preparation: In 2015, land-use data from the Qihe watershed were obtained using human–computer interactive visual interpretation and field survey of remote sensing images, based on reference to land-use maps of previous years. Additionally, land-use data for 2000, 2005, and 2010 were downloaded from the China Earth System Data Sharing Platform—Middle and Lower Yellow River Scientific Data Center. Socio-economic data and other relevant data were extracted from the China Statistical Yearbook (2000–2015) and Henan Provincial Statistical Yearbook (2000–2015). DEM data were obtained from the Geospatial Data Cloud Platform.
- (2)
- Ecosystem service value accounting: The existing China terrestrial ecosystem services table could not be directly applied to the calculation of regional ESV. Consequently, its parameters were corrected using grain production and prices from Henan Province. Further integration of historical land-use data was then performed to estimate the value of ecosystem services in the years 2000, 2005, 2010, and 2015.
- (3)
- Multi-dimensional change analysis of ESV: A comprehensive analysis of the changes in the total ESV and individual ESVs in three dimensions (i.e., spatial, temporal, and TPI) was performed.
2.3.1. Estimating the Value of Ecosystem Services
2.3.2. Single Land-Use Dynamic Approach
2.3.3. Topographic Position Index (TPI)
2.3.4. Sensitivity Analysis of Ecosystem Service Values
3. Results
3.1. Land-Use/Cover Changes in the Qihe Watershed
3.2. Changes in the Value of Ecosystem Services in the Qihe Watershed
3.2.1. Temporal Change
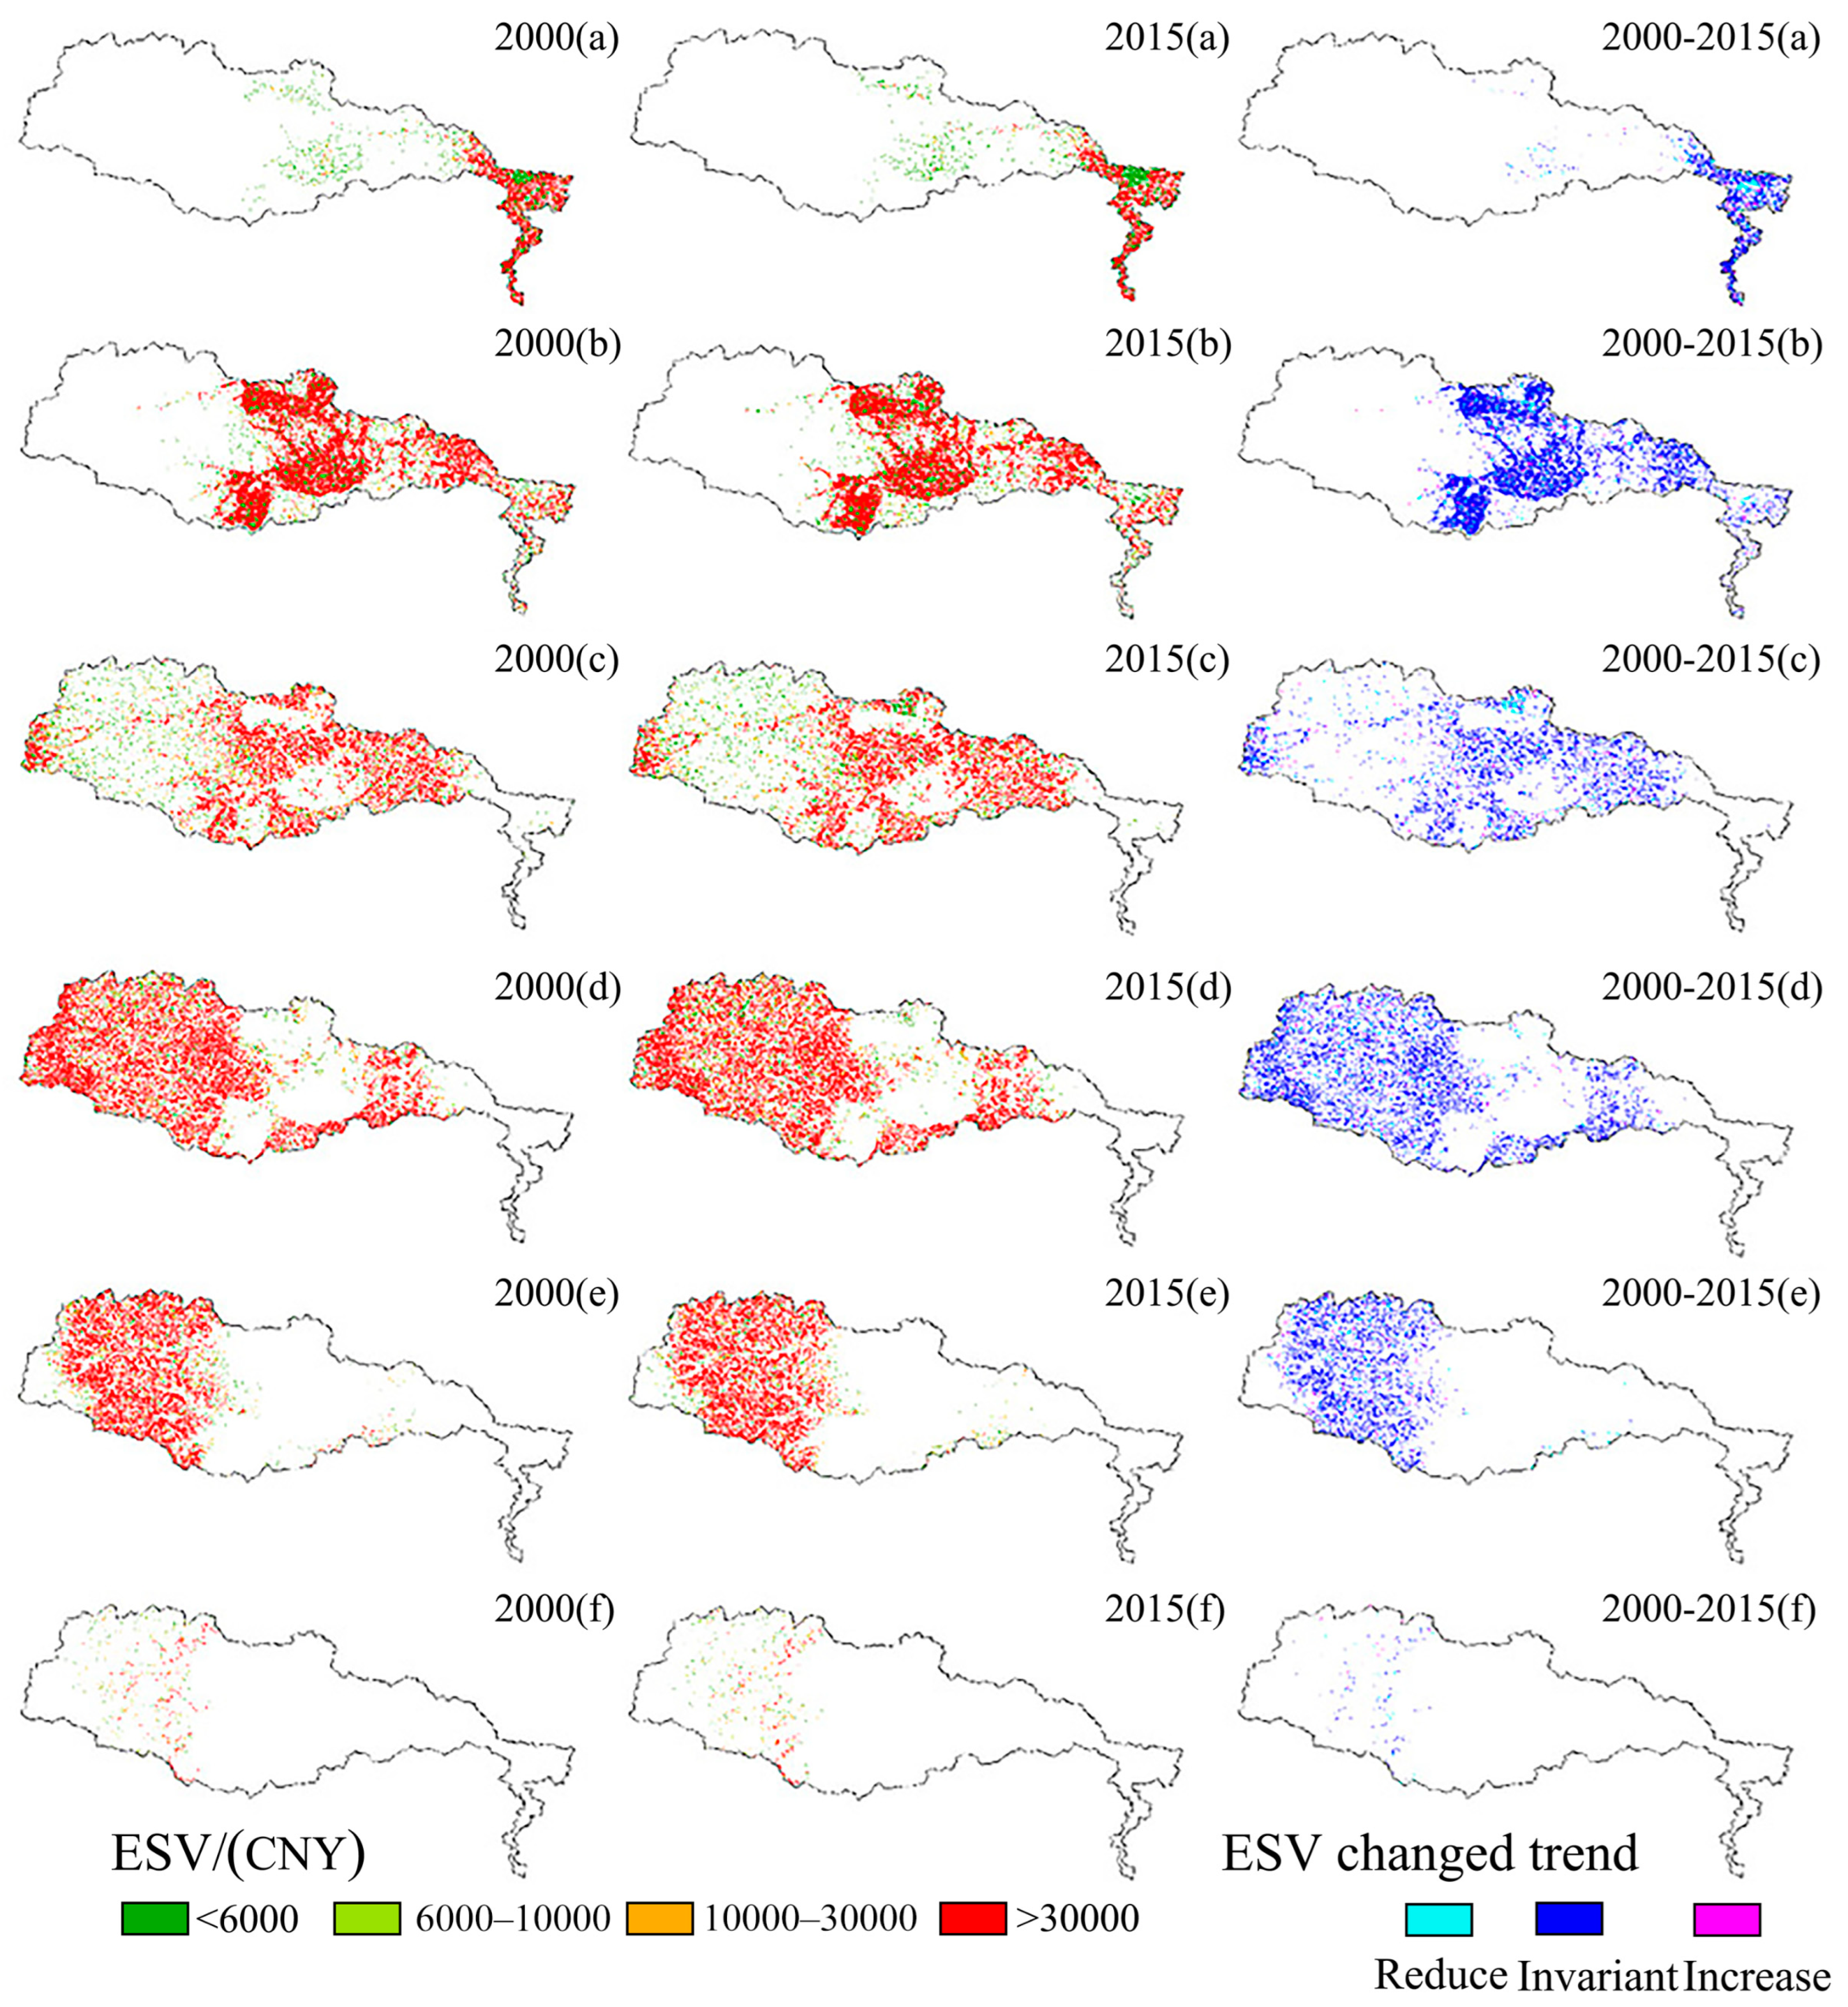
3.2.2. Spatial Variation
3.3. Analysis of the TPI of ESVs
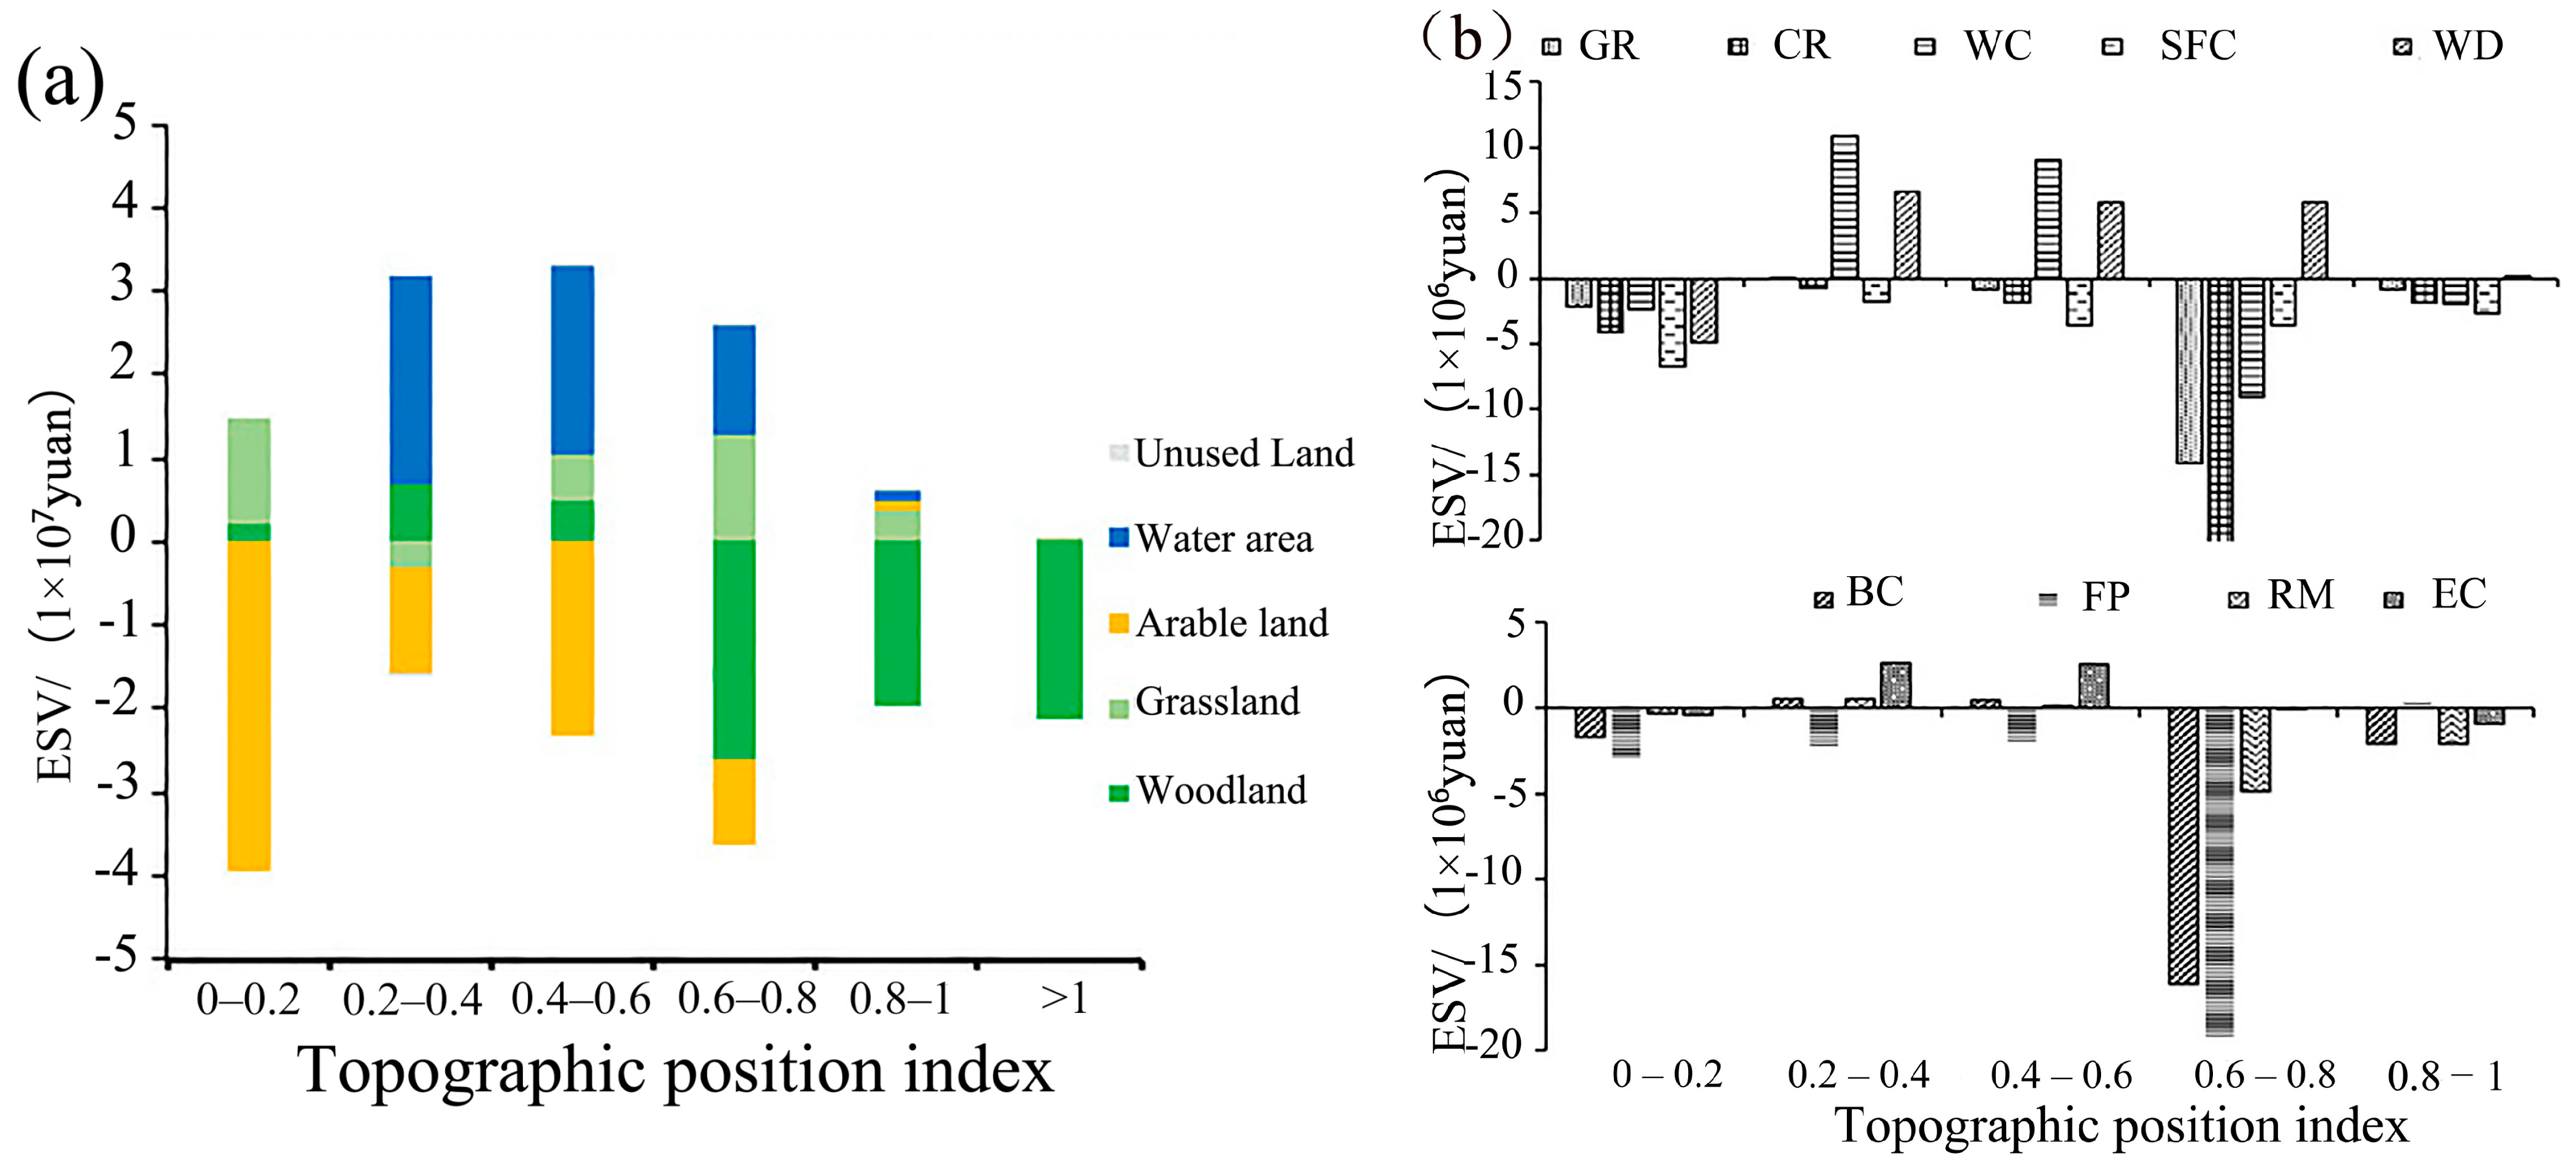
3.3.1. Topographic Factor Analysis of ESV Change
3.3.2. Spatial Characteristics of TPI of Ecosystem Service Value Change
3.4. Sensitivity Analysis of the ESVs in the Qihe Watershed
4. Discussion
5. Conclusions
- (1)
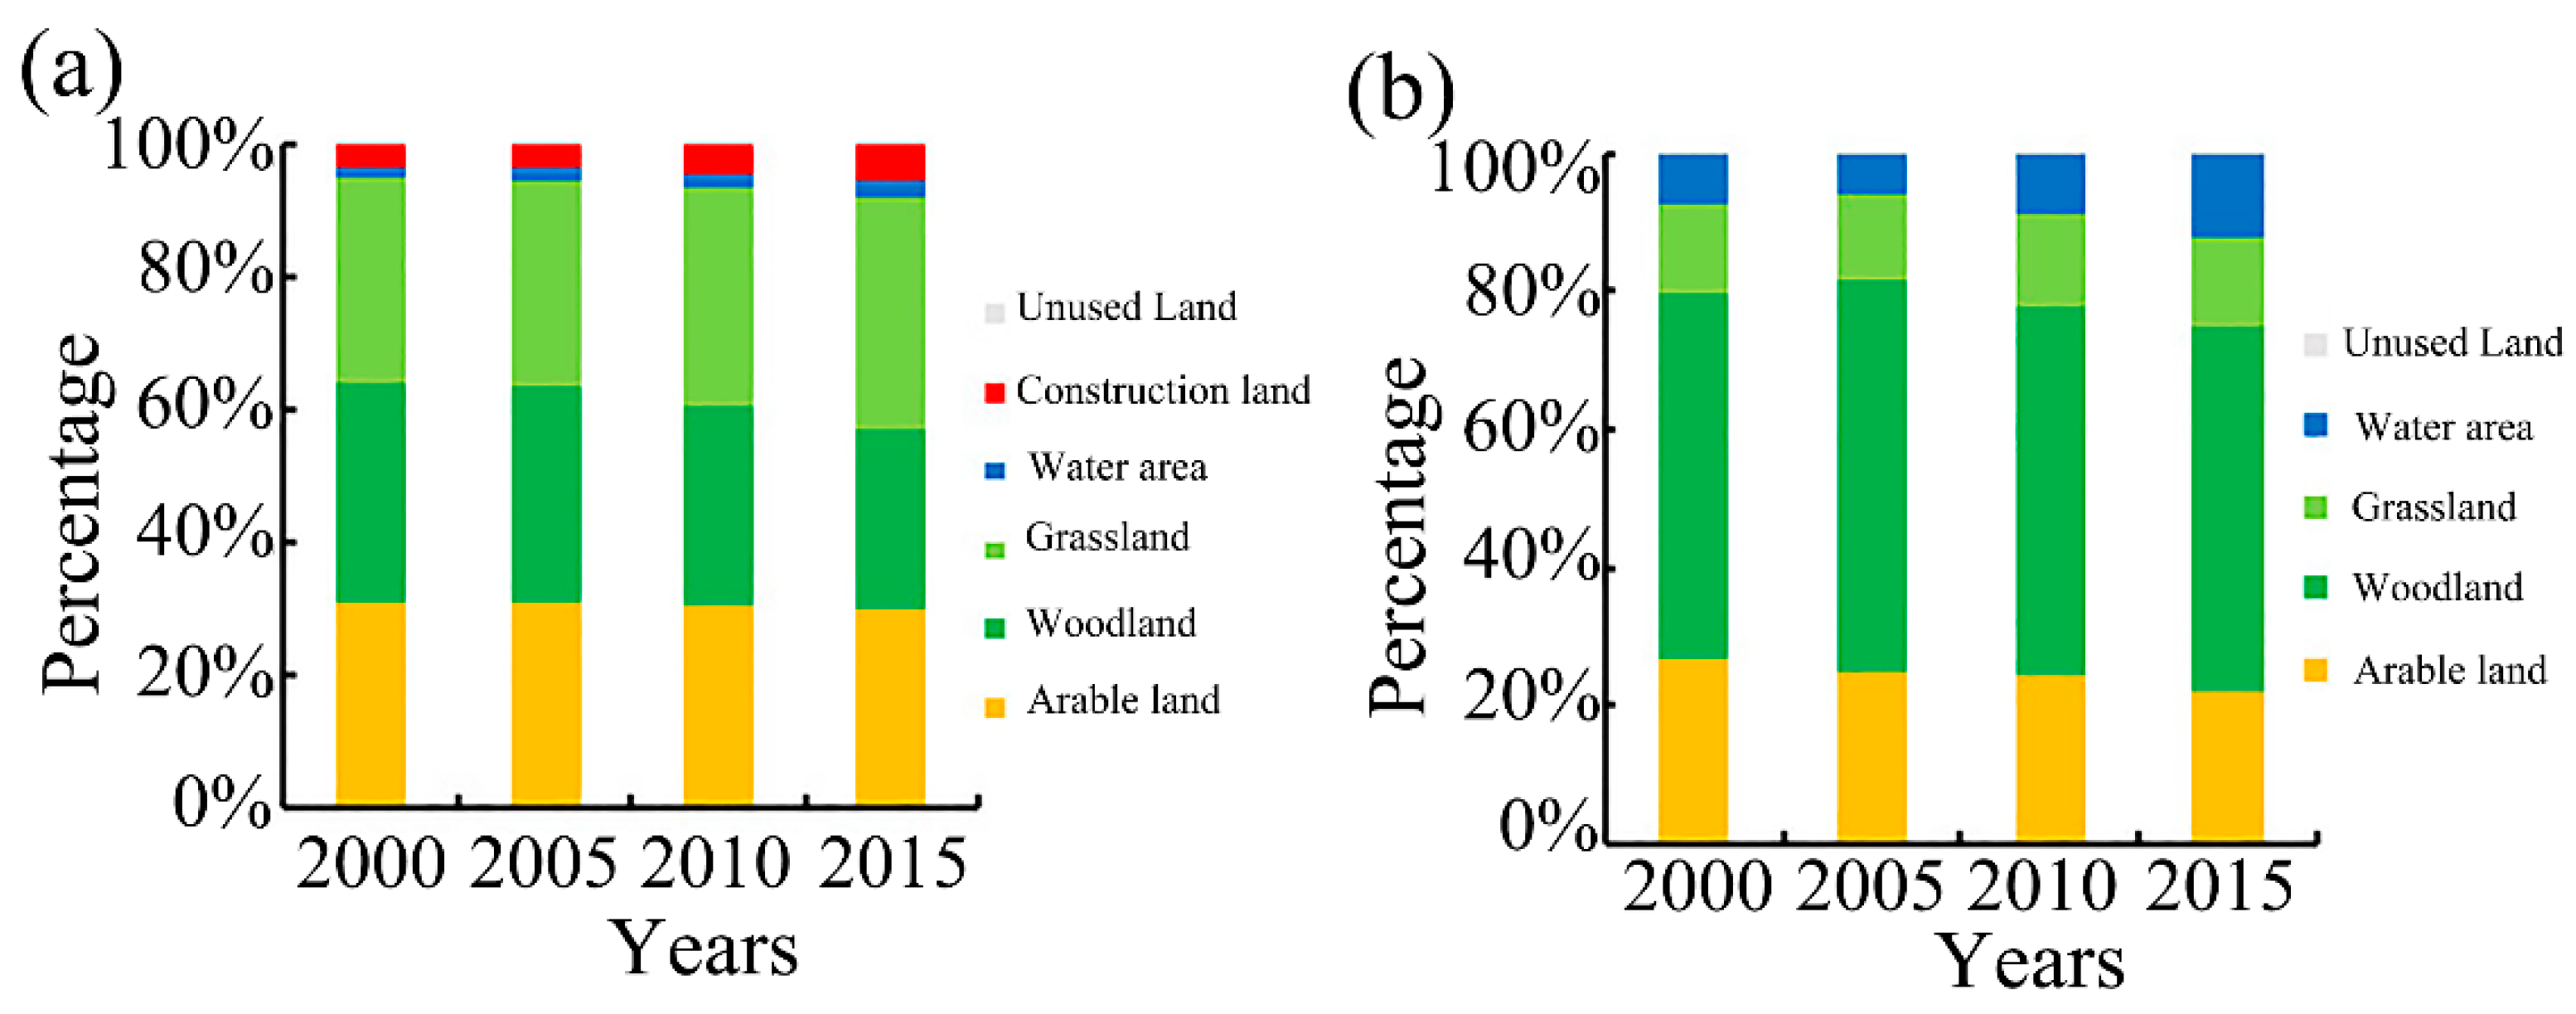
- The land-use types in the Qihe watershed from 2000 to 2015 were mainly arable land, forest land, and grassland, the sum of which accounts for more than 90% of the total area. The land-use/cover changes were obvious as the areas of cultivated land and forest land decreased by 12,971.61 ha and 2104.05 ha, respectively, and the areas of grassland and water increased by 8854.38 ha and 43,234.8 ha, respectively.
- (2)
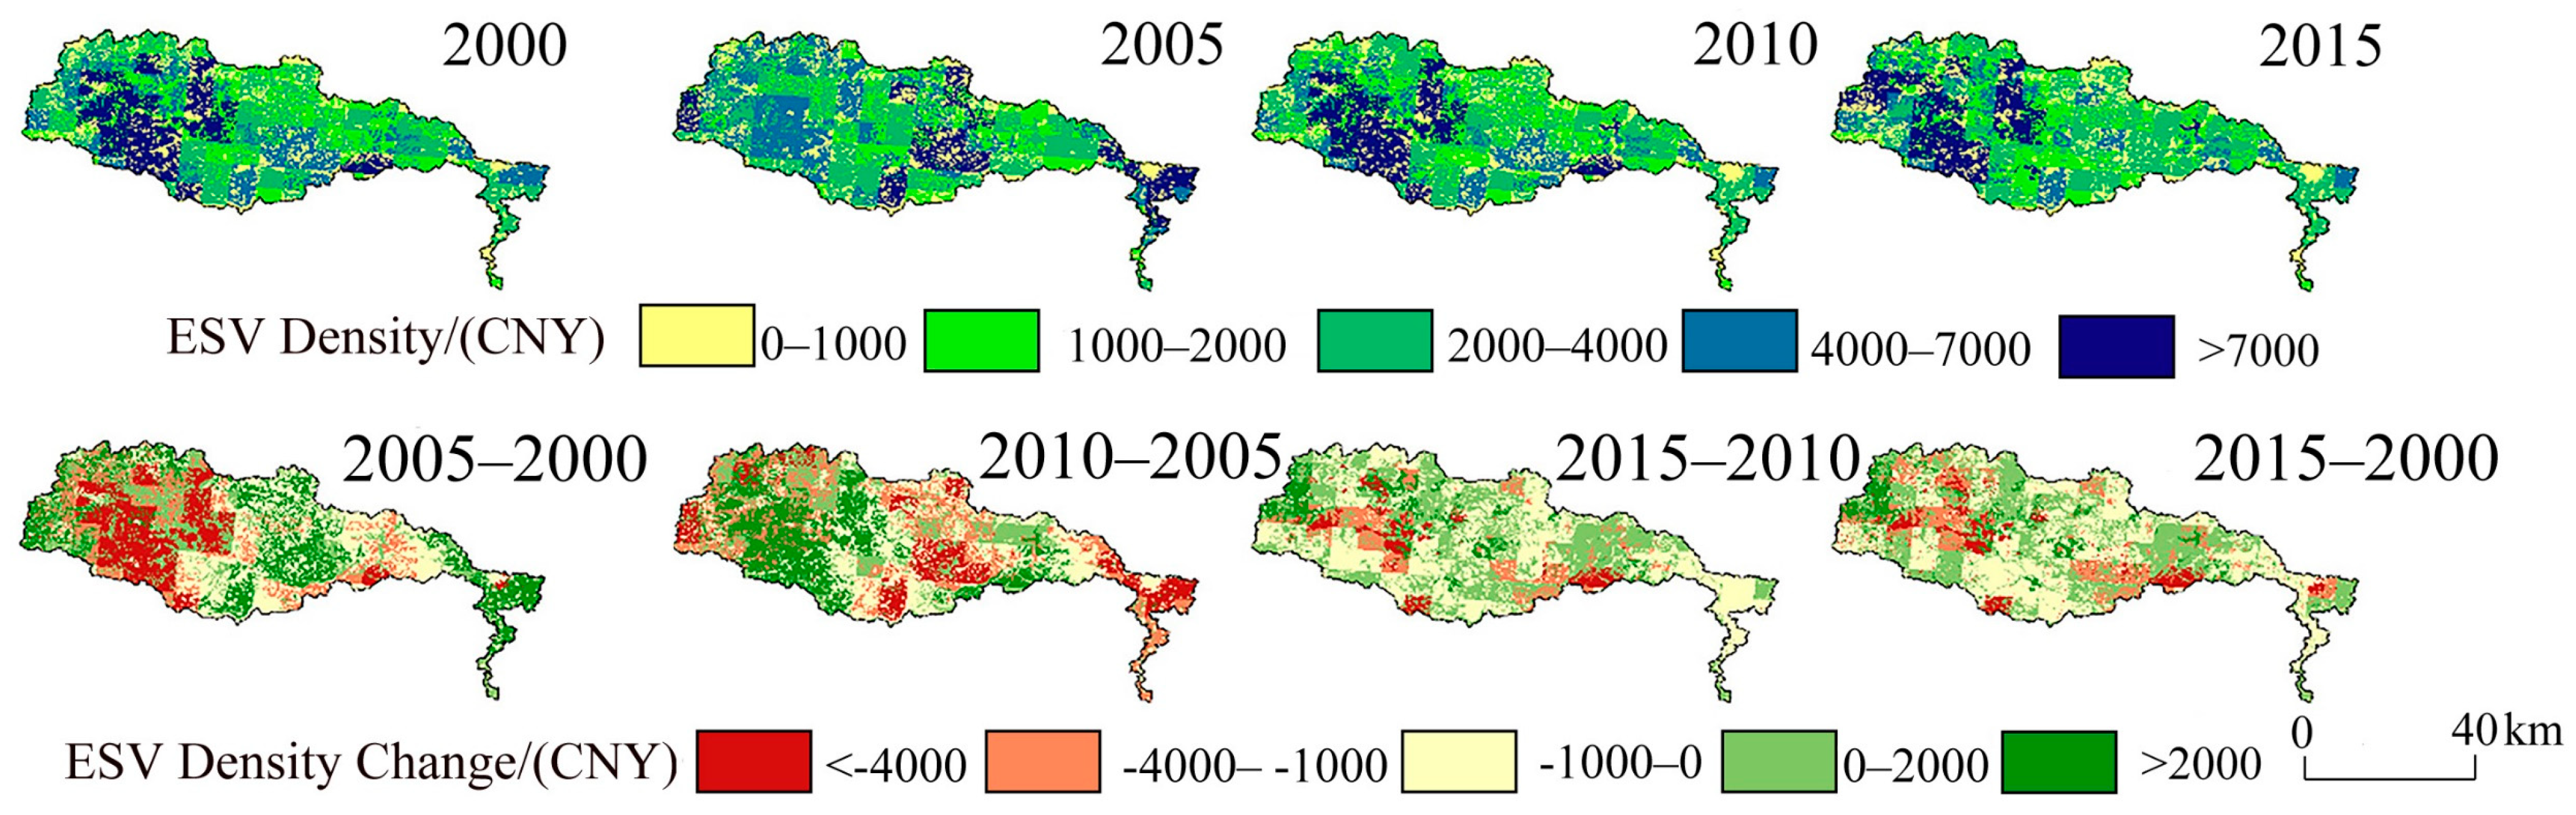
- The ESV in the Qihe watershed decreased by CNY 0.14 billion from 2000 to 2015. During the study period, the total ESV increased, then decreased, and then increased again. The highest ESV occurred in 2015, with a value of CNY 1.981 billion. The contribution level of each individual ESV remained stable, with waste treatment exhibiting the highest contribution level of 18.84%, followed by soil formation and protection.
- (3)
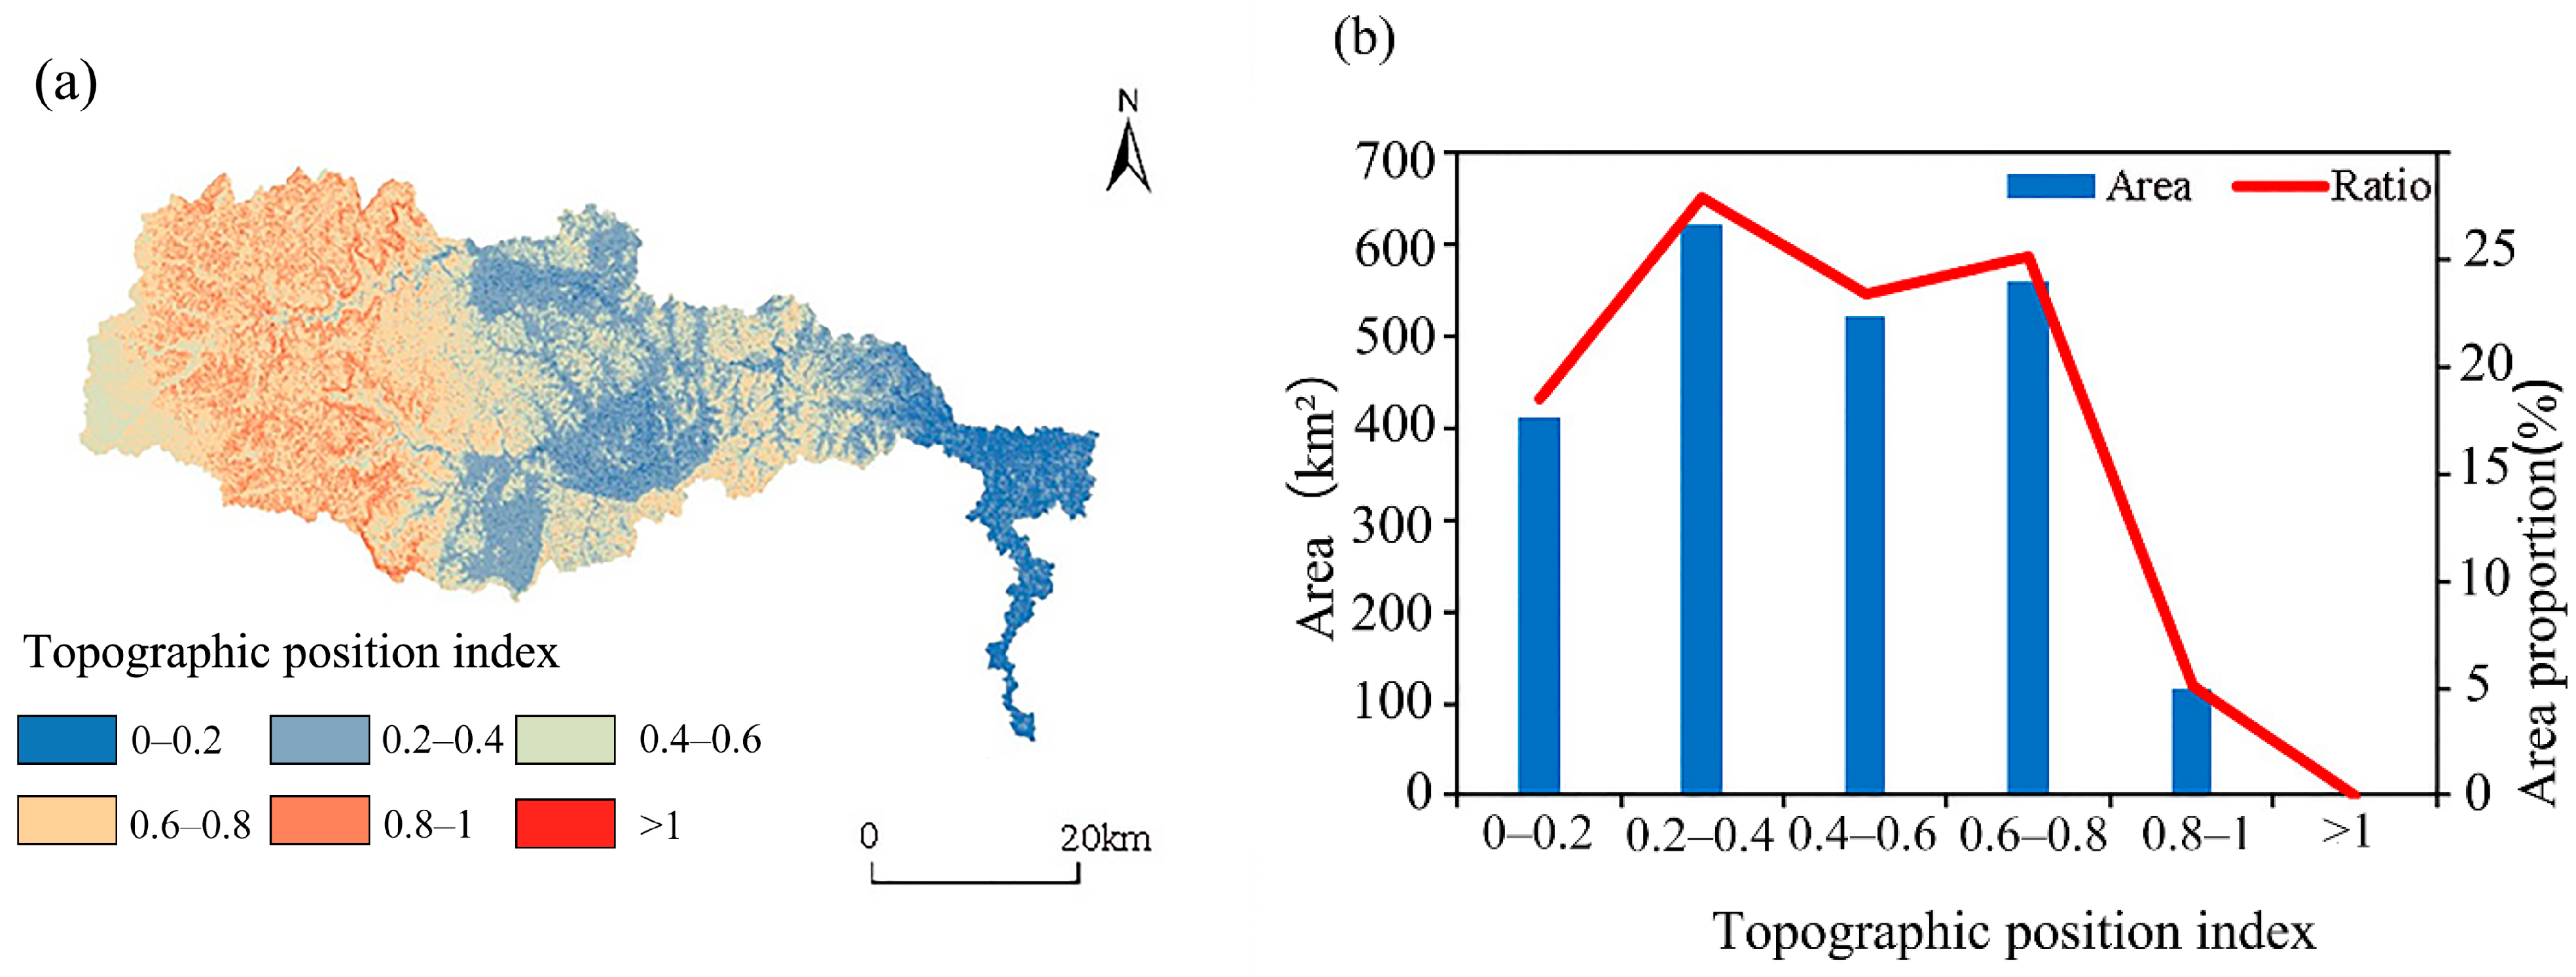
- There was a significant influence of topography on the ESV. The largest decrease of CNY 39.52 million in cropland ESV and the largest increase of CNY 12.56 million in grassland ESV occurred within the 0–0.2 TPI range. The largest increase in the 0.2–0.4 TPI range was that of water ESV (CNY 25.19 million) and the largest decrease in the 0.6–0.8 TPI range was that of grass ESV (CNY 25.89 million). The largest reductions in individual ESVs were observed in the 0.6–0.8 TPI range. The ESV of water supply increased by CNY 10.98 million and 9.07 million within the areas of TPI in the 0.2–0.4 and 0.4–0.6 intervals, respectively.
- (4)
- The sensitivity index of the ESV in the Qihe watershed is less than 1. This implies a certain lack of elasticity for the value coefficient and characterizes the robustness of the research results in this paper.
Author Contributions
Funding
Institutional Review Board Statement
Informed Consent Statement
Data Availability Statement
Conflicts of Interest
References
- Gamfeldt, L.; Snäll, T.; Bagchi, R.; Jonsson, M.; Gustafsson, L.; Kjellander, P.; Ruizjaen, M.C.; Fröberg, M.; Stendall, J.; Philipson, C.D.; et al. Higher levels of multiple ecosystem services are found in forests with more tree species. Nat. Commun. 2013, 4, 1340–1348. [Google Scholar] [CrossRef] [PubMed]
- Zhong, L.; Wang, J.; Zang, X.; Ying, L.X. Effects of agricultural land consolidation on ecosystem services: Trade-offs and synergies. J. Clean. Prod. 2020, 264, 121412. [Google Scholar] [CrossRef]
- Polasky, S.; Tallis, H.; Reyers, B. Setting the bar: Standards for ecosystem services. Proc. Natl. Acad. Sci. USA 2015, 112, 7356–7361. [Google Scholar] [CrossRef] [PubMed]
- Liang, Y.; Song, W. Integrating potential ecosystem services losses into ecological risk assessment of land use changes: A case study on the Qinghai-Tibet Plateau. J. Environ. Manag. 2022, 318, 115607. [Google Scholar] [CrossRef] [PubMed]
- Toman, M.; Speclal, S. Forum on valuation of Ecosystem Services: Why not to calculate the value of the world’s ecosystem services and natural capital. Ecol. Econ. 2004, 25, 57–60. [Google Scholar] [CrossRef]
- Salzman, J.; Bennett, G.; Carroll, N.; Goldstein, A.; Jenkins, M. The global status and trends of Payments for Ecosystem Services. Nat. Sustain. 2018, 1, 136–144. [Google Scholar] [CrossRef]
- Ren, H.; Zhang, J.J.; Zhu, W.B.; Wang, L.Y.; Zhang, L.J.; Zhu, L.Q. Impact of land use change on habitat in the Qihe River Basin of Taihang Mountains. Prog. Geogr. 2018, 37, 1693–1704. (In Chinese) [Google Scholar]
- He, S.S.; Ye, L.P.; Zhu, W.B.; Cui, Y.P.; Zhu, L.Q. Soil erosion and water supply change in Qihe watershed of Taihang Mountains from 2000 to 2015. Geogr. Res. 2018, 37, 1775–1787. (In Chinese) [Google Scholar]
- Li, Y.S.; Zhun, G.J.; Liang, T.; Wu, L.X.; Liu, W.J. Study of land use change on the gains and losses of ecosystem service function values of Chaohu Lake Basin. Geogr. Res. 2009, 28, 1656–1664. (In Chinese) [Google Scholar]
- Song, W.; Deng, X.Z. Land-use/land-cover change and ecosystem service provision in China. Sci. Total Environ. 2017, 576, 705–719. [Google Scholar] [CrossRef]
- Costanza, R.; D’Arge, R.; De Groot, R.; Farber, S.; Grasso, M.; Hannon, B.; Limburg, K.; Naeem, S.; O’Neill, R.V.; Paruelo, J.; et al. The value of the world’s ecosystem services and natural capital. Nature 1997, 387, 253–260. [Google Scholar] [CrossRef]
- Sutton, P.C.; Costanza, R. Global estimates of market and non-market values derived from nighttime satellite imagery, land cover and ecosystem service valuation. Ecol. Econ. 2002, 41, 509–527. [Google Scholar] [CrossRef]
- Costanza, R.; Groot, R.D.; Sutton, P.; Ploeg, S.; Anderson, S.J.; Kubiszewski, I.; Farber, S.; Turner, R.K. Changes in the global value of ecosystem services. Glob. Environ. Chang. 2014, 26, 152–158. [Google Scholar] [CrossRef]
- Costanza, R.; Groot, R.D.; Braat, L.; Kubiszewski, I.; Fioramonti, L.; Sutton, P.; Farber, S.; Grasso, M. Twenty years of ecosystem services: How far have we come and how far do we still need to go? Ecosyst. Serv. 2017, 28, 1–16. [Google Scholar] [CrossRef]
- Ouyang, Z.Y.; Zhu, C.Q.; Yang, G.B.; Xu, W.H.; Zheng, H.; Zhang, Y.; Xiao, Y. Gross ecosystem product: Concept, Accounting framework and case study. Acta Ecol. Sin. 2013, 33, 6747–6761. (In Chinese) [Google Scholar] [CrossRef]
- Ouyang, Z.Y.; Zheng, H.; Xiao, Y.; Polasky, S.; Liu, J.G.; Xu, W.H.; Wang, Q.; Zhang, L.; Xiao, Y.; Rao, E.; et al. Improvements in ecosystem services from investments in natural capital. Science 2016, 352, 1455–1459. [Google Scholar] [CrossRef]
- Xie, G.D.; Zhang, C.; Zhang, L.M.; Xiao, Y.; Lu, C.X. Improvement of the evaluation method for ecosystem service value based on Per Unit Area. J. Nat. Resour. 2015, 30, 1243–1254. (In Chinese) [Google Scholar]
- Xie, G.D.; Lu, C.X.; Leng, Y.F.; Zheng, D.; Li, S.C. Ecological assets valuation of the Tibetan Plateau. J. Nat. Resour. 2003, 18, 189–196. (In Chinese) [Google Scholar]
- Xie, G.D.; Zhen, L.; Lu, C.X.; Xiao, Y.; Chen, C. Expert knowledge based valuation method of ecosystem services in China. J. Nat. Resour. 2008, 23, 911–919. (In Chinese) [Google Scholar]
- Ouyang, Z.Y.; Wang, R.S.; Zhao, J.Z. Ecosystem services and their economic valuation. Chin. J. Appl. Ecol. 1999, 10, 635–640. (In Chinese) [Google Scholar]
- Assessment, M.E. Ecosystems and Human Well-Being; Island Press: Washington, DC, USA, 2005. [Google Scholar]
- Li, Z.H.; Dong, S.C.; Li, F.J.; Li, Y.; Wan, Y.K. Scenario analysis of ecological effects of urbanization in Wuwei oasis, China. J. Desert Res. 2012, 33, 937–942. [Google Scholar]
- Power, M. The planetary piggy bank. Nature 1997, 388, 529–530. [Google Scholar] [CrossRef]
- Hossain, M.S.; Dearing, J.A.; Rahman, M.M.; Salehin, R. Recent changes in ecosystem services and human well-being in the coastal areas of Bangladesh. Reg. Environ. Chang. 2016, 16, 429–443. [Google Scholar] [CrossRef]
- Boyd, J.; Banzhaf, S. What are ecosystem services? The need for standardized environmental accounting units. Ecol. Econ. 2007, 63, 616–626. [Google Scholar] [CrossRef]
- Zhu, W.B.; Li, S.C. A diagnostic framework of payments for ecosystem services and associated case studies. Acta Ecol. Sin. 2014, 34, 2460–2469. (In Chinese) [Google Scholar]
- Fu, Q.; Hou, Y.; Wang, B.; Bi, X.; Li, B.; Zhang, X.S. Scenario analysis of ecosystem service changes and interactions in a mountain-oasis-desert system: A case study in Altay Prefecture, China. Sci. Rep. 2018, 8, 12939–12952. [Google Scholar] [CrossRef]
- Li, J.L.; Shi, X.Y.; Zhu, Y.C. Environmental impact assessment of Puyang land use planning based on theory of ecosystem services value. Popul. Resour. Environ. China 2015, 25, 255–258. (In Chinese) [Google Scholar]
- Liu, Y.Q.; Liao, L.W.; Long, H.L.; Qin, J.X. Effects of land use transitions on ecosystem services value: A case study of Hunan province. Geogr. Res. 2015, 34, 691–700. (In Chinese) [Google Scholar]
- Li, X.W.; Fang, J.Y.; Piao, S.L. Land use changes and its implication to the ecological consequences in lower Yangtze Region. Acta Geogr. Sin. 2003, 58, 659–667. (In Chinese) [Google Scholar]
- Rietveld, J.; Schilling, M.A.; Bellavitis, C. Platform strategy: Managing ecosystem value through selective promotion of complements. Organ. Sci. 2019, 30, 1232–1251. [Google Scholar] [CrossRef]
- Bai, Y.; Wong, C.P.; Jiang, B.; Hughes, A.C.; Wang, M.; Wang, Q. Developing China’s Ecological Redline Policy using ecosystem services assessments for land use planning. Nat. Commun. 2018, 9, 3034–3047. [Google Scholar] [CrossRef]
- Renard, D.; Rhenmtulla, J.M.; Bennett, E.M. Historical dynamics in ecosystem service bundles. Proc. Natl. Acad. Sci. USA 2015, 112, 13411–13416. [Google Scholar] [CrossRef] [PubMed] [Green Version]
- Zhang, Z.; Xia, F.; Yang, D.; Huo, J.; Wang, G.; Chen, H. Spatiotemporal characteristics in ecosystem service value and its interaction with human activities in Xinjiang, China. Ecol. Indic. 2020, 110, 105826. [Google Scholar] [CrossRef]
- Han, R.; Feng, C.C.; Xu, N.; Guo, L. Spatial heterogeneous relationship between ecosystem services and human disturbances: A case study in Chuandong, China. Sci. Total Environ. 2020, 721, 137818. [Google Scholar] [CrossRef] [PubMed]
- Fang, L.; Wang, L.; Chen, W.; Sun, J.; Cao, Q.; Wang, S.; Wang, L. Identifying the impacts of natural and human factors on ecosystem service in the Yangtze and Yellow River Basins. J. Clean. Prod. 2021, 314, 127995. [Google Scholar] [CrossRef]
- Liu, S.; Sun, Y.; Wu, X.; Li, W.; Liu, Y.; Tran, L. Driving Factor Analysis of Ecosystem Service Balance for Watershed Management in the Lancang River Valley, Southwest China. Land 2021, 10, 522. [Google Scholar] [CrossRef]
- He, C.; Shao, H.; Xian, W. Spatiotemporal Variation and Driving Forces Analysis of Eco-System Service Values: A Case Study of Sichuan Province, China. Int. J. Environ. Res. Public Health 2022, 19, 8595. [Google Scholar] [CrossRef]
- Xu, N.Y.; Guo, L.; Xue, D.Y.; Sun, S.Q. Land use structure and the dynamic evolution of ecosystem service value in Gannan region, China. Acta Ecol. Sin. 2019, 39, 1969–1978. (In Chinese) [Google Scholar]
- Mueller, H.; Hamilton, D.P.; Doole, G.J. Evaluating services and damage costs of degradation of a major lake ecosystem. Ecosyst. Serv. 2016, 22, 370–380. [Google Scholar] [CrossRef]
- Zhang, Z.Y.; He, X.L.; Liu, L.; Li, Z.Q.; Wang, P.Y. Ecological service functions and value estimation of glaciers in the Tianshan Mountains, China. Acta Geogr. Sin. 2018, 73, 856–867. (In Chinese) [Google Scholar]
- Chen, W.J.; Jan, J.F.; Chung, C.H.; Liaw, S.C. Resident Willingness to Pay for Ecosystem Services in Hillside Forests. Int. J. Environ. Res. Public Health 2022, 19, 6193. [Google Scholar] [CrossRef] [PubMed]
- Richter, F.; Jan, P.; El, B.N.; Lüscher, A.; Buchmann, N.; Klaus, V.H. A guide to assess and value ecosystem services of grasslands. Ecosyst. Serv. 2021, 52, 101376. [Google Scholar] [CrossRef]
- Chen, C.; Liu, X.A.; Yan, L.L.; Wang, J.; Peng, P.H. Evaluation on Ecosystem Service Values of Sichuan Nanhe National Wetland Park. Wetl. Sci. 2018, 16, 238–244. [Google Scholar]
- Zhang, R.; Wang, Y.M.; Chang, J.X.; Li, Y.Y. Response of land use change to human activities in the Yellow River Basin based on water resources division. J. Nat. Resour. 2019, 34, 274–287. (In Chinese) [Google Scholar] [CrossRef]
- Li, L.; Zhu, W.B.; Li, Y.H.; Zhu, L.Q.; Xu, S.B.; Feng, X.X. Ecosystem Service Value Gains and Losses of Qihe River Basin Based on Topographic Gradient Characteristics. Res. Soil Water Conserv. 2019, 26, 287–295. (In Chinese) [Google Scholar]
- Xie, G.D.; Zhang, Y.L.; Lu, C.X.; Zheng, D.; Cheng, S.K. Study on valuation of rangeland ecosystem services of China. J. Nat. Resour. 2001, 16, 47–53. (In Chinese) [Google Scholar]
- Xu, L.M.; Li, H.; Chen, D.H.; Ye, L.Z.; Li, J.G.; Zhao, J.P. Spatial-temporal variability and driving force of ecosystem service: A case study of Bozhou in Xinjiang. J. Subtrop. Resour. Environ. 2018, 13, 66–74. (In Chinese) [Google Scholar]
- Liu, G.L.; Zhang, L.C.; Zhang, Q. Spatial and temporal dynamics of land use and its influence on ecosystem service value in Yangtze River Delta. Acta Ecol. Sin. 2014, 34, 3311–3319. (In Chinese) [Google Scholar]
- Zhang, J.J.; Zhu, W.B.; Zhao, F.; Zhu, L.Q.; Li, M.J.; Zhu, M.; Zhang, X.D. Spatial variations of terrain and their impacts on landscape patterns in the transition zone from mountains to plains—A case study of Qihe River Basin in the Taihang Mountains. Sci. China Earth Sci. 2018, 48, 476–486. (In Chinese) [Google Scholar] [CrossRef]
- Chen, Z.; Huang, Y.B.; Zhu, Z.P.; Zheng, Q.Q.; Que, C.X.; Dong, J.W. Landscape pattern evolution along terrain gradient in Fuzhou City, Fujian Province, China. Chin. J. Appl. Ecol. 2018, 29, 4135–4144. (In Chinese) [Google Scholar]


| Type I | Type II | Arable Land | Woodland | Grassland | Water Area | Unused Land |
|---|---|---|---|---|---|---|
| Adjustment Services | Gas Regulation (GR) | 515.37 | 2196.22 | 88.60 | 0.00 | 0.00 |
| Climate Regulation (CR) | 917.35 | 1770.13 | 219.42 | 407.00 | 0.00 | |
| Water Conservation (WC) | 618.44 | 2078.02 | 220.25 | 18,033.2 | 26.50 | |
| Support Services | Soil formation and conservation (SFC) | 1504.87 | 2575.16 | 353.56 | 8.80 | 17.70 |
| Waste Disposal (WD) | 1690.40 | 1419.60 | 1227.92 | 16,086.60 | 8.80 | |
| Biodiversity Conservation (BC) | 731.82 | 2195.01 | 580.43 | 2203.30 | 300.80 | |
| Supply Services | Food Production (FP) | 1030.73 | 462.67 | 802.33 | 88.50 | 8.80 |
| Raw Materials (RM) | 103.07 | 1601.40 | 4.97 | 8.50 | 0.00 | |
| Cultural Services | Entertainment Culture (EC) | 10.31 | 833.94 | 93.56 | 3840.20 | 8.80 |
| Total | 7122.36 | 15,132.15 | 3591.04 | 40,676.10 | 371.40 |
| Time | Category | Arable Land | Woodland | Grassland | Waters Area | Construction Land | Unused Land |
| 2000 | Area (ha) | 73,417 | 68,287.3 | 69,438.7 | 3596.49 | 7893.35 | 10.9705 |
| 2005 | 68,306.28 | 72,657.67 | 69,415.12 | 3603.19 | 8737.88 | 10.971 | |
| 2010 | 66,183.28 | 67,930.32 | 73,540.46 | 4063.92 | 10,932.70 | 79.67 | |
| 2015 | 60,445.36 | 66,183.25 | 78,293.08 | 5595.32 | 12,128.45 | 80.32 | |
| 2000–2005 | Area change (ha) | −5110.72 | 4370.37 | −23.58 | 6.70 | 844.53 | 0.00 |
| 2005–2010 | −2123 | −4727.35 | 4125.34 | 460.73 | 2194.82 | 67.61 | |
| 2010–2015 | −5737.92 | −1747.06 | 4752.61 | 1531.4 | 1195.75 | 0.69 | |
| 2000 | Percentage (%) | 32.97 | 30.67 | 31.21 | 1.62 | 3.52 | 0.01 |
| 2005 | 32.62 | 30.67 | 31.16 | 1.62 | 3.92 | 0.01 | |
| 2010 | 29.71 | 30.5 | 33.02 | 1.82 | 4.91 | 0.04 | |
| 2015 | 27.14 | 29.72 | 35.15 | 2.51 | 5.44 | 0.04 | |
| 2000–2005 | Single-motion Attitude (%) | −1.39 | 1.28 | −0.01 | 0.01 | 2.14 | 0.01 |
| 2005–2010 | −0.62 | −1.30 | 1.19 | 2.56 | 5.02 | 123.2 | |
| 2010–2015 | −1.73 | −0.51 | 1.29 | 7.54 | 2.19 | 0.17 |
| Land-Use | ESV/1 × 108 CNY | 2000–2005 | 2005–2010 | 2010–2015 | ||||||
|---|---|---|---|---|---|---|---|---|---|---|
| /Cover Type | 2000 | 2005 | 2010 | 2015 | Change Amount/1 × 108 CNY | Change Rate/% | Change Amount/1 × 108 CNY | Change Rate/% | Change Amount/1 × 108 CNY | Change Rate/% |
| Cultivated land | 5.23 | 4.87 | 4.71 | 4.31 | −0.36 | −7 | −0.15 | −3.12 | −0.41 | −8.67 |
| Forest land | 10.33 | 10.99 | 10.28 | 10.01 | 0.66 | 6 | −0.71 | −6.51 | −0.26 | −2.57 |
| Grassland | 2.49 | 2.5 | 2.64 | 2.81 | −0.01 | −0.4 | 0.14 | 5.6 | 0.17 | 6.43 |
| Waters | 1.46 | 1.47 | 1.65 | 2.28 | 0.0027 | 0.2 | 0.19 | 12.79 | 0.62 | 37.68 |
| Unused land | 0.00 | 0.00 | 0.00 | 0.00 | 0.00 | 0.00 | 0.00 | 0.00 | 0.00 | 0.00 |
| Construction Land | 0.00 | 0.00 | 0.00 | 0.00 | 0.00 | 0.00 | 0.00 | 0.00 | 0.00 | 0.00 |
| Total | 19.54 | 19.81 | 19.29 | 19.4 | 0.27 | 1.38 | −0.52 | −2.62 | 0.11 | 0.57 |
| Type I | Type II | 2000 | 2005 | 2010 | 2015 | Grade | ||||
|---|---|---|---|---|---|---|---|---|---|---|
| ESV | Contribution Rate | ESV | Contribution Rate | ESV | Contribution Rate | ESV | Contribution Rate | |||
| Adjustment Services | Gas Regulation (GR) | 1.94 | 9.92 | 2.01 | 10.15 | 1.9 | 9.85 | 1.83 | 9.43 | 6 |
| Climate Regulation (CR) | 2.05 | 10.49 | 2.08 | 10.5 | 1.99 | 10.32 | 1.92 | 9.9 | 5 | |
| Water Conservation (WC) | 2.67 | 13.66 | 2.73 | 13.78 | 2.72 | 14.11 | 2.93 | 15.1 | 3 | |
| Support Services | Soil formation And conservation (SFC) | 3.11 | 15.91 | 3.14 | 15.85 | 3.01 | 15.6 | 2.89 | 14.9 | 2 |
| Waste Disposal (WD) | 3.64 | 18.62 | 3.61 | 18.22 | 3.63 | 18.82 | 3.82 | 19.69 | 1 | |
| Biodiversity Conservation (BC) | 2.52 | 12.89 | 2.58 | 13.02 | 2.49 | 12.91 | 2.47 | 12.73 | 4 | |
| Supply Services | Food Production (FP) | 1.66 | 8.49 | 1.6 | 8.07 | 1.59 | 8.24 | 1.56 | 8.04 | 7 |
| Raw Materials (RM) | 1.17 | 5.98 | 1.24 | 6.26 | 1.16 | 6.01 | 1.12 | 5.77 | 8 | |
| Cultural Services | Entertainment Culture (EC) | 0.78 | 3.99 | 0.82 | 4.14 | 0.8 | 4.14 | 0.85 | 4.38 | 9 |
| Total | 19.54 | 100 | 19.81 | 100 | 19.29 | 100 | 19.4 | 100 | - | |
| ESV/(CNY Billion) | Amount of Change/(CNY Billion) | Sensitivity Index (CS) | ||||||||||
|---|---|---|---|---|---|---|---|---|---|---|---|---|
| Value Factor | 2000 | 2005 | 2010 | 2015 | 2000–2005 | 2005–2010 | 2010–2015 | 2000–2015 | 2000 | 2005 | 2010 | 2015 |
| Cultivated land VC + 50% | 22.13 | 22.25 | 21.64 | 21.56 | 0.12 | −0.61 | −0.08 | −0.57 | 0.27 | 0.25 | 0.24 | 0.22 |
| Cultivated land VC-50% | 16.90 | 17.39 | 16.93 | 17.26 | 0.49 | −0.46 | 0.32 | 0.36 | ||||
| Forestland VC + 50% | 24.69 | 25.32 | 24.43 | 24.42 | 0.63 | −0.89 | −0.01 | −0.27 | 0.53 | 0.55 | 0.53 | 0.52 |
| Forestland VC-50% | 14.35 | 14.32 | 14.15 | 14.40 | −0.03 | −0.17 | 0.25 | 0.05 | ||||
| Grassland VC + 50% | 20.77 | 21.06 | 20.61 | 20.81 | 0.29 | −0.45 | 0.21 | 0.04 | 0.13 | 0.13 | 0.14 | 0.14 |
| Grassland VC + 50% | 18.27 | 18.57 | 17.97 | 18.00 | 0.30 | −0.60 | 0.04 | −0.27 | ||||
| Water VC + 50% | 20.25 | 20.55 | 20.11 | 20.55 | 0.30 | −0.44 | 0.43 | 0.30 | 0.07 | 0.07 | 0.09 | 0.12 |
| Water VC-50% | 18.79 | 19.09 | 18.46 | 18.27 | 0.30 | −0.63 | −0.19 | −0.52 | ||||
| Unused land VC + 50% | 19.52 | 19.82 | 19.29 | 19.41 | 0.30 | −0.53 | 0.12 | −0.11 | 0.0005 | 0.0005 | 0.001 | 0.001 |
| Unused land VC-50% | 19.52 | 19.82 | 19.29 | 19.41 | 0.30 | −0.53 | 0.12 | −0.11 | ||||
Publisher’s Note: MDPI stays neutral with regard to jurisdictional claims in published maps and institutional affiliations. |
© 2022 by the authors. Licensee MDPI, Basel, Switzerland. This article is an open access article distributed under the terms and conditions of the Creative Commons Attribution (CC BY) license (https://creativecommons.org/licenses/by/4.0/).
Share and Cite
Li, L.; Li, Y.; Yang, L.; Liang, Y.; Zhao, W.; Chen, G. How Does Topography Affect the Value of Ecosystem Services? An Empirical Study from the Qihe Watershed. Int. J. Environ. Res. Public Health 2022, 19, 11958. https://doi.org/10.3390/ijerph191911958
Li L, Li Y, Yang L, Liang Y, Zhao W, Chen G. How Does Topography Affect the Value of Ecosystem Services? An Empirical Study from the Qihe Watershed. International Journal of Environmental Research and Public Health. 2022; 19(19):11958. https://doi.org/10.3390/ijerph191911958
Chicago/Turabian StyleLi, Li, Yonghui Li, Lan Yang, Ying Liang, Wenliang Zhao, and Guanyu Chen. 2022. "How Does Topography Affect the Value of Ecosystem Services? An Empirical Study from the Qihe Watershed" International Journal of Environmental Research and Public Health 19, no. 19: 11958. https://doi.org/10.3390/ijerph191911958